Molten globule-like state of human serum albumin at low pH Salman Muzammil, Yogesh Kumar and Saad Tayyab Interdisciplinary Biotechnology Unit, Aligarh Muslim University, India Human serum albumin (HSA), under conditions of low pH, is known to exist in two isomeric forms, the F form at around pH 4.0 and the E form below 3.0. We studied its conformation in the acid-denatured E form using far-UV and near-UV CD, binding of a hydrophobic probe, 1-anilinonaphthalene-8-sulfonic acid (ANS), thermal transition by far-UV and near-UV CD, tryptophan fluorescence, quenching of tryptophan fluorescence using a neutral quencher, acrylamide and viscosity measurements. The results show that HSA at pH 2.0 is characterized by a significant amount of secondary structure, as evident from far-UV CD spectra. The near-UV CD spectra showed a profound loss of tertiary structure. A marked increase in ANS fluorescence signified extensive solvent exposure of non-polar clusters. The temperature-dependence of both near-UV and far-UV CD signals did not exhibit a co-operative thermal transition. The intrinsic fluorescence and acrylamide quenching of the lone tryptophan residue, Trp214, showed that, in the acid-denatured state, it is buried in the interior in a non-polar environment. Intrinsic viscosity measurements showed that the acid-denatured state is relatively compact compared with that of the denatured state in 7 m guanidine hydrochloride. These results suggest that HSA at pH 2.0 represents the molten globule state, which has been shown previously for a number of proteins under mild denaturing conditions. Keywords: acid denaturation; human serum albumin (HSA); molten globule; pH. Folding of a protein from a structureless denatured state to an ordered biologically active native state is considered to be a highly complex process because of the lack of information about the folding intermediates formed in the folding pathway. This process is even more complex for multidomain proteins, in which each domain may be capable of refolding independently [1]. Keeping in view information on the formation of the native biologically functional structure in the primary sequence [2,3], previous studies have aimed to increase our understanding of the denatured state of proteins [4] and the role of segment– segment interactions and the interactions between the amino acid side chains with the surrounding medium [5,6] and also to characterize the refolding intermediates [7–9]. The process of protein folding from a denatured state to its native state depends on the type of denatured state, as each method of denaturation is considered to be a distinct process yielding different products [4,10]. It has been shown in several cases that denatured proteins contain some residual structure and therefore are not completely unfolded [11,12]. A comparison of different methods of denaturation showed that the most completely unfolded form can be obtained in either 9 m urea or 6 m guanidine hydrochloride (GdnHCl) [10]. On the other hand, acid denaturation of some proteins results in a denatured state that is often less unfolded than the completely unfolded form obtained in high concentrations of urea and GdnHCl, far from a random coil [4,13,14]. In acid denaturation, the major driving force for unfolding is intramolecular charge repulsion which may fail to overcome interactions that favour folding, such as hydrophobic forces, disulfide bonds, salt bridges and metal ion protein interactions [15]. The exact folding mechanism of a given protein at low pH is a complex interplay between a variety of stabilizing and destabilizing forces. In many cases, the acid-denatured form has been found to represent the ‘molten globule’ state which is assumed to be a major intermediate in protein folding [6,15–18]. The traditional definition of a molten globule state is a compact denatured state with a significant amount of secondary structure but largely disordered tertiary structure [6,12,19]. Characterization of a molten globule state is helpful in identifying the other transition states believed to be located between the molten globule and the native state and the molten globule and the denatured state [20–22]. Serum albumin has been used as a model protein for protein folding and ligand-binding studies over many decades. It contains three structural domains in a single polypeptide chain of 585 amino acids. In acidic medium, it undergoes a conformational transition that is quite different from that of other well-known proteins [23], producing two isomeric forms, the F form at around pH 4.0 and the E form below pH 3.0 [24]. Many studies have been directed towards characterization of the F form [25,26], but limited attempts have been made to characterize the E form. We have here studied the properties of the acid-denatured E form of HSA by near-UV and far-UV CD, tryptophan fluorescence, 1-anilinonaphthalene-8-sulfonic acid (ANS) fluorescence, viscosity measurements, temperature transition, and acrylamide quenching of the tryptophan fluorescence. We found that the E form of HSA has characteristic properties of a molten globule. In this paper, we present a detailed analysis of the E state of HSA in terms of these spectroscopic and hydrodynamic properties. Eur. J. Biochem. 266, 26–32 (1999) q FEBS 1999 Correspondence to S. Tayyab, Interdisciplinary Biotechnology Unit, Aligarh Muslim University, Aligarh 202 002, India. Fax: + 91 571 401081, Tel.: + 91 571 401718. Abbreviations: HSA, human serum albumin; ANS, 1-anilinonaphthalene-8- sulfonic acid; NATA, N-acetyl-l-tryptophanamide. (Received 29 April 1999, accepted 24 August 1999)

Welcome message from author
This document is posted to help you gain knowledge. Please leave a comment to let me know what you think about it! Share it to your friends and learn new things together.
Transcript
Molten globule-like state of human serum albumin at low pH
Salman Muzammil, Yogesh Kumar and Saad Tayyab
Interdisciplinary Biotechnology Unit, Aligarh Muslim University, India
Human serum albumin (HSA), under conditions of low pH, is known to exist in two isomeric forms, the F form at
around pH 4.0 and the E form below 3.0. We studied its conformation in the acid-denatured E form using far-UV
and near-UV CD, binding of a hydrophobic probe, 1-anilinonaphthalene-8-sulfonic acid (ANS), thermal
transition by far-UV and near-UV CD, tryptophan fluorescence, quenching of tryptophan fluorescence using a
neutral quencher, acrylamide and viscosity measurements. The results show that HSA at pH 2.0 is characterized
by a significant amount of secondary structure, as evident from far-UV CD spectra. The near-UV CD spectra
showed a profound loss of tertiary structure. A marked increase in ANS fluorescence signified extensive solvent
exposure of non-polar clusters. The temperature-dependence of both near-UV and far-UV CD signals did not
exhibit a co-operative thermal transition. The intrinsic fluorescence and acrylamide quenching of the lone
tryptophan residue, Trp214, showed that, in the acid-denatured state, it is buried in the interior in a non-polar
environment. Intrinsic viscosity measurements showed that the acid-denatured state is relatively compact
compared with that of the denatured state in 7 m guanidine hydrochloride. These results suggest that HSA at
pH 2.0 represents the molten globule state, which has been shown previously for a number of proteins under mild
denaturing conditions.
Keywords: acid denaturation; human serum albumin (HSA); molten globule; pH.
Folding of a protein from a structureless denatured state to anordered biologically active native state is considered to be ahighly complex process because of the lack of informationabout the folding intermediates formed in the folding pathway.This process is even more complex for multidomain proteins, inwhich each domain may be capable of refolding independently[1]. Keeping in view information on the formation of the nativebiologically functional structure in the primary sequence [2,3],previous studies have aimed to increase our understanding ofthe denatured state of proteins [4] and the role of segment±segment interactions and the interactions between the aminoacid side chains with the surrounding medium [5,6] and also tocharacterize the refolding intermediates [7±9]. The process ofprotein folding from a denatured state to its native state dependson the type of denatured state, as each method of denaturationis considered to be a distinct process yielding different products[4,10]. It has been shown in several cases that denaturedproteins contain some residual structure and therefore are notcompletely unfolded [11,12]. A comparison of differentmethods of denaturation showed that the most completelyunfolded form can be obtained in either 9 m urea or 6 mguanidine hydrochloride (GdnHCl) [10]. On the other hand,acid denaturation of some proteins results in a denatured statethat is often less unfolded than the completely unfolded formobtained in high concentrations of urea and GdnHCl, far from arandom coil [4,13,14]. In acid denaturation, the major driving
force for unfolding is intramolecular charge repulsion whichmay fail to overcome interactions that favour folding, such ashydrophobic forces, disulfide bonds, salt bridges and metal ionprotein interactions [15]. The exact folding mechanism of agiven protein at low pH is a complex interplay between avariety of stabilizing and destabilizing forces. In many cases,the acid-denatured form has been found to represent the`molten globule' state which is assumed to be a majorintermediate in protein folding [6,15±18]. The traditionaldefinition of a molten globule state is a compact denaturedstate with a significant amount of secondary structure butlargely disordered tertiary structure [6,12,19]. Characterizationof a molten globule state is helpful in identifying the othertransition states believed to be located between the moltenglobule and the native state and the molten globule and thedenatured state [20±22].
Serum albumin has been used as a model protein for proteinfolding and ligand-binding studies over many decades. Itcontains three structural domains in a single polypeptide chainof 585 amino acids. In acidic medium, it undergoes aconformational transition that is quite different from that ofother well-known proteins [23], producing two isomeric forms,the F form at around pH 4.0 and the E form below pH 3.0 [24].Many studies have been directed towards characterization ofthe F form [25,26], but limited attempts have been made tocharacterize the E form. We have here studied the properties ofthe acid-denatured E form of HSA by near-UV and far-UV CD,tryptophan fluorescence, 1-anilinonaphthalene-8-sulfonic acid(ANS) fluorescence, viscosity measurements, temperaturetransition, and acrylamide quenching of the tryptophanfluorescence. We found that the E form of HSA hascharacteristic properties of a molten globule. In this paper,we present a detailed analysis of the E state of HSA in terms ofthese spectroscopic and hydrodynamic properties.
Eur. J. Biochem. 266, 26±32 (1999) q FEBS 1999
Correspondence to S. Tayyab, Interdisciplinary Biotechnology Unit,
Aligarh Muslim University, Aligarh 202 002, India. Fax: + 91 571 401081,
Tel.: + 91 571 401718.
Abbreviations: HSA, human serum albumin; ANS, 1-anilinonaphthalene-8-
sulfonic acid; NATA, N-acetyl-l-tryptophanamide.
(Received 29 April 1999, accepted 24 August 1999)
q FEBS 1999 Molten globule-like state of HSA (Eur. J. Biochem. 266) 27
M A T E R I A L S A N D M E T H O D S
Materials
Essentially fatty acid-free HSA, type A-1887, ANS, typeA-3125, N-acetyl-l-tryptophanamide (NATA), type A-6501,and GdnHCl, type G-7153, were obtained from SigmaChemical Co. HSA was freed from dimers and oligomers bypassage through a Sephadex G-100 gel-filtration column. Allother chemicals used were of analytical grade.
Protein concentration was determined either spectrophoto-metrically using E1%
1cm of 5.30 at 280 nm [27] on a Cecil double-beam spectrophotometer, model CE 594, or by the method ofLowry et al. [28]. ANS concentration was also determinedspectrophotometrically using a molar absorption coefficient of5000 m21´cm21 at 350 nm [29].
CD measurements
CD measurements were recorded with a Jasco spectropolari-meter, model J-720, equipped with a microcomputer. Theinstrument was calibrated with D-10-camphorsulfonic acid. AllCD measurements were performed at 25 8C with a thermo-statically controlled cell holder attached to a NESLAB RTE-110waterbath (NESLAB Instruments, Inc., Newington, NH, USA)with an accuracy of ^ 0.1 8C. Spectra were collected with ascan speed of 20 nm´min21 and with a response time of 1 s.Each spectrum was the average of four scans. Far-UV CDspectra were recorded at a protein concentration of 1.8 mm witha 1-mm pathlength cell and the near-UV CD spectra weremeasured at 18 mm concentration with a 10-mm pathlengthcell. The results are expressed as mean residue ellipticity(MRE) in degrees´cm2´dmol21 which is defined as:
MRE � uobs �mdeg�/10 � n � l � Cp �1�where uobs is the CD in millidegrees, n is the number of aminoacid residues (585), l is the pathlength of the cell and Cp is themole fraction. The a-helical content of HSA was calculatedfrom the MRE value at 222 nm using the following equation asdescribed by Chen et al. [30]:
% helix � �MRE222 2 2340/30 300� � 100 �2�For temperature-transition studies, a water-jacketed 0.1-mmpathlength cell was used for far-UV CD and a water-jacketed10-mm pathlength cell was used for near-UV CD attached tothe RTE-110 waterbath interfaced with the microcomputer. Thesame protein solution (18 mm) was used in both near-UV andfar-UV CD measurements. Each reading at the desiredtemperature was recorded after an incubation time of 20 minat that temperature.
Fluorescence measurements
Fluorescence measurements were performed on a Shimadzuspectrofluorimeter, model RF-540, equipped with a datarecorder DR-3, or on an Hitachi spectrofluorimeter, model F2000. The fluorescence spectra were measured at a proteinconcentration of 1.8 mm with a 1-cm pathlength cell. Theexcitation and emission slits were set at 10 nm each. For ANSfluorescence in the ANS-binding experiments, the excitationwavelength was set at 380 nm and the emission spectra taken inthe range 400±600 nm or at a fixed wavelength of 470 nm.Intrinsic fluorescence was measured by exciting the proteinsolution at 280 nm, and emission spectra were taken in therange 300±400 nm with a protein concentration of 1.8 mm.
Acid unfolding of HSA
HSA solutions, of varying pH, were prepared by addingdifferent volumes of HCl/water mixtures of different concen-trations (pH values) to a protein stock solution (9 mm) such thatthe final volume in each tube was 5.0 mL. These tubes wereincubated for 30 min at 25 8C. pH measurements were made onan Elico pH-meter, model LI610, at 25 8C. The pH values ofthe samples were found to lie within 0.1 pH unit when takenbefore and after the CD and fluorescence measurements.
For ANS-binding studies, to a protein solution incubatedwith various concentrations of HCl, a concentrated stocksolution of ANS was added to obtain a final concentration of125 mm and 1.8 mm for ANS and protein, respectively.
Acrylamide quenching
In the acrylamide-quenching experiments, aliquots of 5 macrylamide stock solution were added to a protein stocksolution (15 mm) to achieve the desired acrylamide concen-tration. Excitation was set at 295 nm in order to excitetryptophan fluorescence only, and the emission spectrum wasrecorded in the range 300±400 nm. The slit width was set at10 nm for both excitation and emission. The decrease influorescence intensity at lmax was analysed according to theStern±Volmer equation [31]:
F0/F � 1� Ksv�Q� �3�where F0 and F are the fluorescence intensities at anappropriate wavelength in the absence and presence of aquencher (acrylamide), respectively, Ksv is the Stern±Volmerconstant for the collisional quenching process, and [Q] is theconcentration of the quencher.
Viscosity measurements
A calibrated Cannon±Fenske viscometer (Cannon InstrumentCo., State College, PA, USA) with a flow time of about 400 sfor distilled water at 25 8C was used. The time of fall wasrecorded with a stop watch reading to 0.1 s. The temperature ofthe viscometer was maintained by dipping it in a glass tankfilled with distilled water and attached to a water bath whichmaintained the temperature within ^ 0.1 8C. The reducedviscosity of a protein is defined as [23]:
hred ��t ÿ t0�
t0
� �1 2 v2P0�P0
�4�
where t0 is the time of fall of the solvent, t is the time of fall ofthe protein solution, c is the concentration in g´mL21, v2 ispartial specific volume of protein, and P0 is the density ofthe solvent. v2 was taken to be 0.734 [32]. Intrinsic viscositywas obtained by linear extrapolation, by the method of leastsquares, of reduced viscosity to zero protein concentration. Theviscosity measurements were made at four different concen-trations ranging from 2 to 8 mg´mL21.
R E S U L T S A N D D I S C U S S I O N
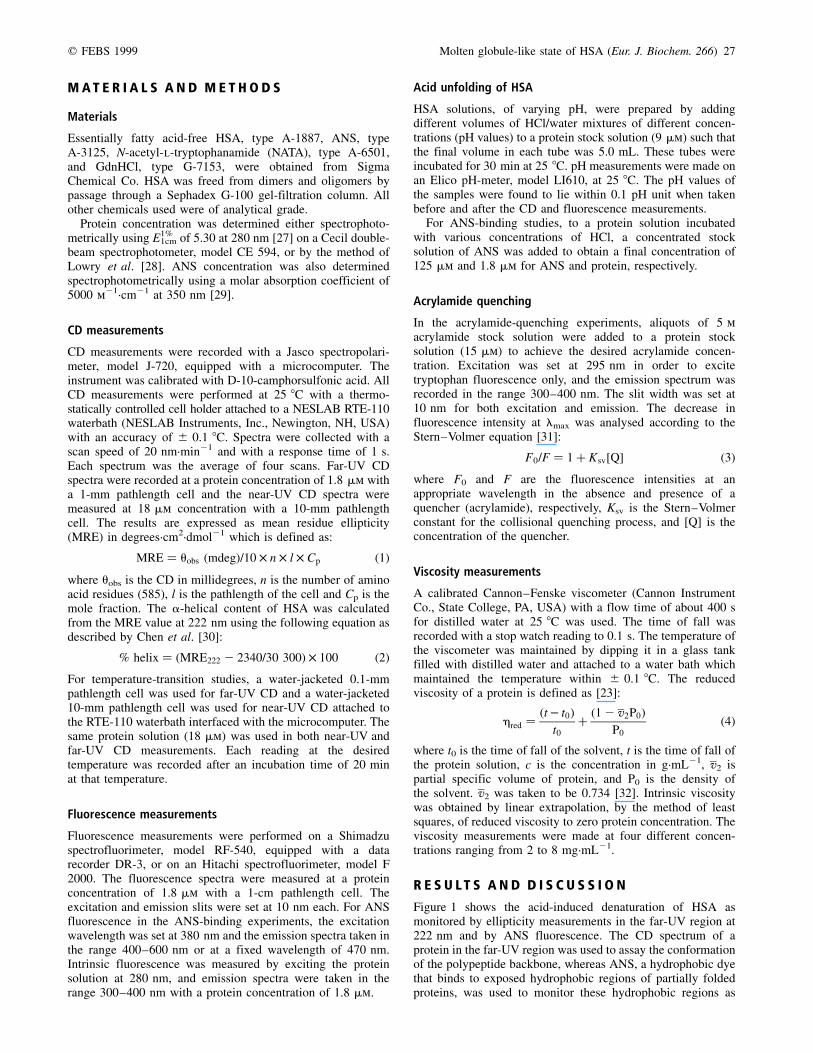
Figure 1 shows the acid-induced denaturation of HSA asmonitored by ellipticity measurements in the far-UV region at222 nm and by ANS fluorescence. The CD spectrum of aprotein in the far-UV region was used to assay the conformationof the polypeptide backbone, whereas ANS, a hydrophobic dyethat binds to exposed hydrophobic regions of partially foldedproteins, was used to monitor these hydrophobic regions as
28 S. Muzammil et al. (Eur. J. Biochem. 266) q FEBS 1999
described previously [33,34]. The ellipticity measurements at222 nm showed no apparent change between pH 6.5 and 4.0,but when the pH was decreased below 4.0, the ellipticitydecreased markedly to a minimum value at around pH 2.1 andremained unchanged down to pH 1.8. A further decrease in thepH below 1.8 resulted in a second transition, corresponding tothe formation of secondary structure, which in turn tailed off atpH 1.3. In the first transition, only 30% loss of secondarystructure took place, calculated on the basis of the difference inellipticity at 222 nm between the native and the denatured statein 7 m GdnHCl taken to be 100%. However, in the secondtransition, 7% of the secondary structure re-formed. When theeffect of pH was assessed by ANS fluorescence, a gradualincrease in fluorescence intensity was observed on decreasingthe pH below 5.0, reaching a maximum at around pH 2.5,whereas no change in ANS fluorescence was observed in thepH range 6.8±5.0. A further decrease to below 2.0 led to agradual decrease in the ANS fluorescence which tailed off atpH 1.1. In addition to this, emission maxima showed a red shift
from 470 nm to 480 nm on decreasing the pH from 4.5 to 2.5,which remained constant up to pH 2.0 and decreased to 474 nmon decreasing the pH below 2.0. The observed red shift inemission maxima and increase in ANS fluorescence within thepH ranges 4.5±2.5 and 5.0±2.5, respectively, were indicative ofexposure of hydrophobic regions to the solvent. A decrease inellipticity at 222 nm within the pH range 4.0±2.1 suggested theloss of some secondary structure, making some hydrophobicregions available for ANS binding. Interestingly, below pH 2.0,another transition, characterized by the formation of secondarystructure indicated by the increase in ellipticity and decrease inANS binding as well as the blue shift, was observed which wascomplete at pH 1.1. The transition curves produced both byellipticity measurements at 222 nm and ANS fluorescenceshowed a co-operative transition with no apparent intermediatestate. These results are similar to those reported previously [35],which also indicated no intermediate state. These results alsosuggest that the protein's tertiary structure was more sensitiveto pH change than the secondary structure, as the transitionmonitored by ANS fluorescence started around pH 5.0 whereasthat assessed by ellipticity measurement at 222 nm startedaround pH 4.0. These data are in accordance with previousresults on acid-induced unfolding of HSA [35] in which moreunfolding was observed below pH 4.0 reaching a maximum atpH 2.1 and which was partially restored at pH values below 2.0.A shift in the point of transition observed in this study (< 4.0)from the native to the denatured state compared with the value(pH 5.0) observed previously [27] can be explained by salteffect [15], because, in the earlier study, transition was seen inthe presence of 0.2 m KCl [27]. Partial restoration of secondarystructure at pH 1.1, as observed by the increase in ellipticity,can be ascribed to the anion-induced folding [16], whichdecreased the number of hydrophobic patches resulting in lessbinding of ANS.
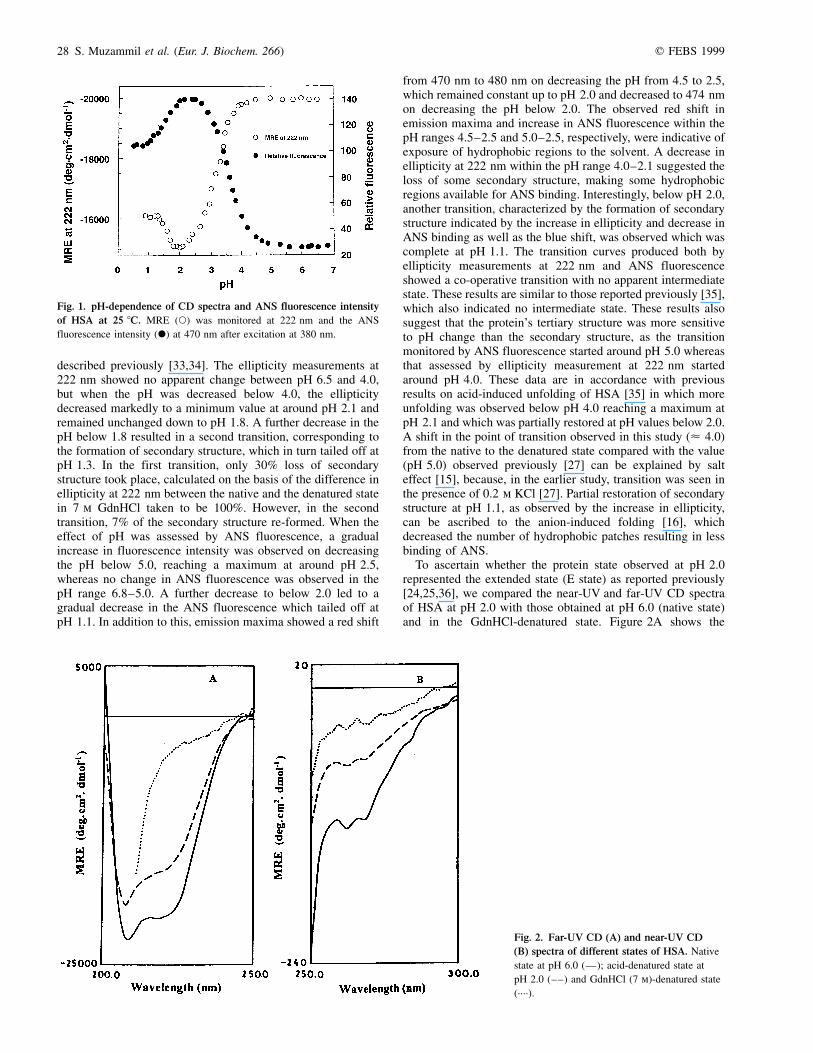
To ascertain whether the protein state observed at pH 2.0represented the extended state (E state) as reported previously[24,25,36], we compared the near-UV and far-UV CD spectraof HSA at pH 2.0 with those obtained at pH 6.0 (native state)and in the GdnHCl-denatured state. Figure 2A shows the
Fig. 2. Far-UV CD (A) and near-UV CD
(B) spectra of different states of HSA. Native
state at pH 6.0 (Ð); acid-denatured state at
pH 2.0 (± ±) and GdnHCl (7 m)-denatured state
(´´´´).
Fig. 1. pH-dependence of CD spectra and ANS fluorescence intensity
of HSA at 25 8C. MRE (W) was monitored at 222 nm and the ANS
fluorescence intensity (X) at 470 nm after excitation at 380 nm.
q FEBS 1999 Molten globule-like state of HSA (Eur. J. Biochem. 266) 29
far-UV CD spectra of HSA in the native state (pH 6.0), theacid-denatured state (pH 2.0) and the GdnHCl-denatured state(7 m) in which the protein is considered to exist in a randomcoil conformation [4]. The curve for the native state has twominima, one at 208 nm and the other at 222 nm, characteristicof a-helical structure. HSA in the native state contained around57% a-helical structure (Table 1) as determined from theellipticity value at 222 nm by the method of Chen et al. [30],which is in agreement with the values reported by other workers[37]. The curve for the acid-denatured state retained all theelements of secondary structure, although there was a decreasein the ellipticity value, indicating the loss of < 15% a-helicalstructure from the native state. HSA in the presence of 7 mGdnHCl lost all the elements of secondary structure, as canbe seen in Fig. 2A (see also Table 1). Figure 2B shows thenear-UV CD spectra in the 250±300 nm range for the nativestate (pH 6.0), the acid-denatured state (pH 2.0) and in 7 mGdnHCl. These spectra were used to probe the asymmetry ofthe protein's aromatic amino acid's environment. The near-UVCD spectra for the native state showed two minima at 262 nmand 268 nm and shoulders at 275 nm and 292 nm, charac-teristic of disulfide and aromatic chromophores [35]. In theacid-denatured state, there was a loss of signal and finestructure at 275 nm and 292 nm; nonetheless the proteinretained the two minima at 262 and 268 nm whereas in 7 mGdnHCl there was complete disappearance of all minima. Acomparison of near-UV and far-UV CD spectra of acid-denatured HSA with that of native and GdnHCl-denatured HSA(Table 1) shows that the acid-denatured form retained quite alot of secondary structure as well as a significant proportion oftertiary structure.
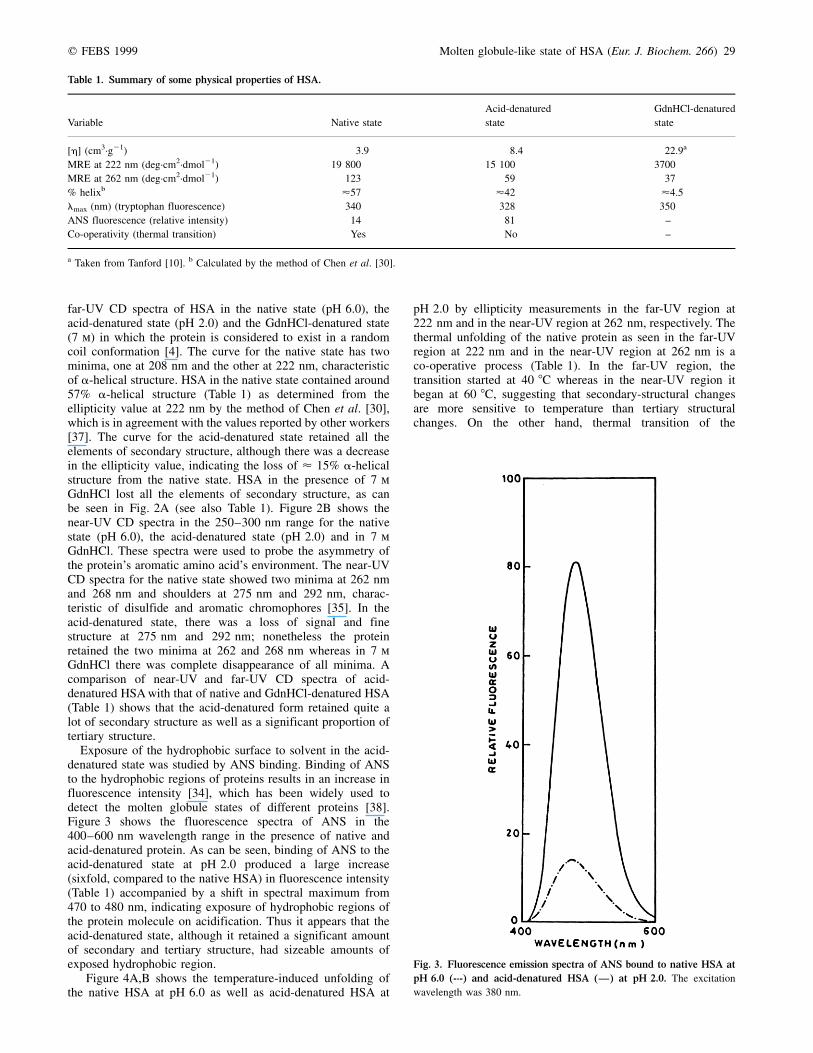
Exposure of the hydrophobic surface to solvent in the acid-denatured state was studied by ANS binding. Binding of ANSto the hydrophobic regions of proteins results in an increase influorescence intensity [34], which has been widely used todetect the molten globule states of different proteins [38].Figure 3 shows the fluorescence spectra of ANS in the400±600 nm wavelength range in the presence of native andacid-denatured protein. As can be seen, binding of ANS to theacid-denatured state at pH 2.0 produced a large increase(sixfold, compared to the native HSA) in fluorescence intensity(Table 1) accompanied by a shift in spectral maximum from470 to 480 nm, indicating exposure of hydrophobic regions ofthe protein molecule on acidification. Thus it appears that theacid-denatured state, although it retained a significant amountof secondary and tertiary structure, had sizeable amounts ofexposed hydrophobic region.
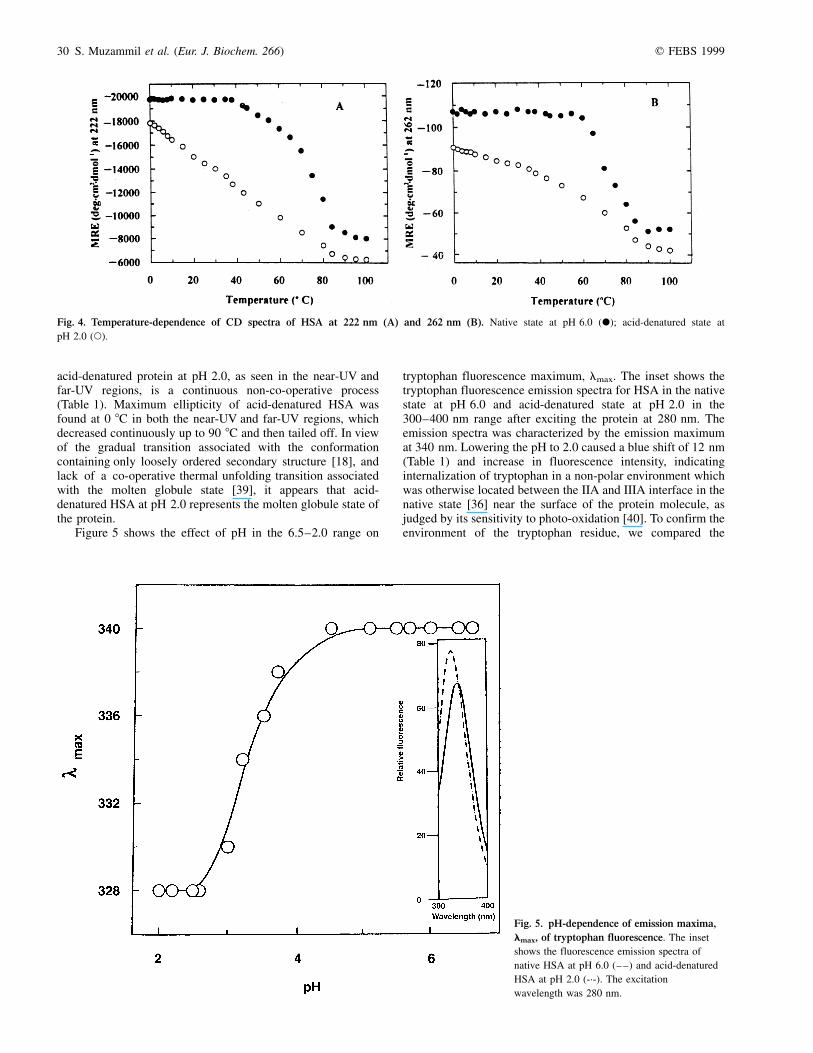
Figure 4A,B shows the temperature-induced unfolding ofthe native HSA at pH 6.0 as well as acid-denatured HSA at
pH 2.0 by ellipticity measurements in the far-UV region at222 nm and in the near-UV region at 262 nm, respectively. Thethermal unfolding of the native protein as seen in the far-UVregion at 222 nm and in the near-UV region at 262 nm is aco-operative process (Table 1). In the far-UV region, thetransition started at 40 8C whereas in the near-UV region itbegan at 60 8C, suggesting that secondary-structural changesare more sensitive to temperature than tertiary structuralchanges. On the other hand, thermal transition of the
Table 1. Summary of some physical properties of HSA.
Variable Native state
Acid-denatured
state
GdnHCl-denatured
state
[h] (cm3´g21) 3�.9 8�.4 22�.9a
MRE at 222 nm (deg´cm2´dmol21) 19 800� 15 100� 3700�
MRE at 262 nm (deg´cm2´dmol21) 123� 59� 37�
% helixb <57� <42� <4�.5
lmax (nm) (tryptophan fluorescence) 340� 328� 350�
ANS fluorescence (relative intensity) 14� 81� ±
Co-operativity (thermal transition) Yes No ±
a Taken from Tanford [10]. b Calculated by the method of Chen et al. [30].
Fig. 3. Fluorescence emission spectra of ANS bound to native HSA at
pH 6.0 (-´-) and acid-denatured HSA (Ð) at pH 2.0. The excitation
wavelength was 380 nm.
30 S. Muzammil et al. (Eur. J. Biochem. 266) q FEBS 1999
acid-denatured protein at pH 2.0, as seen in the near-UV andfar-UV regions, is a continuous non-co-operative process(Table 1). Maximum ellipticity of acid-denatured HSA wasfound at 0 8C in both the near-UV and far-UV regions, whichdecreased continuously up to 90 8C and then tailed off. In viewof the gradual transition associated with the conformationcontaining only loosely ordered secondary structure [18], andlack of a co-operative thermal unfolding transition associatedwith the molten globule state [39], it appears that acid-denatured HSA at pH 2.0 represents the molten globule state ofthe protein.
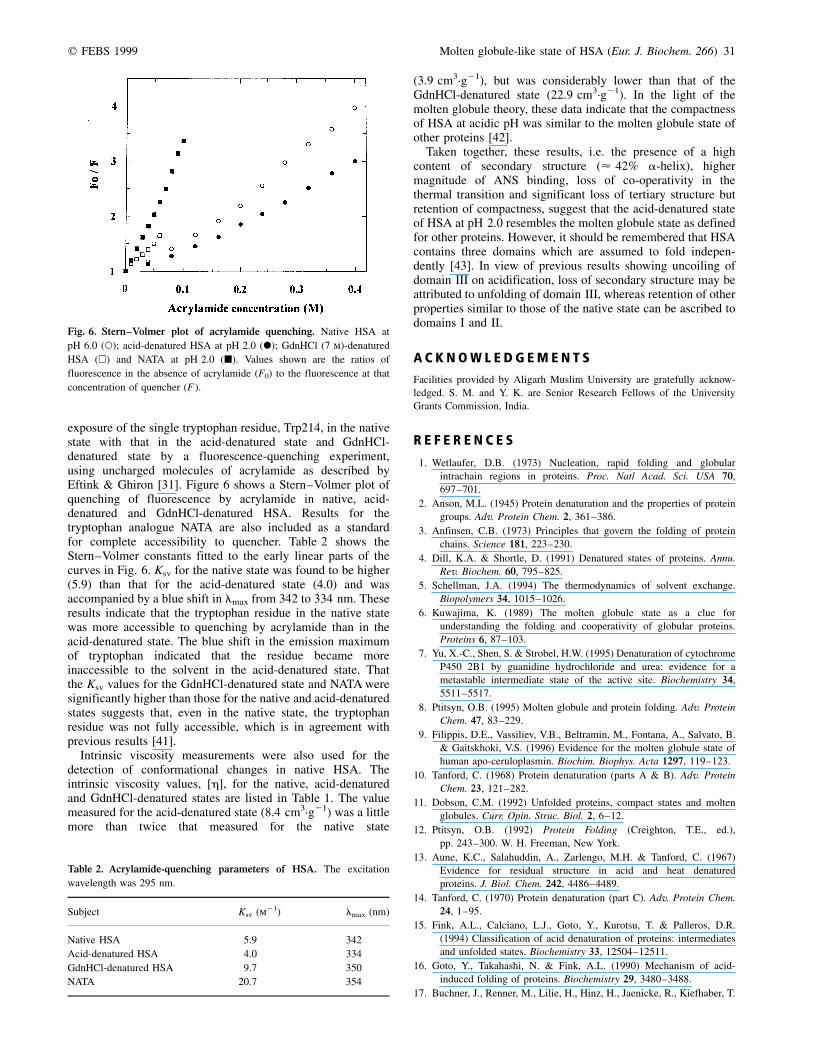
Figure 5 shows the effect of pH in the 6.5±2.0 range on
tryptophan fluorescence maximum, lmax. The inset shows thetryptophan fluorescence emission spectra for HSA in the nativestate at pH 6.0 and acid-denatured state at pH 2.0 in the300±400 nm range after exciting the protein at 280 nm. Theemission spectra was characterized by the emission maximumat 340 nm. Lowering the pH to 2.0 caused a blue shift of 12 nm(Table 1) and increase in fluorescence intensity, indicatinginternalization of tryptophan in a non-polar environment whichwas otherwise located between the IIA and IIIA interface in thenative state [36] near the surface of the protein molecule, asjudged by its sensitivity to photo-oxidation [40]. To confirm theenvironment of the tryptophan residue, we compared the
Fig. 4. Temperature-dependence of CD spectra of HSA at 222 nm (A) and 262 nm (B). Native state at pH 6.0 (X); acid-denatured state at
pH 2.0 (W).
Fig. 5. pH-dependence of emission maxima,
lmax, of tryptophan fluorescence. The inset
shows the fluorescence emission spectra of
native HSA at pH 6.0 (± ±) and acid-denatured
HSA at pH 2.0 (-´-). The excitation
wavelength was 280 nm.
q FEBS 1999 Molten globule-like state of HSA (Eur. J. Biochem. 266) 31
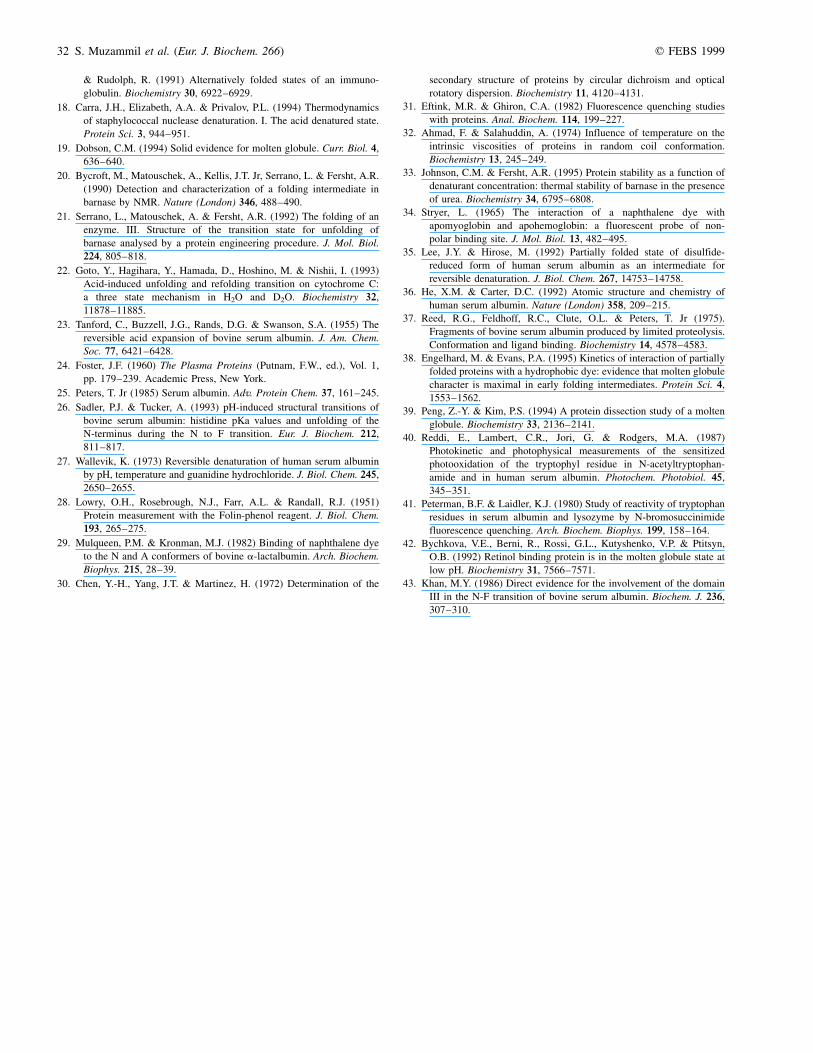
exposure of the single tryptophan residue, Trp214, in the nativestate with that in the acid-denatured state and GdnHCl-denatured state by a fluorescence-quenching experiment,using uncharged molecules of acrylamide as described byEftink & Ghiron [31]. Figure 6 shows a Stern±Volmer plot ofquenching of fluorescence by acrylamide in native, acid-denatured and GdnHCl-denatured HSA. Results for thetryptophan analogue NATA are also included as a standardfor complete accessibility to quencher. Table 2 shows theStern±Volmer constants fitted to the early linear parts of thecurves in Fig. 6. Ksv for the native state was found to be higher(5.9) than that for the acid-denatured state (4.0) and wasaccompanied by a blue shift in lmax from 342 to 334 nm. Theseresults indicate that the tryptophan residue in the native statewas more accessible to quenching by acrylamide than in theacid-denatured state. The blue shift in the emission maximumof tryptophan indicated that the residue became moreinaccessible to the solvent in the acid-denatured state. Thatthe Ksv values for the GdnHCl-denatured state and NATA weresignificantly higher than those for the native and acid-denaturedstates suggests that, even in the native state, the tryptophanresidue was not fully accessible, which is in agreement withprevious results [41].
Intrinsic viscosity measurements were also used for thedetection of conformational changes in native HSA. Theintrinsic viscosity values, [h], for the native, acid-denaturedand GdnHCl-denatured states are listed in Table 1. The valuemeasured for the acid-denatured state (8.4 cm3´g21) was a littlemore than twice that measured for the native state
(3.9 cm3´g21), but was considerably lower than that of theGdnHCl-denatured state (22.9 cm3´g21). In the light of themolten globule theory, these data indicate that the compactnessof HSA at acidic pH was similar to the molten globule state ofother proteins [42].
Taken together, these results, i.e. the presence of a highcontent of secondary structure (< 42% a-helix), highermagnitude of ANS binding, loss of co-operativity in thethermal transition and significant loss of tertiary structure butretention of compactness, suggest that the acid-denatured stateof HSA at pH 2.0 resembles the molten globule state as definedfor other proteins. However, it should be remembered that HSAcontains three domains which are assumed to fold indepen-dently [43]. In view of previous results showing uncoiling ofdomain III on acidification, loss of secondary structure may beattributed to unfolding of domain III, whereas retention of otherproperties similar to those of the native state can be ascribed todomains I and II.
A C K N O W L E D G E M E N T S
Facilities provided by Aligarh Muslim University are gratefully acknow-
ledged. S. M. and Y. K. are Senior Research Fellows of the University
Grants Commission, India.
R E F E R E N C E S
1. Wetlaufer, D.B. (1973) Nucleation, rapid folding and globular
intrachain regions in proteins. Proc. Natl Acad. Sci. USA 70,
697±701.
2. Anson, M.L. (1945) Protein denaturation and the properties of protein
groups. Adv. Protein Chem. 2, 361±386.
3. Anfinsen, C.B. (1973) Principles that govern the folding of protein
chains. Science 181, 223±230.
4. Dill, K.A. & Shortle, D. (1991) Denatured states of proteins. Annu.
Rev. Biochem. 60, 795±825.
5. Schellman, J.A. (1994) The thermodynamics of solvent exchange.
Biopolymers 34, 1015±1026.
6. Kuwajima, K. (1989) The molten globule state as a clue for
understanding the folding and cooperativity of globular proteins.
Proteins 6, 87±103.
7. Yu, X.-C., Shen, S. & Strobel, H.W. (1995) Denaturation of cytochrome
P450 2B1 by guanidine hydrochloride and urea: evidence for a
metastable intermediate state of the active site. Biochemistry 34,
5511±5517.
8. Ptitsyn, O.B. (1995) Molten globule and protein folding. Adv. Protein
Chem. 47, 83±229.
9. Filippis, D.E., Vassiliev, V.B., Beltramin, M., Fontana, A., Salvato, B.
& Gaitskhoki, V.S. (1996) Evidence for the molten globule state of
human apo-ceruloplasmin. Biochim. Biophys. Acta 1297, 119±123.
10. Tanford, C. (1968) Protein denaturation (parts A & B). Adv. Protein
Chem. 23, 121±282.
11. Dobson, C.M. (1992) Unfolded proteins, compact states and molten
globules. Curr. Opin. Struc. Biol. 2, 6±12.
12. Ptitsyn, O.B. (1992) Protein Folding (Creighton, T.E., ed.),
pp. 243±300. W. H. Freeman, New York.
13. Aune, K.C., Salahuddin, A., Zarlengo, M.H. & Tanford, C. (1967)
Evidence for residual structure in acid and heat denatured
proteins. J. Biol. Chem. 242, 4486±4489.
14. Tanford, C. (1970) Protein denaturation (part C). Adv. Protein Chem.
24, 1±95.
15. Fink, A.L., Calciano, L.J., Goto, Y., Kurotsu, T. & Palleros, D.R.
(1994) Classification of acid denaturation of proteins: intermediates
and unfolded states. Biochemistry 33, 12504±12511.
16. Goto, Y., Takahashi, N. & Fink, A.L. (1990) Mechanism of acid-
induced folding of proteins. Biochemistry 29, 3480±3488.
17. Buchner, J., Renner, M., Lilie, H., Hinz, H., Jaenicke, R., Kiefhaber, T.
Fig. 6. Stern±Volmer plot of acrylamide quenching. Native HSA at
pH 6.0 (W); acid-denatured HSA at pH 2.0 (X); GdnHCl (7 m)-denatured
HSA (A) and NATA at pH 2.0 (B). Values shown are the ratios of
fluorescence in the absence of acrylamide (F0) to the fluorescence at that
concentration of quencher (F ).
Table 2. Acrylamide-quenching parameters of HSA. The excitation
wavelength was 295 nm.
Subject Ksv (m21) lmax (nm)
Native HSA 5�.9 342
Acid-denatured HSA 4�.0 334
GdnHCl-denatured HSA 9�.7 350
NATA 20�.7 354
32 S. Muzammil et al. (Eur. J. Biochem. 266) q FEBS 1999
& Rudolph, R. (1991) Alternatively folded states of an immuno-
globulin. Biochemistry 30, 6922±6929.
18. Carra, J.H., Elizabeth, A.A. & Privalov, P.L. (1994) Thermodynamics
of staphylococcal nuclease denaturation. I. The acid denatured state.
Protein Sci. 3, 944±951.
19. Dobson, C.M. (1994) Solid evidence for molten globule. Curr. Biol. 4,
636±640.
20. Bycroft, M., Matouschek, A., Kellis, J.T. Jr, Serrano, L. & Fersht, A.R.
(1990) Detection and characterization of a folding intermediate in
barnase by NMR. Nature (London) 346, 488±490.
21. Serrano, L., Matouschek, A. & Fersht, A.R. (1992) The folding of an
enzyme. III. Structure of the transition state for unfolding of
barnase analysed by a protein engineering procedure. J. Mol. Biol.
224, 805±818.
22. Goto, Y., Hagihara, Y., Hamada, D., Hoshino, M. & Nishii, I. (1993)
Acid-induced unfolding and refolding transition on cytochrome C:
a three state mechanism in H2O and D2O. Biochemistry 32,
11878±11885.
23. Tanford, C., Buzzell, J.G., Rands, D.G. & Swanson, S.A. (1955) The
reversible acid expansion of bovine serum albumin. J. Am. Chem.
Soc. 77, 6421±6428.
24. Foster, J.F. (1960) The Plasma Proteins (Putnam, F.W., ed.), Vol. 1,
pp. 179±239. Academic Press, New York.
25. Peters, T. Jr (1985) Serum albumin. Adv. Protein Chem. 37, 161±245.
26. Sadler, P.J. & Tucker, A. (1993) pH-induced structural transitions of
bovine serum albumin: histidine pKa values and unfolding of the
N-terminus during the N to F transition. Eur. J. Biochem. 212,
811±817.
27. Wallevik, K. (1973) Reversible denaturation of human serum albumin
by pH, temperature and guanidine hydrochloride. J. Biol. Chem. 245,
2650±2655.
28. Lowry, O.H., Rosebrough, N.J., Farr, A.L. & Randall, R.J. (1951)
Protein measurement with the Folin-phenol reagent. J. Biol. Chem.
193, 265±275.
29. Mulqueen, P.M. & Kronman, M.J. (1982) Binding of naphthalene dye
to the N and A conformers of bovine a-lactalbumin. Arch. Biochem.
Biophys. 215, 28±39.
30. Chen, Y.-H., Yang, J.T. & Martinez, H. (1972) Determination of the
secondary structure of proteins by circular dichroism and optical
rotatory dispersion. Biochemistry 11, 4120±4131.
31. Eftink, M.R. & Ghiron, C.A. (1982) Fluorescence quenching studies
with proteins. Anal. Biochem. 114, 199±227.
32. Ahmad, F. & Salahuddin, A. (1974) Influence of temperature on the
intrinsic viscosities of proteins in random coil conformation.
Biochemistry 13, 245±249.
33. Johnson, C.M. & Fersht, A.R. (1995) Protein stability as a function of
denaturant concentration: thermal stability of barnase in the presence
of urea. Biochemistry 34, 6795±6808.
34. Stryer, L. (1965) The interaction of a naphthalene dye with
apomyoglobin and apohemoglobin: a fluorescent probe of non-
polar binding site. J. Mol. Biol. 13, 482±495.
35. Lee, J.Y. & Hirose, M. (1992) Partially folded state of disulfide-
reduced form of human serum albumin as an intermediate for
reversible denaturation. J. Biol. Chem. 267, 14753±14758.
36. He, X.M. & Carter, D.C. (1992) Atomic structure and chemistry of
human serum albumin. Nature (London) 358, 209±215.
37. Reed, R.G., Feldhoff, R.C., Clute, O.L. & Peters, T. Jr (1975).
Fragments of bovine serum albumin produced by limited proteolysis.
Conformation and ligand binding. Biochemistry 14, 4578±4583.
38. Engelhard, M. & Evans, P.A. (1995) Kinetics of interaction of partially
folded proteins with a hydrophobic dye: evidence that molten globule
character is maximal in early folding intermediates. Protein Sci. 4,
1553±1562.
39. Peng, Z.-Y. & Kim, P.S. (1994) A protein dissection study of a molten
globule. Biochemistry 33, 2136±2141.
40. Reddi, E., Lambert, C.R., Jori, G. & Rodgers, M.A. (1987)
Photokinetic and photophysical measurements of the sensitized
photooxidation of the tryptophyl residue in N-acetyltryptophan-
amide and in human serum albumin. Photochem. Photobiol. 45,
345±351.
41. Peterman, B.F. & Laidler, K.J. (1980) Study of reactivity of tryptophan
residues in serum albumin and lysozyme by N-bromosuccinimide
fluorescence quenching. Arch. Biochem. Biophys. 199, 158±164.
42. Bychkova, V.E., Berni, R., Rossi, G.L., Kutyshenko, V.P. & Ptitsyn,
O.B. (1992) Retinol binding protein is in the molten globule state at
low pH. Biochemistry 31, 7566±7571.
43. Khan, M.Y. (1986) Direct evidence for the involvement of the domain
III in the N-F transition of bovine serum albumin. Biochem. J. 236,
307±310.
Related Documents