MOLECULES AND MINDS: Optimizing Simulations for Chemistry Education experimental Introduction The following lesson plans are resource materials designed to provide teachers with a plan of action for integrating the Molecules and Minds chemistry simulations into their curriculum. All of the simulations model chemistry concepts that are informed by the kinetic molecular theory (KMT). The plan of action sequence is as follows: 1. Pre-test 2. Kinetic theory simulation lesson plan 3. Kinetic theory demonstration lesson plan 4. Diffusion simulation lesson plan 5. Diffusion demonstration lesson plan 6. Gas Laws simulation lesson plan 7. Gas Laws demonstration lesson plan 8. Phase change simulation lesson plan 9. Phase change laboratory activity plan 10. Post-test This packet contains Steps 2 - 9 in the sequence. This resource material is a guide for teacher use and teachers should feel free to exercise their professional judgment when deciding which aspects of these lessons they will integrate into their own lessons. All the lesson plans in this sequence were originally developed by Max von Euw, a chemistry teacher at the School for Democracy and Leadership in New York City. We thank him for his thoughtful pedagogical analysis of the simulations. Suggested Sequence: Pretest/Surveys Day 1 Intro to the study Kinetic theory simulation Day 2 Kinetic theory demo/lab Day 3 Diffusion simulation Day 5 Diffusion demo/lab Day 5 Gas Laws simulation Day 6 Gas Laws demo/lab Day 7 Phase change simulation Day 8 Phase change demo/lab Posttest

Welcome message from author
This document is posted to help you gain knowledge. Please leave a comment to let me know what you think about it! Share it to your friends and learn new things together.
Transcript

MOLECULES AND MINDS: Optimizing Simulations for Chemistry Education
experimental
Introduction
The following lesson plans are resource materials designed to provide teachers with a plan of action for integrating the Molecules and Minds chemistry simulations into their curriculum. All of the simulations model chemistry concepts that are informed by the kinetic molecular theory (KMT). The plan of action sequence is as follows:
1. Pre-test 2. Kinetic theory simulation lesson plan 3. Kinetic theory demonstration lesson plan 4. Diffusion simulation lesson plan 5. Diffusion demonstration lesson plan 6. Gas Laws simulation lesson plan 7. Gas Laws demonstration lesson plan 8. Phase change simulation lesson plan 9. Phase change laboratory activity plan 10. Post-test
This packet contains Steps 2 - 9 in the sequence. This resource material is a guide for teacher use and teachers should feel free to exercise their professional judgment when deciding which aspects of these lessons they will integrate into their own lessons. All the lesson plans in this sequence were originally developed by Max von Euw, a chemistry teacher at the School for Democracy and Leadership in New York City. We thank him for his thoughtful pedagogical analysis of the simulations. Suggested Sequence:
Pretest/Surveys
Day 1
Intro to the study
Kinetic theory simulation
Day 2
Kinetic theory demo/lab
Day 3
Diffusion simulation
Day 5
Diffusion demo/lab
Day 5
Gas Laws simulation
Day 6
Gas Laws demo/lab
Day 7
Phase change simulation
Day 8
Phase change demo/lab
Posttest

KINETIC THEORY: Simulation worksheet
experimental
Name: ____________________ Date: _________________ Class: ___________
The Kinetic Theory Worksheet
Instructions: As you go through the simulation, please answer the following questions. This is individual work unless I say otherwise! All the answers are in the text and vocabulary list, so read everything carefully! This is to be finished by the end of class…it can be done! Vocabulary list:
Theory: an accepted statement about science that has been tested and peer reviewed many times and can be used to make predictions. Kinetic: this word means movement. Kinetic energy is energy that has to do with things moving. To examine: means to look at or study. Rigid: Solid, difficult to bend, not flexible. Pressure: The amount of force per area. If you are pushing against a wall, you are putting pressure on the wall. Internal Pressure: The amount of pressure inside a container. Gas molecules can push against the walls of a container. External Pressure: The amount of pressure put on the outside of a container. If you sit on a box, you put pressure on the box. Particles: All matter is made up of tiny particles. Think of them as tiny, round, hard balls. Variable: Something that varies or changes. Atmosphere: This is a unit of pressure represented by ‘atm’. Kelvin: This is a unit of temperature that scientist use represented by ‘K’. 298 K is about room temperature (= 25 degrees C).

KINETIC THEORY: Simulation worksheet
experimental
Questions to do BEFORE you mess with the simulation!! Screen 1 (5 min)
1. Who is the main character? _______________________
2. What is her issue or problem? _________________________________________
__________________________________________________________________
3. What does ‘kinetic’ mean? ____________________________________________
__________________________________________________________________
4. Give a real life example of a gas that is affected by the kinetic theory?
__________________________________________________________________
5. Do variables change or remain constant? ________________________________
6. List 2 variables that affect gas particle motion:
_______________________ __________________________
7. What are the 2 aims for this simulation?
Aim1:____________________________________________________________
_________________________________________________________________
Aim2:____________________________________________________________
_________________________________________________________________
Screen 2 (5 min) 8. What are the units of each property we are studying?
Property Unit
9. List two ways that you can change the temperature on the computer program ___________________________________________________________________

KINETIC THEORY: Simulation worksheet
experimental
Screen 3: The simulation (20 min) Things to do for the GRAPHING portion of the worksheet You need to graph at least 12 points for each graph, I’m going to start you off but you need to complete the rest!
Graph 1: lock the temperature at any temp you want. T = ______ K
Number of Particles
Internal Pressure (atmospheres)
10 11 12 13 14
Before you go on, please copy the graph you made onto this worksheet.

KINETIC THEORY: Simulation worksheet
experimental
Graph 2: lock the number of particles at any number you want. Number of particles = ______ particles.
Temperature (Kelvin)
Internal Pressure (atmospheres)
300 325 350 400 475
Before you go on, please copy the graph you made onto this worksheet.

KINETIC THEORY: Simulation worksheet
experimental
Graph summaries (circle the words in parentheses)
Graph 1: As I increased the number of particles, the internal pressure _______________.
This means the gas molecules pushed (harder / softer) against the walls of the container.
When I put more molecules into the container, they want to escape (more / less).
Graph 2: As I increased the temperature, the internal pressure ___________________.
This means the gas molecules pushed (harder / softer) against the walls of the container.
When I put more molecules into the container, they want to escape (more / less).
Please hit ‘DONE’ on the simulation, then fill out a quick survey and hit
‘SUBMIT’…you are almost finished!
The last part…bringing it all together
Screen 4 (10 min)
OH, USE COMPLETE SENTENCES THIS TIME…
1. How is the smell of the bathroom at Gabriella’s school or the scent of air
freshener like the moving particles in the program?
__________________________________________________________________
__________________________________________________________________
2. How is the bathroom like and not like the container in the program?
Like:_____________________________________________________________
Not Like: _________________________________________________________
3. Based on the kinetic theory, would Gabriella smell the bathroom faster than the
first time described in the program if the temperature was higher? _________
Why or why not? ___________________________________________________
__________________________________________________________________
NOW HIT ‘DONE” AND YOU ARE…DONE! Thanks!

KINETIC THEORY: Simulation worksheet
experimental
If you still have time (a little added bonus): Log back into the program and set a particle number and temperature. Then click on
the ‘Trail’ and ‘Color’ button. Watch the one particle.
Does it move in a specific pattern? _______
Would you say the gas particle has a random motion? _______
If you increase the temperature, does that particle move faster or slower? _________
Homework: Conversions 200 hm = _________ m 5000 mm = _________ dm 100 cm = _________ km
5.5 g = _________ mg 200 kg = __________ g 50 mg = _________ g
km hm dam m dm cm mm kg hg dag g dg cg mg

KINETIC THEORY: Demo/Lab
experimental
Day 2 Lesson Plan: Kinetic Molecular Theory
Aim: What is the Kinetic Theory and how do we know the simulation was true? Agenda:
• Do Now – 7 min • Thoughts on the Simulation – 5 min • Gases – KMT – lecture/notes – 15 min • What is pressure? – 10 min • Demos – balloon and temp / can and water – 10 minutes • What’s next??? (diffusion) – 5 minutes
Simulation feedback…what was the most confusing thing? What worked…any improvements I can make on the handout? Kinetic Molecular Theory: Describes the behavior of gases. The variables involved are pressure, volume, temperature, and # of particles, size of particles. Gases contain particles that are in straight, random motion Gases particles collide with each other and the wall…these collisions are elastic (not like a tennis ball) Gas particles are spread out, so they don’t take up space. Gas particles are not attracted to each other
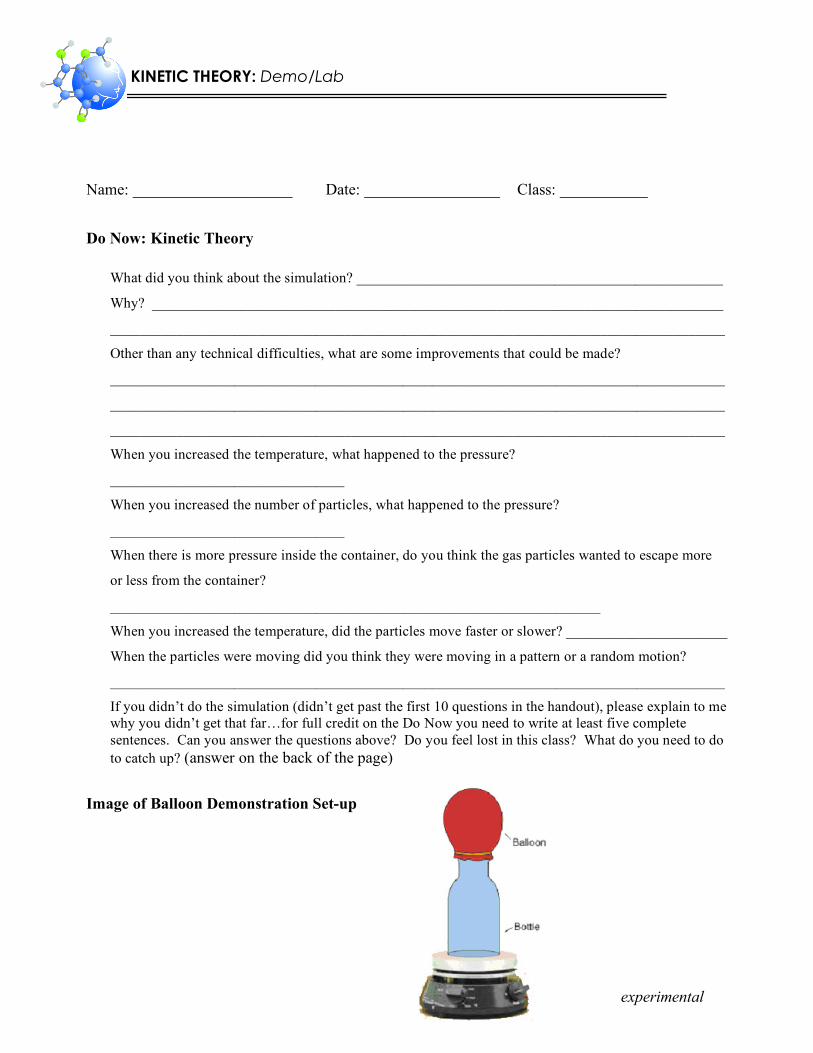
Demonstration: Balloon and flask on hot plate
What is pressure? Pressure is the amount of force applied over a surface. To apply pressure on a wound; to apply pressure on a wall; water pressure; Gas molecules can apply pressure on the walls of a container. Shake up a coke bottle…the bottle becomes harder because you’ve increased the pressure inside the bottle. How? Internal vs. External Pressure Pressure is measured in atmospheres (atm) The simulation…As you increased the temperature, the pressure went up. As you increased the number of particles, the pressure went up. If the pressure of the gas increases, would it push harder or softer against the walls. Balloon increase temperature, # of particles is locked (or constant), what happens to the pressure inside the balloon? What keeps the bottle’s shape? Why does an empty bottle not completely crumple up?
Diffusion has to do with injecting a gas into a container and seeing how long it takes to spread out.
KINETIC THEORY: Demo/Lab
experimental
Name: ____________________ Date: _________________ Class: ___________ Do Now: Kinetic Theory
What did you think about the simulation? __________________________________________________
Why? ______________________________________________________________________________
____________________________________________________________________________________
Other than any technical difficulties, what are some improvements that could be made?
____________________________________________________________________________________
____________________________________________________________________________________
____________________________________________________________________________________
When you increased the temperature, what happened to the pressure?
________________________________
When you increased the number of particles, what happened to the pressure?
________________________________
When there is more pressure inside the container, do you think the gas particles wanted to escape more
or less from the container?
___________________________________________________________________
When you increased the temperature, did the particles move faster or slower? ______________________
When the particles were moving did you think they were moving in a pattern or a random motion?
____________________________________________________________________________________
If you didn’t do the simulation (didn’t get past the first 10 questions in the handout), please explain to me why you didn’t get that far…for full credit on the Do Now you need to write at least five complete sentences. Can you answer the questions above? Do you feel lost in this class? What do you need to do to catch up? (answer on the back of the page)
Image of Balloon Demonstration Set-up

DIFFUSION: Simulation worksheet
experimental
Name: ____________________ Date: _________________ Class: ___________
Diffusion worksheet
Vocabulary list:
Helium: A type of gas. It is a very light gas and when you inhale it, your voice changes pitch. Argon: A type of gas. It is a heavy gas. Neon: A type of gas. It is heavier than helium, but lighter than argon. amu: This stands for atomic mass unit. It is the unit for the mass of atoms.
Screen 1 (5 min)
1. Who is Gabriella’s brother?
_____________________________________________________________
2. How did Gabriella know that he was making a snack?
______________________________________
3. What 2 variables affect diffusion? __________________ and _________________
4. What are we trying to figure out by using this program?
__________________________________________________________________________
__________________________________________________________________________
__________________________________________________________________________

DIFFUSION: Simulation worksheet
experimental
Screen 2 (5 min)
1. What are the units for temperature? (What do we measure temperature in?)
_______________________
2. What is atomic mass measured in? (What are the units of atomic mass)?
________________________
3. What are the 2 gases we are injecting into the chamber? __________________ and
_______________
4. Which gas is heavier? ____________________
5. How do you inject atoms (particles) into the chamber? (What button do you have to click?)
__________________________________________________________________________
__________________________________________________________________________

DIFFUSION: Simulation worksheet
experimental
Screen 3: The computer simulation (20 min)
What color are:
the helium particles? ________ the argon particles? ________ the neon particles? _______
To figure out how the temperature affects diffusion, please fill out the following tables:
Gas: Helium or Argon (circle the one you have chosen to test )
Temperature (K)
Time 1 (s) Time 2 (s) Time 3 (s) Average Time (s)
350
550 Before you go on, please copy the graph from the computer program onto this worksheet.

DIFFUSION: Simulation worksheet
experimental
Please repeat the process for the other gas:
Gas: Helium or Argon (circle one)
Temperature
(K) Time 1 (s) Time 2 (s) Time 3 (s) Average
Time (s) 350
550 Before you go on, please copy the graph from the computer program onto this worksheet.

DIFFUSION: Simulation worksheet
experimental
To figure out how the mass affects diffusion, please complete the following graph by plotting the averages you calculated for Helium and Argon. Use 2 different symbols for the helium and for the argon gas. You should have 2 dots for each Temperature. Argon Helium
When you have finished graphing, please hit ‘DONE’ on the simulation,
then fill out a quick survey and hit ‘SUBMIT’…you are almost finished!

DIFFUSION: Simulation worksheet
experimental
Bringing it all together
Screen 4 (10 min)
1. How is the popcorn odor Gabriella could smell as she entered the apartment like the atoms
you injected into the container in the program?
__________________________________________________________________________
__________________________________________________________________________
__________________________________________________________________________
__________________________________________________________________________
________________________________________________________________
2. How is Gabriella’s apartment like the container in the program?
__________________________________________________________________________
__________________________________________________________________________
__________________________________________________________________________
________________________________________________
3. How is the air in the apartment like the neon gas in the program?
__________________________________________________________________________
__________________________________________________________________________
__________________________________________________________________________
______________________________
Please hit ‘DONE’…thank you

DIFFUSION: Simulation worksheet
experimental
Diffusion summary (5 min) Circle one of the words in parentheses:
1. As the temperature increased, it took the molecules (less / more) time to reach the detector.
2. As the temperature increased, the gas particles moved (faster / slower).
3. As the mass of the gas increased, it took the molecules (less / more) time to reach the
detector.
4. As the mass of the gas increased, the gas particles moved (faster / slower).
5. Why do you think we took 3 measurements for each gas and then used the average? Why
weren’t the times always the same if the settings (temperature and type of gas) were the
same? (We learned this yesterday…it has to do with the KMT).
__________________________________________________________________________
__________________________________________________________________________
__________________________________________________________________________
__________________________________________________________________________
__________________________________________________________________________

DIFFUSION: Demo/Lab
experimental
Day 4 Lesson Plan: Diffusion
Aim: What is diffusion and what are some of the conditions where we can observe it? Agenda:
• Do Now –10 min • Diffusion: Definition, lecture/notes – 15 minutes • Connection to the simulation, calculation – 15 minutes • Demo: Diffusion of food coloring in hot and cold water – 10 minutes • Homework: Write me a story/comic
Diffusion: describes how one gas or liquid spreads through another gas or liquid. It depends on the mass (or size) of the particles and the temperature. If the particles are small, they travel fast. If the particles are big, they travel slowly. If the temperature is hot, they travel fast. If the temperature is cold, they travel slowly Question: How is the diffusion we studied similar and different from the diffusion we learned in living environment (biology)?
Similar: traveling through another solution Different: Energy requirements
Simulation Question:
How come each gas didn’t always take the same amount of time to reach the detector? Calculation: Graham’s law of diffusion The heavier the particle, the slower it traveled Graham worked out that the rate at which the particles spread out is inversely proportional to the square root of the molecular weight. We can write his law as a mathematical equation that should "fit" with the results you got from the simulation: RateHe/RateAr = √39 (mass of Argon)/√4 (mass of Helium) So what might we predict about the rate of Argon when compared with the rate of Helium? How do the results you recorded from the simulation compare with your prediction? Students can check their results.
How do we know the simulation is true? One way we can do it is the way we did in 3 –
seeing whether it can be used to make a prediction. But we can also see how it works with our experiences in our lives.
You see diffusion everyday but perhaps not in the same form as the gases you studied in the simulation. We can describe a gas as a fluid. Are there any other fluids you use that also show diffusion?
Student feedback about where they might observe diffusion e.g. tea, coffee, cocoa, sugar

DIFFUSION: Demo/Lab
experimental
Demonstration/Student Activity: Diffusion in liquid (another fluid) and the effect of
temperature
1. Heat beaker of water on hotplate
2. Also get the same amount of cold water in another beaker of the same size
3. Have a couple of student volunteers (one for hot and one for cold) with stopwatches to record the rate of diffusion
4. Have a couple of students (one for the hot water and one for the cold) add one drop
of food coloring
5. The student recorders should record how long it takes for the food coloring to diffuse throughout the water. (When this was done the first time the hot beaker was left on the hot plate and was boiling and one of the students suggested that it was the boiling which was helping the color to diffuse in the hot water. So then I took a second beaker of boiling water off the hot plate and repeated the test in hot water that was still rather than moving[A teachable moment!])
6. Discussion about gases and liquids and diffusion and the effect of temperature and
mass on the rate (Would Gabriella and her friends be able to smell the bathroom more quickly on a hot summer's day than a cold winter's day?)
7. So how good is that simulation!?

DIFFUSION: Demo/Lab
experimental
Name: ____________________ Date: _________________ Class: ___________
Do Now: Diffusion
What 3 gases did we mess with (use) in the diffusion simulation? ____________ __________
______________
Which one was already in the container before you injected the other gas?
_________________________
Which gas moved the fastest? _____________________
Why did that gas move faster than the others? ____________________
What is the definition of diffusion?
_____________________________________________________________
_____________________________________________________________________________
_____________
Do you have any feedback about the diffusion simulation? (you have to write something!)
_____________________________________________________________________________
_____________________________________________________________________________
_____________________________________________________________________________
_____________________________________________________________________________
Diagram of Diffusion Demonstration Set-up

DIFFUSION: Demo/Lab
experimental
Homework: Diffusion Write me a story or a comic book You are going to pretend that you are a gas particle that has been injected into a closed box. I want you to describe your thoughts as a particle inside this box. To complete this task you need the following terms: Straight, random motion Elastic collisions Attraction toward other gas particles Your speed compared to other particles Your mass/size What happens when the temperature increases. Your story needs to be at least 1 page long; if you choose to do a comic book it needs to be 15-20 frames long!

GAS LAWS: Simulation worksheet
experimental
Name: ____________________ Date: _________________ Class: ___________
Gas Laws Worksheet (Charles’, Boyle’s, and The Combined)
Screen 1 (5 minutes): Gabriella's Challenge What was the temperature in the morning? ___________________________
What was the temperature like the night before? _______________________
What three variables do the gas laws examine? __________________________________________
_______________
Screen 2 (5 to 10 minutes) How to Use the Gas Laws program
Variable Unit (what it is measured in)
Comparison
List the 2 ways you can adjust each variable (they are the same for each variable):
________________________________________________________________________________
________________________________________________________________________________
________________________________________________________________________________
What is the difference between INTERNAL and EXTERNAL pressure?
_______________________________________________________________________________
________________________________________________________________________________
________________________________________________________________________________
In this case, is internal pressure always going to be the same as external pressure?
________________________

GAS LAWS: Simulation worksheet
experimental
Screen 3: The simulation (15 minutes) We are going to study 2 of the famous gas laws: Boyle’s Law, which looks at the relationship between Pressure and Volume, and Charles’s Law, which looks at the relationship between Volume and Temperature. Look at the axis on each graph and tell me the independent variable, the dependent variable, and the constant. Boyle’s Law
Independent Variable Dependent Variable Constant (doesn’t change)
Charles’s Law
Independent Variable Dependent Variable Constant (doesn’t change)

GAS LAWS: Simulation worksheet
experimental
BOYLE’S LAW Lock the temperature between 300 K and 550 K: Temperature = _________ K Complete the following table and recopy the graph that is created while you are collecting data. YOU NEED TO COLLECT 15 POINTS; this should only take you a matter of minutes!
Label the axes and add a title!
As you increase the pressure, the volume ______________________
(increases or decreases) As you decrease the pressure, the volume _______________________
(increases or decreases)
We say that pressure and volume are inversely proportional.
PRESSURE (atm)
VOLUME (L)

GAS LAWS: Simulation worksheet
experimental
CHARLES’S LAW Lock the pressure between 0.5 atm and 10.00 atm: Pressure = _____________ atm Complete the following table and recopy the graph that is created while you are collecting data. YOU NEED TO COLLECT 15 POINTS; this should only take you a matter of minutes!
Label the axes and add a title!
As you increase the temperature, the volume _______________________
(increases or decreases) As you decrease the temperature, the volume _______________________
(increases or decreases)
We say that temperature and volume are directly proportional.
PLEASE HIT THE ‘DONE’ BUTTON on the computer – thank you
Temperature (K)
VOLUME (L)
300
.550

GAS LAWS: Simulation worksheet
experimental
Bringing it all together - Screen 4, Revisiting Gabriella's challenge (10 minutes)
How is the air in Gabriella's tires like the gas in the program?
________________________________________________________________________________
________________________________________________________________________________
________________________________________________________________________________
How are the tires like the closed container in the program?
________________________________________________________________________________
________________________________________________________________________________
________________________________________________________________________________
How is the warm and cool weather like turning the flame on and off?
________________________________________________________________________________
________________________________________________________________________________
________________________________________________________________________________
SUMMARY
As the day gets hotter, will a balloon increase in size or decrease? _________________
As temperature goes up, so does the _______________.
As you increase the pressure inside the balloon, the volume will ___________________.
Why did Gabriella’s tires look flat in the morning?
________________________________________________________________________________
________________________________________________________________________________
________________________________________________________________________________
Should she go buy new tires?
__________________________________________________________________

GAS LAWS: Simulation worksheet
experimental
What is the difference between the containers in the first 2 simulations and the container in this
simulation?
________________________________________________________________________________
________________________________________________________________________________
____________________
Which container is most similar to a balloon?
_____________________________________________________

GAS LAWS: Demo/Lab
experimental
Day 6 Lesson Plan: What have these simulations and the gas laws shown us? Aim: How are pressure, volume, and temperature related? Agenda:
• Do Now – 5 minutes • Pressure: Internal vs. external – 10 minutes • Gas Laws – Boyle’s and Charles’s Law – 15 minutes • Demo: Balloon in hot water – 5 minutes • Summary: Gases and how they behave – 15 minutes • Homework: Question on gas laws
Pressure: Internal vs. external (start boiling water)
Draw a balloon…arrows going in and out. When something isn’t moving, like a balloon, the pressure from the air all around us is equal to the amount the gas inside the balloon is pushing out. So let’s say I have a box that has a lid that slides up and down, if I apply pressure on the top and the lid stops sliding, that means that the gas inside the box is putting the same pressure on the inside to hold you there. So if you apply pressure on the top of the box, do you see why pressure is going up inside the box as well? If you apply external pressure, why doesn't the volume go to zero? What is holding it up? [no longer conforming to the Ideal Gas Law]
Demonstration Analogy
Use 8 volunteers…put them in a square. (4 inside [they are the gas molecules], 4 make the walls, I push them in) As the wall goes in what happens to the gas molecules? Do they like this?

GAS LAWS: Demo/Lab
experimental
The Gas Laws: Boyle’s and Charles’s Law
Boyle’s Law: Relates pressure and volume at constant temperature. Pressure – independent / Volume – dependent / Temperature – constant Demonstration: Squeeze a balloon…as I apply pressure to the outside of the balloon, what is happening to the volume of the balloon? What happens to the pressure inside the balloon? Why? (the gas molecules are hitting the walls quicker and it increases the pressure inside). Draw a graph similar to this:
Charles’s Law: Relates temperature and volume at constant pressure Temperature – independent / Volume – dependent / Pressure – constant Draw a graph similar to this: (perhaps the students can suggest what the graph might look like?)
Demonstration: Take the water that you have been heating and put it in a large container and then add a balloon that you have partly inflated (perhaps using a student helper or two to feel the balloon at various stages) and tied off. What happens to the internal pressure of the balloon when I put it in the hot water? What happens to the volume? Why? Excitement of particles.

GAS LAWS: Demo/Lab
experimental
Summary of Gas Laws and Simulations (Notes)
KINETIC MOLECULAR THEORY
DIFFUSION GAS LAWS
TEMP and PRESSURE PARTICLE # and PRESSURE
SIZE/MASS and TIME OF DIFFUSION TEMPERATURE and TIME OF DIFFUSION
PRESSURE and VOLUME TEMP and VOLUME
Examples: Boiling water and the lid popping off. Gas cylinder: chained down
Examples: tea in hot water, food coloring in hot water. Farting in a warm shower is smellier than one in a cold shower.
Examples: Balloon rising with temp. Cramming gases into a small container increases pressure.
Simulation narrative: Stinky bathroom
Simulation narrative: Popcorn smell
Simulation narrative: Bike tires in the cold and in the warm weather.
Demos: Heating and cooling balloon on flask
Demos: Food coloring in water
Demos: Balloon in hot and cold water

GAS LAWS: Demo/Lab
experimental
Name: ____________________ Date: _________________ Class: ___________ Do Now: Gas Laws
1. Using what you know about the Gas Laws from the simulation, label the axes on this graph. What does the graph tell you about the relationship between the variables on the graph? ______________________________________________________________________________
______________________________________________________________________________
Which property/factor is held constant? __________________________________
2. Using what you know about the Gas Laws from the simulation, label the axes on this graph. What does the graph tell you about the relationship between the variables on the graph? ______________________________________________________________________________
______________________________________________________________________________
Which property/factor is held constant? __________________________________
3. Why did Gabriella’s tires look flat in the COLD morning when they looked full during the
WARM night? ______________________________________________________________ Homework question: How can we use the gas laws to understand how a carbon dioxide fire extinguisher works?

PHASE CHANGE: Simulation worksheet
experimental
Name: ____________________ Date: _________________ Class: ___________
Phase Change Worksheet Concept of Variation during Phase Change: How are internal energy and Temperature Related?
Vocabulary list:
Manipulated: Changed, or modified
Chlorine: It is a molecule or substance that is always paired up, it looks like this: 00
Bromine: It is a molecule or substance that is always paired up. It has more mass and it is bigger than chlorine.
Iodine: It is a molecule or substance that is always paired up. It has more mass and it is bigger than bromine.
Screen 1 (5 minutes)
1. Explain, USING COMPLETE SENTENCES, why Gabriella is ‘beasting’ or ‘tripping’?
(Tell me why she is complaining).
__________________________________________________________________________
__________________________________________________________________________
__________________________________
2. Is heat matter or non-matter? _______________________
3. Heat is a type of _________________. (Think about what you need to run a mile).

PHASE CHANGE: Simulation worksheet
experimental
Screen 2 (5 minutes)
1. What 3 variables are we studying in this program? ______________ _________________
_______________
2. What are the units of heat? (What is heat measured in?) ___________________ (write out
the whole word).
3. What 3 molecules are we using in this simulation? _____________ _________________
________________
4. Which molecule has the smallest amount of mass? _______________________
5. Which molecule has the largest amount of mass? ________________________ Screen 3: The computer simulation (25 minutes)
Before you answer any of the questions, please turn on the heat and watch the molecules and the graph. Think about the definitions of the different phases of matter (solid, liquid, gas).
Chlorine (the “green” molecule)
1. What is the temperature before you turn on the flame? _______________ K and
__________________°C
2. What phase is the molecule in? _________________ (solid, liquid, or gas)
3. How many seconds does it take for the molecule to reach its boiling point? _________
seconds
4. What is the temperature when the molecule reaches its boiling point? ____________ K and
____________°C
5. How much heat was put into the container to make the liquid boil? ____________ Kj
6. What is happening to the molecules as the temperature on the graph stays the same?
__________________________________________________________________________
__________________________________________________________________________
PHASE CHANGE: Simulation worksheet
experimental
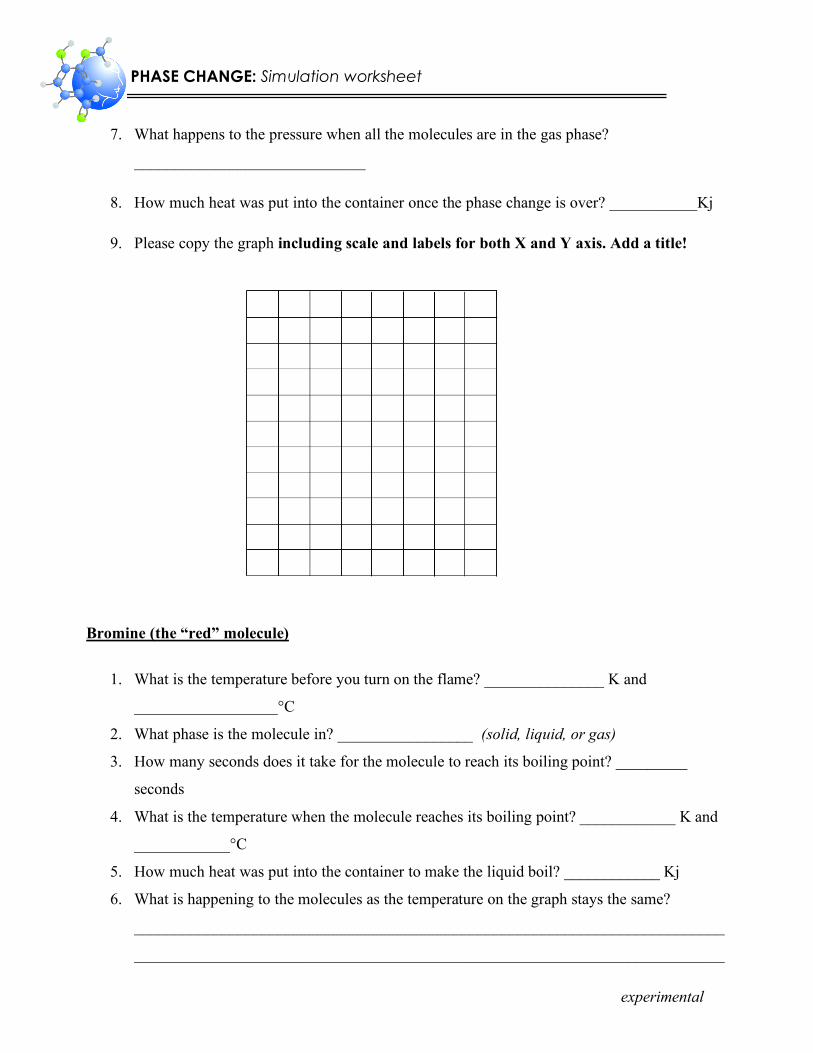
7. What happens to the pressure when all the molecules are in the gas phase?
_____________________________
8. How much heat was put into the container once the phase change is over? ___________Kj
9. Please copy the graph including scale and labels for both X and Y axis. Add a title!
Bromine (the “red” molecule)
1. What is the temperature before you turn on the flame? _______________ K and
__________________°C
2. What phase is the molecule in? _________________ (solid, liquid, or gas)
3. How many seconds does it take for the molecule to reach its boiling point? _________
seconds
4. What is the temperature when the molecule reaches its boiling point? ____________ K and
____________°C
5. How much heat was put into the container to make the liquid boil? ____________ Kj
6. What is happening to the molecules as the temperature on the graph stays the same?
__________________________________________________________________________
__________________________________________________________________________

PHASE CHANGE: Simulation worksheet
experimental
7. What happens to the pressure when all the molecules are in the gas phase? ___________________________
8. How much heat was put into the container once the phase change is over? _____________ Kj
9. Please copy the graph including scale and labels for both X and Y axis. Add a title!
Iodine (the “yellow” molecule)
1. What is the temperature before you turn on the flame? _______________ K and
__________________°C
2. What phase is the molecule in? _________________ (solid, liquid, or gas)
3. How many seconds does it take for the molecule to reach its boiling point? _________
seconds
4. What is the temperature when the molecule reaches its boiling point? ____________ K and
____________°C
5. How much heat was put into the container to make the liquid boil? ____________ Kj
6. What is happening to the molecules as the temperature on the graph stays the same?
__________________________________________________________________________
__________________________________________________________________________

PHASE CHANGE: Simulation worksheet
experimental
7. What happens to the pressure when all the molecules are in the gas phase? ____________________________
8. How much heat was put into the container once the phase change is over? ___________ Kj
9. Please copy the graph including scale and labels for both X and Y axis. Add a title!
Bringing it all together: Screen 4 (15 minutes)
1. Explain why there wasn't enough water in the saucepan for Gabriella to make hot chocolate
_____________________________________________________________________________
_____________________________________________________________________________
2. How is the water Tac was heating like the liquids you used in the program?
_____________________________________________________________________________
_____________________________________________________________________________
How is the water Tac was heating different from the liquids you used in the program?
_____________________________________________________________________________
_____________________________________________________________________________
PLEASE HIT “DONE” ON THE COMPUTER

PHASE CHANGE: Simulation worksheet
experimental
SUMMARY 1. What phase change were you observing in the program?
________________________________________________________________________________
________________________________________________________________________________
2. In the simulation, bromine was shown as yellow molecules, chlorine as green molecules, and
iodine as red molecules. Are the molecules really those colors? Explain.
________________________________________________________________________________
________________________________________________________________________________
_______________________________________________________________________________
3. Looking at your graphs, tell me what was the relationship between heat and temperature?
________________________________________________________________________________
________________________________________________________________________________
4. You should have observed that as you heated the molecules of chlorine, bromine and iodine they moved faster. We say that have more kinetic (movement) energy, which we could tell because the temperature (average kinetic energy of the molecules) increased. BUT as the phase change took place the temperature of the element did not change even though we continued to heat the element. What was happening? ________________________________________________________________________________
________________________________________________________________________________

PHASE CHANGE: Demo/Lab
experimental
Day 8 Lesson Plan: Lauric Acid Lab Aim: Can you recreate the phase change graph in the real world?
Your Name: ________________________ Date: ______________
Lab Partners: __________________________________
Introduction: You know that matter can exist in one of three physical states—solid, liquid, or gas. For a pure substance, changes in state occur at a definite temperature, which is a physical property of that substance. Water, for example, changes from a solid to a liquid at 0°C. In a solid, the particles are arranged in an orderly, repeating, three-dimensional pattern. As the solid is heated, the energy of the particles increases. Eventually, at some temperature, which is called the melting point, the molecules overcome the forces of attraction holding the particles together, and the substance changes to a liquid. At another temperature, called the boiling point, molecules in the liquid state overcome the forces of attraction between them and the substance changes from a liquid to a gas. When a liquid is cooled, the reverse process occurs. The temperature of the gas decreases until the condensation point is reached and the gas becomes a liquid. Only after the gas has completely changed to a liquid will the temperature decrease again. The temperature of the liquid decreases further until the freezing point is reached. Only after the liquid is completely changed to a solid will the temperature begin to decrease further. Purpose: Changes of state (phase changes) occur in the change between solid and liquid and liquid and gas. In the phase change simulation you observe a change between liquid and gas. In this activity, you will observe what happens as lauric acid (C12H24O2) melts. You will measure the temperature at timed intervals as the lauric acid is heated to determine its melting point experimentally (What other strategies could you use to find out a temperature for the melting point of lauric acid? Why are both useful?)

PHASE CHANGE: Demo/Lab
experimental
Pre-Lab: 1. What phase is the lauric acid in at the beginning of the lab? ________________
2. What will be the next phase the acid changes to when you add heat? _________________
3. Based on the simulations we did yesterday, predict the shape of its heating curve: Temperature (°C)
Heat (kJ) 4. What are the independent and dependent variables? Independent: ________________ Dependent: __________________ 5. What do you always need to wear while chemicals are on the lab tables? Why?
_______________________________________________________________________
Materials: goggles lauric acid test tube 2 beakers, 400 mL thermometers hot plate tap water ice for ice bath

PHASE CHANGE: Demo/Lab
experimental
Procedure:
1. Put on goggles. 2. Fill one 400 mL beaker ¾ full of tap water and heat it on the hot plate. Turn the hot plate all the way to 10. Once you see tiny bubbles, turn it down to 6. CAUTION: Do not touch the hot plate or beaker. 3. At the same time make an ice bath using a 400 mL beaker and ice from the front desk. 4. Get a large test tube of lauric acid and hold it with a test tube holder. Place it in the hot water bath. (You need to melt the lauric acid so you can insert the thermometer into the acid) 5. As the solid begins to melt, place a thermometer into the test tube, once you are able to insert the thermometer (see diagram on previous page), use the test tube holder to place the test tube in an ice water bath. Stop once the temperature reaches about 30°C. 6. Carefully place the test tube containing the lauric acid back into the hot water bath (it should NOT be boiling). 7. Immediately begin to take temperature readings every 30 seconds. Record your temperatures and time in the data table provided. 8. Begin stirring gently as soon as you are able to move the thermometer easily. Continue to measure and record the temperature until the lauric acid is at approximately 55°C. 9. Turn off the hot plate. Remove the thermometer from the lauric acid and return test tube to your teacher. 10. Clean up your work station and wash your hands.
Observations: Approximate melting point of lauric acid _____________
Describe the changes you witnessed?
_______________________________________________________________________
_______________________________________________________________________
_______________________________________________________________________
Could you see the actual molecules? Why or why not?
_______________________________________________________________________

PHASE CHANGE: Demo/Lab
experimental
Data Table:
Title: ______________________________________________
Time (min) Temperature (°C) 0
(right when you put the test tube in hot water)
0.5 (30 seconds)
1.0 1.5 2.0 2.5 3.0 3.5 4.0 4.5 5.0 5.5 6.0 6.5 7.0 7.5 8.0 8.5 9.0 9.5 10.0 10.5 11.0 11.5 12.0
Why do you need to record so many points?
________________________________________________________________________________
________________________________________________________________________________

PHASE CHANGE: Demo/Lab
experimental
Draw a graph representing the table on the previous page. You MUST label all axes, put in the scale, and write a title.
Title: _____________________________________________
Think About it:
1. Did you prediction match your actual data? ____________ Why do you think it was the
same or different?
_____________________________________________________________________________
_____________________________________________________________________________
_____________________________________________________________________________

PHASE CHANGE: Demo/Lab
experimental
2. What was difficult about the procedure (measuring the temperature, keeping the time,
etc...)?
_____________________________________________________________________________
_____________________________________________________________________________
3. How can you explain the fact that at its melting point the temperature of the lauric acid did
not change even though you were still adding heat? What is happening to the heat energy you
are putting into the lauric acid:
When it is a solid?
__________________________________________________________________________
__________________________________________________________________________
When it is changing from solid to liquid? [What is happening to the forces of attraction
between the lauric acid molecules?]
__________________________________________________________________________
__________________________________________________________________________
When it is a liquid?
__________________________________________________________________________
__________________________________________________________________________
4. What were the similarities and differences between what we did in the simulation yesterday
and the lab we did today? ________________________________________________________
_____________________________________________________________________________
_____________________________________________________________________________
5. How did the simulation help you understand what is happening to the lauric acid as it melts?
Give specific details ___________________________________________________________
.____________________________________________________________________________
____________________________________________________________________________

PHASE CHANGE: Demo/Lab
experimental
6. The simulation you did yesterday is a model that explains the relationship between heat and
temperature during a phase change. Why do you think scientists need to test things theoretically
and also do actual experiments?
_____________________________________________________________________________
_____________________________________________________________________________
_____________________________________________________________________________
7. Draw particle diagrams of what you think the molecules will look like as a solid and as a
liquid:
Solid During Melting Liquid
Related Documents