Molecular Structure, Crystallinity and Morphology of Polyethylene/Polypropylene Blends Studied by Raman Mapping, Scanning Electron Microscopy, Wide Angle X-Ray Diffraction, and Differential Scanning Calorimetry Tsuyoshi FURUKAWA, 1;2 Harumi SATO, 1 Yasuo KITA, 3 Kimihiro MATSUKAWA, 3 Hiroshi YAMAGUCHI, 1 Shukichi OCHIAI, 2 Heinz. W. SIESLER, 4 and Yukihiro OZAKI 1; y 1 School of Science and Technology, Kwansei Gakuin University, Gakuen, Sanda 669-1337, Japan 2 S. T. Japan Inc., Minaminakaburi, Hirakata 573-0094, Japan 3 Plastics Department, Osaka Municipal Technical Research Institute, Morinomiya, Joto-ku, Osaka 536-8553, Japan 4 Department of Physical Chemistry, University of Duisburg-Essen, D-45117 Essen, Germany (Received June 7, 2006; Accepted August 8, 2006; Published September 21, 2006) ABSTRACT: The present study is aimed at investigating the molecular structure, crystallinity, and morphology of polyethylene (PE) and polypropylene (PP) blends by using Raman mapping, scanning electron microscopy (SEM), wide-angle X-ray diffraction (WAXD), and differential scanning calorimetry (DSC). In this study, three kinds of PEs, high-density polyethylene (HDPE), linear low-density polyethylene (LLDPE), and metallocene polyethylene (MEPE) were used. MEPE is one of the LLDPEs but its density is very low and its melt flow index (MFI) is very high. Blends of each PE and PP with a PP content ranging from 20 to 80 wt % with an increment of 20 wt % were prepared. Raman mapping images and SEM images show that the 80/20 blends of HDPE/PP and LLDPE/PP have similar dispersibility behavior and that only the 80/20 blend of MEPE/PP shows a different behavior in this respect. For the 20/80 blends, the differences are not so large. For the Raman mapping, the intensity ratio of the two bands at 1128 and 974 cm 1 was used. The former is due to a symmetric C–C stretching mode of all-trans –(CH 2 ) n – groups of PE while the latter is assigned to a CH 3 rocking mode of PP. MEPE/PP blends yield quite different X-ray diffraction patterns compared to HDPE/PP and LLDPE/PP blends; the MEPE/PP blends show that with increasing MEPE content the crystalline size of PP become smaller. DSC curves of MEPE/PP show that the peak area changes linearly with the blending ratio and that the crystallization temperature does not change for any blend. These results mean that the density and MFI of PE influences the blend properties. [doi:10.1295/polymj.PJ2006056] KEY WORDS Metallocene Polyethylene / Polypropylene / Polymer Blend / Raman Mapping / Scanning Electron Microscopy / Wide Angle X-Ray Diffraction / Differential Scanning Calorimetry / Polyethylene (PE) and polypropylene (PP) are two polymers of great industrial importance. 1,2 They are two of the most widely used plastics. There are three major classes of PEs, high-density PE (HDPE), low-density PE (LDPE), and linear low-density PE (LLDPE). 1 The basic difference among the three classes of PEs lies in the degree and regularity of branching. While HDPE has very few branches, LDPE is characterized by a larger branching with irregular branches at irregular intervals. LLDPE, on the other hand, is characterized by branches of regular length (two, four, or six carbon atoms) at regular inter- vals. These structural differences are directly reflected in the physical properties of these polymers, such as crystallinity and melting point. Recently, metallocene PE (MEPE) was introduced as a new family of PEs. 3–6 MEPE is a kind of LLDPE. However, the synthesis method of MEPE is quite different from that of LLDPE. They have quite different crystallinity, densi- ty, melt flow index (MFI), and distribution of molecu- lar weight. The long chain branches of MEPE influ- ence its rheological and thermomechanical prop- erties. Several groups have studied the polymerization and synthesis using metallocene catalyst. 3,4 However, there are few reports regarding the blends of MEPE having unique physical properties. To improve the physical and mechanical properties of polymers, the copolymerization or blending with other polymers are performed. The contents of co- polymer unit and the blending ratio influence the properties. Therefore, it is important to investigate the blends with various contents of copolymer unit and blending ratio. However, the copolymerization has more difficulty than the blending, so that the latter technique is often adopted. Polymer blends of PE and PP also show very attractive physical properties y To whom correspondence should be addressed (Tel: +81-79-565-8349, Fax: +81-79-565-9077, E-mail: [email protected]). 1127 Polymer Journal, Vol. 38, No. 11, pp. 1127–1136 (2006) #2006 The Society of Polymer Science, Japan

Welcome message from author
This document is posted to help you gain knowledge. Please leave a comment to let me know what you think about it! Share it to your friends and learn new things together.
Transcript
Molecular Structure, Crystallinity and Morphologyof Polyethylene/Polypropylene Blends Studied
by Raman Mapping, Scanning ElectronMicroscopy, Wide Angle X-Ray Diffraction,
and Differential Scanning Calorimetry
Tsuyoshi FURUKAWA,1;2 Harumi SATO,1 Yasuo KITA,3
Kimihiro MATSUKAWA,3 Hiroshi YAMAGUCHI,1 Shukichi OCHIAI,2
Heinz. W. SIESLER,4 and Yukihiro OZAKI1;y
1School of Science and Technology, Kwansei Gakuin University, Gakuen, Sanda 669-1337, Japan2S. T. Japan Inc., Minaminakaburi, Hirakata 573-0094, Japan
3Plastics Department, Osaka Municipal Technical Research Institute, Morinomiya, Joto-ku, Osaka 536-8553, Japan4Department of Physical Chemistry, University of Duisburg-Essen, D-45117 Essen, Germany
(Received June 7, 2006; Accepted August 8, 2006; Published September 21, 2006)
ABSTRACT: The present study is aimed at investigating the molecular structure, crystallinity, and morphology of
polyethylene (PE) and polypropylene (PP) blends by using Raman mapping, scanning electron microscopy (SEM),
wide-angle X-ray diffraction (WAXD), and differential scanning calorimetry (DSC). In this study, three kinds of
PEs, high-density polyethylene (HDPE), linear low-density polyethylene (LLDPE), and metallocene polyethylene
(MEPE) were used. MEPE is one of the LLDPEs but its density is very low and its melt flow index (MFI) is very high.
Blends of each PE and PP with a PP content ranging from 20 to 80wt% with an increment of 20wt% were prepared.
Raman mapping images and SEM images show that the 80/20 blends of HDPE/PP and LLDPE/PP have similar
dispersibility behavior and that only the 80/20 blend of MEPE/PP shows a different behavior in this respect. For
the 20/80 blends, the differences are not so large. For the Raman mapping, the intensity ratio of the two bands at
1128 and 974 cm�1 was used. The former is due to a symmetric C–C stretching mode of all-trans –(CH2)n– groups
of PE while the latter is assigned to a CH3 rocking mode of PP. MEPE/PP blends yield quite different X-ray diffraction
patterns compared to HDPE/PP and LLDPE/PP blends; the MEPE/PP blends show that with increasing MEPE content
the crystalline size of PP become smaller. DSC curves of MEPE/PP show that the peak area changes linearly with the
blending ratio and that the crystallization temperature does not change for any blend. These results mean that the
density and MFI of PE influences the blend properties. [doi:10.1295/polymj.PJ2006056]KEY WORDS Metallocene Polyethylene / Polypropylene / Polymer Blend / Raman Mapping /
Scanning Electron Microscopy /Wide Angle X-Ray Diffraction /Differential Scanning Calorimetry /
Polyethylene (PE) and polypropylene (PP) are twopolymers of great industrial importance.1,2 They aretwo of the most widely used plastics. There are threemajor classes of PEs, high-density PE (HDPE),low-density PE (LDPE), and linear low-density PE(LLDPE).1 The basic difference among the threeclasses of PEs lies in the degree and regularity ofbranching. While HDPE has very few branches,LDPE is characterized by a larger branching withirregular branches at irregular intervals. LLDPE, onthe other hand, is characterized by branches of regularlength (two, four, or six carbon atoms) at regular inter-vals. These structural differences are directly reflectedin the physical properties of these polymers, such ascrystallinity and melting point. Recently, metallocenePE (MEPE) was introduced as a new family of PEs.3–6
MEPE is a kind of LLDPE. However, the synthesismethod of MEPE is quite different from that of
LLDPE. They have quite different crystallinity, densi-ty, melt flow index (MFI), and distribution of molecu-lar weight. The long chain branches of MEPE influ-ence its rheological and thermomechanical prop-erties. Several groups have studied the polymerizationand synthesis using metallocene catalyst.3,4 However,there are few reports regarding the blends of MEPEhaving unique physical properties.To improve the physical and mechanical properties
of polymers, the copolymerization or blending withother polymers are performed. The contents of co-polymer unit and the blending ratio influence theproperties. Therefore, it is important to investigatethe blends with various contents of copolymer unitand blending ratio. However, the copolymerizationhas more difficulty than the blending, so that the lattertechnique is often adopted. Polymer blends of PEand PP also show very attractive physical properties
yTo whom correspondence should be addressed (Tel: +81-79-565-8349, Fax: +81-79-565-9077, E-mail: [email protected]).
1127
Polymer Journal, Vol. 38, No. 11, pp. 1127–1136 (2006)
#2006 The Society of Polymer Science, Japan
such as crystallinity behavior.7–18 These studies werecarried out by means of wide-angle X-ray diffrac-tion (WAXD),10,16,17 differential scanning calorimetry(DSC),10–16 microscopy,12–16,18 and so on. Althoughthe unit structures of PE and PP, CH2CH2 and CH2-CH(CH3), respectively, are very similar to each other,PE and PP blend polymers are immiscible.7,11,12
Therefore, it is very interesting to investigate if PEand PP have some interactions or not in the PE/PPblends. It is also important to compare the structure,dispersibility, and physical properties among variouskinds of PE/PP blends such as HDPE/PP andLLDPE/PP. The addition of a compatibilizer to aPE/PP blend causes the enhancement of its tough-ness.7 Li et al. reported that PP components crystal-lized isothermally are immiscible with HDPE andLDPE and are miscible with LLDPE.14
The purpose of the present study is to investigatethe molecular structure, crystallinity, and morphologyof the three kinds of PE/PP blends, HDPE/PP,LLDPE/PP, and MEPE/PP by using Raman spec-troscopy,19–25 Raman mapping,26 scanning electronmicroscopy (SEM),24,25 WAXD,23,27 and DSC.25,27
Raman mapping enables simultaneous explorationof the morphology and molecular structure of theblends.26,28–31 SEM is a well-established methodfor morphological characterization and supports theRaman mapping results by microscope images.WAXD allows one to investigate the crystallinity ofblends, and by use of DSC information about thecrystallization can be obtained. Therefore, a combina-tion of these techniques has allowed us to explore themorphology, structure, and physical properties of thePE/PP blends comprehensively.
EXPERIMENTAL
MaterialsThe polymers used in this study were high density
polyethylene, SUNTEC-HDJ 240 (Asahi ChemicalIndustry Co., Ltd.), linear low density polyethylene,UF-240 (Japan Polyethylene Co. Ltd.), metallocenepolyethylene, KN KJ640 (Nihon Polychem. Ltd.), andpolypropylene, GRAND-POLYPRO-J602WA (GrandPolymer Ltd.). The density (g/cm3), melt flow index(MFI) (g/10min), crystallinity (%), and melting tem-perature of the above HDPE, LLDPE, MEPE, and PPare summarized in Table I. The crystallinity and melt-ing temperature (Tm) are estimated from DSC data.All blends were prepared by compounding HDPE,LLDPE, or MEPE with PP at 220 �C in a twin-screwextruder, respectively. Melt blending was carried outusing a co-rotating intermeshing twin-screw extruder(BT-30-S2-42L, PLABOR Co. Ltd.) with an l=d of42 (30mm screw diameter) at barrel temperatures
ranging from 160 �C at the feed zone to 220 �C at themetering and die zones. The rotation speed of thetwin-screw was 60 rpm. Blending ratios of HDPE/PP, LLDPE/PP, and MEPE/PP were 20/80, 40/60,60/40, and 80/20, respectively.
Raman MappingThe Raman spectra of PE/PP blends were meas-
ured with a Kaiser Optical Systems HoloLab5000Raman spectrometer equipped with a CCD detector.An excitation wavelength at 532 nm was provided by afrequency doubled Nd/YAG laser, and the laser pow-er at the sample position was typically 3mW. Ramanscattered light was collected in a 180� back scatteringgeometry. Raman data were collected at a spectro-scopic resolution of 1.2 cm�1. The exposure timeand number of accumulations were 10 s and 2 times,respectively. Raman spectra were collected from thesurfaces of pellets that were obtained by cutting outthe original samples. Raman mapping images weregenerated by measuring 100 Raman spectra for eachsample with areas of 10 mm2 in step sizes of 1 mm(for 10� 10 sample spots). The spatial resolutionwas better than a few micrometers (the size of thelaser beam was 1mm). The software used for creatingthe Raman mapping images was Origin 6.1.
Scanning Electron Microscopy (SEM)To study the morphology of PE/PP blends, HDPE/
PP, LLDPE/PP, and MEPE/PP extruded blends werecollected, fractured under liquid nitrogen, and thenobserved under a JEOL JSM-5800LVC scanning elec-tron microscope.
Wide-Angle X-Ray Diffraction (WAXD)WAXD data for PE/PP were measured at room
temperature by use of a RIGAKU R-AXIS IV imagingplate diffractometer. Cu K� radiation (wavelength,1.5418 nm) from a RIGAKU Ultra-X18 rotating anodeX-ray generator was used as an incident X-ray source(40 kV, 100mA). Grams/AI software was used for thecurve fitting of WAXD data.
Differential Scanning Calorimetry (DSC)DSC measurements were performed on a Perkin-
Table I. Physical properties of HDPE, LLDPE, MEPE, and PP
Density(g/cm3)
MFI(g/10min)
Crystallinity(%)
Tm(�C)
HDPE 0.969 5.0 75.7 134.6
LLDPE 0.920 2.1 44.9 122.5
MEPE 0.880 30.0 n.d. n.d.
PP 0.910 1.5 n.d. 148.2
n.d.: not detected.
T. FURUKAWA et al.
1128 Polym. J., Vol. 38, No. 11, 2006
Elmer Pyris6 system over a temperature range from25 to 200 �C at heating and cooling rates of 10 �C/min. The samples (4–5mg) were sealed in aluminumpans. The analysis of DSC curves for both the heatingand cooling processes was carried out for the secondrun data.
RESULTS AND DISCUSSION
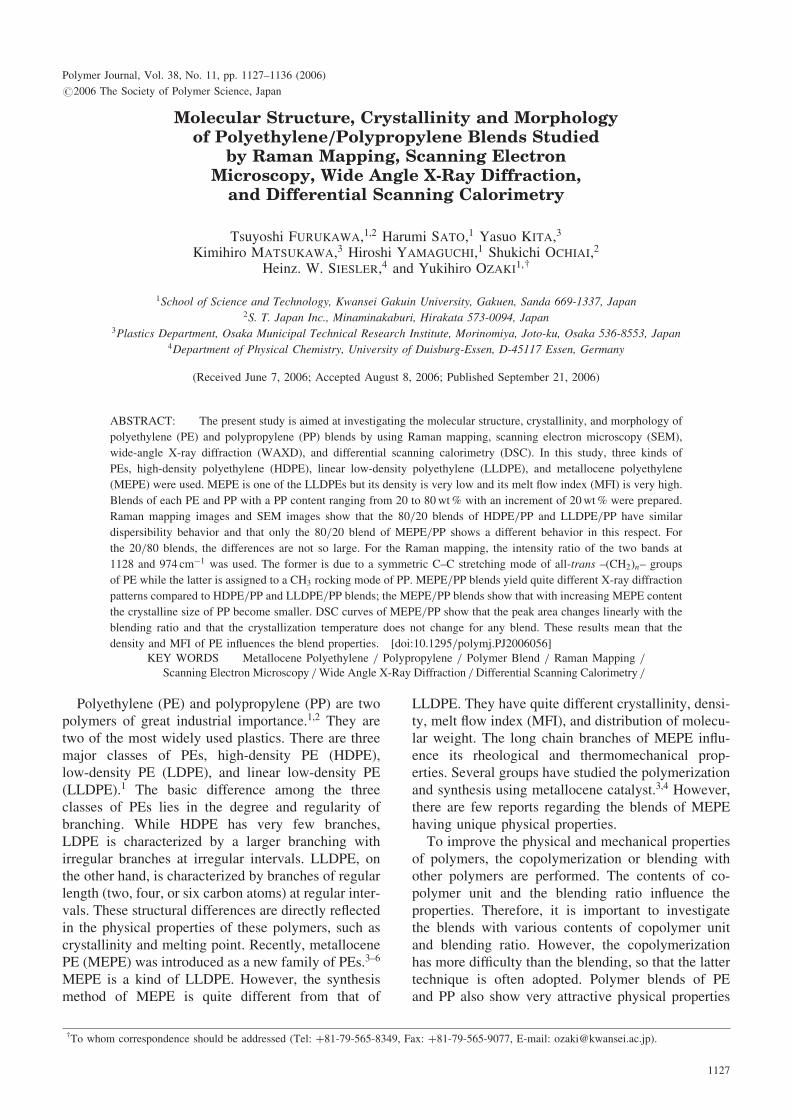
Raman MappingFigure 1 shows Raman spectra of HDPE, LLDPE,
MEPE, and PP, respectively. These Raman spectrawere not recorded in the micro-Raman mode butwere measured as ordinary Raman spectra frompellets. Table II summarizes the band assignmentsmade by referring to the Raman spectra of PE andPP reported previously.8,13 Not only PE but also PPhave –(CH2)– functionalities, so that most of bandsappear in the Raman spectra in Figure 1. The crystal-linity of PE can be investigated by Raman spectrosco-py because some Raman bands are specific for thecrystalline, amorphous, or anisotropic phases ofPE.19,20 For example, it is well known that the Ramanbands at 1416 and 1169 cm�1 are ascribed to the crys-talline phase and that those at 1369 and 1079 cm�1 areassigned to the amorphous phase.19,20 One can also ex-plore the conformation of –(CH2)n– by use of Ramanspectroscopy because bands at 1462, 1294, 1128, and1062 cm�1 are due to the all-trans–(CH2)n– structurewhile those at 1110 and 1079 cm�1 arises from thetrans and gauche structures.19,20 The crystalline phasehas an all-trans (CH2)n –structure, so that the bands at1462, 1294, 1128, and 1062 cm�1 reflect the crystal-linity, although they also contain a contribution fromthe anisotropic phases. The 1416 cm�1 band is alsocharacteristic of crystallinity.19,20 The intensities ofthe bands at 1416 and 1128 cm�1 are much weaker
in the Raman spectrum of MEPE than in those ofHDPE and LLDPE. On the other hand, the intensityof the 1079 cm�1 band is much stronger in the Ramanspectrum of MEPE than in those of HDPE andLLDPE. These results indicate that the crystallinityof MEPE in the blends is lower than that of HDPEand LLDPE. On the other hand, one can find somebands characteristic of PP. For example, a band at808 cm�1 and bands at 974 and 840 cm�1 assignedto the C–C stretching mode and the CH3 rockingmode, respectively, are characteristic of PP.19,20 Thesebands can be used for the characterization of crystal-lization and tacticity of PP.32,33 In the frequency re-gions where these bands are observed, no bands areobserved for the three kinds of PEs. Therefore, byusing the relative intensity of these bands one canestimate the relative content of PP in the blends.Figures 2A, 2A0, 2B, 2B0, 2C, and 2C0 show Raman
mapping images of an area of 10 mm2 of HDPE/PP,LLDPE/PP and MEPE/PP with the PE content of 20and 80wt%, respectively. To develop the maps, theintensity ratio of two bands at 1128 and 974 cm�1
(I1128/I974) due to the C–C stretching mode of PEand the CH3 rocking mode of PP, respectively,19,20
was employed. The band at 974 cm�1 is a good mark-er band for PP while it is difficult to find a band purelyspecific for PE that is free from the overlap of a PPband. We used the band at 1128 cm�1 since this bandis relatively well separated from other bands. In theRaman mapping images, the darker parts and thelighter parts include more PP and PE component,respectively.
1600 1400 1200 1000 800 600 400
(d)
(c)
(b)
(a)
Inte
nsity
/a.u
.
Raman shift/cm-1
840 80
8
1152
974
1329
1459
1436
1359 11
67
1294
1439
1462 11
28
1062
1416
1169
1369
1079
Figure 1. Raman spectra of HDPE, LLDPE, MEPE, and PP.
(a): HDPE, (b): LLDPE, (c): MEPE, (d): PP.
Table II. Wavenumbers (cm�1) and Assignments
of the Raman bands of PE/PP blends
Raman shift/cm�1
Assignments(PE)
Assignments(PP)
Features
1462 CH2 bending Crystalline
1459 CH2 bending
1439 CH2 bending Crystalline
1436 CH2 bending
1416 CH2 bending Crystalline
1369 CH3 wagging Amorphous
1359 CH3 wagging
1329 CH2 twisting
1294 CH2 twisting all-trans –(CH2)n–
1169 CH2 rocking Crystalline
1167 C–C stretching Crystalline
1152 C–C stretching
1128 C–C stretching all-trans –(CH2)n–
1079 C–C stretching Amorphous
1062 C–C stretching all-trans –(CH2)n–
974 CH3 rocking Crystalline
840 CH3 rocking
808 C–C stretching Crystalline
PE/PP Blends Studies by Raman Mapping, SEM, WAXD, and DSC
Polym. J., Vol. 38, No. 11, 2006 1129
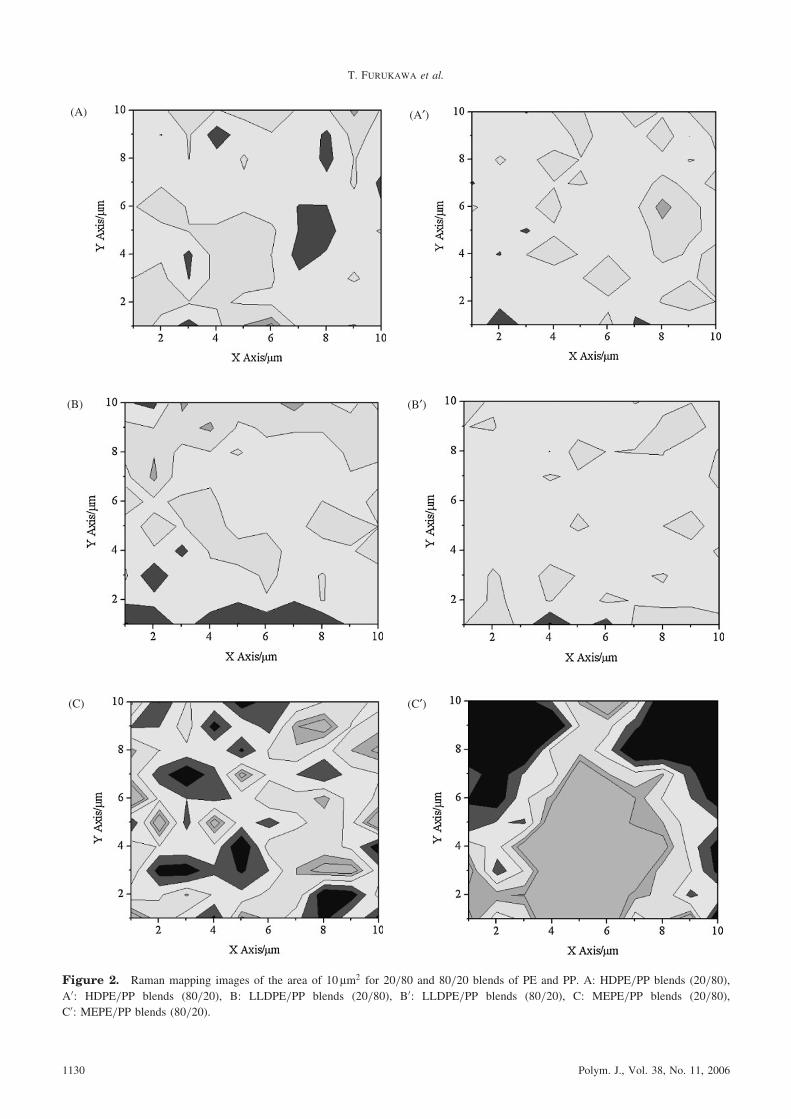
(A) (A′)
(B) (B′)
(C) (C′)
Figure 2. Raman mapping images of the area of 10 mm2 for 20/80 and 80/20 blends of PE and PP. A: HDPE/PP blends (20/80),
A0: HDPE/PP blends (80/20), B: LLDPE/PP blends (20/80), B0: LLDPE/PP blends (80/20), C: MEPE/PP blends (20/80),
C0: MEPE/PP blends (80/20).
T. FURUKAWA et al.
1130 Polym. J., Vol. 38, No. 11, 2006
The dispersibility of each component in polymerblends is affected by the melt viscosity ratio of com-ponents. Therefore, a comparison of MFI of each PEwith PP is important. The MFI ratios of PE and PPin the HDPE/PP, LLDPE/PP, and MEPE/PP blendsare 3.3, 1.4, and 20.0, respectively. The ratio in theHDPE/PP blend is twice as large as that in theLLDPE/PP blend, and the ratio in the MEPE/PPblend is the largest among the three blends. As canbe seen in Figure 2, the Raman mapping imagesof MEPE/PP are markedly different from those ofHDPE/PP and LLDPE/PP in both blend ratios. Highconcentrations of PE appear black in each mappingimage. Only the Raman mapping images of theMEPE/PP blends show a clear ‘‘sea-island’’ structure.The results of the Raman mapping images reveal thatthe MEPE/PP blends have an inhomogenous struc-ture. Although MEPE is a kind of LLDPE, the resultsof Raman mapping of MEPE/PP blends are quitedifferent from those of LLDPE/PP blends. It is verylikely that the dispersibility of PE and PP dependson the MFI ratios, or on the kinds of PE. Three kindsof PE have different properties of branching. In otherwords, the degree and regularity of branching, whichinfluence the dispersibility of PE and PP, are different.The Raman spectra were collected from two posi-
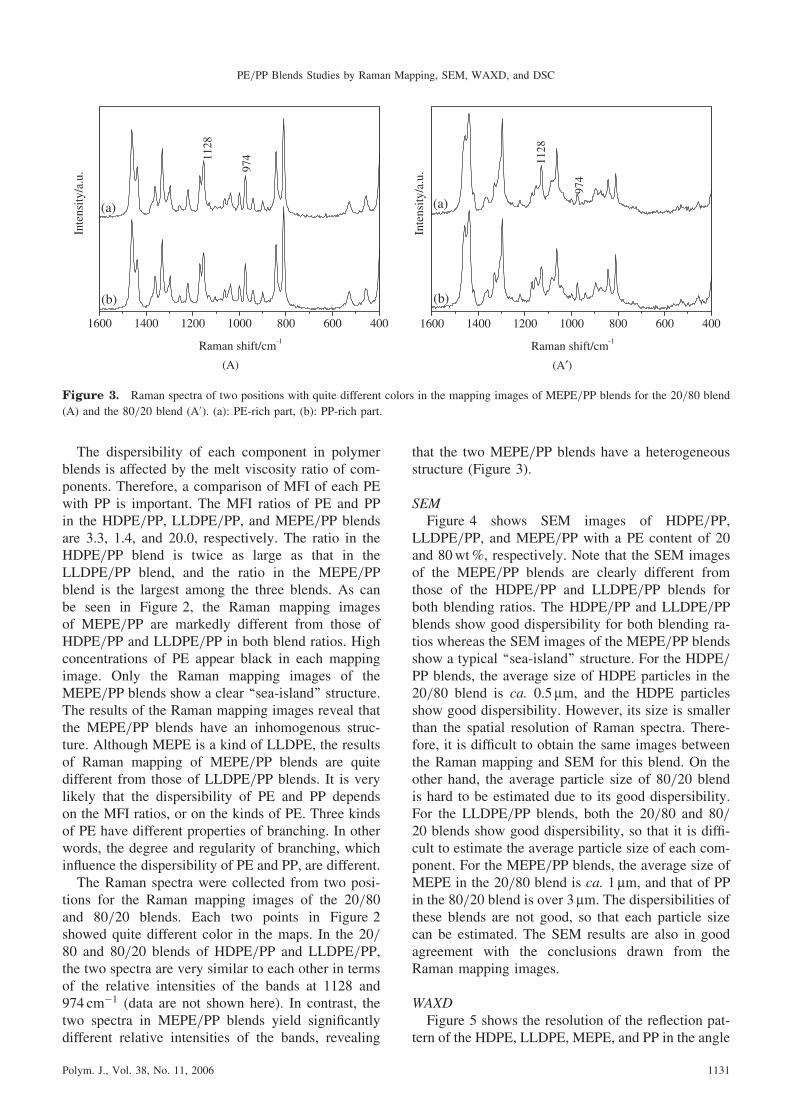
tions for the Raman mapping images of the 20/80and 80/20 blends. Each two points in Figure 2showed quite different color in the maps. In the 20/80 and 80/20 blends of HDPE/PP and LLDPE/PP,the two spectra are very similar to each other in termsof the relative intensities of the bands at 1128 and974 cm�1 (data are not shown here). In contrast, thetwo spectra in MEPE/PP blends yield significantlydifferent relative intensities of the bands, revealing
that the two MEPE/PP blends have a heterogeneousstructure (Figure 3).
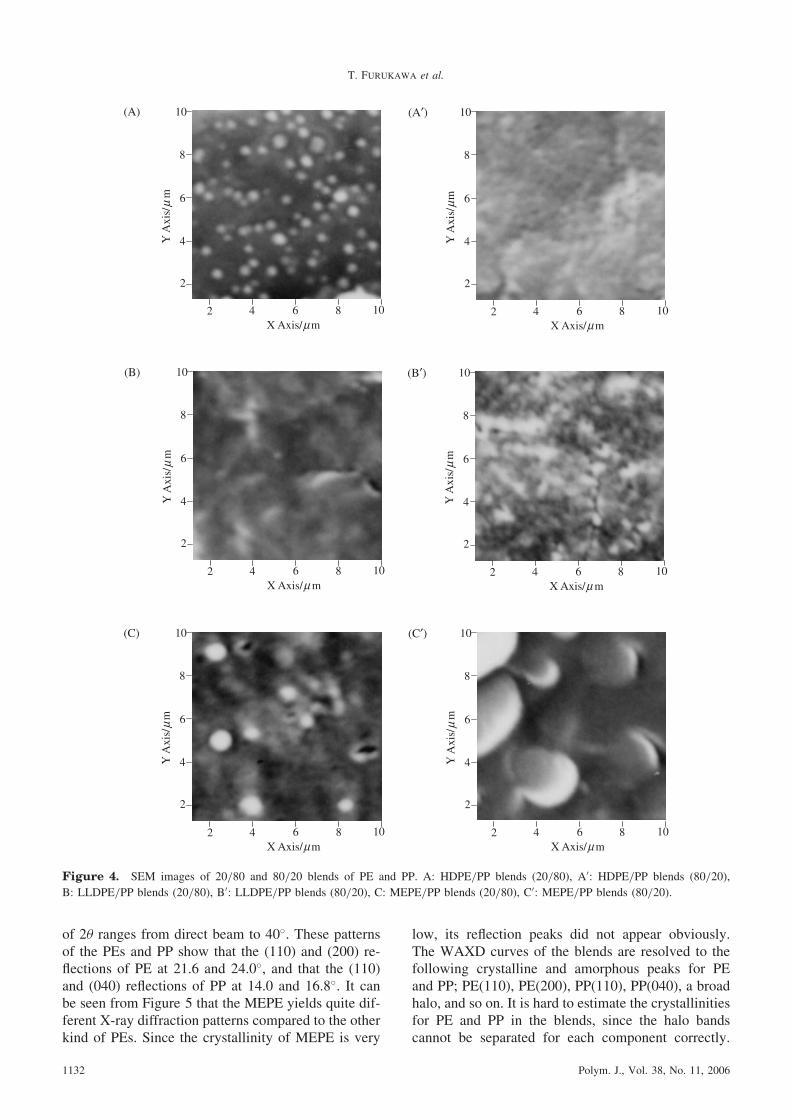
SEMFigure 4 shows SEM images of HDPE/PP,
LLDPE/PP, and MEPE/PP with a PE content of 20and 80wt%, respectively. Note that the SEM imagesof the MEPE/PP blends are clearly different fromthose of the HDPE/PP and LLDPE/PP blends forboth blending ratios. The HDPE/PP and LLDPE/PPblends show good dispersibility for both blending ra-tios whereas the SEM images of the MEPE/PP blendsshow a typical ‘‘sea-island’’ structure. For the HDPE/PP blends, the average size of HDPE particles in the20/80 blend is ca. 0.5mm, and the HDPE particlesshow good dispersibility. However, its size is smallerthan the spatial resolution of Raman spectra. There-fore, it is difficult to obtain the same images betweenthe Raman mapping and SEM for this blend. On theother hand, the average particle size of 80/20 blendis hard to be estimated due to its good dispersibility.For the LLDPE/PP blends, both the 20/80 and 80/20 blends show good dispersibility, so that it is diffi-cult to estimate the average particle size of each com-ponent. For the MEPE/PP blends, the average size ofMEPE in the 20/80 blend is ca. 1 mm, and that of PPin the 80/20 blend is over 3mm. The dispersibilities ofthese blends are not good, so that each particle sizecan be estimated. The SEM results are also in goodagreement with the conclusions drawn from theRaman mapping images.
WAXDFigure 5 shows the resolution of the reflection pat-
tern of the HDPE, LLDPE, MEPE, and PP in the angle
1600 1400 1200 1000 800 600 400
Inte
nsity
/a.u
.
Raman shift/cm-1
1128
974
(a)
(b)
(A)
1600 1400 1200 1000 800 600 400
Inte
nsity
/a.u
.
Raman shift/cm-1
1128
974
(a)
(b)
(A′)
Figure 3. Raman spectra of two positions with quite different colors in the mapping images of MEPE/PP blends for the 20/80 blend
(A) and the 80/20 blend (A0). (a): PE-rich part, (b): PP-rich part.
PE/PP Blends Studies by Raman Mapping, SEM, WAXD, and DSC
Polym. J., Vol. 38, No. 11, 2006 1131
of 2� ranges from direct beam to 40�. These patternsof the PEs and PP show that the (110) and (200) re-flections of PE at 21.6 and 24.0�, and that the (110)and (040) reflections of PP at 14.0 and 16.8�. It canbe seen from Figure 5 that the MEPE yields quite dif-ferent X-ray diffraction patterns compared to the otherkind of PEs. Since the crystallinity of MEPE is very
low, its reflection peaks did not appear obviously.The WAXD curves of the blends are resolved to thefollowing crystalline and amorphous peaks for PEand PP; PE(110), PE(200), PP(110), PP(040), a broadhalo, and so on. It is hard to estimate the crystallinitiesfor PE and PP in the blends, since the halo bandscannot be separated for each component correctly.
2 4 6 8 10X Axis/µm
10(A)
8
6
4
2
Y A
xis/
µm
(A′)
2 4 6 8 10X Axis/µm
10
8
6
4
2
Y A
xis/
µm
2 4 6 8 10X Axis/µ m
10
8
6
4
2
Y A
xis/
µm
(B)
2 4 6 8 10X Axis/µ m
10
8
6
4
2
Y A
xis/
µm
(B′)
2 4 6 8 10X Axis/µm
10
8
6
4
2
Y A
xis/
µm
(C)
2 4 6 8 10X Axis/µ m
10
8
6
4
2
Y A
xis/
µm
(C′)
Figure 4. SEM images of 20/80 and 80/20 blends of PE and PP. A: HDPE/PP blends (20/80), A0: HDPE/PP blends (80/20),
B: LLDPE/PP blends (20/80), B0: LLDPE/PP blends (80/20), C: MEPE/PP blends (20/80), C0: MEPE/PP blends (80/20).
T. FURUKAWA et al.
1132 Polym. J., Vol. 38, No. 11, 2006
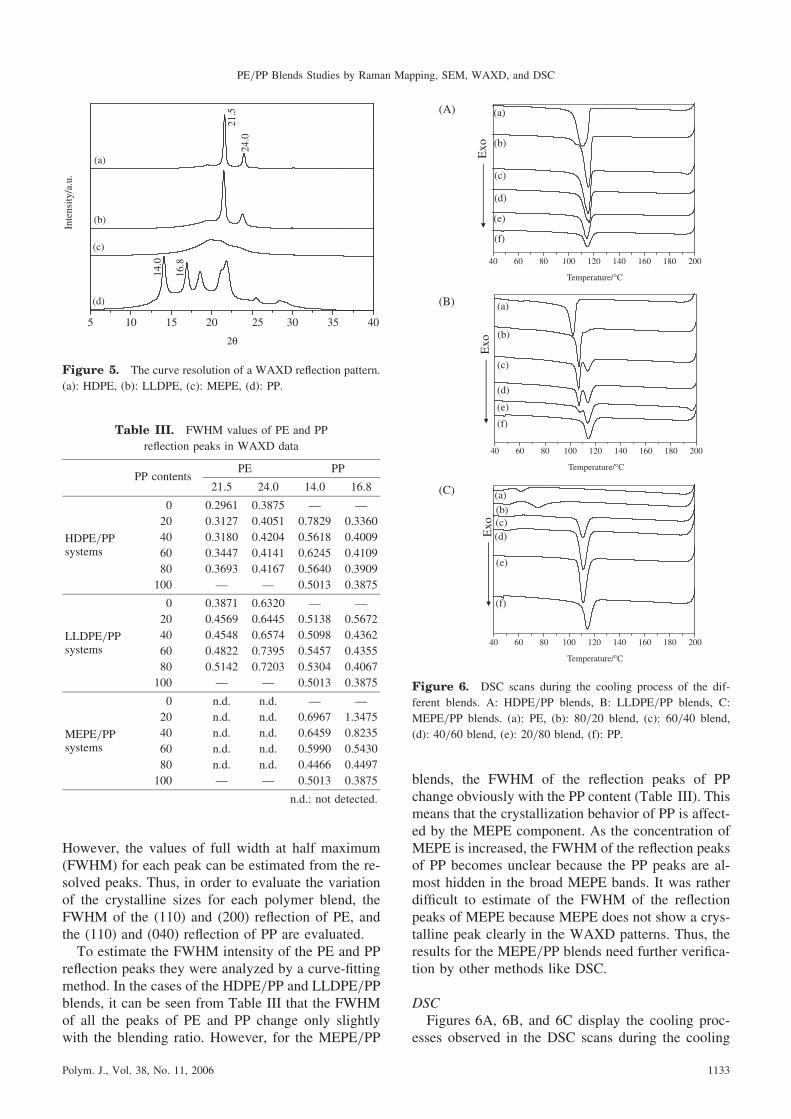
However, the values of full width at half maximum(FWHM) for each peak can be estimated from the re-solved peaks. Thus, in order to evaluate the variationof the crystalline sizes for each polymer blend, theFWHM of the (110) and (200) reflection of PE, andthe (110) and (040) reflection of PP are evaluated.To estimate the FWHM intensity of the PE and PP
reflection peaks they were analyzed by a curve-fittingmethod. In the cases of the HDPE/PP and LLDPE/PPblends, it can be seen from Table III that the FWHMof all the peaks of PE and PP change only slightlywith the blending ratio. However, for the MEPE/PP
blends, the FWHM of the reflection peaks of PPchange obviously with the PP content (Table III). Thismeans that the crystallization behavior of PP is affect-ed by the MEPE component. As the concentration ofMEPE is increased, the FWHM of the reflection peaksof PP becomes unclear because the PP peaks are al-most hidden in the broad MEPE bands. It was ratherdifficult to estimate of the FWHM of the reflectionpeaks of MEPE because MEPE does not show a crys-talline peak clearly in the WAXD patterns. Thus, theresults for the MEPE/PP blends need further verifica-tion by other methods like DSC.
DSCFigures 6A, 6B, and 6C display the cooling proc-
esses observed in the DSC scans during the cooling
5 10 15 20 25 30 35 40
(d)
(c)
(b)
(a)
Inte
nsity
/a.u
.
2θ
21.5
24.0
14.0
16.8
Figure 5. The curve resolution of a WAXD reflection pattern.
(a): HDPE, (b): LLDPE, (c): MEPE, (d): PP.
Table III. FWHM values of PE and PP
reflection peaks in WAXD data
PP contentsPE PP
21.5 24.0 14.0 16.8
0 0.2961 0.3875 — —
20 0.3127 0.4051 0.7829 0.3360
HDPE/PP 40 0.3180 0.4204 0.5618 0.4009systems 60 0.3447 0.4141 0.6245 0.4109
80 0.3693 0.4167 0.5640 0.3909
100 — — 0.5013 0.3875
0 0.3871 0.6320 — —
20 0.4569 0.6445 0.5138 0.5672
LLDPE/PP 40 0.4548 0.6574 0.5098 0.4362systems 60 0.4822 0.7395 0.5457 0.4355
80 0.5142 0.7203 0.5304 0.4067
100 — — 0.5013 0.3875
0 n.d. n.d. — —
20 n.d. n.d. 0.6967 1.3475
MEPE/PP 40 n.d. n.d. 0.6459 0.8235systems 60 n.d. n.d. 0.5990 0.5430
80 n.d. n.d. 0.4466 0.4497
100 — — 0.5013 0.3875
n.d.: not detected.
40 60 80 100 120 140 160 180 200
Temperature/°C
(a)
(b)
(c)
(d)
(e)
(f)
Exo
(A)
40 60 80 100 120 140 160 180 200
Temperature/°C
(a)
(b)
(c)
(d)
(e)
(f)
Exo
(B)
40 60 80 100 120 140 160 180 200
Temperature/°C
(a)(b)(c)(d)
(e)
(f)
Exo
(C)
Figure 6. DSC scans during the cooling process of the dif-
ferent blends. A: HDPE/PP blends, B: LLDPE/PP blends, C:
MEPE/PP blends. (a): PE, (b): 80/20 blend, (c): 60/40 blend,
(d): 40/60 blend, (e): 20/80 blend, (f): PP.
PE/PP Blends Studies by Raman Mapping, SEM, WAXD, and DSC
Polym. J., Vol. 38, No. 11, 2006 1133
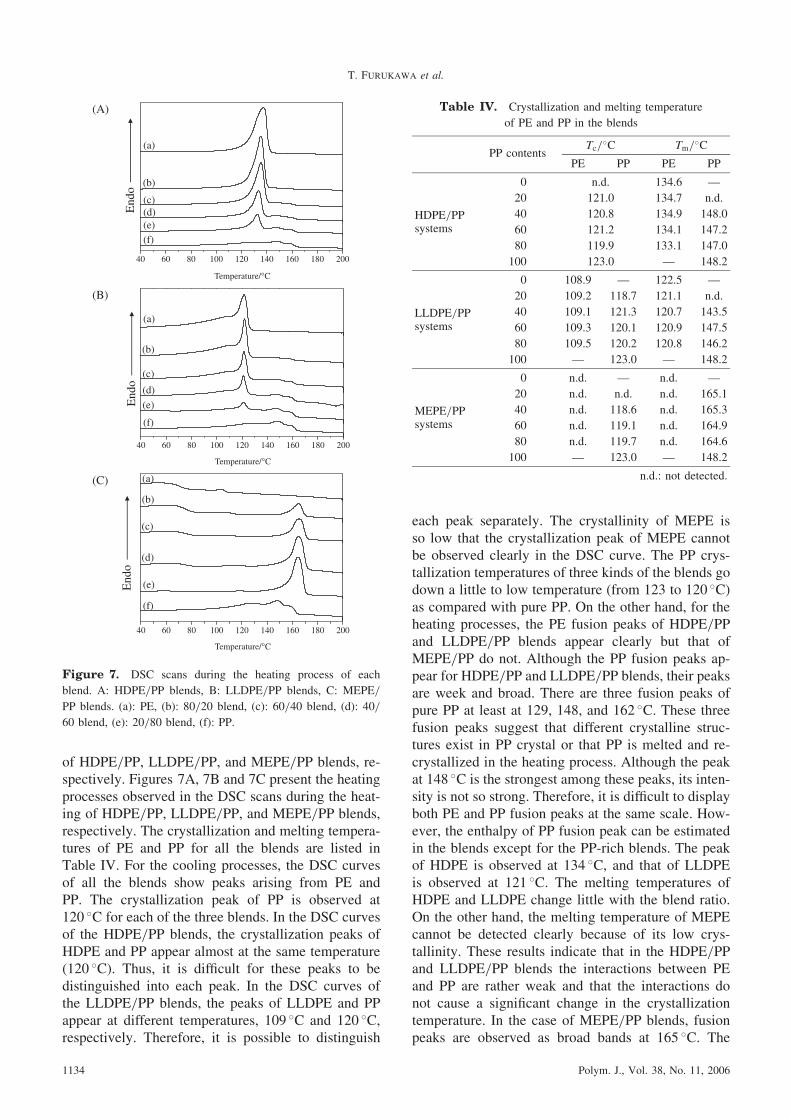
of HDPE/PP, LLDPE/PP, and MEPE/PP blends, re-spectively. Figures 7A, 7B and 7C present the heatingprocesses observed in the DSC scans during the heat-ing of HDPE/PP, LLDPE/PP, and MEPE/PP blends,respectively. The crystallization and melting tempera-tures of PE and PP for all the blends are listed inTable IV. For the cooling processes, the DSC curvesof all the blends show peaks arising from PE andPP. The crystallization peak of PP is observed at120 �C for each of the three blends. In the DSC curvesof the HDPE/PP blends, the crystallization peaks ofHDPE and PP appear almost at the same temperature(120 �C). Thus, it is difficult for these peaks to bedistinguished into each peak. In the DSC curves ofthe LLDPE/PP blends, the peaks of LLDPE and PPappear at different temperatures, 109 �C and 120 �C,respectively. Therefore, it is possible to distinguish
each peak separately. The crystallinity of MEPE isso low that the crystallization peak of MEPE cannotbe observed clearly in the DSC curve. The PP crys-tallization temperatures of three kinds of the blends godown a little to low temperature (from 123 to 120 �C)as compared with pure PP. On the other hand, for theheating processes, the PE fusion peaks of HDPE/PPand LLDPE/PP blends appear clearly but that ofMEPE/PP do not. Although the PP fusion peaks ap-pear for HDPE/PP and LLDPE/PP blends, their peaksare week and broad. There are three fusion peaks ofpure PP at least at 129, 148, and 162 �C. These threefusion peaks suggest that different crystalline struc-tures exist in PP crystal or that PP is melted and re-crystallized in the heating process. Although the peakat 148 �C is the strongest among these peaks, its inten-sity is not so strong. Therefore, it is difficult to displayboth PE and PP fusion peaks at the same scale. How-ever, the enthalpy of PP fusion peak can be estimatedin the blends except for the PP-rich blends. The peakof HDPE is observed at 134 �C, and that of LLDPEis observed at 121 �C. The melting temperatures ofHDPE and LLDPE change little with the blend ratio.On the other hand, the melting temperature of MEPEcannot be detected clearly because of its low crys-tallinity. These results indicate that in the HDPE/PPand LLDPE/PP blends the interactions between PEand PP are rather weak and that the interactions donot cause a significant change in the crystallizationtemperature. In the case of MEPE/PP blends, fusionpeaks are observed as broad bands at 165 �C. The
40 60 80 100 120 140 160 180 200
Temperature/°C
End
o(a)
(b)
(c)(d)(e)(f)
40 60 80 100 120 140 160 180 200
Temperature/°C
End
o
(a)
(b)
(c)
(d)
(e)
(f)
40 60 80 100 120 140 160 180 200
Temperature/°C
End
o
(a)
(b)
(c)
(d)
(e)
(f)
(A)
(B)
(C)
Figure 7. DSC scans during the heating process of each
blend. A: HDPE/PP blends, B: LLDPE/PP blends, C: MEPE/
PP blends. (a): PE, (b): 80/20 blend, (c): 60/40 blend, (d): 40/
60 blend, (e): 20/80 blend, (f): PP.
Table IV. Crystallization and melting temperature
of PE and PP in the blends
PP contentsTc/
�C Tm/�C
PE PP PE PP
0 n.d. 134.6 —
20 121.0 134.7 n.d.
HDPE/PP 40 120.8 134.9 148.0systems 60 121.2 134.1 147.2
80 119.9 133.1 147.0
100 123.0 — 148.2
0 108.9 — 122.5 —
20 109.2 118.7 121.1 n.d.
LLDPE/PP 40 109.1 121.3 120.7 143.5systems 60 109.3 120.1 120.9 147.5
80 109.5 120.2 120.8 146.2
100 — 123.0 — 148.2
0 n.d. — n.d. —
20 n.d. n.d. n.d. 165.1
MEPE/PP 40 n.d. 118.6 n.d. 165.3systems 60 n.d. 119.1 n.d. 164.9
80 n.d. 119.7 n.d. 164.6
100 — 123.0 — 148.2
n.d.: not detected.
T. FURUKAWA et al.
1134 Polym. J., Vol. 38, No. 11, 2006
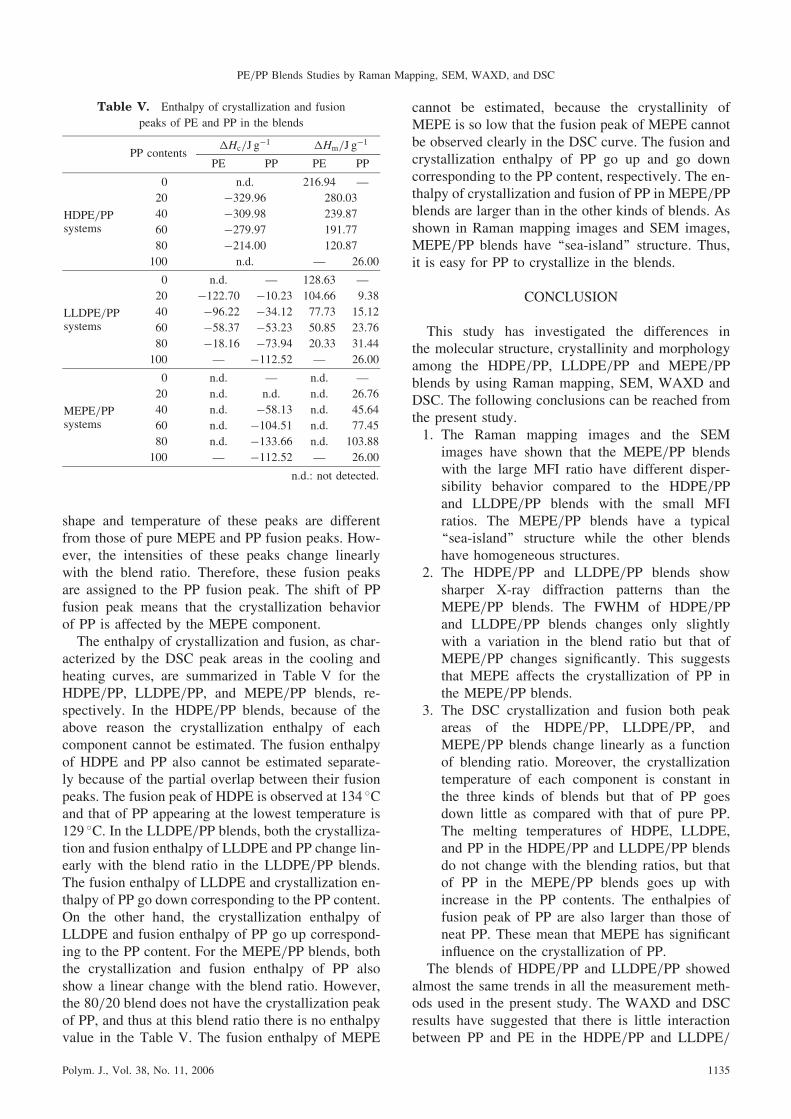
shape and temperature of these peaks are differentfrom those of pure MEPE and PP fusion peaks. How-ever, the intensities of these peaks change linearlywith the blend ratio. Therefore, these fusion peaksare assigned to the PP fusion peak. The shift of PPfusion peak means that the crystallization behaviorof PP is affected by the MEPE component.The enthalpy of crystallization and fusion, as char-
acterized by the DSC peak areas in the cooling andheating curves, are summarized in Table V for theHDPE/PP, LLDPE/PP, and MEPE/PP blends, re-spectively. In the HDPE/PP blends, because of theabove reason the crystallization enthalpy of eachcomponent cannot be estimated. The fusion enthalpyof HDPE and PP also cannot be estimated separate-ly because of the partial overlap between their fusionpeaks. The fusion peak of HDPE is observed at 134 �Cand that of PP appearing at the lowest temperature is129 �C. In the LLDPE/PP blends, both the crystalliza-tion and fusion enthalpy of LLDPE and PP change lin-early with the blend ratio in the LLDPE/PP blends.The fusion enthalpy of LLDPE and crystallization en-thalpy of PP go down corresponding to the PP content.On the other hand, the crystallization enthalpy ofLLDPE and fusion enthalpy of PP go up correspond-ing to the PP content. For the MEPE/PP blends, boththe crystallization and fusion enthalpy of PP alsoshow a linear change with the blend ratio. However,the 80/20 blend does not have the crystallization peakof PP, and thus at this blend ratio there is no enthalpyvalue in the Table V. The fusion enthalpy of MEPE
cannot be estimated, because the crystallinity ofMEPE is so low that the fusion peak of MEPE cannotbe observed clearly in the DSC curve. The fusion andcrystallization enthalpy of PP go up and go downcorresponding to the PP content, respectively. The en-thalpy of crystallization and fusion of PP in MEPE/PPblends are larger than in the other kinds of blends. Asshown in Raman mapping images and SEM images,MEPE/PP blends have ‘‘sea-island’’ structure. Thus,it is easy for PP to crystallize in the blends.
CONCLUSION
This study has investigated the differences inthe molecular structure, crystallinity and morphologyamong the HDPE/PP, LLDPE/PP and MEPE/PPblends by using Raman mapping, SEM, WAXD andDSC. The following conclusions can be reached fromthe present study.1. The Raman mapping images and the SEM
images have shown that the MEPE/PP blendswith the large MFI ratio have different disper-sibility behavior compared to the HDPE/PPand LLDPE/PP blends with the small MFIratios. The MEPE/PP blends have a typical‘‘sea-island’’ structure while the other blendshave homogeneous structures.
2. The HDPE/PP and LLDPE/PP blends showsharper X-ray diffraction patterns than theMEPE/PP blends. The FWHM of HDPE/PPand LLDPE/PP blends changes only slightlywith a variation in the blend ratio but that ofMEPE/PP changes significantly. This suggeststhat MEPE affects the crystallization of PP inthe MEPE/PP blends.
3. The DSC crystallization and fusion both peakareas of the HDPE/PP, LLDPE/PP, andMEPE/PP blends change linearly as a functionof blending ratio. Moreover, the crystallizationtemperature of each component is constant inthe three kinds of blends but that of PP goesdown little as compared with that of pure PP.The melting temperatures of HDPE, LLDPE,and PP in the HDPE/PP and LLDPE/PP blendsdo not change with the blending ratios, but thatof PP in the MEPE/PP blends goes up withincrease in the PP contents. The enthalpies offusion peak of PP are also larger than those ofneat PP. These mean that MEPE has significantinfluence on the crystallization of PP.
The blends of HDPE/PP and LLDPE/PP showedalmost the same trends in all the measurement meth-ods used in the present study. The WAXD and DSCresults have suggested that there is little interactionbetween PP and PE in the HDPE/PP and LLDPE/
Table V. Enthalpy of crystallization and fusion
peaks of PE and PP in the blends
PP contents�Hc/J g
�1 �Hm/J g�1
PE PP PE PP
0 n.d. 216.94 —
20 �329:96 280.03
HDPE/PP 40 �309:98 239.87systems 60 �279:97 191.77
80 �214:00 120.87
100 n.d. — 26.00
0 n.d. — 128.63 —
20 �122:70 �10:23 104.66 9.38
LLDPE/PP 40 �96:22 �34:12 77.73 15.12systems 60 �58:37 �53:23 50.85 23.76
80 �18:16 �73:94 20.33 31.44
100 — �112:52 — 26.00
0 n.d. — n.d. —
20 n.d. n.d. n.d. 26.76
MEPE/PP 40 n.d. �58:13 n.d. 45.64systems 60 n.d. �104:51 n.d. 77.45
80 n.d. �133:66 n.d. 103.88
100 — �112:52 — 26.00
n.d.: not detected.
PE/PP Blends Studies by Raman Mapping, SEM, WAXD, and DSC
Polym. J., Vol. 38, No. 11, 2006 1135
PP blends. Each component in the HDPE/PP andLLDPE/PP blends is crystallized independently, sothat the interaction between HDPE (LLDPE) and PPis very weak. On the other hand, the MEPE/PP blendsshowed that unique FWHM changes of PP in theWAXD pattern with the blending ratio and that the en-hancement and shift of the enthalpy and temperatureof the PP fusion peak. In the polymer blends of PEand PP, the amorphous parts of PE play an importantrole in the crystallization process of blends of eachcomponent.
REFERENCES
1. A. J. Peacock, ‘‘Handbook of Polyethylene,’’ Marcel
Dekker, New York, 2000.
2. ‘‘Polypropylene Handbook,’’ E. P. Moore, Jr., Ed., Carl
Hanser, Verlag, Munich, 1996.
3. J. Huang, Z. Feng, H. Wang, Y. Qian, J. Sun, Y. Xu, W.
Chen, and G. Zheng, J. Mol. Catal., 189, 187 (2002).
4. E. Kolodka, W. J. Wang, S. Zhu, and A. Hamielec, J. Appl.
Polym. Sci., 92, 307 (2004).
5. H. Al-Hussein, G. R. Davies, and I. M. Ward, Polymer, 42,
3679 (2001).
6. M. J. Cran and S. W. Bigger, Appl. Spectrosc., 57, 928
(2003).
7. U. Niebergall, J. Bohse, B. L. Shurmann, S. Seidler, and
W. Grellmann, Polym. Eng. Sci., 39, 1109 (1999).
8. Q. Du and L. Wang, J. Polym. Sci., Polym. Phys. Ed., 27,
581 (1989).
9. M. M. Dumoulin and P. J. Carreau, Polym. Eng. Sci., 27,
1627 (1987).
10. P. Schmidt, J. Baldrian, J. Scudla, J. Dybal, M. Raab, and
K. J. Eichhorn, Polymer, 42, 5321 (2001).
11. A. C. Y. Wong and F. Lam, Polym. Test., 21, 691 (2002).
12. J. Li, R. A. Shanks, and Y. Long, J. Appl. Polym. Sci., 87,
1179 (2003).
13. J. Finlay, M. J. Hill, P. J. Barham, K. Byrne, and A.
Woogara, J. Polym. Sci., Part B: Polym. Phys., 41, 1384
(2003).
14. J. Li, R. A. Shanks, R. H. Olley, and G. R. Greemway,
Polymer, 42, 7685 (2001).
15. Z. Bartczak, A. Galeski, and M. Pracella, Polymer, 27, 537
(1986).
16. Y. Wang, B. Na, Q. Fu, and Y. Men, Polymer, 45, 207
(2004).
17. B. Lotz and J. C. Wittmann, J. Polym. Sci., Part B: Polym.
Phys., 25, 1079 (1987).
18. O. F. Noel III and J. F. Carley, Polym. Eng. Sci., 24, 488
(1984).
19. P. J. Hendra and J. K. Agbenyega, ‘‘The Raman Spectra of
Polymers,’’ John Wiley & Sons, Chichester, Sections D1 and
E2, 1993.
20. G. R. Strobl and W. Hagedorn, J. Polym. Sci., Part B:
Polym. Phys., 16, 1181 (1978).
21. A. Garton, D. N. Batchelder, and C. Cheng, Appl.
Spectrosc., 47, 922 (1993).
22. T. Furukawa, M. Watari, H. W. Siesler, and Y. Ozaki,
J. Appl. Polym. Sci., 87, 616 (2003).
23. K. Tashiro, S. Kariyo, A. Nishimori, T. Fujii, S. Saragai,
S. Nakamoto, T. Kawaguchi, A. Matsumoto, and O.
Rangsiman, J. Polym. Sci., Part B: Polym. Phys., 40, 495
(2002).
24. A. Gupper, P. Wilhelm, M. Schmied, S. G. Kazarian, K. L.
Chan, and J. Reubner, Appl. Spectrosc., 56, 1515 (2002).
25. H. Sato, S. Sasao, K. Matsukawa, Y. Kita, H. Yamaguchi,
H. W. Siesler, and Y. Ozaki, Macromol. Chem. Phys.,
204, 1351 (2003).
26. H. Sato, S. Sasao, K. Matsukawa, Y. Kita, T. Ikeda, H.
Tashiro, and Y. Ozaki, Appl. Spectrosc., 56, 1038 (2002).
27. M. F. S. Lima, M. A. Z. Vasconcellos, and D. Samios,
J. Polym. Sci., Part B: Polym. Phys., 40, 896 (2002).
28. L. Markwort and B. Kip, J. Appl. Polym. Sci., 61, 231
(1996).
29. R. Appel, T. W. Zerda, and W. H. Waddell, Appl.
Spectrosc., 54, 1559 (2000).
30. S. L. Quintana, P. Schmidt, J. Dybal, J. Kratochvil, J. M.
Pastor, and J. C. Merino, Polymer, 43, 5187 (2002).
31. R. L. Morgan, M. J. Hill, P. J. Barham, A. van der Pol,
B. J. Kip, R. Ottjes, and J. van Ruiten, Polymer, 42, 2121
(2001).
32. T. Sundell, H. Fagerholm, and H. Crozier, Polymer, 37,
3227 (1996).
33. M. C. Tobin, J. Phys. Chem., 64, 216 (1960).
T. FURUKAWA et al.
1136 Polym. J., Vol. 38, No. 11, 2006
Related Documents