134 MOLECULAR PHYLOGENETICS OF THE TODY-TYRANT AND FLATBILL ASSEMBLAGE OF TYRANT FLYCATCHERS (TYRANNIDAE) J G. T 1,2,3 J M. B 1 1 Department of Zoology, Field Museum of Natural History, Chicago, Illinois 60605, USA; and 2 Department of Biological Sciences, University of Illinois at Chicago, Chicago, Illinois 60607, USA A.—The tody-tyrant and flatbill assemblage, sensu Lanyon (1988a), includes 12 genera of tyrant flycatchers known variously as “tody-tyrants” and “flatbills.” Lanyon supported the monophyly of the group based on similar skull morphology and nest form, and built intergeneric relationships based on syringeal characters. However, these comparisons were made without a phylogenetic frame- work. A more recent study assessing relationships in the tyrant flycatchers using published morphological and behavioral data failed to recover monophyly of this assemblage (Birdsley 2002). Using DNA sequence data, we test for the monophyly of the tody-tyrant and flatbill assemblage and compare and contrast phylogenetic signals from mitochondrial and nuclear DNA character systems. We discuss our results in light of results from previous studies. We include representatives of the other major tyrant flycatcher assemblages for a total of 42 individuals (represent- ing 27 tyrannid genera and 36 species). We sequenced 3,022 base pairs (bp) of three mitochondrial genes (ND2, ND3, and cytochrome b) and one nuclear intron (FIB5). Our results resolve many of the basal relationships of the tody-tyrant and flatbill phylogeny, but separate and combined analyses of data partitions are necessary to understand the nature of conflict among data sets. The tody-tyrants constitute a monophyletic clade, but the genera Hemitriccus and Lophotriccus are not mono- phyletic, and the limits of Oncostoma–Lophotriccus need to be revised with more complete sampling at the species level. The flatbills as defined by Lanyon are not monophyletic (Onychorhynchus and Platyrinchus are not true flatbills). Pseudotriccus and Corythopis are sister taxa and, together with Leptopogon and Mionectes, are allied to the tody-tyrant and flatbill clade. Received 7 May 2005, accepted 12 January 2006. Key words: β-fibrinogen intron 5, cytochrome b, flatbills, mitochondrial DNA, ND2, ND3, nuclear DNA, phylogeny, tody-tyrants, Tyrannidae, tyrant flycatchers. Filogenia Molecular del Grupo de los Picochatos y Mosquiteros de la Familia Tyrannidae R.—El grupo de los picochatos y mosquiteros, sensu Lanyon (1988a), incluye a 12 géneros de la familia Tyrannidae conocidos en general como mosquiteros y picochatos. Lanyon apoyó la condición monofilética de este grupo basándose en la similitud de la morfología de sus cráneos y en la forma de sus nidos, y construyó relaciones inter-genéricas basándose en caracteres de la siringe. Sin embargo, estas comparaciones no fueron hechas en un contexto filogenético. Un estudio más reciente, que determinó las relaciones entre los Tyrannidae utilizando datos publicados de morfología y comportamiento, no consiguió detectar la condición monofilética de este grupo (Birdsley 2002). Utilizando datos de secuencia de ADN, probamos la condición monofilética del grupo de los picochatos y 3 Present address: Division of Vertebrate Zoology—Ornithology, American Museum of Natural History, Central Park West at 79th Street, New York, New York 10024, USA. E-mail: [email protected] The Auk 124(1):134–154, 2007 © The American Ornithologists’ Union, 2007. Printed in USA.

Welcome message from author
This document is posted to help you gain knowledge. Please leave a comment to let me know what you think about it! Share it to your friends and learn new things together.
Transcript
134
MOLECULAR PHYLOGENETICS OF THE TODY-TYRANT AND FLATBILL ASSEMBLAGE OF TYRANT FLYCATCHERS (TYRANNIDAE)
J��� G. T����1,2,3 ��� J��� M. B���1
1Department of Zoology, Field Museum of Natural History, Chicago, Illinois 60605, USA; and2Department of Biological Sciences, University of Illinois at Chicago, Chicago, Illinois 60607, USA
A����.—The tody-tyrant and fl atbill assemblage, sensu Lanyon (1988a), includes 12 genera of tyrant fl ycatchers known variously as “tody-tyrants” and “fl atbills.” Lanyon supported the monophyly of the group based on similar skull morphology and nest form, and built intergeneric relationships based on syringeal characters. However, these comparisons were made without a phylogenetic frame-work. A more recent study assessing relationships in the tyrant fl ycatchers using published morphological and behavioral data failed to recover monophyly of this assemblage (Birdsley 2002). Using DNA sequence data, we test for the monophyly of the tody-tyrant and fl atbill assemblage and compare and contrast phylogenetic signals from mitochondrial and nuclear DNA character systems. We discuss our results in light of results from previous studies. We include representatives of the other major tyrant fl ycatcher assemblages for a total of 42 individuals (represent-ing 27 tyrannid genera and 36 species). We sequenced 3,022 base pairs (bp) of three mitochondrial genes (ND2, ND3, and cytochrome b) and one nuclear intron (FIB5). Our results resolve many of the basal relationships of the tody-tyrant and fl atbill phylogeny, but separate and combined analyses of data partitions are necessary to understand the nature of confl ict among data sets. The tody-tyrants constitute a monophyletic clade, but the genera Hemitriccus and Lophotriccus are not mono-phyletic, and the limits of Oncostoma–Lophotriccus need to be revised with more complete sampling at the species level. The fl atbills as defi ned by Lanyon are not monophyletic (Onychorhynchus and Platyrinchus are not true fl atbills). Pseudotriccus and Corythopis are sister taxa and, together with Leptopogon and Mionectes, are allied to the tody-tyrant and fl atbill clade. Received 7 May 2005, accepted 12 January 2006.
Key words: β-fi brinogen intron 5, cytochrome b, fl atbills, mitochondrial DNA, ND2, ND3, nuclear DNA, phylogeny, tody-tyrants, Tyrannidae, tyrant fl ycatchers.
Filogenia Molecular del Grupo de los Picochatos y Mosquiteros de la Familia Tyrannidae
R������.—El grupo de los picochatos y mosquiteros, sensu Lanyon (1988a), incluye a 12 géneros de la familia Tyrannidae conocidos en general como mosquiteros y picochatos. Lanyon apoyó la condición monofi lética de este grupo basándose en la similitud de la morfología de sus cráneos y en la forma de sus nidos, y construyó relaciones inter-genéricas basándose en caracteres de la siringe. Sin embargo, estas comparaciones no fueron hechas en un contexto fi logenético. Un estudio más reciente, que determinó las relaciones entre los Tyrannidae utilizando datos publicados de morfología y comportamiento, no consiguió detectar la condición monofi lética de este grupo (Birdsley 2002). Utilizando datos de secuencia de ADN, probamos la condición monofi lética del grupo de los picochatos y
3Present address: Division of Vertebrate Zoology—Ornithology, American Museum of Natural History, Central Park West at 79th Street, New York, New York 10024, USA. E-mail: [email protected]
The Auk 124(1):134–154, 2007© The American Ornithologists’ Union, 2007. Printed in USA.
Tody-tyrant and Flatbill PhylogenyJanuary 2007] 135
T�� ���� ���������� (Aves, Tyrannidae) are the largest, most diverse primarily Neotropical family of suboscine passerines. The family is divided into 104 genera and 429 species (Traylor 1977, 1979; Stotz et al. 1996; Fitzpatrick et al. 2004). The tyrant fl ycatchers display a plethora of morphological forms in a range of ecological niches, which in other continents are occupied by members of many diff erent families (Fitzpatrick 1985). The great behavioral and ecological diversity observed in the tyran-nids present rich opportunities for comparative tests of evolutionary and ecological hypotheses (Cicero and Johnson 2002). However, many aspects of their taxonomy remain controversial, and well-supported hypotheses of intrafamil-ial relationships are lacking (Birdsley 2002, Fitzpatrick et al. 2004).
A recent treatment of the Tyrannidae (Fitzpatrick et al. 2004) suggests that the fam-ily consists of four subfamilies: three “typical” (Elaeniinae, Fluvicolinae, Tyranninae) and one “atypical” (Tityrinae). Within the Elaeniinae, Lanyon (1988a) suggested an assemblage formed by 12 genera (and 70 species) of tyrannids known variously as “tody-tyrants,” “pygmy-tyrants,” and “fl atbills.” Members of the tody-tyrant and fl atbill assemblage are char-acterized by their relatively fl at bills, which can vary from broad and swollen to narrower and spatulate in shape. Tody-tyrants (52 species) are small fl ycatchers, with proportionately long, somewhat fl a� ened bills, short rictal bristles, and elongated tarsi. All forage by upward strik-ing and build purse-like pendant nests. Flatbills (18 species) vary in size from small to medium;
they have broad, fl at bills, moderate to heavy rictal bristles, and fairly short, slender tarsi. Like the tody-tyrants, they forage almost exclu-sively by upward striking, and several taxa build purse-like pendant nests—with the excep-tion of spadebills (Platyrinchus spp.), which build cup-shaped nests, and royal fl ycatchers (Onychorhynchus spp.), which build long pensile nests (Traylor and Fitzpatrick 1982).
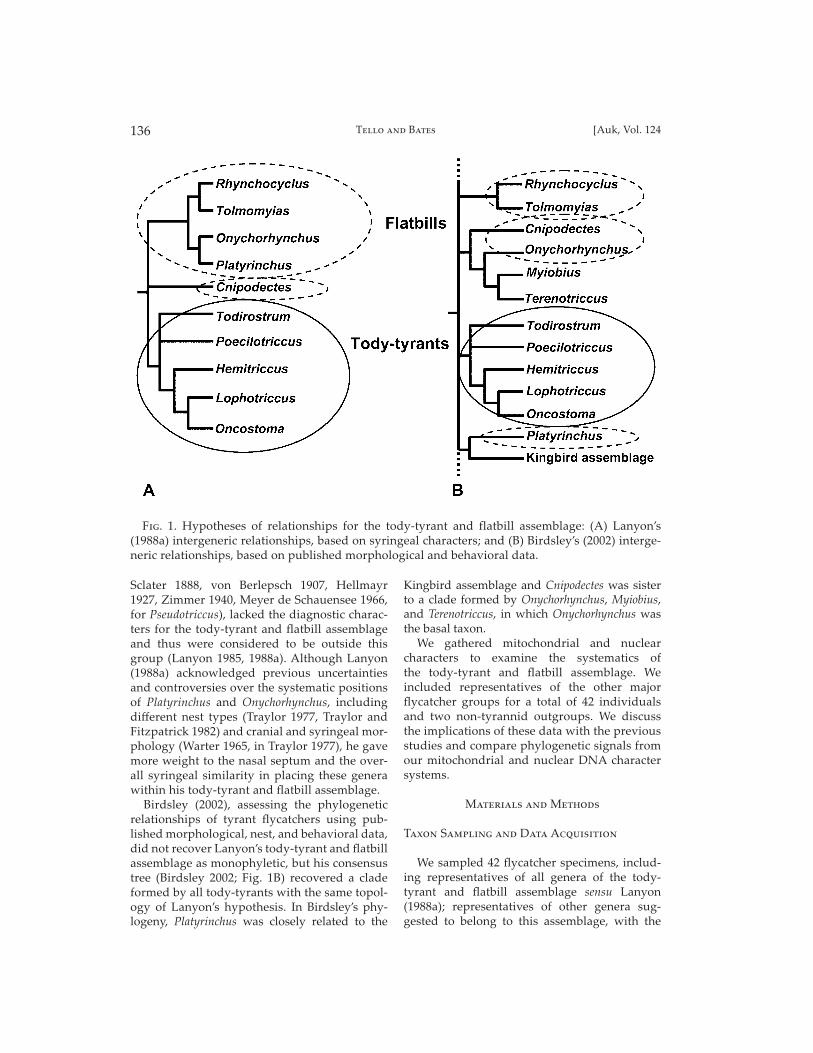
Lanyon (1988a) supported the monophyly of this assemblage on the basis of skull morphol-ogy (characters included a poorly ossifi ed nasal septum with no transverse trabecular plate, enlarged infraorbital fenestra, and supraorbital fenestra completely obliterated, or nearly so) and nest form (pendant nest, fully enclosed, with side entrance) and built intergeneric rela-tionships based on syringeal characters (Fig. 1A). However, these comparisons were done without an explicit phylogenetic framework. Lanyon (1988a) defi ned two primary lineages within the group: one composed of Todirostrum, Poecilotriccus, Hemitriccus (including Myiornis), Lophotriccus (including Atalotriccus), and Oncostoma; and the other composed of Rhynchocyclus, Tolmomyias, Onychorhynchus, and Platyrinchus. Cnipodectes did not fi t into either of these lineages, and the limits of Poecilotriccus were enlarged by Lanyon to encompass the “sylvia” species group included in the genus Todirostrum by Fitzpatrick (1976) and Traylor (1977, 1979). Two genera, Ramphotrigon and Pseudotriccus, previously considered to belong to the tody-tyrant and fl atbill assemblage (von Berlepsch 1907, Hellmayr 1927, Traylor 1977, Traylor and Fitzpatrick 1982, for Ramphotrigon;
mosquiteros, y comparamos y contrastamos las señales fi logenéticas de sistemas de caracteres de ADN mitocondrial y nuclear. Discutimos nuestros resultados a la luz de los resultados encontrados en estudios anteriores. Incluimos representantes de los principales grupos de Tyrannidae por un total de 42 individuos (representando a 27 géneros y 36 especies). Secuenciamos 3,022 pares de bases (pb) de tres genes de ADN mitocondrial (ND2, ND3, y citocromo b) y un intrón nuclear (FIB5). Nuestros resultados resuelven muchas de las relaciones basales de la fi logenia de los picochatos y mosquiteros. Sin embargo, se requieren análisis por separado y en combinación para entender la naturaleza del confl icto entre los sets de caracteres. Los mosquiteros constituyen un grupo monofi lético, pero los géneros Hemitriccus y Lophotriccus no son monofi léticos y los límites de Oncostoma–Lophotriccus deben ser revisados con un muestreo exhaustivo a nivel de especies. Los picochatos, como fueron defi nidos por Lanyon, no son un grupo monofi lético (Onychorhynchus y Platyrinchus no son picochatos verdaderos). Pseudotriccus y Corythopis son grupos hermanos y junto con Leptopogon y Mionectes están aliados al clado de los picochatos y mosquiteros.
T���� ��� B���136 [Auk, Vol. 124
Sclater 1888, von Berlepsch 1907, Hellmayr 1927, Zimmer 1940, Meyer de Schauensee 1966, for Pseudotriccus), lacked the diagnostic charac-ters for the tody-tyrant and fl atbill assemblage and thus were considered to be outside this group (Lanyon 1985, 1988a). Although Lanyon (1988a) acknowledged previous uncertainties and controversies over the systematic positions of Platyrinchus and Onychorhynchus, including diff erent nest types (Traylor 1977, Traylor and Fitzpatrick 1982) and cranial and syringeal mor-phology (Warter 1965, in Traylor 1977), he gave more weight to the nasal septum and the over-all syringeal similarity in placing these genera within his tody-tyrant and fl atbill assemblage.
Birdsley (2002), assessing the phylogenetic relationships of tyrant fl ycatchers using pub-lished morphological, nest, and behavioral data, did not recover Lanyon’s tody-tyrant and fl atbill assemblage as monophyletic, but his consensus tree (Birdsley 2002; Fig. 1B) recovered a clade formed by all tody-tyrants with the same topol-ogy of Lanyon’s hypothesis. In Birdsley’s phy-logeny, Platyrinchus was closely related to the
Kingbird assemblage and Cnipodectes was sister to a clade formed by Onychorhynchus, Myiobius, and Terenotriccus, in which Onychorhynchus was the basal taxon.
We gathered mitochondrial and nuclear characters to examine the systematics of the tody-tyrant and fl atbill assemblage. We included representatives of the other major fl ycatcher groups for a total of 42 individuals and two non-tyrannid outgroups. We discuss the implications of these data with the previous studies and compare phylogenetic signals from our mitochondrial and nuclear DNA character systems.
M������� ��� M�����
T���� S������� ��� D�� A���������
We sampled 42 fl ycatcher specimens, includ-ing representatives of all genera of the tody-tyrant and fl atbill assemblage sensu Lanyon (1988a); representatives of other genera sug-gested to belong to this assemblage, with the
F��. 1. Hypotheses of relationships for the tody-tyrant and flatbill assemblage: (A) Lanyon’s (1988a) intergeneric relationships, based on syringeal characters; and (B) Birdsley’s (2002) interge-neric relationships, based on published morphological and behavioral data.
Tody-tyrant and Flatbill PhylogenyJanuary 2007] 137
exception of the monotypic genus Taeniotriccus (Sclater 1888, von Berlepsch 1907, Hellmayr 1927, Zimmer 1940, Meyer de Schauensee 1966, Traylor 1977, Traylor and Fitzpatrick 1982); and representatives of the other major fl ycatcher groups, for a total of 27 tyrannid genera and 36 species (Appendix). Species names follow Sibley and Monroe (1990, 1993). Two non-tyrannid taxa, the Red-capped Manakin (Pipridae: Pipra men-talis) and the Gray Antbird (Thamnophilidae: Cercomacra cinerascens) (Irestedt et al. 2001, Chesser 2004), were used as outgroups for the analyses.
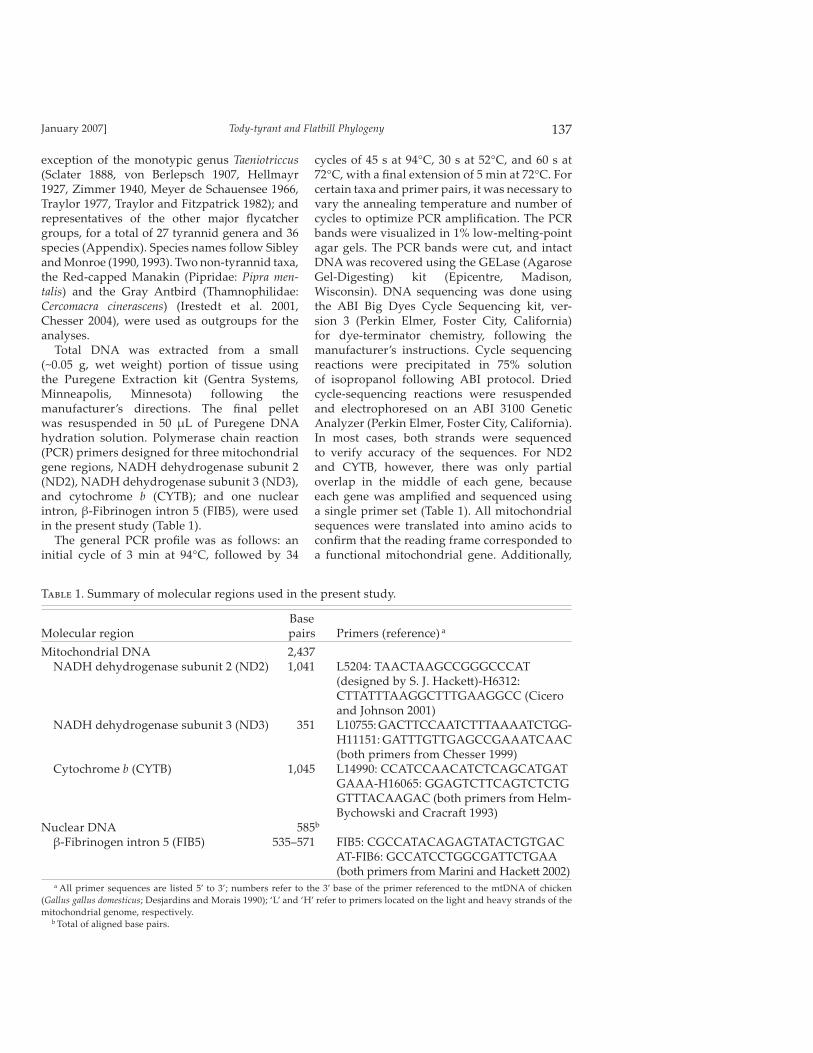
Total DNA was extracted from a small (~0.05 g, wet weight) portion of tissue using the Puregene Extraction kit (Gentra Systems, Minneapolis, Minnesota) following the manufacturer’s directions. The fi nal pellet was resuspended in 50 µL of Puregene DNA hydration solution. Polymerase chain reaction (PCR) primers designed for three mitochondrial gene regions, NADH dehydrogenase subunit 2 (ND2), NADH dehydrogenase subunit 3 (ND3), and cytochrome b (CYTB); and one nuclear intron, β-Fibrinogen intron 5 (FIB5), were used in the present study (Table 1).
The general PCR profi le was as follows: an initial cycle of 3 min at 94°C, followed by 34
cycles of 45 s at 94°C, 30 s at 52°C, and 60 s at 72°C, with a fi nal extension of 5 min at 72°C. For certain taxa and primer pairs, it was necessary to vary the annealing temperature and number of cycles to optimize PCR amplifi cation. The PCR bands were visualized in 1% low-melting-point agar gels. The PCR bands were cut, and intact DNA was recovered using the GELase (Agarose Gel-Digesting) kit (Epicentre, Madison, Wisconsin). DNA sequencing was done using the ABI Big Dyes Cycle Sequencing kit, ver-sion 3 (Perkin Elmer, Foster City, California) for dye-terminator chemistry, following the manufacturer’s instructions. Cycle sequencing reactions were precipitated in 75% solution of isopropanol following ABI protocol. Dried cycle-sequencing reactions were resuspended and electrophoresed on an ABI 3100 Genetic Analyzer (Perkin Elmer, Foster City, California). In most cases, both strands were sequenced to verify accuracy of the sequences. For ND2 and CYTB, however, there was only partial overlap in the middle of each gene, because each gene was amplifi ed and sequenced using a single primer set (Table 1). All mitochondrial sequences were translated into amino acids to confi rm that the reading frame corresponded to a functional mitochondrial gene. Additionally,
T��� 1. Summary of molecular regions used in the present study.
BaseMolecular region pairs Primers (reference) a
Mitochondrial DNA 2,437 NADH dehydrogenase subunit 2 (ND2) 1,041 L5204: TAACTAAGCCGGGCCCAT (designed by S. J. Hacke� )-H6312: CTTATTTAAGGCTTTGAAGGCC (Cicero and Johnson 2001) NADH dehydrogenase subunit 3 (ND3) 351 L10755: GACTTCCAATCTTTAAAATCTGG- H11151: GATTTGTTGAGCCGAAATCAAC (both primers from Chesser 1999) Cytochrome b (CYTB) 1,045 L14990: CCATCCAACATCTCAGCATGAT GAAA-H16065: GGAGTCTTCAGTCTCTG GTTTACAAGAC (both primers from Helm- Bychowski and Cracra� 1993)Nuclear DNA 585b β-Fibrinogen intron 5 (FIB5) 535–571 FIB5: CGCCATACAGAGTATACTGTGAC AT-FIB6: GCCATCCTGGCGATTCTGAA (both primers from Marini and Hacke� 2002)
a All primer sequences are listed 5’ to 3’; numbers refer to the 3’ base of the primer referenced to the mtDNA of chicken (Gallus gallus domesticus; Desjardins and Morais 1990); ‘L’ and ‘H’ refer to primers located on the light and heavy strands of the mitochondrial genome, respectively.
b Total of aligned base pairs.
T���� ��� B���138 [Auk, Vol. 124
plots of overall pairwise genetic diff erences among mitochondrial genes and the nuclear intron were constructed to identify outliers that could represent nuclear copies in the mito-chondrial data set (not shown). Where there was concern, DNA cloning was used to verify the mitochondrial nature of the sequences (Hillis et al. 1996), none of which gave results demonstrating the presence of nuclear copies. Saturation was assessed graphically using satu-ration plots of fi rst-, second-, and third-position partitions, for both transitions and transver-sions (Hacke� 1996).
S������� A�������
Mitochondrial DNA sequences were aligned to the ND2, ND3, and CYTB sequences of chicken (Gallus gallus domesticus; Desjardins and Morais 1990) using SEQUENCHER, version 4.1 (Genecodes, Ann Arbor, Michigan) and checked by eye. β-Fibrinogen intron 5 sequences were aligned to each other and checked by eye to identify gap locations in the intron sequences and to fi nd areas of ambiguous alignments (those regions characterized by the presence of gaps with uncertain positions, no ma� er which optimization criterion was used) in the nuclear data set. Final alignments of the nuclear sequences were done by eye (available from J.G.T.). Sequences were deposited in GeneBank (access numbers DQ294403–DQ294577).
P���������� A�������
Phylogenetic analyses were conducted using maximum parsimony (MP), maximum likelihood (ML), and Bayesian inference (BI) methods. The MP analyses were done using PAUP* (Swoff ord 2002). All searches were heuristic, with default options (keep best trees only, stepwise addition, swap on best starting trees only, hold one tree at each step, TBR branch-swapping, MULTREES, swap on best trees only), except that SETMAXTREES was set to 500, with an auto-increase by 100 for 100 random-addition sequence repli-cates. Phylogenies of the diff erent molecular data sets were estimated using separate and combined analyses. For the mitochondrial genes, parsimony analyses were conducted using weighted characters using a stepma-trix created with STMATRIX, version 2.2
(see Acknowledgments), which calculates the probabilities of reciprocal changes from one state to another and converts them to a cost of changes using the negative natural logarithm of the probability (Felsenstein 1981, Wheeler 1990). For the nuclear intron, regions of ambiguous alignment were incorporated in the phylogenetic analyses, following Lutzoni et al. (2000), as implemented in INAASE (see Acknowledgments). With this method, each ambiguous region is unequivocally coded as a new character, replacing its respective ambigu-ous region; then each coded character is sub-jected to a specifi c step matrix to account for the diff erential number of changes needed to transform one sequence into another (Lutzoni et al. 2000). The phylogenetic information of deletions present at regions of unambiguous alignment was preserved by creating additional binary characters that coded for the presence or absence of informative deletions in the data set. Support for nodes in the trees was esti-mated using bootstrapping (Felsenstein 1985). Bootstrap indices were generated in PAUP* from 100 bootstrap replicates. The contribu-tion of each data partition to the overall node support of the simultaneous analysis was cal-culated using the “Partitioned Bremer Support Indices” option (Baker and DeSalle 1997, Baker et al. 1998) implemented in TREEROT, version 2 (Sorenson 1999). Bremer support indices (BPS) were generated in PAUP* from a command fi le generated by TREEROT using 100-replicate heuristic searches with random addition of taxa for each constraint statement.
For ML analyses, the Akaike information criterion (AIC; Akaike 1974, Hasegawa 1990) implemented in MODELTEST, version 3.5 (Posada and Crandall 1998) was used to fi nd the model of DNA evolution that does not result in a signifi cant increase in likelihood scores. Maximum-likelihood searches were performed in PAUP*, using the best model of evolution and parameters (base frequencies, matrix of substitution types, proportion of invariant sites, and shape of gamma distribu-tion) suggested by MODELTEST. One hundred addition sequence replicates were performed using heuristic searches with TBR branch swapping, and performed with the neighbor-joining starting trees and other se� ings similar to those used in the MP runs. Bootstrap sup-ports for the ML analyses were obtained using
Tody-tyrant and Flatbill PhylogenyJanuary 2007] 139
PHYML (Guindon and Gascuel 2003). The PHYML program implements a hill-climbing algorithm that adjusts tree topology and branch length simultaneously, which permits analysis of large data sets in a comparatively short time (Guindon and Gascuel 2003). Parameters for each of the four genes and the combined data sets were estimated from the ML tree using PAUP*. Maximum-likelihood searches as implemented in PAUP* have the limitation of being restricted to a single model of evolution, which precludes exploring the eff ects of apply-ing diff erent models to each data partition. This may be particularly important when com-bining data from diff erent molecular systems in which the models of molecular evolution may be quite diff erent because of diff erences in the evolutionary process. Bayesian inference analysis, as implemented in MRBAYES, version 3.0b4 (Huelsenbeck and Ronquist 2001), allows the implementation of multiple model se� ings. Thus, BI analysis was used for tree search-ing and node support through estimation of Bayesian posterior probabilities (Rannala and Yang 1996, Yang and Rannala 1997). The Metropolis-coupled Markov chain Monte Carlo (MCMCMC) sampling was performed, with four incrementally heated chains, starting from a random tree that was simultaneously run for 2 million generations, using the default priors as starting values for the model param-eters. Bayesian posterior probabilities were obtained from the 50% majority rule consensus of all trees retained a� er discarding those trees representing a “burn-in” period, which was determined graphically. Posterior probability values were considered statistically signifi cant when P ≥ 0.95. Every analysis was repeated twice (starting from diff erent, randomly cho-sen trees) to check for potentially poor mixing of MCMCMC sampling. Independent analyses were considered to have converged if their log-likelihood values approached similar mean values. Finally, visual comparisons of the posterior probabilities of the independent runs were done to ensure congruence of the analyses. Bayesian runs were conducted using a four-partition model se� ing (each gene separated: ND2, ND3, CYTB, FIB5), allow-ing all parameters to be partitioned by a rate multiplier (i.e., using the unlink command in MRBAYES; Ronquist and Huelsenbeck 2003, Nylander et al. 2004).
C��������� ����� D�� P�������
Diff erences in phylogenetic signal between data partitions (in terms of both genes and genetic system) were tested using the incon-gruence length diff erence (ILD) test (Farris et al. 1995a, b) implemented in PAUP* (the “partition homogeneity test”). The results of these tests were used to investigate confl ict-ing phylogenetic signals in the diff erent data partitions (but see Barker and Lutzoni 2002). We also tested for congruence between major data partitions (mitochondrial and nuclear) by inspecting bootstrap scores ≥70% and posterior probabilities ≥0.95 resulting from the MP and ML–BI analyses, respectively (Mason-Gamer and Kellog 1996). Nodes with bootstrap sup-port ≥70% and posterior probabilities ≥0.95 supporting two diff erent phylogenetic rela-tionships in two diff erent partitions were con-sidered incongruent.
R�����
S��������� A�������
The fi nal mitochondrial DNA (mtDNA) alignment included a total of 2,437 base pairs (bp) (Table 1). Alignment of mtDNA sequences was straightforward because, as expected, no insertions or deletions were present. In con-trast to mtDNA, the length of the nuclear FIB5 sequences varied from 535 bp in Hemitriccus margaritaceiventer to 571 bp in Platyrinchus platyrhynchos. The total length of the FIB5 alignment was 585 bp, and indel regions inferred from aligned sequences varied from 1 to 25 bp. Two regions of ambiguous align-ment were identifi ed, and their sizes were 43 and 4 bp, respectively. Because insertions and deletions (indels) were infrequent, the overall alignment did not appear to be compromised. Seven of these indels at regions of unambigu-ous alignment were coded as additional binary characters to preserve their phylogenetic infor-mation. A� empts to amplify the FIB5 for one of the two samples of Cnipodectes subbrunneus (ANSP 5887) failed; thus, nuclear sequences of this specimen were not included in the analyses. The fi nal alignment of the combined mitochondrial and nuclear data sets included a total of 3,022 bp.
T���� ��� B���140 [Auk, Vol. 124
G��� P��������
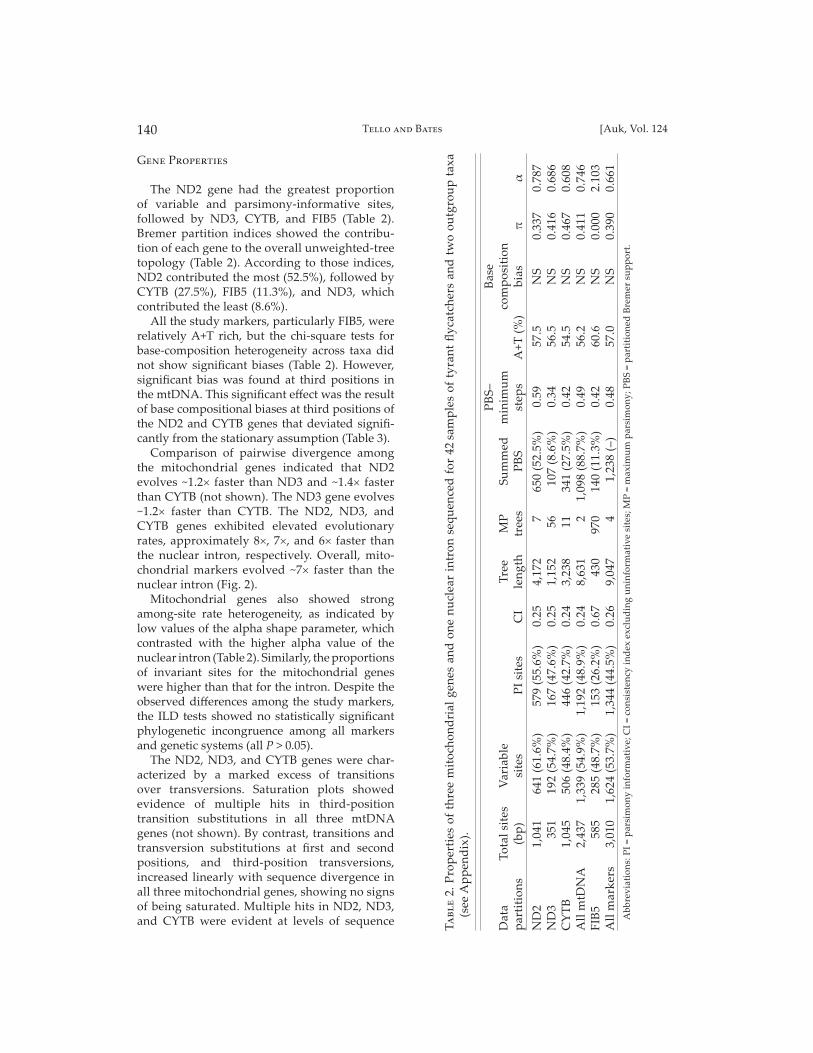
The ND2 gene had the greatest proportion of variable and parsimony-informative sites, followed by ND3, CYTB, and FIB5 (Table 2). Bremer partition indices showed the contribu-tion of each gene to the overall unweighted-tree topology (Table 2). According to those indices, ND2 contributed the most (52.5%), followed by CYTB (27.5%), FIB5 (11.3%), and ND3, which contributed the least (8.6%).
All the study markers, particularly FIB5, were relatively A+T rich, but the chi-square tests for base-composition heterogeneity across taxa did not show signifi cant biases (Table 2). However, signifi cant bias was found at third positions in the mtDNA. This signifi cant eff ect was the result of base compositional biases at third positions of the ND2 and CYTB genes that deviated signifi -cantly from the stationary assumption (Table 3).
Comparison of pairwise divergence among the mitochondrial genes indicated that ND2 evolves ~1.2× faster than ND3 and ~1.4× faster than CYTB (not shown). The ND3 gene evolves ~1.2× faster than CYTB. The ND2, ND3, and CYTB genes exhibited elevated evolutionary rates, approximately 8×, 7×, and 6× faster than the nuclear intron, respectively. Overall, mito-chondrial markers evolved ~7× faster than the nuclear intron (Fig. 2).
Mitochondrial genes also showed strong among-site rate heterogeneity, as indicated by low values of the alpha shape parameter, which contrasted with the higher alpha value of the nuclear intron (Table 2). Similarly, the proportions of invariant sites for the mitochondrial genes were higher than that for the intron. Despite the observed diff erences among the study markers, the ILD tests showed no statistically signifi cant phylogenetic incongruence among all markers and genetic systems (all P > 0.05).
The ND2, ND3, and CYTB genes were char-acterized by a marked excess of transitions over transversions. Saturation plots showed evidence of multiple hits in third-position transition substitutions in all three mtDNA genes (not shown). By contrast, transitions and transversion substitutions at fi rst and second positions, and third-position transversions, increased linearly with sequence divergence in all three mitochondrial genes, showing no signs of being saturated. Multiple hits in ND2, ND3, and CYTB were evident at levels of sequence T��
� 2.
Pro
per
ties
of
thre
e m
itoc
hond
rial
gen
es a
nd o
ne n
ucl
ear
intr
on s
equ
ence
d f
or 4
2 sam
ple
s of
tyr
ant
fl yc
atch
ers
and
tw
o ou
tgro
up
tax
a (s
ee A
pp
end
ix).
PB
S–
B
ase
Dat
a To
tal s
ites
V
aria
ble
Tree
M
P Su
mm
ed
min
imu
m
co
mp
osit
ion
par
titi
ons
(bp
) si
tes
PI
site
s C
I le
ngth
tr
ees
PB
S st
eps
A+T
(%
) bi
as
π
α
ND
2 1,
041
641
(61.
6%)
579
(55.
6%)
0.25
4,
172
7 65
0 (5
2.5%
) 0.
59
57.5
N
S 0.
337
0.78
7N
D3
351
192
(54.
7%)
167
(47.
6%)
0.25
1,
152
56
107
(8.6
%)
0.34
56
.5
NS
0.41
6 0.
686
CY
TB
1,
045
506
(48.
4%)
446
(42.
7%)
0.24
3,
238
11
341
(27.
5%)
0.42
54
.5
NS
0.46
7 0.
608
All
mtD
NA
2,
437
1,33
9 (5
4.9%
) 1,
192
(48.
9%)
0.24
8,
631
2 1,
098
(88.
7%)
0.49
56
.2
NS
0.41
1 0.
746
FIB
5 58
5 28
5 (4
8.7%
) 15
3 (2
6.2%
) 0.
67
430
970
140
(11.
3%)
0.42
60
.6
NS
0.00
0 2.
103
All
mar
kers
3,
010
1,62
4 (5
3.7%
) 1,
344
(44.
5%)
0.26
9,
047
4 1,
238
(–)
0.48
57
.0
NS
0.39
0 0.
661
Abb
revi
atio
ns: P
I =
par
sim
ony
info
rmat
ive;
CI
= co
nsis
tenc
y in
dex
exc
lud
ing
uni
nfor
mat
ive
site
s; M
P =
max
imu
m p
arsi
mon
y; P
BS
= p
arti
tion
ed B
rem
er s
up
por
t.
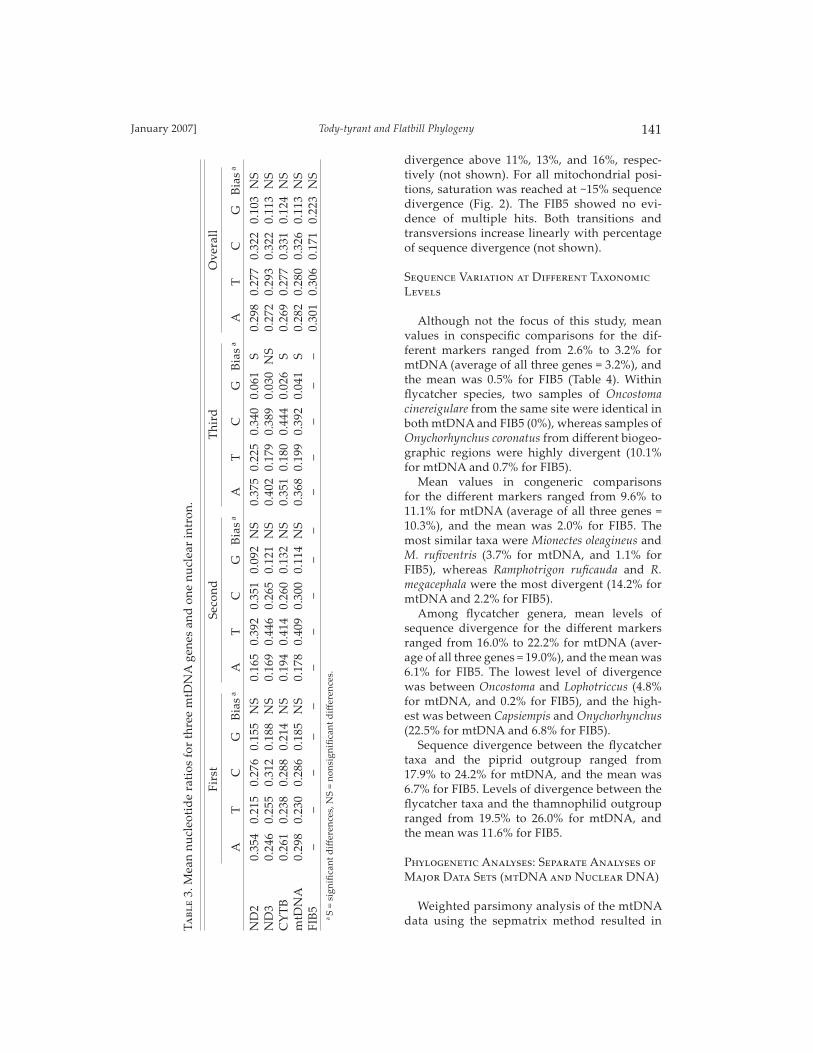
Tody-tyrant and Flatbill PhylogenyJanuary 2007] 141
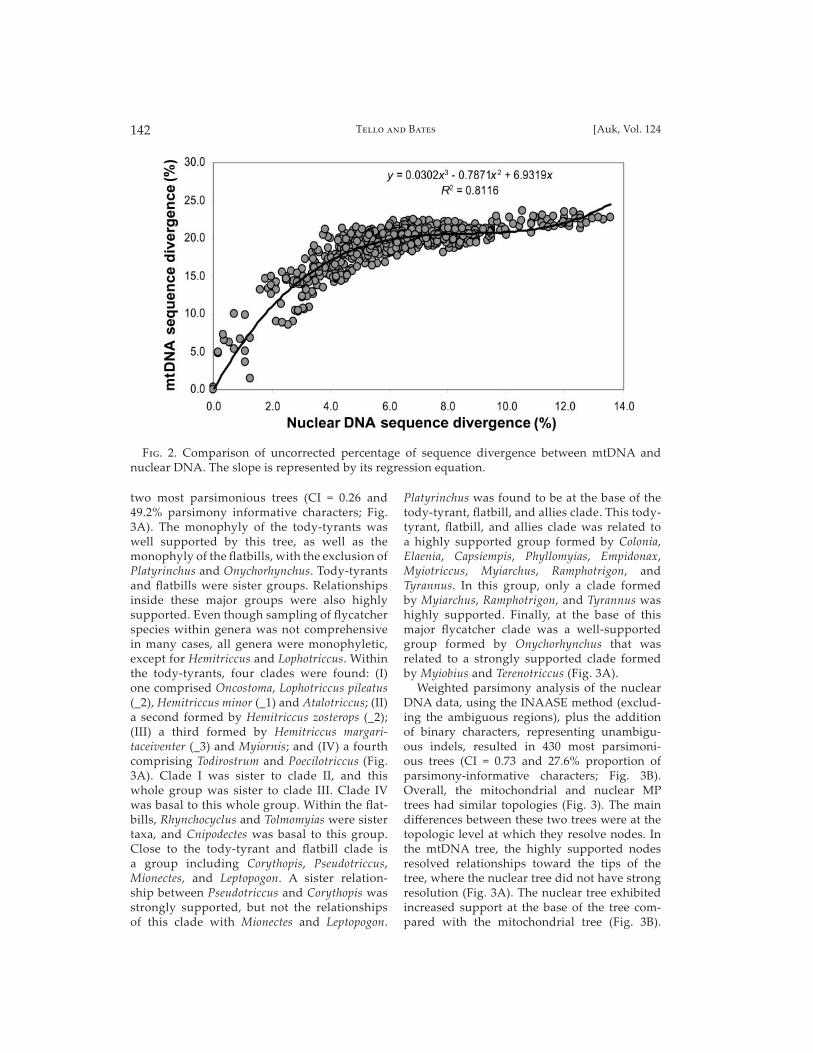
divergence above 11%, 13%, and 16%, respec-tively (not shown). For all mitochondrial posi-tions, saturation was reached at ~15% sequence divergence (Fig. 2). The FIB5 showed no evi-dence of multiple hits. Both transitions and transversions increase linearly with percentage of sequence divergence (not shown).
S������� V������� � D������� T�������� L�����
Although not the focus of this study, mean values in conspecifi c comparisons for the dif-ferent markers ranged from 2.6% to 3.2% for mtDNA (average of all three genes = 3.2%), and the mean was 0.5% for FIB5 (Table 4). Within fl ycatcher species, two samples of Oncostoma cinereigulare from the same site were identical in both mtDNA and FIB5 (0%), whereas samples of Onychorhynchus coronatus from diff erent biogeo-graphic regions were highly divergent (10.1% for mtDNA and 0.7% for FIB5).
Mean values in congeneric comparisons for the diff erent markers ranged from 9.6% to 11.1% for mtDNA (average of all three genes = 10.3%), and the mean was 2.0% for FIB5. The most similar taxa were Mionectes oleagineus and M. rufi ventris (3.7% for mtDNA, and 1.1% for FIB5), whereas Ramphotrigon rufi cauda and R. megacephala were the most divergent (14.2% for mtDNA and 2.2% for FIB5).
Among fl ycatcher genera, mean levels of sequence divergence for the diff erent markers ranged from 16.0% to 22.2% for mtDNA (aver-age of all three genes = 19.0%), and the mean was 6.1% for FIB5. The lowest level of divergence was between Oncostoma and Lophotriccus (4.8% for mtDNA, and 0.2% for FIB5), and the high-est was between Capsiempis and Onychorhynchus (22.5% for mtDNA and 6.8% for FIB5).
Sequence divergence between the fl ycatcher taxa and the piprid outgroup ranged from 17.9% to 24.2% for mtDNA, and the mean was 6.7% for FIB5. Levels of divergence between the fl ycatcher taxa and the thamnophilid outgroup ranged from 19.5% to 26.0% for mtDNA, and the mean was 11.6% for FIB5.
P���������� A�������: S������ A������� �� M���� D�� S�� (�DNA ��� N������ DNA)
Weighted parsimony analysis of the mtDNA data using the sepmatrix method resulted in T�
��
3. M
ean
nucl
eoti
de
rati
os f
or t
hree
mtD
NA
gen
es a
nd o
ne n
ucl
ear
intr
on.
Fi
rst
Seco
nd
Thi
rd
Ove
rall
A
T
C
G
B
ias a
A
T
C
G
B
ias a
A
T
C
G
B
ias a
A
T
C
G
B
ias a
ND
2 0.
354
0.21
5 0.
276
0.15
5 N
S 0.
165
0.39
2 0.
351
0.09
2 N
S 0.
375
0.22
5 0.
340
0.06
1 S
0.29
8 0.
277
0.32
2 0.
103
NS
ND
3 0.
246
0.25
5 0.
312
0.18
8 N
S 0.
169
0.44
6 0.
265
0.12
1 N
S 0.
402
0.17
9 0.
389
0.03
0 N
S 0.
272
0.29
3 0.
322
0.11
3 N
SC
YT
B
0.26
1 0.
238
0.28
8 0.
214
NS
0.19
4 0.
414
0.26
0 0.
132
NS
0.35
1 0.
180
0.44
4 0.
026
S 0.
269
0.27
7 0.
331
0.12
4 N
Sm
tDN
A
0.29
8 0.
230
0.28
6 0.
185
NS
0.17
8 0.
409
0.30
0 0.
114
NS
0.36
8 0.
199
0.39
2 0.
041
S 0.
282
0.28
0 0.
326
0.11
3 N
SFI
B5
– –
– –
– –
– –
– –
– –
– –
– 0.
301
0.30
6 0.
171
0.22
3 N
Sa
S =
sign
ifi c
ant
diff
ere
nce
s, N
S =
nons
igni
fi ca
nt d
iff e
renc
es.
T���� ��� B���142 [Auk, Vol. 124
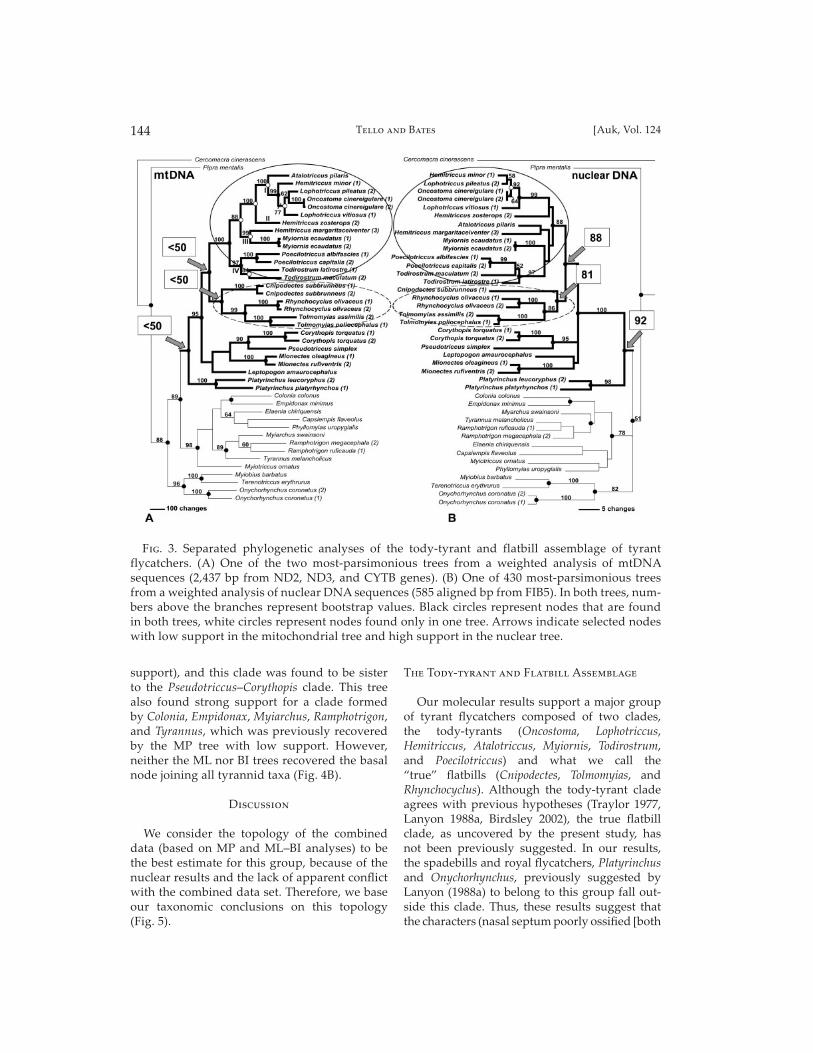
two most parsimonious trees (CI = 0.26 and 49.2% parsimony informative characters; Fig. 3A). The monophyly of the tody-tyrants was well supported by this tree, as well as the monophyly of the fl atbills, with the exclusion of Platyrinchus and Onychorhynchus. Tody-tyrants and fl atbills were sister groups. Relationships inside these major groups were also highly supported. Even though sampling of fl ycatcher species within genera was not comprehensive in many cases, all genera were monophyletic, except for Hemitriccus and Lophotriccus. Within the tody-tyrants, four clades were found: (I) one comprised Oncostoma, Lophotriccus pileatus (_2), Hemitriccus minor (_1) and Atalotriccus; (II) a second formed by Hemitriccus zosterops (_2); (III) a third formed by Hemitriccus margari-taceiventer (_3) and Myiornis; and (IV) a fourth comprising Todirostrum and Poecilotriccus (Fig. 3A). Clade I was sister to clade II, and this whole group was sister to clade III. Clade IV was basal to this whole group. Within the fl at-bills, Rhynchocyclus and Tolmomyias were sister taxa, and Cnipodectes was basal to this group. Close to the tody-tyrant and fl atbill clade is a group including Corythopis, Pseudotriccus, Mionectes, and Leptopogon. A sister relation-ship between Pseudotriccus and Corythopis was strongly supported, but not the relationships of this clade with Mionectes and Leptopogon.
Platyrinchus was found to be at the base of the tody-tyrant, fl atbill, and allies clade. This tody-tyrant, fl atbill, and allies clade was related to a highly supported group formed by Colonia, Elaenia, Capsiempis, Phyllomyias, Empidonax, Myiotriccus, Myiarchus, Ramphotrigon, and Tyrannus. In this group, only a clade formed by Myiarchus, Ramphotrigon, and Tyrannus was highly supported. Finally, at the base of this major fl ycatcher clade was a well-supported group formed by Onychorhynchus that was related to a strongly supported clade formed by Myiobius and Terenotriccus (Fig. 3A).
Weighted parsimony analysis of the nuclear DNA data, using the INAASE method (exclud-ing the ambiguous regions), plus the addition of binary characters, representing unambigu-ous indels, resulted in 430 most parsimoni-ous trees (CI = 0.73 and 27.6% proportion of parsimony-informative characters; Fig. 3B). Overall, the mitochondrial and nuclear MP trees had similar topologies (Fig. 3). The main diff erences between these two trees were at the topologic level at which they resolve nodes. In the mtDNA tree, the highly supported nodes resolved relationships toward the tips of the tree, where the nuclear tree did not have strong resolution (Fig. 3A). The nuclear tree exhibited increased support at the base of the tree com-pared with the mitochondrial tree (Fig. 3B).
F��. 2. Comparison of uncorrected percentage of sequence divergence between mtDNA and nuclear DNA. The slope is represented by its regression equation.
Tody-tyrant and Flatbill PhylogenyJanuary 2007] 143
This could be observed at three diff erent places in the nuclear topology: (1) the node joining Cnipodectes with the Rhynchocyclus–Tolmomyias clade; (2) the node joining the “true” fl atbills to the tody-tyrants; and (3) the node joining Platyrinchus to the tody-tyrant, fl atbill, and allies clade. Overall, there was no evidence of statistically signifi cant phylogenetic incongru-ence among the two major data sets (ILD test, P > 0.05). This is further supported by the lack of confl ictive nodes (i.e., those supporting two diff erent phylogenetic relationships in the two major data partitions; Fig. 3).
P���������� A�������: C������ A������� �� M���� D�� S�� (�DNA ��� N������ DNA)
Maximum parsimony.—The weighted MP analysis (stepmatrix for mtDNA and INAASE method, plus addition of binary indel charac-ters for nuclear DNA) of the combined mtDNA and nuclear DNA data resulted in one most-parsimonious tree, 45.0% of the characters were parsimony-informative, and 63.4% of its nodes have >70% bootstrap support (Fig. 4A). With the exception of three poorly supported nodes outside the tody-tyrant, fl atbill, and allies clade, the topology of this tree was similar to that of the mtDNA tree. Three nodes strongly supported by the nuclear DNA data did not get high support in the combined data set (Fig. 5). Nodes with li� le support from either mtDNA or nuclear DNA did not get strong support in the combined analyses, with the exception of one node, which was outside of the tody-tyrants and fl atbills.
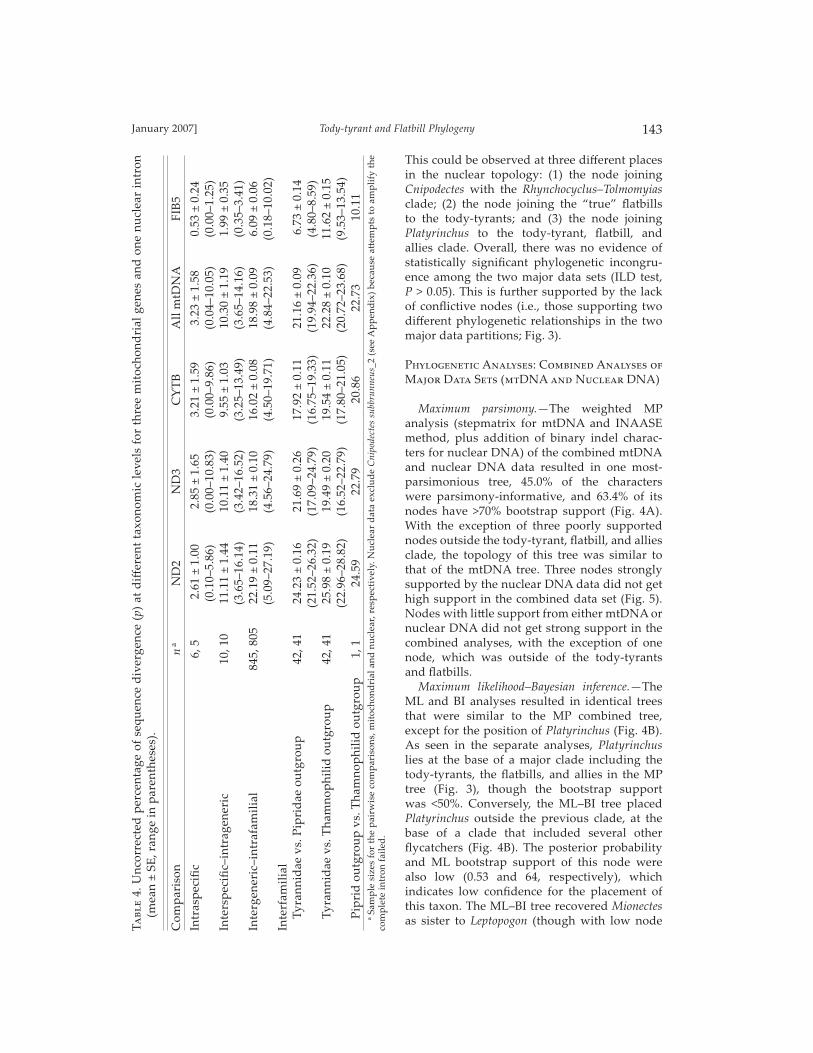
Maximum likelihood–Bayesian inference.—The ML and BI analyses resulted in identical trees that were similar to the MP combined tree, except for the position of Platyrinchus (Fig. 4B). As seen in the separate analyses, Platyrinchus lies at the base of a major clade including the tody-tyrants, the fl atbills, and allies in the MP tree (Fig. 3), though the bootstrap support was <50%. Conversely, the ML–BI tree placed Platyrinchus outside the previous clade, at the base of a clade that included several other fl ycatchers (Fig. 4B). The posterior probability and ML bootstrap support of this node were also low (0.53 and 64, respectively), which indicates low confi dence for the placement of this taxon. The ML–BI tree recovered Mionectes as sister to Leptopogon (though with low node T�
��
4. U
ncor
rect
ed p
erce
ntag
e of
seq
uen
ce d
iver
genc
e (p
) at
diff
ere
nt t
axon
omic
lev
els
for
thre
e m
itoc
hond
rial
gen
es a
nd o
ne n
ucl
ear
intr
on
(mea
n ±
SE, r
ange
in p
aren
thes
es).
Com
par
ison
n
a N
D2
ND
3 C
YT
B
All
mtD
NA
FI
B5
Intr
asp
ecifi
c
6, 5
2
.61
± 1.
00
2.85
± 1
.65
3.21
± 1
.59
3.23
± 1
.58
0.53
± 0
.24
(0.1
0–5.
86)
(0.0
0–10
.83)
(0
.00–
9.86
) (0
.04–
10.0
5)
(0.0
0–1.
25)
Inte
rsp
ecifi
c–i
ntra
gene
ric
10, 1
0 11
.11
± 1.
44
10.1
1 ±
1.40
9.
55 ±
1.0
3 10
.30
± 1.
19
1.99
± 0
.35
(3.6
5–16
.14)
(3
.42–
16.5
2)
(3.2
5–13
.49)
(3
.65–
14.1
6)
(0.3
5–3.
41)
Inte
rgen
eric
–int
rafa
mil
ial
845,
805
22
.19
± 0.
11
18.3
1 ±
0.10
16
.02
± 0.
08
18.9
8 ±
0.09
6.
09 ±
0.0
6
(5
.09–
27.1
9)
(4.5
6–24
.79)
(4
.50–
19.7
1)
(4.8
4–22
.53)
(0
.18–
10.0
2)In
terf
amil
ial
Ty
rann
idae
vs.
Pip
rid
ae o
utg
rou
p
42, 4
1 24
.23
± 0.
16
21.6
9 ±
0.26
17
.92
± 0.
11
21.1
6 ±
0.09
6
.73
± 0.
14
(2
1.52
–26.
32)
(17.
09–2
4.79
) (1
6.75
–19.
33)
(19.
94–2
2.36
) (4
.80–
8.59
)
Tyra
nnid
ae v
s. T
ham
nop
hili
d o
utg
rou
p
42, 4
1 25
.98
± 0.
19
19.4
9 ±
0.20
19
.54
± 0.
11
22.2
8 ±
0.10
11
.62
± 0.
15
(2
2.96
–28.
82)
(16.
52–2
2.79
) (1
7.80
–21.
05)
(20.
72–2
3.68
) (9
.53–
13.5
4)
Pip
rid
ou
tgro
up
vs.
Tha
mno
phi
lid
ou
tgro
up
1,
1
24.5
9 22
.79
20.8
6 22
.73
10.
11a
Sam
ple
siz
es f
or t
he p
airw
ise
com
par
ison
s, m
itoc
hon
dri
al a
nd n
ucl
ear,
res
pec
tive
ly. N
ucl
ear
dat
a ex
clu
de
Cn
ipod
ecte
s su
bbru
nn
eus_
2 (s
ee A
pp
end
ix)
beca
use
a�
emp
ts t
o am
pli
fy t
he
com
ple
te in
tron
fai
led
.
T���� ��� B���144 [Auk, Vol. 124
support), and this clade was found to be sister to the Pseudotriccus–Corythopis clade. This tree also found strong support for a clade formed by Colonia, Empidonax, Myiarchus, Ramphotrigon, and Tyrannus, which was previously recovered by the MP tree with low support. However, neither the ML nor BI trees recovered the basal node joining all tyrannid taxa (Fig. 4B).
D���������
We consider the topology of the combined data (based on MP and ML–BI analyses) to be the best estimate for this group, because of the nuclear results and the lack of apparent confl ict with the combined data set. Therefore, we base our taxonomic conclusions on this topology (Fig. 5).
T�� T���-���� ��� F����� A��������
Our molecular results support a major group of tyrant fl ycatchers composed of two clades, the tody-tyrants (Oncostoma, Lophotriccus, Hemitriccus, Atalotriccus, Myiornis, Todirostrum, and Poecilotriccus) and what we call the “true” fl atbills (Cnipodectes, Tolmomyias, and Rhynchocyclus). Although the tody-tyrant clade agrees with previous hypotheses (Traylor 1977, Lanyon 1988a, Birdsley 2002), the true fl atbill clade, as uncovered by the present study, has not been previously suggested. In our results, the spadebills and royal fl ycatchers, Platyrinchus and Onychorhynchus, previously suggested by Lanyon (1988a) to belong to this group fall out-side this clade. Thus, these results suggest that the characters (nasal septum poorly ossifi ed [both
F��. 3. Separated phylogenetic analyses of the tody-tyrant and flatbill assemblage of tyrant flycatchers. (A) One of the two most-parsimonious trees from a weighted analysis of mtDNA sequences (2,437 bp from ND2, ND3, and CYTB genes). (B) One of 430 most-parsimonious trees from a weighted analysis of nuclear DNA sequences (585 aligned bp from FIB5). In both trees, num-bers above the branches represent bootstrap values. Black circles represent nodes that are found in both trees, white circles represent nodes found only in one tree. Arrows indicate selected nodes with low support in the mitochondrial tree and high support in the nuclear tree.

Tody-tyrant and Flatbill PhylogenyJanuary 2007] 145
taxa] and long pendant nest in Onychorhynchus) used by Lanyon (1988a) to support the inclusion of these two genera in his tody-tyrant and fl atbill assemblage are convergent.
T�� T���-���� C����
The tody-tyrants were grouped in three, per-haps four, clades, with two genera being non-monophyletic: clade I, comprising Oncostoma, Lophotriccus_2 (pileatus), Lophotriccus_1 (vitiosus), Hemitriccus_1 (minor), and Atalotriccus; clade II, formed by Hemitriccus_2 (zosterops); clade III, comprising Hemitriccus_3 (margaritaceiventer) and Myiornis; and clade IV, comprising Todirostrum
and Poecilotriccus. Clade I was sister to clade II, and this whole group was sister to clade III. Clade IV was basal to this whole group (Fig. 5).
Within clade I, Oncostoma was embedded within Lophotriccus, Hemitriccus_1 (minor) was sister to the Lophotriccus–Oncostoma clade, and Atalotriccus came at the base of clade I. The generic status of Oncostoma has been ques-tioned previously (Fitzpatrick 1976, Traylor and Fitzpatrick 1982). It has been suggested that Oncostoma is closer to the Idioptilon–Hemitriccus group of Fitzpatrick (1976) than to either Lophotriccus or Atalotriccus (Hellmayr 1927). However, Fitzpatrick (1976) did not include Lophotriccus and Atalotriccus in his systematic
F��. 4. Combined phylogenetic analyses of the tody-tyrant and flatbill assemblage of tyrant flycatchers. (A) The most-parsimonious tree from the weighted analysis of the combined mito-chondrial and nuclear data (3,010 bp from ND2, ND3, CYTB, and FIB5 genes). Numbers above the branches represent bootstrap values. (B) Maximum-likelihood tree (–lnL = 39,458.98, GTR+Γ+I model). Numbers above the branches represent posterior probabilities values from the Bayesian analysis using a complex model partition setting containing four partitions (ND2, ND3, CYTB, and FIB5). Numbers below the branches represent bootstrap values from the maximum-likelihood analysis. Arrows indicate nodes with low bootstrap support in the maximum-parsimony tree and high posterior probability support in the maximum-likelihood and Bayesian inference tree.
T���� ��� B���146 [Auk, Vol. 124
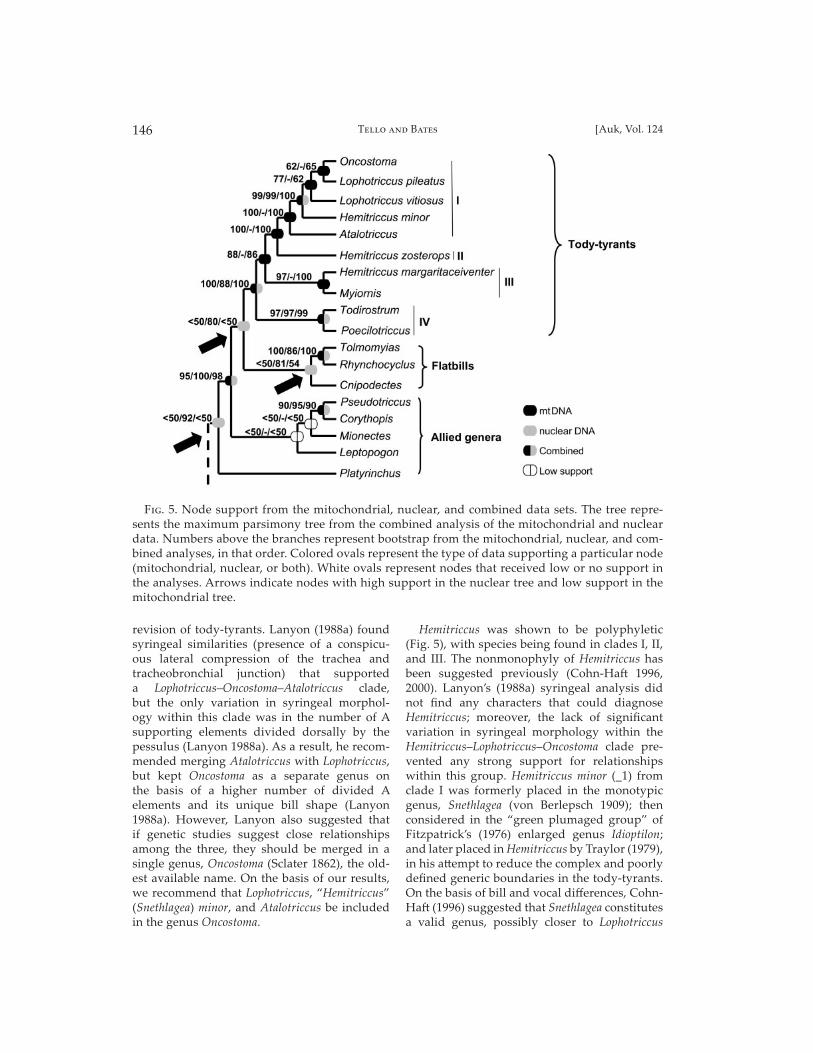
revision of tody-tyrants. Lanyon (1988a) found syringeal similarities (presence of a conspicu-ous lateral compression of the trachea and tracheobronchial junction) that supported a Lophotriccus–Oncostoma–Atalotriccus clade, but the only variation in syringeal morphol-ogy within this clade was in the number of A supporting elements divided dorsally by the pessulus (Lanyon 1988a). As a result, he recom-mended merging Atalotriccus with Lophotriccus, but kept Oncostoma as a separate genus on the basis of a higher number of divided A elements and its unique bill shape (Lanyon 1988a). However, Lanyon also suggested that if genetic studies suggest close relationships among the three, they should be merged in a single genus, Oncostoma (Sclater 1862), the old-est available name. On the basis of our results, we recommend that Lophotriccus, “Hemitriccus” (Snethlagea) minor, and Atalotriccus be included in the genus Oncostoma.
Hemitriccus was shown to be polyphyletic (Fig. 5), with species being found in clades I, II, and III. The nonmonophyly of Hemitriccus has been suggested previously (Cohn-Ha� 1996, 2000). Lanyon’s (1988a) syringeal analysis did not fi nd any characters that could diagnose Hemitriccus; moreover, the lack of signifi cant variation in syringeal morphology within the Hemitriccus–Lophotriccus–Oncostoma clade pre-vented any strong support for relationships within this group. Hemitriccus minor (_1) from clade I was formerly placed in the monotypic genus, Snethlagea (von Berlepsch 1909); then considered in the “green plumaged group” of Fitzpatrick’s (1976) enlarged genus Idioptilon; and later placed in Hemitriccus by Traylor (1979), in his a� empt to reduce the complex and poorly defi ned generic boundaries in the tody-tyrants. On the basis of bill and vocal diff erences, Cohn-Ha� (1996) suggested that Snethlagea constitutes a valid genus, possibly closer to Lophotriccus
F��. 5. Node support from the mitochondrial, nuclear, and combined data sets. The tree repre-sents the maximum parsimony tree from the combined analysis of the mitochondrial and nuclear data. Numbers above the branches represent bootstrap from the mitochondrial, nuclear, and com-bined analyses, in that order. Colored ovals represent the type of data supporting a particular node (mitochondrial, nuclear, or both). White ovals represent nodes that received low or no support in the analyses. Arrows indicate nodes with high support in the nuclear tree and low support in the mitochondrial tree.
Tody-tyrant and Flatbill PhylogenyJanuary 2007] 147
than to the rest of Hemitriccus, a proposal sup-ported by our molecular results.
A close relationship between Myiornis and Hemitriccus was suggested by Lanyon (1988a) on the basis of similar syringeal morphology and lack of signifi cant diff erentiation in external morphology. This led him to suggest that they were congeners. However, he also pointed out that this may be a refl ection of the limited num-ber of variable characters in the syrinx at this lower taxonomic level. Our results support his la� er suggestion. Myiornis was found to be the sister to “Hemitriccus” margaritaceiventer, and the two were ~11% divergent from each other in their mtDNA.
Todirostrum and Poecilotriccus (sensu Traylor 1977) formed a monophyletic clade at the base of the tody-tyrants (Fig. 5). A sister relationship between these two genera has not been directly proposed. However, the species P. capitalis (_2) was formerly in Todirostrum (Fitzpatrick 1976), until Traylor (1977) placed it in Poecilotriccus. Furthermore, Lanyon (1988a) found diff er-ences in syringeal morphology between the two Todirostrum species groups (cinereum and sylvia), and syringeal similarities between the T. sylvia group and Poecilotriccus that led him to suggest merging these two lineages in Poecilotriccus. This arrangement has been adopted by Fitzpatrick et al. (2004). Samples of Todirostrum used for this study included one member of each Todirostrum group: T. latirostre (_1) from the sylvia group, and T. maculatum (_2) from the cinereum group. Because Todirostrum was monophyletic in our results, our study does not support Lanyon’s merging of Poecilotriccus and the T. sylvia group. However, the amount of genetic diff erentiation between the two Todirostrum samples was as high as that found for Todirostrum vs. Poecilotriccus (up to 12.7% and 14.5%, respectively). Thus, the syl-via group may represent a distinct genus.
The status of another member of the group, the monotypic genus Taeniotriccus, further exem-plifi es generic issues in this group. Taeniotriccus andrei was lumped in Poecilotriccus on the basis of syringeal similarities (Lanyon 1988a) and previously recognized shared plumage similarities, including the presence of sexual dimorphism (Traylor 1977). However, overall external morphology and vocalizations suggest that this taxon should stay in its own genus, Taeniotriccus (Fitzpatrick et al. 2004, Zimmer and Whi� aker 2004). A more extensive assessment
of relationships in the tody-tyrants is needed to delimit the boundaries of these genera.
T�� F����� C����
The fl atbills consist of three genera: Tolmomyias, Rhynchocyclus, and Cnipodectes. The genera Platyrinchus and Onychorhynchus, previously suggested to be placed in this group (Lanyon 1988a), were found to be outside (Fig. 4). With the current sampling, the position of Platyrinchus is uncertain (see above), and Onychorhynchus was found to be closer to Myiobius and Terenotriccus from the Fluvicolinae (Traylor 1977, Fitzpatrick et al. 2004). This later relationship has been sug-gested on the bases of similarities of the syrinx (two or more double, complete, and medially ossifi ed A elements; Ames 1971), external mor-phology (extreme development of the rictal bristles extending beyond the tip of the broad, fl at bills; Traylor 1977), and nest type (pendent, purse-shaped nest; Traylor 1977, Traylor and Fitzpatrick 1982).
Tolmomyias and Rhynchocyclus resemble each other in external and syringeal morphology, as well as nest structure, and their relationship has been recognized previously (Hellmayr 1927, Traylor 1977, Lanyon 1988a). Warter (1965) and Traylor (1977) suggested a close relationship of these genera to Cnipodectes based on cranial morphology (type I nasal septum) and overall external shape. Lanyon’s (1988a) coding of cra-nial morphology agreed with that from previous studies, but he could not fi nd syringeal characters to support a close relationship of Rhynchocyclus and Tolmomyias with Cnipodectes (Fig. 1A).
G����� A����� � �� T���-���� ��� F����� C����
We found four genera allied to the tody-tyrant and fl atbill clade: Pseudotriccus, Corythopis, Mionectes, and Leptopogon (Fig. 5). Among these genera, Pseudotriccus was found to be sister to the antpipits, Corythopis. Corythopis may have the most checkered systematic history in the tyrannids, having formerly been part of the Conopophagidae and not a tyrant fl ycatcher at all until the work of Ames et al. (1968). Cranial and syringeal morphology sup-port the Pseudotriccus–Corythopis clade (Lanyon 1988b). Also, the two genera are character-ized by the presence of long tarsi with almost
T���� ��� B���148 [Auk, Vol. 124
obsolete scutes (tarsi covered by several long, continuous platelike scales [scutes], with no overlapping scales), which give them a smooth booted eff ect (Lanyon 1988b). These two genera also share similar feeding habits, being ground (Corythopis) or near-to-ground (Pseudotriccus) foragers that use upward strikes to snatch insects from the undersides of leaves (Traylor and Fitzpatrick 1982). Lanyon (1988b) placed the Pseudotriccus–Corythopis clade in a group that included his Stigmatura group (Stigmatura and Pseudelaenia) and Euscarthmus, but this rela-tionship was based on a single cranial character. Our results do not support this relationship.
A relationship between Mionectes and Leptopogon was recovered by both the nuclear MP and the combined ML–BI trees, but support for this node was low (Fig. 4). This relationship has been previously suggested on the basis of similarity of syringeal morphology (Lanyon 1988b, Birdsley 2002), DNA–DNA hybridiza-tion (Sibley and Ahlquist 1985, 1990), and nuclear and mitochondrial DNA sequences (Chesser 2004). A sister relationship between this clade and the Pseudotriccus–Corythopis clade was highly supported by the ML–BI tree (Fig. 4B). The la� er result is consistent with results of other molecular studies (Sibley and Ahlquist 1985, Chesser 2004).
Both Mionectes and Leptopogon build pensile nests, purse- and globe-shaped, respectively (Traylor and Fitzpatrick 1982). Pensile nests are a character shared with all members of the tody-tyrant and fl atbill clade whose nests have been described; with the exception of Corythopis, which has a ground oven-shaped nest (Oniki and Willis 1980), and Pseudotriccus, which has a globular nonpensile nest (H. Greeney et al. unpubl. data). Outside the tody-tyrant, fl atbill, and allies clade, pensile nests are found only in the Onychorhynchus–Terenotriccus–Myiobius clade (Traylor and Fitzpatrick 1982), where it seems to have evolved independently. As has been found for other avian lineages (Sheldon and Winkler 1999, Zyskowski and Prum 1999), these results suggest that the distribution of nest types in this tyrannid group track well their phylogenetic history.
P���������� P�������� �� �� S��� M��!���
Mitochondrial genes and the nuclear intron exhibit important diff erences that infl uence their
ability to be� er resolve diff erent regions of the fl ycatcher phylogeny (Table 2). Although the combined mitochondrial data set was 4× larger than the nuclear one and evolved 7× faster, dif-ferences in the percentage of variable sites were not as marked (55% and 49%, respectively). The FIB5 sequences were more A–T rich than the mitochondrial sequences, which is characteristic of markers under low or no selective constraints (Li and Graur 1991, Li 1997). The estimated alpha value (2.10) for the FIB5 was much higher than that for the combined mitochondrial data set (0.75), which suggests a lower among-site rate heterogeneity in the nuclear intron (Yang 1996, Lin and Danforth 2004). The alpha value of the nuclear intron was higher than previously reported values for the β-Fibrinogen intron 7 (Weibel and Moore 2002); the alpha value of the combined mitochondrial genes also was higher than an mtDNA value previously reported by the same authors (0.75 vs. 0.19). It has been suggested that high alpha values are correlated with low levels of homoplasy and, therefore, are indica-tive of high phylogenetic information content (Yang 1996, Weibel and Moore 2002, Lin and Danforth 2004). This is supported by the relative frequencies of substitutions for each nucleotide class reconstructed in the mitochondrial and nuclear trees according to the MP criterion (not shown). The changes are more homogeneously distributed for the nuclear positions than for the third-position transitions of the mitochondrial data. A similar pa� ern of changes was found for mitochondrial fi rst and second positions (not shown). This also was observed in the saturation curves for the mitochondrial genes, which exhib-ited saturation at 3% nuclear divergence (Fig. 2). Nonetheless, the mitochondrial tree did not diff er topologically from the nuclear tree at basal nodes (defi ned as either within or near the base of the tody-tyrant, fl atbill, and allies clade), except that support was low at those nodes (Fig. 3A, B).
Trees from the MP, ML, and BI analyses of the combined data were very similar in topology (Fig. 4). In general, nodes with high bootstrap support (≥70%) in the MP tree exhibited high posterior probabilities in the ML–BI tree (≥0.95) (Fig. 4B). However, the ML–BI tree showed stronger support for those basal nodes that received low support in the MP tree (Fig. 4A), with the exception of the position of Platyrinchus. In the ML–BI tree, Platyrinchus was placed sister to a major clade that included several fl ycatchers
Tody-tyrant and Flatbill PhylogenyJanuary 2007] 149
from Sibley and Ahlquist’s (1990) Tyranninae. Nuclear data alone strongly supported inclusion of Platyrinchus sister to the tody-tyrant, fl atbill, and allies clade (Fig. 3B), in contrast to the results of the combined ML–BI tree. This may illustrate the eff ect of a relatively long branch separating Platyrinchus from the tody-tyrant, fl atbill, and allies clade (Fig. 3B), which most likely is a� rib-utable to the limited taxon sampling beyond the study group, or to failure of the mitochondrial data to resolve this ancient node because of satu-ration; this may also explain why the ML–BI tree did not recover the Tyrannidae as monophyletic (Fig. 4B). In any case, placement of Platyrinchus outside the fl atbills is consistent with other char-acters, including the nasal septum (type 3 instead of type 1) and nest type (cup-shaped instead of pendant; Traylor 1977). These diff erences led Traylor (1977) to place this genus at the end of the Elaeniinae in his linear classifi cation of the Tyrannidae.
C����������
A combination of mitochondrial and nuclear data helped to resolve the backbone of the tody-tyrant and fl atbill phylogeny, but separate and combined analyses of data partitions are neces-sary for understanding the nature of confl ict among data sets. The tody-tyrants constitute a monophyletic clade, and the fl atbills as defi ned by Lanyon (1988a) do not constitute a natural group (Onychorhynchus and Platyrinchus are not true fl atbills). The tody-tyrants and the true fl at-bills were found to be sister clades. Hemitriccus is polyphyletic and Lophotriccus is paraphyletic, and the limits of Oncostoma–Lophotriccus need to be revised with more complete sampling at the species level. Pseudotriccus and Corythopis are sister taxa and, together with Leptopogon and Mionectes, are allied to the tody-tyrants and fl atbills. With current sampling, the genus Platyrinchus falls outside this group, a place-ment that is consistent with other divergent characteristics, such as the cup-shaped nest built by Platyrinchus species, as compared with the pendant nest built by the tody tyrants, fl atbills, and allies. Onychorhynchus was found to be closer to Myiobius and Terenotriccus from the Fluvicolinae, which is consistent to previ-ously recognized similarities in morphology and nest type (Ames 1971, Traylor 1977, Traylor and Fitzpatrick 1982). But the ML–BI tree failed
to recover the Tyrannidae as monophyletic. Greater resolution of these basal nodes will require the addition of more nuclear characters and the inclusion of more tyrannid taxa.
A�!��"��������
We thank the following museums and their curatorial and collection management staff for making tissue samples available for this study: Field Museum (S. Hacke� , D. Willard, T. Gnoske); Academy of Natural Sciences of Philadelphia (L. Joseph, N. Rice); Louisiana State University Museum of Natural Science, Baton Rouge (F. Sheldon, R. Brumfi eld, D. Di� mann); and University of Michigan Museum of Zoology, Ann Arbor (R. Payne, D. Mindell, J. Hinshaw). Thanks to J. Perez for checking the identifi cation of a specimen from the ornithological collection at the Fundación La Salle in Venezuela. DNA sequencing was car-ried out at the Field Museum’s Pritzker Lab for Molecular Systematics and Evolution, operated with support from the Pritzker Foundation. We thank K. Feldheim, J. Hunt, and R. Bowie from the Pritzker Lab for advice during sequencing work and E. Sacke� for help with lab work. Help with data analyses was provided by S. Hacke� , L. Olson, A. Miller, F. Lutzoni, and C.-P. Lin. This research was supported by a National Science Foundation grant (Doctoral Dissertation Enhancement Grant, INT-0135532) awarded to J.M.B. and J.G.T. An early stage of the manuscript was improved by comments of S. Hacke� , M. Ashley, D. Stotz, D. Nyberg, and S. Williams. M. Cohn-Ha� made comments to the fi nal version of the manuscript. The pro-grams STMATRIX and INAASE are available as free downloads at www.lutzonilab.net/pages/download.shtml#Step.
L������� C���
A!��!�, H. 1974. A new look at the statistical model identifi cation. IEEE Transactions on Automatic Control 19:716–723.
A���, P. L. 1971. The morphology of the syrinx in passerine birds. Bulletin of the Peabody Museum of Natural History, no. 37.
A���, P. L., M. A. H�����������, ��� S. L. W����. 1968. The anatomy and systematic position of the antpipits Conopophaga and Corythopis. Postilla 114:1–32.
T���� ��� B���150 [Auk, Vol. 124
B�!��, R. H., ��� R. D�S����. 1997. Multiple sources of character information and the phylogeny of Hawaiian drosophilids. Systematic Biology 46:654–673.
B�!��, R. J., X. Y�, ��� R. D�S����. 1998. Assessing the relative contribution of molecular and morphological characters in simultaneous analysis trees. Molecular Phylogenetics and Evolution 9:427–436.
B��!��, F. K., ��� F. M. L�$���. 2002. The util-ity of the incongruence length diff erence test. Systematic Biology 51:625–637.
B�������, J. S. 2002. Phylogeny of the tyrant fl y-catchers (Tyrannidae) based on morphology and behavior. Auk 119:715–734.
C������, R. T. 1999. Molecular systematics of the rhinocryptid genus Pteroptochos. Condor 101:439–446.
C������, R. T. 2004. Molecular systematics of New World suboscine birds. Molecular Phylogenetics and Evolution 32:11–24.
C�����, C., ��� N. K. J������. 2001. Higher-level phylogeny of New World vireos (Aves: Vireonidae) based on sequences of mul-tiple mitochondrial DNA genes. Molecular Phylogenetics and Evolution 20:27–40.
C�����, C., ��� N. K. J������. 2002. Phylogeny and character evolution in the Empidonax group of tyrant fl ycatchers (Aves: Tyrannidae): A test of W. E. Lanyon’s hypothesis using mtDNA sequences. Molecular Phylogenetics and Evolution 22:289–302.
C���-H��, M. 1996. Why the Yungas Tody-Tyrant (Hemitriccus spodiops) is a Snethlagea, and why it ma� ers. Auk 113:709–714.
C���-H��, M. 2000. A case study in Amazonian biogeography: Vocal and DNA-sequence variation in Hemitriccus fl ycatchers. Ph.D. dissertation, Louisiana State University, Baton Rouge.
D���������, P., ��� R. M�����. 1990. Sequence and gene organization of the chicken mito-chondrial genome: A novel gene in higher vertebrates. Journal of Molecular Biology 212:599–634.
F�����, J. S., M. K&������', A. G. K����, ��� C. B��. 1995a. Constructing a signifi cance test for incongruence. Systematic Biology 44:570–572.
F�����, J. S., M. K&������', A. G. K����, ��� C. B��. 1995b. Testing signifi cance of incon-gruence. Cladistics 10:315–319.
F���������, J. 1981. A likelihood approach to character weighting and what it tells us about parsimony and compatibility. Biological Journal of the Linnaean Society 16:183–196.
F���������, J. 1985. Confi dence limits on phy-logenies: An approach using the bootstrap. Evolution 39:783–791.
F�$�����!, J. W. 1976. Systematics and biogeog-raphy of the tyrannid genus Todirostrum and related genera (Aves). Bulletin of the Museum of Comparative Zoology 147:435–463.
F�$�����!, J. W. 1985. Form, foraging behavior, and adaptive radiation in the Tyrannidae. Pages 447–470 in Neotropical Ornithology (P. A. Buckley, M. S. Foster, E. S. Morton, R. S. Ridgely, and F. G. Buckley, Eds.). Ornithological Monographs, no. 36.
F�$�����!, J. W., J. M. B���, K. S. B��"��!, I. C. C�������, B. M. C���!, A. F����"���, A. P. H�����, L. J�����, G. M. L������, D. L���, ��� �����. 2004. Family Tyrannidae (tyrant fl ycatchers). Pages 170–463 in Handbook of the Birds of the World, vol. 9: Cotingas to Pipits and Wagtails (J. del Hoyo, A. Ellio� , and J. Sargatal, Eds.). Lynx Edicions, Barcelona, Spain.
G������, S., ��� O. G������. 2003. A simple, fast, and accurate algorithm to estimate large phylogenies by maximum likelihood. Systematic Biology 52:696–704.
H��!�, S. J. 1996. Molecular phylogenet-ics and biogeography of tanagers in the genus Ramphocelus (Aves). Molecular Phylogenetics and Evolution 5:368–382.
H�����"�, M. 1990. Phylogeny and molecular evolution in primates. Japanese Journal of Genetics 65:243–265.
H�������, C. E. 1927. Catalogue of Birds of the Americas and the Adjacent Islands. Part V [Tyrannidae]. Field Museum of Natural History, Zoology Series, no. 13.
H���-B����"�!�, K., ��� J. C������. 1993. Recovering phylogenetic signal from DNA sequences: Relationships within the corvine assemblage (class Aves) as inferred from complete sequences of the mitochondrial DNA cytochrome-b gene. Molecular Biology and Evolution 10:1196–1214.
H�����, D. M., B. K. M���, ��� C. M���$. 1996. Applications of molecular systematics: The state of the fi eld and a look to the future. Pages 515–543 in Molecular Systematics, 2nd ed. (D. M. Hillis, C. Moritz, and B. K. Mable,

Tody-tyrant and Flatbill PhylogenyJanuary 2007] 151
Eds.). Sinauer Associates, Sunderland, Massachuse� s.
H��������!, J. P., ��� F. R������. 2001. MRBAYES: Bayesian inference of phyloge-netic trees. Bioinformatics 17:754–755.
I�����, M., U. S. J��������, T. J. P������, ��� P. G. P. E������. 2001. Phylogeny of major lineages of suboscines (Passeriformes) analyzed by nuclear DNA sequence data. Journal of Avian Biology 32:15–25.
L�����, W. E. 1985. A phylogeny of the myiarchine fl ycatchers. Pages 360–380 in Neotropical Ornithology (P. A. Buckley, M. S. Foster, E. S. Morton, R. S. Ridgely, and F. G. Buckley, Eds.). Ornithological Monographs, no. 36.
L�����, W. E. 1988a. A phylogeny of the fl at-bill and tody-tyrant assemblage of tyrant fl ycatchers. American Museum Novitates 2923:1–41.
L�����, W. E. 1988b. A phylogeny of the thirty-two genera in the Elaenia assemblage of tyrant fl ycatchers. American Museum Novitates 2914:1–57.
L�, W.-H. 1997. Molecular Evolution. Sinauer Associates, Sunderland, Massachuse� s.
L�, W.-H., ��� D. G����. 1991. Fundamentals of Molecular Evolution. Sinauer Associates, Sunderland, Massachuse� s.
L��, C.-P., ��� B. N. D������. 2004. How do insect nuclear and mitochondrial gene substi-tution pa� erns diff er? Insights from Bayesian analyses of combined datasets. Molecular Phylogenetics and Evolution 30:686–702.
L�$���, F., P. W�����, V. R��, ��� S. Z�����. 2000. Integrating ambiguously aligned regions of DNA sequences in phyloge-netic analyses without violating positional homology. Systematic Biology 49:628–651.
M�����, M. A., ��� S. J. H��!�. 2002. A mul-tifaceted approach to the characterization of an intergeneric hybrid manakin (Pipridae) from Brazil. Auk 119:1114–1120.
M����-G����, R. J., ��� E. A. K������. 1996. Testing for phylogenetic confl ict among molecular data sets in the tribe Triticeae (Gramineae). Systematic Biology 45:524–545.
M���� �� S���������, R. 1966. The Species of Birds of South America with their Distribution. Academy of Natural Sciences, Philadelphia.
N�������, J. A. A., F. R������, J. P. H��������!, ��� J. L. N�����-A�����. 2004.
Bayesian phylogenetic analysis of combined data. Systematic Biology 53:47–67.
O��!�, Y., ��� E. O. W�����. 1980. A nest of the Ringed Gnatpipit (Corythopis torquata). Wilson Bulletin 92:126–127.
P�����, D., ��� K. A. C�������. 1998. MODELTEST: Testing the model of DNA substitution. Bioinformatics 14:817–818.
R������, B., ��� Z. Y���. 1996. Probability dis-tribution of molecular evolutionary trees: A new method of phylogenetic inference. Journal of Molecular Evolution 43:304–311.
R������, F., ��� J. P. H��������!. 2003. MRBAYES 3: Bayesian phylogenetic infer-ence under mixed models. Bioinformatics 19:1572–1574.
S�����, P. L. 1862. Catalogue of a Collection of American Birds. N. Trubner, London.
S�����, P. L. 1888. Catalogue of the Birds in the British Museum, vol. 14. British Museum (Natural History), London.
S������, F. H., ��� D. W. W��!���. 1999. Nest architecture and avian systematics. Auk 116:875–877.
S����, C. G., ��� J. E. A������. 1985. Phylogeny and classifi cation of New World suboscine passerine birds (Passeriformes: Oligomyodi: Tyrannides). Pages 396–428 in Neotropical Ornithology (P. A. Buckley, M. S. Foster, E. S. Morton, R. S. Ridgely, and F. G. Buckley, Eds.). Ornithological Monographs, no. 36.
S����, C. G., ��� J. E. A������. 1990. Phylogeny and Classifi cation of Birds. Yale University Press, New Haven, Connecticut.
S����, C. G., ��� B. L. M�����, J�. 1990. Distribution and Taxonomy of Birds of the World. Yale University Press, New Haven, Connecticut.
S����, C. G., ��� B. L. M�����, J�. 1993. Supplement to Distribution and Taxonomy of Birds of the World. Yale University Press, New Haven, Connecticut.
S�������, M. D. 1999. TREEROT, version 2. Boston University, Boston, Massachuse� s.
S�$, D. F., J. W. F�$�����!, T. A. P��!�� III, ��� D. K. M��!����. 1996. Neotropical Birds: Ecology and Conservation. University of Chicago Press, Chicago, Illinois.
S"������, D. L. 2002. PAUP*: Phylogenetic Analysis Using Parsimony (* and Other Methods), version 4.0. Sinauer Associates, Sunderland, Massachuse� s.
T���� ��� B���152 [Auk, Vol. 124
T������, M. A., J�. 1977. A classifi cation of the tyrant fl ycatchers (Tyrannidae). Bulletin of the Museum of Comparative Zoology 148:129–184.
T������, M. A., J�. 1979. Tyrannidae. Pages 1–245 in Check-list of Birds of the World (M. A. Traylor, Jr., Ed.). Museum of Comparative Zoology, Harvard University, Cambridge, Massachuse� s.
T������, M. A., J�., ��� J. W. F�$�����!. 1982. A survey of the tyrant fl ycatchers. Living Bird 19:7–50.
��� B��������, H. G. 1907. Studien über Tyranniden. Ornis 14:463–493.
��� B��������, H. G. 1909. Über eine neue Ga� ung aus der Familie der Tyrannidae. Journal für Ornithologie 57:104–107.
W����, S. L. 1965. The cranial osteology of the New World Tyrannoidea and its taxonomic implications. Ph.D. dissertation, Louisiana State University, Baton Rouge.
W����, A. C., ��� W. S. M����. 2002. A test of a mitochondrial gene-based phylogeny of woodpeckers (genus Picoides) using an independent nuclear gene, β-fi brinogen intron 7. Molecular Phylogenetics and Evolution 22:247–257.
W������, W. C. 1990. Combinatorial weights in phylogenetic analysis: A statistical parsi-mony procedure. Cladistics 6:269-275.
Y���, Z. 1996. Among-site rate variation and its impact on phylogenetic analyses. Trends in Ecology and Evolution 11:367–372.
Y���, Z., ��� B. R������. 1997. Bayesian phy-logenetic inference using DNA sequences: A Markov Chain Monte Carlo method. Molecular Biology and Evolution 14:717–724.
Z�����, J. T. 1940. Studies of Peruvian Birds, no. 34. The genera Todirostrum, Euscarthmornis, Snethlagea, Poecilotriccus, Lophotriccus, Myiornis, Pseudotriccus and Hemitriccus. American Museum Novitates 1066:1–23.
Z�����, K. J., ��� A. W���!��. 2004. Observations on the vocalisations and behaviour of Black-chested Tyrant Taeniotriccus andrei from the Serra dos Carajás, Pará, Brazil. Cotinga 22:24–29.
Z��!�"�!�, K., ��� R. O. P���. 1999. Phylogenetic analysis of the nest architec-ture of Neotropical ovenbirds (Furnariidae). Auk 116:891–911.
Associate Editor: K. P. Johnson
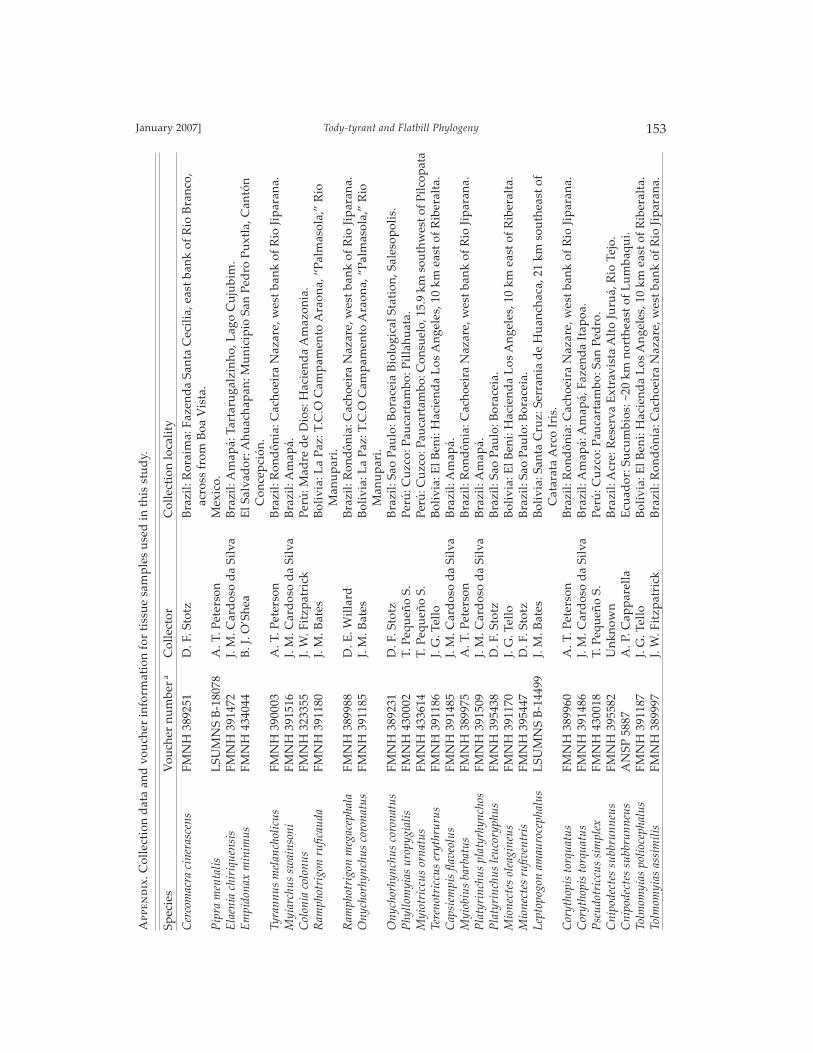
Tody-tyrant and Flatbill PhylogenyJanuary 2007] 153A
����
���.
Col
lect
ion
dat
a an
d v
ouch
er in
form
atio
n fo
r ti
ssu
e sa
mp
les
use
d in
thi
s st
ud
y.
Spec
ies
Vou
cher
nu
mbe
r a
Col
lect
or
Col
lect
ion
loca
lity
Cer
com
acra
cin
eras
cen
s FM
NH
389
251
D. F
. Sto
tz
Bra
zil:
Ror
aim
a: F
azen
da
Sant
a C
ecil
ia, e
ast
bank
of
Rio
Bra
nco,
ac
ross
fro
m B
oa V
ista
.P
ipra
men
tali
s L
SUM
NS
B-1
8078
A
. T. P
eter
son
Mex
ico.
Ela
enia
ch
iriq
uen
sis
FMN
H 3
9147
2 J.
M. C
ard
oso
da
Silv
a B
razi
l: A
map
á: T
arta
ruga
lzin
ho, L
ago
Cu
jubi
m.
Em
pid
onax
min
imu
s FM
NH
434
044
B. J
. O’S
hea
El S
alva
dor
: Ahu
acha
pan
: Mu
nici
pio
San
Ped
ro P
uxt
la, C
antó
n
C
once
pci
ón.
Ty
ran
nu
s m
elan
chol
icu
s FM
NH
390
003
A. T
. Pet
erso
n B
razi
l: R
ond
ônia
: Cac
hoei
ra N
azar
e, w
est
bank
of
Rio
Jip
aran
a.M
yia
rch
us
swai
nso
ni
FMN
H 3
9151
6 J.
M. C
ard
oso
da
Silv
a B
razi
l: A
map
á.C
olon
ia c
olon
us
FMN
H 3
2335
5 J.
W. F
itzp
atri
ck
Perú
: Mad
re d
e D
ios:
Hac
iend
a A
maz
onia
.R
amp
hot
rig
on r
ufi
cau
da
FMN
H 3
9118
0 J.
M. B
ates
B
oliv
ia: L
a Pa
z: T
.C.O
Cam
pam
ento
Ara
ona,
“Pa
lmas
ola,
” R
io
Man
up
ari.
Ram
ph
otri
gon
meg
acep
hal
a FM
NH
389
988
D. E
. Wil
lard
B
razi
l: R
ond
ônia
: Cac
hoei
ra N
azar
e, w
est
bank
of
Rio
Jip
aran
a.O
ny
chor
hy
nch
us
coro
nat
us
FMN
H 3
9118
5 J.
M. B
ates
B
oliv
ia: L
a Pa
z: T
.C.O
Cam
pam
ento
Ara
ona,
“Pa
lmas
ola,
” R
io
Man
up
ari.
On
ych
orh
yn
chu
s co
ron
atu
s FM
NH
389
231
D. F
. Sto
tz
Bra
zil:
Sao
Pau
lo: B
orac
eia
Bio
logi
cal S
tati
on, S
ales
opol
is.
Ph
yll
omy
ias
uro
py
gia
lis
FMN
H 4
3000
2 T.
Peq
ueñ
o S.
Pe
rú: C
uzc
o: P
auca
rtam
bo: P
illa
huat
a.M
yio
tric
cus
orn
atu
s FM
NH
433
614
T. P
equ
eño
S.
Perú
: Cu
zco:
Pau
cart
ambo
: Con
suel
o, 1
5.9
km s
outh
wes
t of P
ilcop
ata
Ter
enot
ricc
us
ery
thru
rus
FMN
H 3
9118
6 J.
G. T
ello
B
oliv
ia: E
l Ben
i: H
acie
nd
a L
os A
nge
les,
10
km e
ast
of R
iber
alta
.C
apsi
emp
is fl
av
eolu
s FM
NH
391
485
J. M
. Car
dos
o d
a Si
lva
Bra
zil:
Am
apá.
My
iobi
us
barb
atu
s FM
NH
389
975
A. T
. Pet
erso
n
Bra
zil:
Ron
dôn
ia: C
ach
oeir
a N
azar
e, w
est
ban
k of
Rio
Jip
aran
a.P
laty
rin
chu
s p
laty
rhy
nch
os
FMN
H 3
9150
9 J.
M. C
ard
oso
da
Silv
a B
razi
l: A
map
á.P
laty
rin
chu
s le
uco
ryp
hu
s FM
NH
395
438
D. F
. Sto
tz
Bra
zil:
Sao
Pau
lo: B
orac
eia.
Mio
nec
tes
olea
gin
eus
FMN
H 3
9117
0 J.
G. T
ello
B
oliv
ia: E
l Ben
i: H
acie
nd
a L
os A
nge
les,
10
km e
ast
of R
iber
alta
.M
ion
ecte
s ru
fi v
entr
is
FMN
H 3
9544
7 D
. F. S
totz
B
razi
l: Sa
o Pa
ulo
: Bor
acei
a.L
epto
pog
on a
mau
roce
ph
alu
s L
SUM
NS
B-1
4499
J.
M. B
ates
B
oliv
ia: S
anta
Cru
z: S
erra
nia
de
Hu
anch
aca,
21
km s
outh
east
of
Cat
arat
a A
rco
Iris
.C
ory
thop
is t
orqu
atu
s FM
NH
389
960
A. T
. Pet
erso
n
Bra
zil:
Ron
dôn
ia: C
ach
oeir
a N
azar
e, w
est
ban
k of
Rio
Jip
aran
a.C
ory
thop
is t
orqu
atu
s FM
NH
391
486
J. M
. Car
dos
o d
a Si
lva
Bra
zil:
Am
apá:
Am
apá,
Faz
end
a It
apoa
.P
seu
dot
ricc
us
sim
ple
x
FMN
H 4
3001
8 T.
Peq
ueñ
o S.
Pe
rú: C
uzc
o: P
auca
rtam
bo: S
an P
edro
.C
nip
odec
tes
subb
run
neu
s FM
NH
395
582
Un
know
n
Bra
zil:
Acr
e: R
eser
va E
xtra
vist
a A
lto
Juru
á, R
io T
ejo.
Cn
ipod
ecte
s su
bbru
nn
eus
AN
SP 5
887
A. P
. Cap
par
ella
E
cuad
or: S
ucu
mbi
os: ~
20 k
m n
orth
east
of
Lu
mba
qui.
Tol
mom
yia
s p
olio
cep
hal
us
FMN
H 3
9118
7 J.
G. T
ello
B
oliv
ia: E
l Ben
i: H
acie
nda
Los
Ang
eles
, 10
km e
ast
of R
iber
alta
.T
olm
omy
ias
assi
mil
is
FMN
H 3
8999
7 J.
W. F
itzp
atri
ck
Bra
zil:
Ron
dôn
ia: C
acho
eira
Naz
are,
wes
t ba
nk o
f R
io J
ipar
ana.

T���� ��� B���154 [Auk, Vol. 124
A��
����
�. C
onti
nued
.
Spec
ies
Vou
cher
nu
mbe
r a
Col
lect
or
Col
lect
ion
loca
lity
Rh
yn
choc
ycl
us
oliv
aceu
s FM
NH
391
502
J. M
. Car
dos
o d
a Si
lva
Bra
zil:
Para
: Ser
ra d
os C
araj
as.
Rh
yn
choc
ycl
us
oliv
aceu
s FM
NH
427
086
S. A
. Rod
a B
razi
l: A
lago
as: I
bate
ouar
a, E
ngen
ho C
oim
bra,
Usi
na S
erra
Gra
nde.
Lop
hot
ricc
us
vit
iosu
s FM
NH
391
488
J. M
. Car
dos
o d
a Si
lva
Bra
zil:
Am
apá:
Am
apá,
Faz
end
a It
apoa
.L
oph
otri
ccu
s p
ilea
tus
FMN
H 4
3002
0 T.
Peq
ueñ
o S.
Pe
rú: C
uzc
o: P
auca
rtam
bo: S
an P
edro
.A
talo
tric
cus
pil
aris
A
NSP
578
0 T.
D. P
eder
son
Pana
ma:
Ver
agu
as: C
asca
jillo
so.
On
cost
oma
cin
erei
gu
lare
FM
NH
434
038
B. J
. O’S
hea
El S
alva
dor
: Ahu
acha
pan
: Mu
nici
pio
San
Fra
ncis
co M
enen
d:
Parq
ue
Nac
iona
l El I
mp
osib
le, S
ecto
r L
a Fi
ncon
a.O
nco
stom
a ci
ner
eig
ula
re
FMN
H 4
3403
9 B
. J. O
’She
a E
l Sal
vad
or: A
huac
hap
an: M
uni
cip
io S
an F
ranc
isco
Men
end
:
Pa
rqu
e N
acio
nal E
l Im
pos
ible
, Sec
tor
La
Finc
ona.
Hem
itri
ccu
s m
inor
FM
NH
391
494
J. M
. Car
dos
o d
a Si
lva
Bra
zil:
Para
: Ser
ra d
os C
araj
as.
Hem
itri
ccu
s zo
ster
ops
FMN
H 3
9117
8 J.
M. B
ates
B
oliv
ia: L
a Pa
z: T
.C.O
Cam
pam
ento
Ara
ona,
“Pa
lmas
ola,
” R
io
Man
up
ari.
Hem
itri
ccu
s m
arga
rita
ceiv
ente
r U
MM
Z 6
00
P. L
au
Ven
ezu
ela:
Su
cre:
Pu
eblo
Moc
him
a.P
oeci
lotr
iccu
s al
bifa
scie
s FM
NH
433
657
T. P
equ
eño
S.
Perú
: Mad
re D
e D
ios:
Mos
kita
nia,
13.
4 km
nor
th-n
orth
wes
t of
A
tala
ya, l
e� b
ank
of A
lto
Mad
re d
e D
ios.
Poe
cilo
tric
cus
cap
ital
is
FMN
H 3
3437
4 D
. F. S
totz
B
razi
l: R
ond
ônia
: Sit
io A
mar
o, 3
0 km
sou
thw
est
of C
acho
eira
N
azar
e on
Jar
u R
oad
.T
odir
ostr
um
lat
iros
tre
FMN
H 4
3365
3 B
. J. O
’She
a Pe
rú: M
adre
De
Dio
s: M
oski
tani
a, 1
3.4
km n
orth
-nor
thw
est
of
Ata
laya
, le�
ban
k of
Alt
o M
adre
de
Dio
s.T
odir
ostr
um
mac
ula
tum
FM
NH
391
498
J. M
. Car
dos
o d
a Si
lva
Bra
zil:
Am
apá:
Tar
taru
galz
inho
, Lag
o C
uju
bim
.M
yio
rnis
eca
ud
atu
s FM
NH
389
978
S.
M. L
anyo
n B
razi
l: R
ond
ônia
: Cac
hoei
ra N
azar
e, w
est
bank
of
Rio
Jip
aran
a.M
yio
rnis
eca
ud
atu
s FM
NH
391
177
J. G
. Tel
lo
Bol
ivia
: El B
eni:
Hac
iend
a L
os A
ngel
es, 1
0 km
eas
t of
Rib
eral
ta.
a M
use
um
abb
revi
atio
ns:
FM
NH
= F
ield
Mu
seu
m o
f N
atu
ral
His
tory
; L
SUM
NS
= L
ouis
iana
Sta
te U
nive
rsit
y M
use
um
of
Nat
ura
l Sc
ienc
e; A
NSP
= A
cad
emy
of N
atu
ral
Scie
nces
of
Phi
lad
elp
hia
; UM
MZ
= U
nive
rsit
y of
Mic
higa
n M
use
um
of
Zoo
logy
.
Related Documents