Syst. Biol. 56(5)776-797, 2007 Copyright (c) Society of Systematic Biologists ISSN: 1063-5157 print / 1076-836X online DO1:10.1080/10635150701618527 Molecular Phylogenetics of the Lizard Genus Microlophus (SquamataiTropiduridae): Aligning and Retrieving Indel Signal from Nuclear Introns EDGAR BENAVIDES, 1 REBECCA BAUM, 3 DAVID MCCLELLAN, 1 AND JACK W. SITES, JR. 1 ' 2 1 Department of Integrative Biology, and 2 M.L. Bean Life Science Museum, Brigham Young University, Provo, UT 84602, USA; E-mail: [email protected] (E.B.) 3 Department of Chemistry, Brigham Young University, Provo, UT 84602, USA Abstract.— We use a multigene data set (the mitochondrial locus and nine nuclear gene regions) to test phylogenetic relation- ships in the South American "lava lizards" (genus Microlophus) and describe a strategy for aligning noncoding sequences that accounts for differences in tempo and class of mutational events. We focus on seven nuclear introns that vary in size and frequency of multibase length mutations (i.e., indels) and present a manual alignment strategy that incorporates insertions and deletions (indels) for each intron. Our method is based on mechanistic explanations of intron evolution that does not require a guide tree. We also use a progressive alignment algorithm (Probabilistic Alignment Kit; PRANK) and distinguishes insertions from deletions and avoids the "gapcost" conundrum. We describe an approach to selecting a guide tree purged of ambiguously aligned regions and use this to refine PRANK performance. We show that although manual alignment is successful in finding repeat motifs and the most obvious indels, some regions can only be subjectively aligned, and there are limits to the size and complexity of a data matrix for which this approach can be taken. PRANK alignments identified more parsimony-informative indels while simultaneously increasing nucleotide identity in conserved sequence blocks flanking the indel regions. When comparing manual and PRANK with two widely used methods (CLUSTAL, MUSCLE) for the alignment of the most length-variable intron, only PRANK recovered a tree congruent at deeper nodes with the combined data tree inferred from all nuclear gene regions. We take this concordance as an objective function of alignment quality and present a strongly supported phylogenetic hypothesis for Microlophus relationships. From this hypothesis we show that (1) a coded indel data partition derived from the PRANK alignment contributed significantly to nodal support and (2) the indel data set permitted detection of significant conflict between mitochondrial and nuclear data partitions, which we hy- pothesize arose from secondary contact of distantly related taxa, followed by hybridization and mtDNA introgression. [Indels; length-variable introns; Microlophus; mitochondrial-nuclear conflict; phylogenetics; progressive alignment; sec- ondary contact.] Sequence homology statements are key to formulating sound phylogenetic hypotheses, and multiple alignment programs based on either progressive (Thompson et al., 1994 [CLUSTAL]; Edgar, 2004 [MUSCLE]) or consistency-based scoring alignments (Notredame et al., 2000 [T-Coffe]), are widely used by systematists. Im- provements such as iterative optimizations to correct er- rors introduced early in the alignment process (Wallace et. al., 2005) have greatly increased the accuracy and sen- sitivity of these methods (Thompson et al., 1999; Pollard et al., 2004; Wallace et al., 2005; Lunter et al., 2005a), but the majority of systematic studies commonly ap- ply a single heuristic alignment algorithm to data sets with different mutation mechanisms and mutation pat- terns (i.e., ribosomal versus protein-coding sequences), implying that all gene regions can be aligned under the same set of assumptions. For example, the distribution of ribosomal gene substitutions is tightly constrained by secondary structure, whereas protein gene substitu- tions are constrained by reading frame and codon con- servation (Li, 1997). In contrast, point mutations plus short and long length mutations characterize the evo- lution of intron regions (Belshaw and Bensasson, 2006), and the indiscriminate application of a single heuristic alignment method (e.g., CLUSTAL) to protein-coding, noncoding, and ribosomal sequences is an inappropriate oversimplification. The increased use of novel nuclear gene regions in phylogenetic studies, alone or combined with more tra- ditional markers such as ribosomal and mitochondrial gene regions, raises new theoretical and empirical issues (e.g., parameter and tree optimization [Pagel and Meade, 2004], data partitioning [Castoe et al., 2004; Brandley et al., 2005], model choice [Sullivan and Joyce, 2005], and topological incongruence [Gatesy and Baker, 2005; Phillips et al., 2004]). Likewise, investigators have com- pared the performance of different alignment methods (Whiting et al., 2006; Kjer et al., 2007), but to our knowl- edge, a clear distinction of issues affecting alignment procedures across genes that do vary in tempo and class of mutational event (point versus small indels ver- sus large length mutations) has not been presented. In this study, we empirically differentiate the alignment of (a) protein coding and (b) ribosomal gene regions from (c) nuclear introns characterized by length muta- tions of variable sizes and frequencies and compare phy- logenetic hypotheses generated from alignments that make these distinctions with those from two widely used heuristic methods that do not. Our analyses ben- efit from recent insights for the global alignment of com- plex indel substitution patterns (Loytinoja and Goldman, 2005). The South American "Lava Lizards" (Genus Microlophus) The "lava lizards" (genus Microlophus; Tropiduridae) display an unusual geographic distribution among ter- restrial vertebrates; the 21 recognized species include nine taxa endemic to the Galapagos Archipelago and 12 species mostly confined to a linear strip of 5000 km along rain-shadowed western coastal deserts of South America 776 by guest on February 13, 2016 http://sysbio.oxfordjournals.org/ Downloaded from

Welcome message from author
This document is posted to help you gain knowledge. Please leave a comment to let me know what you think about it! Share it to your friends and learn new things together.
Transcript
Syst. Biol. 56(5)776-797, 2007Copyright (c) Society of Systematic BiologistsISSN: 1063-5157 print / 1076-836X onlineDO1:10.1080/10635150701618527
Molecular Phylogenetics of the Lizard Genus Microlophus (SquamataiTropiduridae):Aligning and Retrieving Indel Signal from Nuclear Introns
EDGAR BENAVIDES,1 REBECCA BAUM,3 DAVID MCCLELLAN,1 AND JACK W. SITES, JR.1'2
1 Department of Integrative Biology, and2M.L. Bean Life Science Museum, Brigham Young University, Provo, UT 84602, USA; E-mail: [email protected] (E.B.)
3 Department of Chemistry, Brigham Young University, Provo, UT 84602, USA
Abstract.— We use a multigene data set (the mitochondrial locus and nine nuclear gene regions) to test phylogenetic relation-ships in the South American "lava lizards" (genus Microlophus) and describe a strategy for aligning noncoding sequencesthat accounts for differences in tempo and class of mutational events. We focus on seven nuclear introns that vary in size andfrequency of multibase length mutations (i.e., indels) and present a manual alignment strategy that incorporates insertionsand deletions (indels) for each intron. Our method is based on mechanistic explanations of intron evolution that does notrequire a guide tree. We also use a progressive alignment algorithm (Probabilistic Alignment Kit; PRANK) and distinguishesinsertions from deletions and avoids the "gapcost" conundrum. We describe an approach to selecting a guide tree purgedof ambiguously aligned regions and use this to refine PRANK performance. We show that although manual alignment issuccessful in finding repeat motifs and the most obvious indels, some regions can only be subjectively aligned, and there arelimits to the size and complexity of a data matrix for which this approach can be taken. PRANK alignments identified moreparsimony-informative indels while simultaneously increasing nucleotide identity in conserved sequence blocks flankingthe indel regions. When comparing manual and PRANK with two widely used methods (CLUSTAL, MUSCLE) for thealignment of the most length-variable intron, only PRANK recovered a tree congruent at deeper nodes with the combineddata tree inferred from all nuclear gene regions. We take this concordance as an objective function of alignment qualityand present a strongly supported phylogenetic hypothesis for Microlophus relationships. From this hypothesis we show that(1) a coded indel data partition derived from the PRANK alignment contributed significantly to nodal support and (2) theindel data set permitted detection of significant conflict between mitochondrial and nuclear data partitions, which we hy-pothesize arose from secondary contact of distantly related taxa, followed by hybridization and mtDNA introgression.[Indels; length-variable introns; Microlophus; mitochondrial-nuclear conflict; phylogenetics; progressive alignment; sec-ondary contact.]
Sequence homology statements are key to formulatingsound phylogenetic hypotheses, and multiple alignmentprograms based on either progressive (Thompsonet al., 1994 [CLUSTAL]; Edgar, 2004 [MUSCLE]) orconsistency-based scoring alignments (Notredame et al.,2000 [T-Coffe]), are widely used by systematists. Im-provements such as iterative optimizations to correct er-rors introduced early in the alignment process (Wallaceet. al., 2005) have greatly increased the accuracy and sen-sitivity of these methods (Thompson et al., 1999; Pollardet al., 2004; Wallace et al., 2005; Lunter et al., 2005a),but the majority of systematic studies commonly ap-ply a single heuristic alignment algorithm to data setswith different mutation mechanisms and mutation pat-terns (i.e., ribosomal versus protein-coding sequences),implying that all gene regions can be aligned under thesame set of assumptions. For example, the distributionof ribosomal gene substitutions is tightly constrainedby secondary structure, whereas protein gene substitu-tions are constrained by reading frame and codon con-servation (Li, 1997). In contrast, point mutations plusshort and long length mutations characterize the evo-lution of intron regions (Belshaw and Bensasson, 2006),and the indiscriminate application of a single heuristicalignment method (e.g., CLUSTAL) to protein-coding,noncoding, and ribosomal sequences is an inappropriateoversimplification.
The increased use of novel nuclear gene regions inphylogenetic studies, alone or combined with more tra-ditional markers such as ribosomal and mitochondrialgene regions, raises new theoretical and empirical issues
(e.g., parameter and tree optimization [Pagel and Meade,2004], data partitioning [Castoe et al., 2004; Brandleyet al., 2005], model choice [Sullivan and Joyce, 2005],and topological incongruence [Gatesy and Baker, 2005;Phillips et al., 2004]). Likewise, investigators have com-pared the performance of different alignment methods(Whiting et al., 2006; Kjer et al., 2007), but to our knowl-edge, a clear distinction of issues affecting alignmentprocedures across genes that do vary in tempo andclass of mutational event (point versus small indels ver-sus large length mutations) has not been presented. Inthis study, we empirically differentiate the alignmentof (a) protein coding and (b) ribosomal gene regionsfrom (c) nuclear introns characterized by length muta-tions of variable sizes and frequencies and compare phy-logenetic hypotheses generated from alignments thatmake these distinctions with those from two widelyused heuristic methods that do not. Our analyses ben-efit from recent insights for the global alignment of com-plex indel substitution patterns (Loytinoja and Goldman,2005).
The South American "Lava Lizards" (GenusMicrolophus)
The "lava lizards" (genus Microlophus; Tropiduridae)display an unusual geographic distribution among ter-restrial vertebrates; the 21 recognized species includenine taxa endemic to the Galapagos Archipelago and 12species mostly confined to a linear strip of 5000 km alongrain-shadowed western coastal deserts of South America
776
by guest on February 13, 2016http://sysbio.oxfordjournals.org/
Dow
nloaded from
2007 BENAVIDES ET AL.—NUCLEAR INTRONS AND LAVA LIZARD PHYLOGENY 777
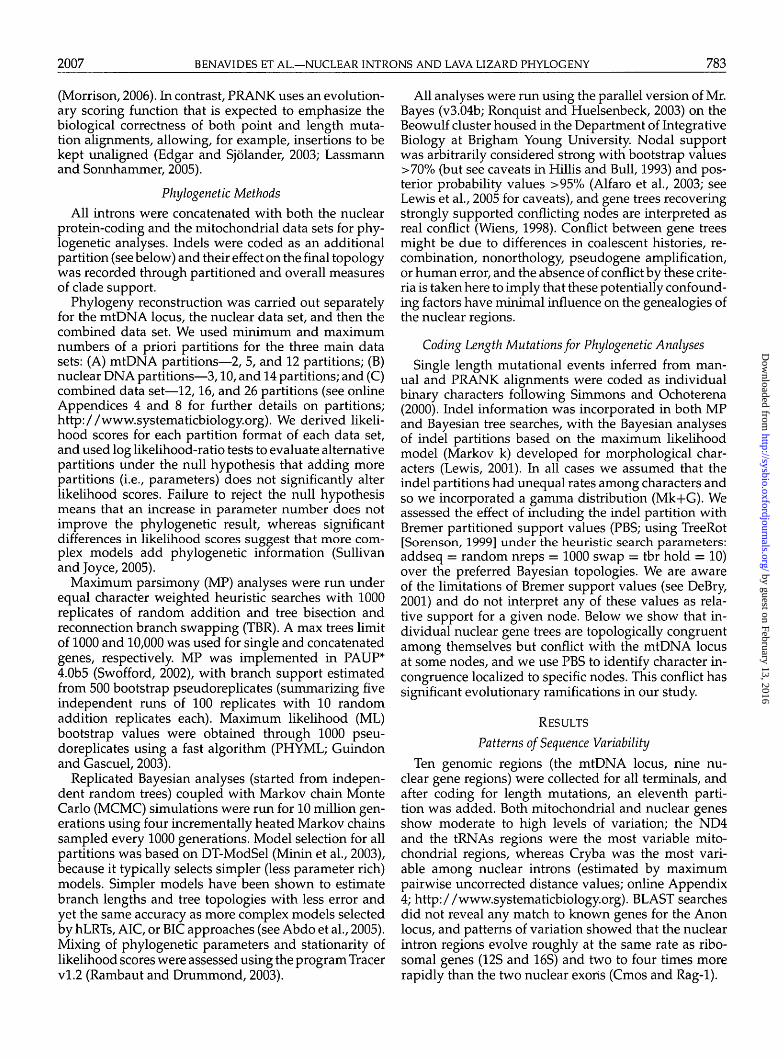
(Figs. 1 and 2). Monophyly of the genus is well supported(Frost, 1992; Harvey and Gutberlet, 2000; Frost et al.,2001), but the currently recognized OccipitaUs (Dixon andWright, 1975; Frost, 1992) and Peruvianus groups (VanDenburgh and Slevin, 1913; Frost, 1992; Heise, 1998) areless supported. The 12 species of the Occipitalis groupinclude the aforementioned nine Galapagos endemics,which represent two independent colonization eventsfrom the continent (Lopez et al., 1992; Wright, 1983;Heise, 1998; Kizirian et al., 2004). The remaining threespecies of Occipitalis plus the nine species of the Peru-vianus group are confined to the continent. This study isthe first to include all recognized species and multiplelocalities of widespread species and thus improves onearlier studies by increasing these two critical variablesof phylogenetic sampling design (Rokas et al., 2005). Ourobjectives are to (1) test a novel alignment strategy to thespecific problem of alignment of length-variable muta-tions typical of nuclear introns and (2) obtain a well-supported phylogeny for the genus Microlophus, as afoundation for ongoing studies of interisland coloniza-tion patterns in the Galapagos Archipelago, and patterns
of speciation within the Peruvianus group in mainlandSouth America.
MATERIALS AND METHODS
Taxon Sampling
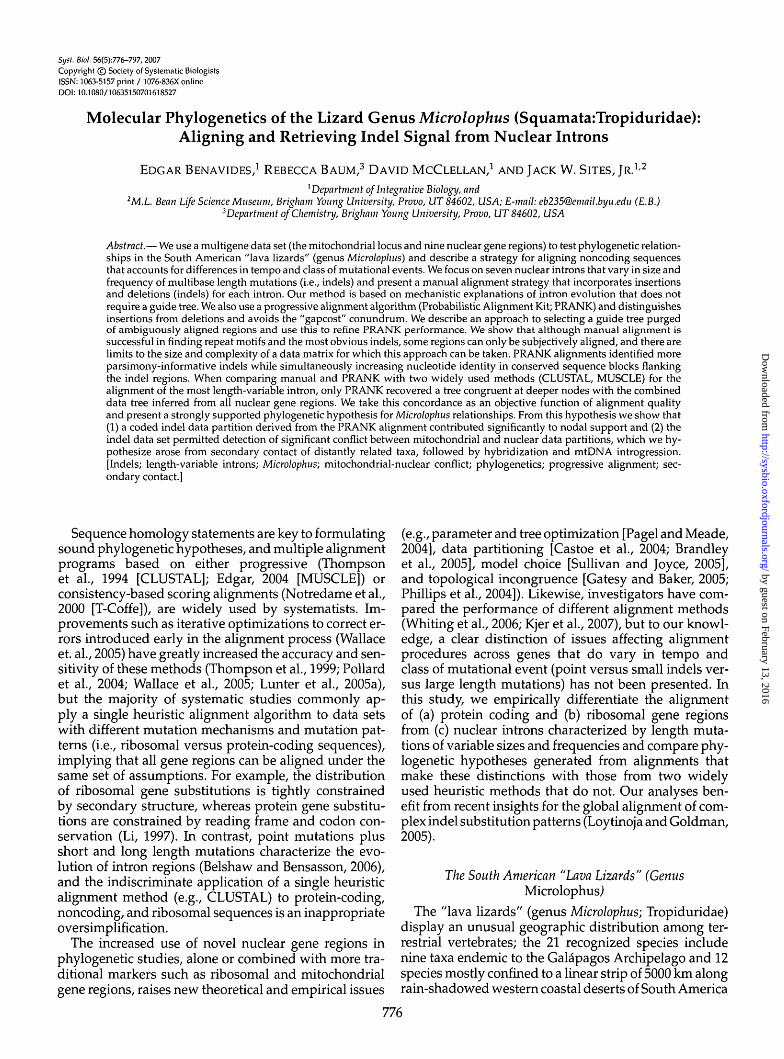
This study includes 73 terminals, of which 70 areingroup samples from one or more localities for eachof the 21 species of Microlophus; online Appendix 1(http://www.systematicbiology.org) summarizes local-ity information for each terminal and provides details onmuseum vouchers. All localities are shown in Figures 1and 2.
Sampling and Laboratory Methods
Genomic DNA was extracted from muscle tissue pre-served in 100% ethanol using either a slightly modi-fied version of the procedure of Fetzner (1999) or theQuiagen extraction kit (Quiagen, Valencia, CA). Am-plifications were performed (under varying profiles)in 20-fiL reaction volumes using TaKaRa hotstart Taq
& ' occSRM J f l K ^ | H
Galapagos 7 e * A C A 5 l i i S H ^ M
Talara(3spp.) A * ' ? W ^ S R R ^ H
occJEQ J M N H V I HthoK650N 9WSBBKmtM
thoPM " P Q J K L M IthoFM ^ L M K B I H
perK262N A ^ ^ H f ltesLY TCJ^HP
thoE « G ^ E |perSPv4fi
perJAH i
thoP
tesP
tesK
pKey to species of Microlophus'.
fr .Uy/514?|srASA
Occipitalis group
ft M. occipitalis (occ)0 M. stolzmanni (stz)V M. koepckeorum (kop)
Peruvianus group
• M. thoracicus (tho)• /W. peruvianus (per)# M. theresiae (tes)T M. tfgris (tig)0 M. heterolepis (het)® M. quadrivitattus (qua)O M. yanez/ (yan)0 M. theresioides (the)® M. atacamensis (ata)
i v
'••f •.•. l r #
t y ; - • • . ••
t i 9quaC^S|q U q u a ^ W
quaCZ'
qualQC $
ataISM * '
ataCOL ($M
ataTALtal
1o
ataTPL ̂ w^
300 Km X i
FIGURE 1. South American continental localities sampled for the 12 recognized species of mainland Microlophus used in this study. Localityand voucher details are summarized in Appendix 1; open and solid symbols identify species of the Occipitalis and Peruvianus groups (speciesacronyms in parentheses).
by guest on February 13, 2016http://sysbio.oxfordjournals.org/
Dow
nloaded from
778 SYSTEMATIC BIOLOGY VOL. 56
tN
M. pacificusPinta
pacPP
M. albemarlensisIsabels
habPM
habNB
M. habeliMarchena
M. jacobijacBC Santiago
jacBAM. indefatigabilis
jacBR5 T.indSY Santa CruzjacSCH i n d D M
indFE
Santa Fe
M. bivittatusSan Cristobal
OgraEN
M. grayiiFloreana
dellO
d e | * v d e l G A
M. delanonisEspanola
10 km
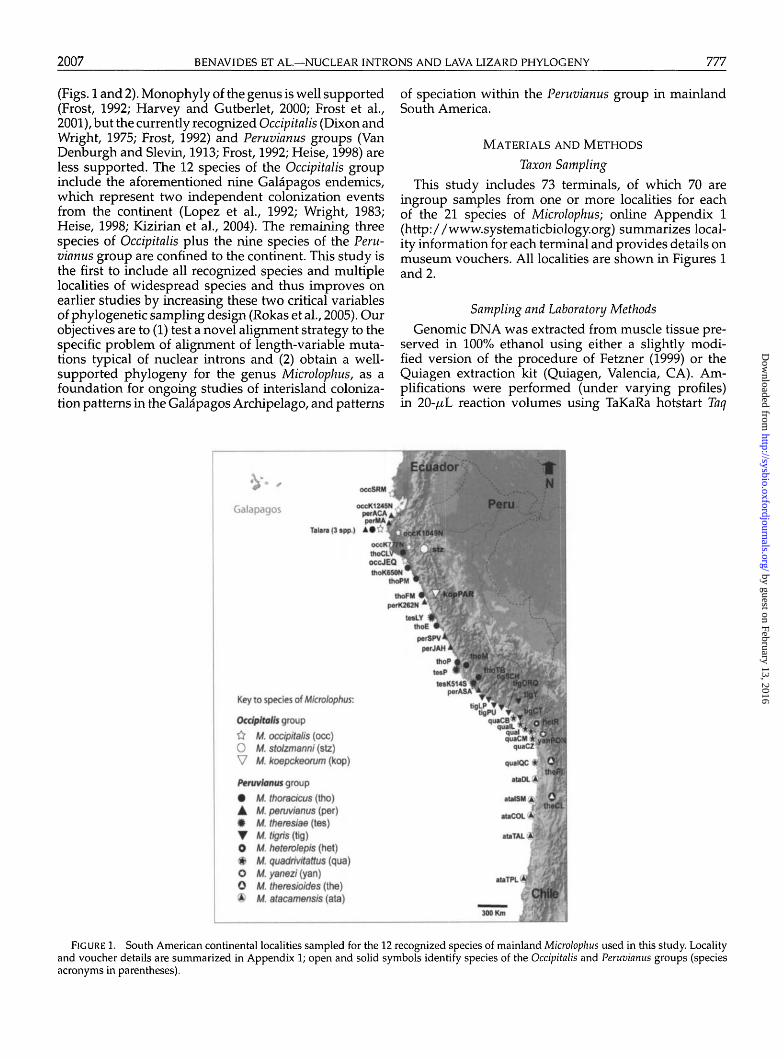
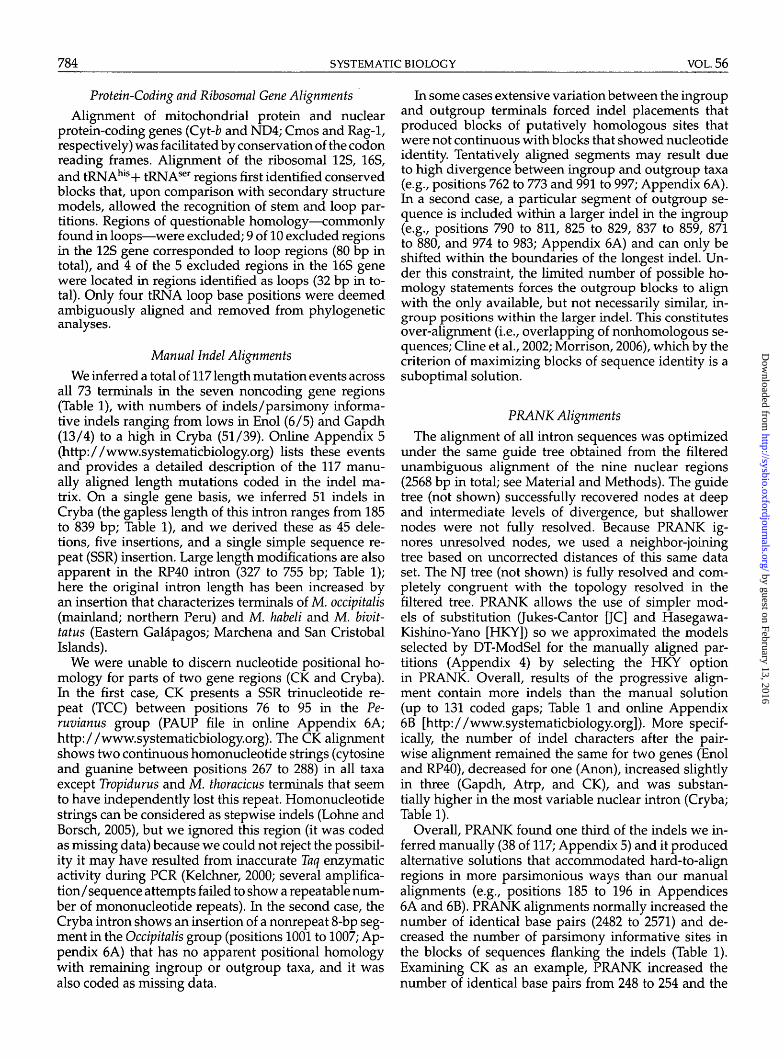
FIGURE 2. Localities sampled for the nine species of Microlophus endemic to the Galapagos Archipelago. Locality details are summarized inAppendix 1; solid and open stars identify the two species of the Eastern Galapagos Radiation (M. bivittatus and M. habeli).
DNA polymerase and 10 x reaction buffer (100 mMTris-HCl [pH 8.3], 500 mM KC1, 15 mM MgCl2). Fivemitochondrial (cyt-b, ND4, tRNAhis+ser, 12S, and 16S)and nine nuclear (recombination activating gene 1 [Rag-1], nuclear oocyte maturation factor gene [Cmos], a-enolase [Enol], glyceraldehyde-phosphate dehydroge-nase [Gapdh], creatin kinase [CK], ribosomal protein 40[RP40], B-crystallin [Cryba], a-tropomysin [Atrp], andan anonymous [Anon] region) gene regions were sam-pled for all terminals. Among the nuclear regions, onlythe Rag-1 and Cmos genes are coding genes, whereasthe remaining seven are noncoding introns. The primersand PCR conditions are summarized in online Appendix2 (http://www.systematicbiology.org). A BLAST searchdid not match the Anon locus to any known gene, andit displayed no conflict when used in phylogenetic anal-yses. It was therefore presumed to contain phylogeneticsignal and is included in all analyses (see Shaw [2002]and Dolman and Moritz [2006] for examples).
Purified double-stranded products were used di-rectly in 1/4 volume dideoxy-termination sequenc-ing reactions using BigDye Terminator v3.1 (AppliedBiosystems). Both strands were sequenced for all PCRproducts, and sequences were edited and proofreadwith Sequencher v. 4.1 (Gene Codes). All sequenced
gene regions were queried in BLAST searches ofGenBank to confirm homology. Complete sequenceshave been deposited in GenBank (online Appendix3; http://www.systematicbiology.org), whereas alignedsequences have been stored in TreeBase (project no.SN3395).
Alignment of Protein-Coding and Ribosomal Gene Regions
Protein-coding regions (Cyt-b and ND4 [mtDNA] andCmos and Rag-1 [nuclear]) were aligned using MUS-CLE (Edgar, 2004) and open reading frames checked withSeAl (Rambaut, 1996). Ribosomal (12S, 16S, and tRNAs)gene regions were also aligned with MUSCLE under de-fault parameters and then the "refine" command wasused twice to further improve the existing alignment. Fi-nal mtRNA positional homology was derived by visualadjustment to secondary structure models developed byVan de Peer et al. (1994 [for the 12S gene]); Gutell and Fox(1988 [for the 16S gene], but see Wiens and Reeder, 1997;and Cannone et al., 2002]), and Kumazawa and Nishida(1993 [for the tRNAs]). In some cases, single nucleotideswere shifted by a few base pairs to conserve base identitywith blocks inferred to be stem motifs (from the models),thus constraining small indels to appear in loop regions.
by guest on February 13, 2016http://sysbio.oxfordjournals.org/
Dow
nloaded from
2007 BENAVIDES ET AL.—NUCLEAR INTRONS AND LAVA LIZARD PHYLOGENY 779
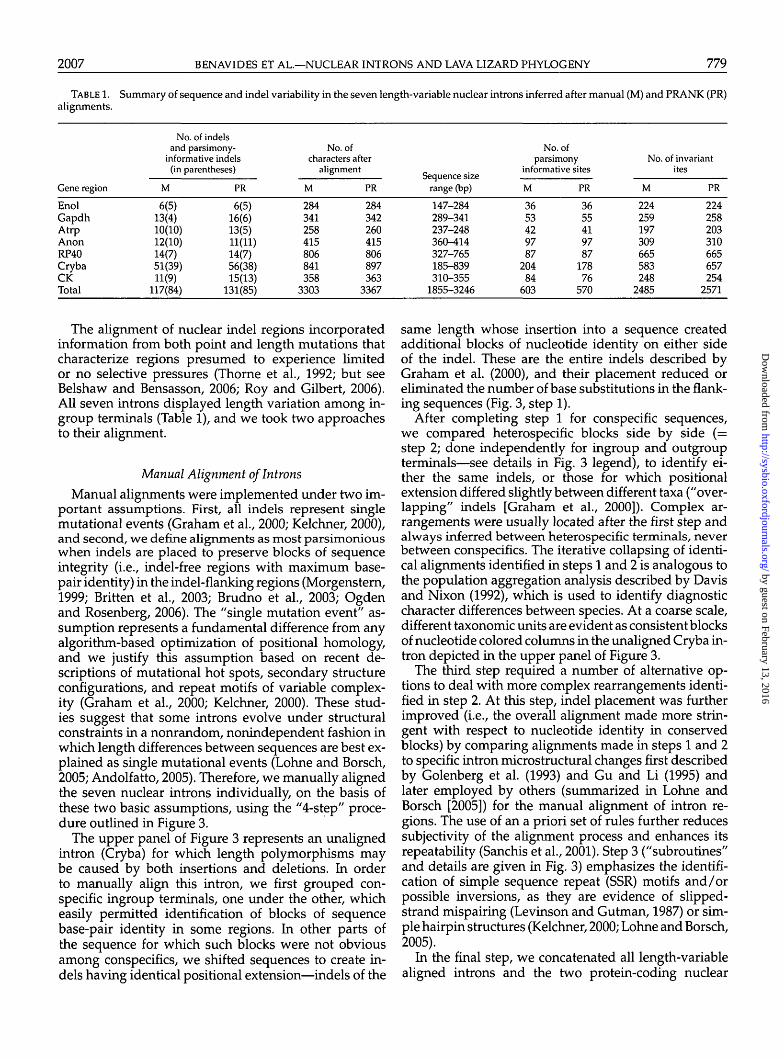
TABLE 1.
alignments.
Gene region
EnolGapdhAtrpAnonRP40CrybaCKTotal
Summary of sequence and indel variability in the seven length-variable nuclear introns inferred after manual (M) and PRANK (PR)
No. of indelsand parsimony-
informative indels(in parentheses)
M
6(5)13(4)10(10)12(10)14(7)51(39)11(9)
117(84)
PR
6(5)16(6)13(5)11(11)14(7)56(38)15(13)
131(85)
No. ofcharacters after
alignment
M
284341258415806841358
3303
PR
284342260415806897363
3367
Sequence sizerange (bp)
147-284289-341237-248360-414327-765185-839310-355
1855-3246
No.ofparsimony
informative sites
M
3653429787
20484
603
PR
3655419787
17876
570
No..
M
224259197309665583248
2485
of invariantites
PR
224258203310665657254
2571
The alignment of nuclear indel regions incorporatedinformation from both point and length mutations thatcharacterize regions presumed to experience limitedor no selective pressures (Thorne et al., 1992; but seeBelshaw and Bensasson, 2006; Roy and Gilbert, 2006).All seven introns displayed length variation among in-group terminals (Table 1), and we took two approachesto their alignment.
Manual Alignment of Introns
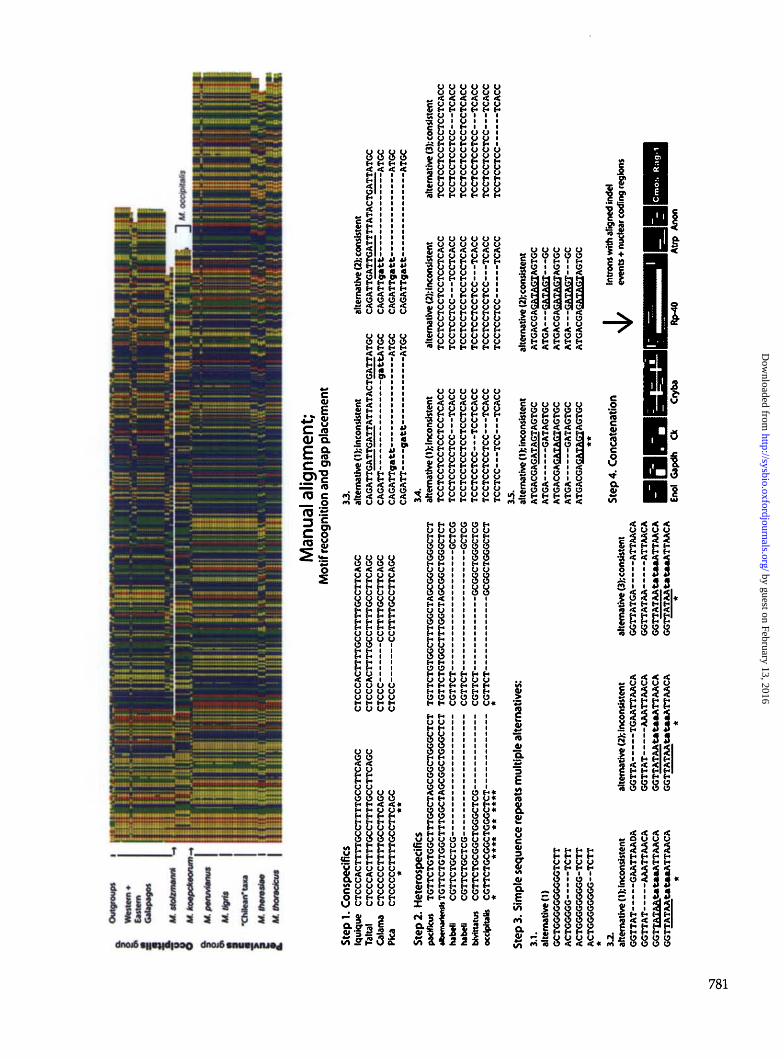
Manual alignments were implemented under two im-portant assumptions. First, all indels represent singlemutational events (Graham et al., 2000; Kelchner, 2000),and second, we define alignments as most parsimoniouswhen indels are placed to preserve blocks of sequenceintegrity (i.e., indel-free regions with maximum base-pair identity) in the indel-flanking regions (Morgenstern,1999; Britten et al., 2003; Brudno et al., 2003; Ogdenand Rosenberg, 2006). The "single mutation event" as-sumption represents a fundamental difference from anyalgorithm-based optimization of positional homology,and we justify this assumption based on recent de-scriptions of mutational hot spots, secondary structureconfigurations, and repeat motifs of variable complex-ity (Graham et al., 2000; Kelchner, 2000). These stud-ies suggest that some introns evolve under structuralconstraints in a nonrandom, nonindependent fashion inwhich length differences between sequences are best ex-plained as single mutational events (Lohne and Borsch,2005; Andolfatto, 2005). Therefore, we manually alignedthe seven nuclear introns individually, on the basis ofthese two basic assumptions, using the "4-step" proce-dure outlined in Figure 3.
The upper panel of Figure 3 represents an unalignedintron (Cryba) for which length polymorphisms maybe caused by both insertions and deletions. In orderto manually align this intron, we first grouped con-specific ingroup terminals, one under the other, whicheasily permitted identification of blocks of sequencebase-pair identity in some regions. In other parts ofthe sequence for which such blocks were not obviousamong conspecifics, we shifted sequences to create in-dels having identical positional extension—indels of the
same length whose insertion into a sequence createdadditional blocks of nucleotide identity on either sideof the indel. These are the entire indels described byGraham et al. (2000), and their placement reduced oreliminated the number of base substitutions in the flank-ing sequences (Fig. 3, step 1).
After completing step 1 for conspecific sequences,we compared heterospecific blocks side by side (=step 2; done independently for ingroup and outgroupterminals—see details in Fig. 3 legend), to identify ei-ther the same indels, or those for which positionalextension differed slightly between different taxa ("over-lapping" indels [Graham et al., 2000]). Complex ar-rangements were usually located after the first step andalways inferred between heterospecific terminals, neverbetween conspecifics. The iterative collapsing of identi-cal alignments identified in steps 1 and 2 is analogous tothe population aggregation analysis described by Davisand Nixon (1992), which is used to identify diagnosticcharacter differences between species. At a coarse scale,different taxonomic units are evident as consistent blocksof nucleotide colored columns in the unaligned Cryba in-tron depicted in the upper panel of Figure 3.
The third step required a number of alternative op-tions to deal with more complex rearrangements identi-fied in step 2. At this step, indel placement was furtherimproved (i.e., the overall alignment made more strin-gent with respect to nucleotide identity in conservedblocks) by comparing alignments made in steps 1 and 2to specific intron microstructural changes first describedby Golenberg et al. (1993) and Gu and Li (1995) andlater employed by others (summarized in Lohne andBorsch [2005]) for the manual alignment of intron re-gions. The use of an a priori set of rules further reducessubjectivity of the alignment process and enhances itsrepeatability (Sanchis et al., 2001). Step 3 ("subroutines"and details are given in Fig. 3) emphasizes the identifi-cation of simple sequence repeat (SSR) motifs and/orpossible inversions, as they are evidence of slipped-strand mispairing (Levinson and Gutman, 1987) or sim-ple hairpin structures (Kelchner, 2000; Lohne and Borsch,2005).
In the final step, we concatenated all length-variablealigned introns and the two protein-coding nuclear
by guest on February 13, 2016http://sysbio.oxfordjournals.org/
Dow
nloaded from
780 SYSTEMATIC BIOLOGY VOL. 56
regions (Cmos and Rag-1) to create the final nucleardata matrix (Fig. 3, step 4). Although time-consuming,our approach allows visualization of blocks of sequenceintegrity within and across multiple taxa and gives analignment based on the premise of primary homologyassessment (De Pinna, 1991). The matrix provides a rea-sonable comparative framework for input tree-basedcomputer-generated alignments (Sanchis et al., 2001;Creer et al., 2006) and maximizes nucleotide identity inflanking gapless intron sequences (Ogden and Rosen-berg, 2006; Siddharthan, 2006) as a proxy for nucleotidehomology hypotheses.
Progressive Alignment of Introns
We employed a modification of the current progres-sive algorithms (Edgar, 2004; Notredame et al., 2000;Katoh et al., 2000; Keightley and Johnson, 2004; Doet al., 2005) as an alternative to the manual alignment.The Probabilistic Alignment Kit (PRANK; Loytynoja andGoldman, 2005) algorithm implements Markov mod-els and probabilistic score schemes to handle multinu-cleotide indel events and distinguishes insertions fromdeletions, a step that is fundamental in the context ofintron sequence alignment. In most other programs, in-dels are penalized relative to nucleotide changes, andarbitrarily chosen penalties might produce either highlyfragmented sequences with multiple indels and few nu-cleotide differences (false negatives; Morrison 2006:512)or few indels coupled with many nucleotide differences(false positives or overalignment; Cline et al., 2002:309).
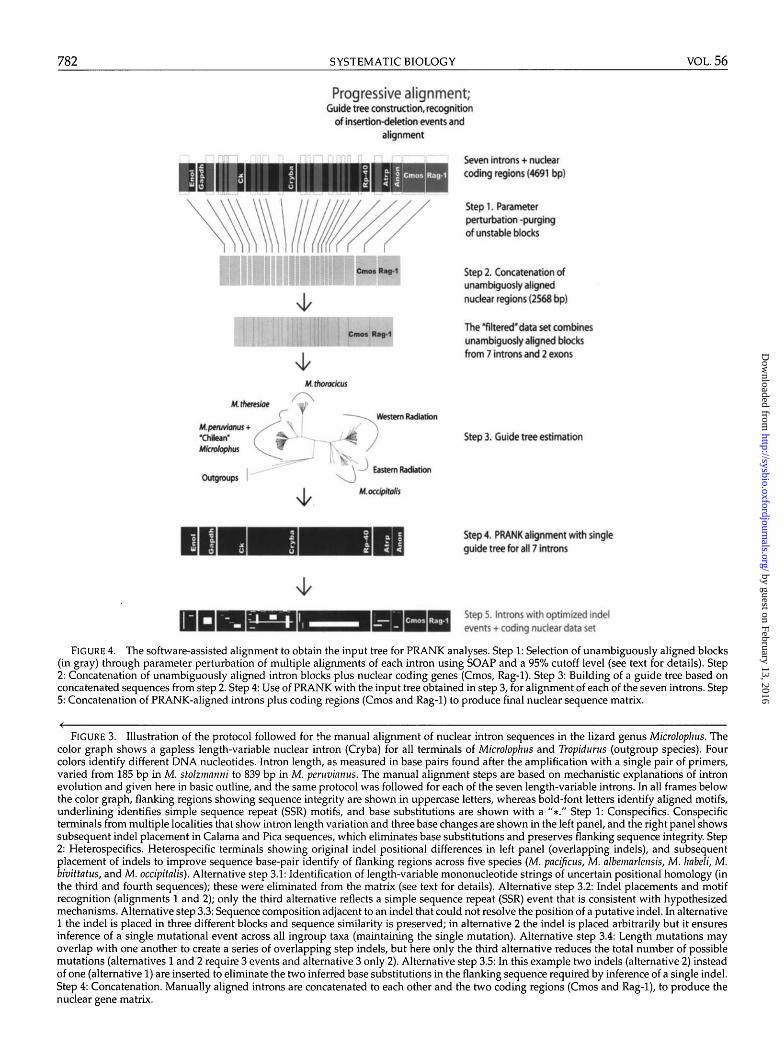
Multiple alignment programs penalize deletions onlywhere they occur, whereas single insertion events arepenalized multiple times in each alignment iteration be-tween their original occurrence and the root of the guidetree (Loytynoja and Goldman, 2005). PRANK uses out-group rooting to explicitly distinguish deletions from in-sertions and avoids repeated penalization of insertionsthrough the use of storage matrices that allows for dis-tinct subsolutions to be compared through a match/gap-scoring scheme that simultaneously models substi-tution processes. Because this method considers indelsas phylogenetic information, the algorithm may be sen-sitive to the order in which sequences are added (i.e.,the initial guide tree topology). Further, the effects ofguide tree bias on phylogenetic inference are likely to beamplified in large data sets, and such errors cannot bedisregarded (Redelings and Suchard, 2005; Kumar andFilipski, 2007:132). We generated a starting guide treeby concatenating intron fragments that were shown tobe unambiguously aligned by multiple alignment pro-grams, and we describe a 5-step protocol to constructan "unbiased" guide tree (one not influenced by indelplacement) for the PRANK alignment (Fig. 4).
First, we used parameter perturbation and multiplealignment programs to identify and then purge the orig-inal intron matrices of positions with uncertain homol-ogy. In step 1, we used the program SOAP (Loytynojaand Milinkovitch, 2001) to align each intron under dif-ferent parameters/algorithms and to purge the provi-
sional alignment from unstable blocks (i.e., those sen-sitive to parameter perturbation). Three programs wereused to generate provisional alignments of each intron.Parameter perturbation alignments were produced byCLUSTAL W with gap-opening penalties ranging from 1to 20 and gap-extension penalties ranging from 0.1 to 0.5(4x2 combinations). Two additional alignments (for a to-tal of 10 aligned matrices per intron) were included in thealignment pool, including (1) a tree-based partitioningalgorithm coupled with multiple iterations (MUSCLE;Edgar, 2004); and (2) a Bayesian probabilistic sequencealignment (ProAlign; Loytynoja and Milinkovitch, 2003).MUSCLE and ProAlign were run with default parame-ters. All blocks or positions supported by less than 95% inthe set of 10 provisional alignments were excluded fromeach intron to produce a single "purged" alignment. Instep 2, the seven purged matrices were concatenated toeach other and to the Cmos and Rag-1 coding sequences.The final matrix has a length of 2568 bp and includesroughly 54% of the original nuclear region data matrixof 4691 bp (Fig. 4). In step 3, the purged matrix was usedto construct the guide tree through a Bayesian analysis(10 million generations) based on a GTR-fl+G substitu-tion model. This topology was then used as the singleinput tree for the progressive alignment of each of theseven introns with PRANK (Fig. 4, step 4). Unless in-dicated, all PRANK alignments were made with defaultparameters and the HKY substitution model. Once align-ments for all indels were completed, the seven intronswere concatenated with the two protein-coding genes toproduce the final PRANK-aligned nuclear matrix (Fig. 4,step 5).
To further establish an a priori "baseline" againstwhich to compare both manual and PRANK-aligned se-quences, we constructed trees for the Cryba intron alonebased on CLUSTAL and MUSCLE alignments; all ofCryba gene trees are then compared for congruence tothe combined data tree (hereinafter the "combined" tree;see below). Our goal is not to provide an intensively"bench-marked" baseline on optimal alignment param-eters (see instead, Terry and Whiting, 2005; Smythe et al.,2007), but rather to qualitatively evaluate tree topologyand nodal support in the manual and PRANK-alignedsequences. We chose the Cryba intron because its se-quence complexity features: (1) "orphan" sequences (se-quences with no close similarity to the remaining species;e.g., M. stolzmanni); (2) distinct sequence subgroups (se-quences with high similarity within but not between sub-groups); (3) long- and short-repeat motifs, and (4) thehighest frequency of indels among the sampled introns.All of these factors are likely to drastically reduce theaccuracy of alignment algorithms (Pollard et al., 2004;Morrison, 2006).
We used topological congruence to the combinedtree as the single criterion to compare accuracy ofalignment results for the Cryba intron (Creer et al.,2006) and explicitly avoid the use of scoring func-tions (sum-of-pairs or column scores) because algorithmsthat depend on a pattern-matching reference alignmentmodel sequence patterns rather than historical processes
by guest on February 13, 2016http://sysbio.oxfordjournals.org/
Dow
nloaded from
I 8 S
Out
grou
ps
Wes
tern
*E
aste
rnG
alap
agos
Af
stot
zman
rt
M.
koop
ckeo
rum
-t
M.p
enni
anus
M.U
gri
s
'CM
Iean
'tax
a
M.t
her
esla
e
M.t
ho
rad
cus
Man
ual a
lignm
ent-
Mo
tif r
ecog
nitio
n a
nd g
ap p
lace
men
t
Ste
p!.
Con
spec
ifics
Iqui
que
CTCC
CACT
TTTG
CCTT
TTG
CCTT
CAG
CT
alta
l C
TC
CC
AC
TT
TT
GC
CT
TT
TG
CC
TT
CA
GC
Cal
ama
CTCC
CCCT
TTTG
CCTT
CAG
CPica
CTCCCCCTTTTGCCTTCAGC
CTCCCACTTTTGCCTTTTGCCTTCAGC
CTCCCACTTTTGCCTTTTGCCTTCAGC
CTCCC
CCTTTTGCCTTCAGC
CTCCC
CCTTTTGCCTTCAGC
Ste
p 2
. H
eter
osp
edft
csp
acif
ic*
TG
TT
CT
CT
GG
CT
TT
GG
CT
AG
CG
GC
TG
GG
CT
CT
TG
TT
CT
GT
GC
CT
TT
GG
CT
AG
CG
GC
TG
GG
CT
CT
«Kw
mM
tmh
TG
TT
CT
GT
GG
CT
TT
GG
CT
AG
CG
GC
TG
GG
CT
CT
TG
TT
CT
GT
GG
CT
TT
GG
CT
AG
CG
GC
TG
GG
CT
CT
hab
dl
CG
TT
CT
GC
TC
G
CG
TT
CT
GC
TCG
habe
ll C
GT
TC
TG
CT
CG
C
GT
TC
T G
CTC
Gbt
vitt
atus
C
GT
TC
TG
CG
GC
TG
GG
CT
CG
C
GT
TC
T G
CG
GC
TGG
GC
TCG
ocd
pit
alb
CG
TT
CT
GC
GG
CT
GG
GC
TC
T C
GT
TC
T G
CG
GC
TGG
GC
TCT
* *
**
* •
* •
•*
* *
Ste
p 3
. S
imp
le s
equ
ence
rep
eats
mu
ltip
le a
ltern
ativ
es:
3.1.
alte
rnat
ive
(1)
GCTCGGGGGGGGGTCTT
ACTGGGGG
TCTT
ACTGGGGGGGGG-TCTT
ACTCGGGGGGG—TCTT
32.
alte
rnat
ive
(1);
inco
nsi
sten
tGGTTAT
GAATTAAOA
GGTTAT
AAATTAACA
GG
TT
AT
AA
f t—
AT
TA
AC
AG
GT
TA
TA
Af t
—A
TT
AA
CA
alte
rnat
ive
(2);
inco
nsis
tent
GGTTA
TGAATTAACA
GGTTAT
AAATTAACA
GG
TT
AT
AA
f t—
AT
TA
AC
AG
GT
TA
TA
At«
t*«A
TT
AA
CA
alte
rnat
ive
(3);
conj
i$te
mG
GTT
ATG
A
ATT
AA
CA
GG
TTA
TAA
A
TTA
AC
AG
GT
TA
TA
Af t
—A
TTA
AC
AG
GT
TA
TA
Af t
—A
TT
AA
CA
33.
alte
rnat
ive
(1);
inco
nsis
tent
CAGATTGATTCATTATTATACTGATTATGC
CAGATT
gattATGC
CAGATTgatt
ATGC
CAGATT
gatt
ATGC
3A
alte
rnat
ive
(1);
Inco
nsi
sten
tTCCTCCTCCTCCTCCTCACC
TCCTCCTCCTCC—TCACC
TCCTCCTCCTCCTCCTCACC
TCCTCCTCC—TCCTCACC
TCCTCCTCCTCC---TCACC
TCCTCC—TCC
TCACC
23.
alte
rnat
ive
(1);
inco
nsi
sten
tATGACGAGATAGTAGTCC
ATGA
GATAGTGC
ATGACGAQAIASIAGTGC
ATGA
GATAGTGC
ATGACGAGATAGTAGTGC
Ste
p 4
. Co
nca
ten
atio
n
alte
rnat
ive
(2);
co
nsi
sten
tCAGATTGATTGATTTTATACTGATTATGC
CAGATTgatt
ATGC
CAGATTgatt
ATGC
CAGATTgatt
ATGC
alternative (2); in
consistent
TCCTCCTCCTCCTCCTCACC
TCCTCCTCC
TCCTCACC
TCCTCCTCCTCCTCCTCACC
TCCTCCTCCTCC—-TCACC
TCCTCCTCCTCC—TCACC
TCCTCCTCC
TCACC
alte
rnat
ive
(2);
co
nsi
sten
tATGACGAGATAGTAGTGC
ATGA
GATAGT
GC
ATGACGAGATAGTAGTGC
ATGA
GATAGT
GC
ATGACGA£A1A&XAGTGC
alte
rnat
ive
(3);
con
sist
ent
TC
CT
CC
TC
CT
CC
TC
CT
CA
CC
TCCTCCTCCTCC
TCACC
TCCTCCTCCTCCTCCTCACC
TCCTCCTCCTCC—TCACC
TCCTCCTCCTCC— -TCACC
TCCTCCTCC
TCACC
Enol G
apdh
Ck
Cryba
Rp
-40
Intr
on
s w
ith
alig
ned
in
del
even
ts +
nu
clea
r co
din
g re
gio
ns
—
Cm
os
R;i
g-1
Atr
p A
no
n
by guest on February 13, 2016http://sysbio.oxfordjournals.org/
Dow
nloaded from
782 SYSTEMATIC BIOLOGY VOL. 56
Progressive alignment-Guide tree construction, recognition
of insertion-deletion events andalignment
Cmos Rag-1
Emosf Rag-1
si/M. thoracicus
M. theresiae
M.peruvianus +"Chilean"Microlophus
J
Western Radiation
OutgroupsEastern Radiation
M. occipitalis
Seven introns + nuclearcoding regions (4691 bp)
Step 1. Parameterperturbation -purgingof unstable blocks
Step 2. Concatenation ofunambiguosly alignednuclear regions (2568 bp)
The "filtered"data set combinesunambiguosly aligned blocksfrom 7 introns and 2 exons
Step 3. Guide tree estimation
Step 4. PRANK alignment with singleguide tree for all 7 introns
Step 5. Introns with optimized indelevents + coding nuclear data set
FIGURE 4. The software-assisted alignment to obtain the input tree for PRANK analyses. Step 1: Selection of unambiguously aligned blocks(in gray) through parameter perturbation of multiple alignments of each intron using SOAP and a 95% cutoff level (see text for details). Step2: Concatenation of unambiguously aligned intron blocks plus nuclear coding genes (Cmos, Rag-1). Step 3: Building of a guide tree based onconcatenated sequences from step 2. Step 4: Use of PRANK with the input tree obtained in step 3, for alignment of each of the seven introns. Step5: Concatenation of PRANK-aligned introns plus coding regions (Cmos and Rag-1) to produce final nuclear sequence matrix.
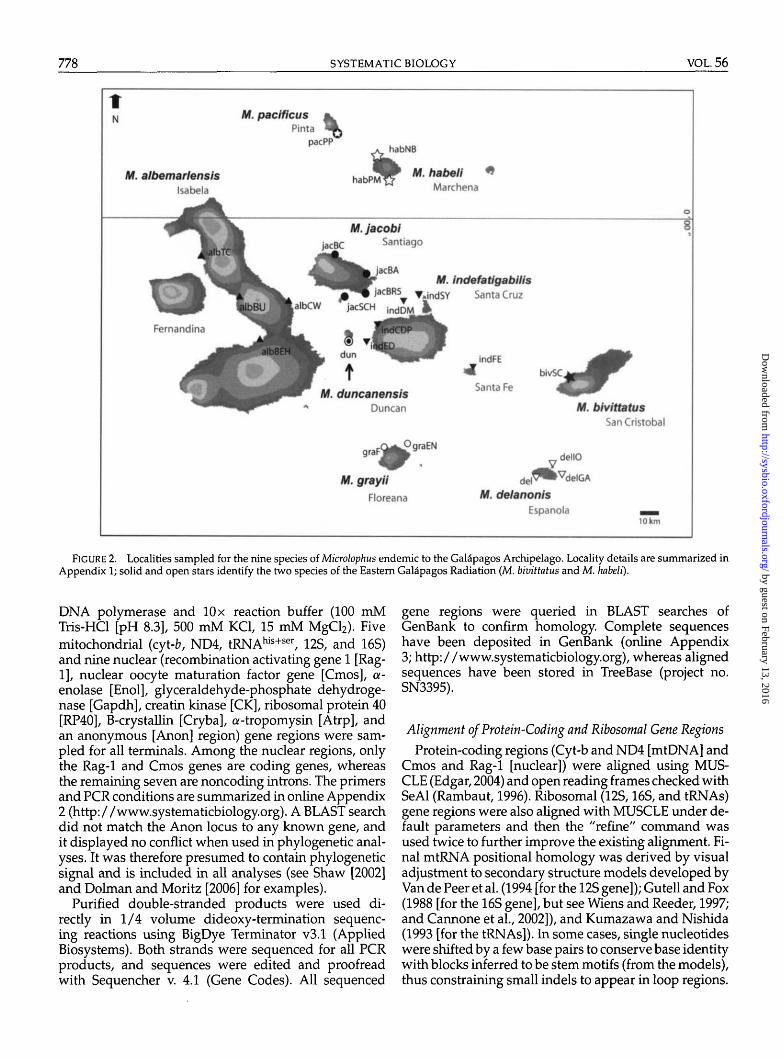
FIGURE 3. Illustration of the protocol followed for the manual alignment of nuclear intron sequences in the lizard genus Microlophus. Thecolor graph shows a gapless length-variable nuclear intron (Cryba) for all terminals of Microlophus and Tropidurus (outgroup species). Fourcolors identify different DNA nucleotides. Intron length, as measured in base pairs found after the amplification with a single pair of primers,varied from 185 bp in M. stolzmanni to 839 bp in M. peruvianus. The manual alignment steps are based on mechanistic explanations of intronevolution and given here in basic outline, and the same protocol was followed for each of the seven length-variable introns. In all frames belowthe color graph, flanking regions showing sequence integrity are shown in uppercase letters, whereas bold-font letters identify aligned motifs,underlining identifies simple sequence repeat (SSR) motifs, and base substitutions are shown with a "*." Step 1: Conspecifics. Conspecificterminals from multiple localities that show intron length variation and three base changes are shown in the left panel, and the right panel showssubsequent indel placement in Calama and Pica sequences, which eliminates base substitutions and preserves flanking sequence integrity. Step2: Heterospecifics. Heterospecific terminals showing original indel positional differences in left panel (overlapping indels), and subsequentplacement of indels to improve sequence base-pair identify of flanking regions across five species (M. pacificus, M. albemarlensis, M. habeli, M.bivittatus, and M. occipitalis). Alternative step 3.1: Identification of length-variable mononucleotide strings of uncertain positional homology (inthe third and fourth sequences); these were eliminated from the matrix (see text for details). Alternative step 3.2: Indel placements and motifrecognition (alignments 1 and 2); only the third alternative reflects a simple sequence repeat (SSR) event that is consistent with hypothesizedmechanisms. Alternative step 3.3: Sequence composition adjacent to an indel that could not resolve the position of a putative indel. In alternative1 the indel is placed in three different blocks and sequence similarity is preserved; in alternative 2 the indel is placed arbitrarily but it ensuresinference of a single mutational event across all ingroup taxa (maintaining the single mutation). Alternative step 3.4: Length mutations mayoverlap with one another to create a series of overlapping step indels, but here only the third alternative reduces the total number of possiblemutations (alternatives 1 and 2 require 3 events and alternative 3 only 2). Alternative step 3.5: In this example two indels (alternative 2) insteadof one (alternative 1) are inserted to eliminate the two inferred base substitutions in the flanking sequence required by inference of a single indel.Step 4: Concatenation. Manually aligned introns are concatenated to each other and the two coding regions (Cmos and Rag-1), to produce thenuclear gene matrix.
by guest on February 13, 2016http://sysbio.oxfordjournals.org/
Dow
nloaded from
2007 BENAVIDES ET AL.—NUCLEAR INTRONS AND LAVA LIZARD PHYLOGENY 783
(Morrison, 2006). In contrast, PRANK uses an evolution-ary scoring function that is expected to emphasize thebiological correctness of both point and length muta-tion alignments, allowing, for example, insertions to bekept unaligned (Edgar and Sjolander, 2003; Lassmannand Sonnhammer, 2005).
Pkylogenetic Methods
All introns were concatenated with both the nuclearprotein-coding and the mitochondrial data sets for phy-logenetic analyses. Indels were coded as an additionalpartition (see below) and their effect on the final topologywas recorded through partitioned and overall measuresof clade support.
Phylogeny reconstruction was carried out separatelyfor the mtDNA locus, the nuclear data set, and then thecombined data set. We used minimum and maximumnumbers of a priori partitions for the three main datasets: (A) mtDNA partitions—2, 5, and 12 partitions; (B)nuclear DNA partitions—3,10, and 14 partitions; and (C)combined data set—12,16, and 26 partitions (see onlineAppendices 4 and 8 for further details on partitions;http://www.systematicbiology.org). We derived likeli-hood scores for each partition format of each data set,and used log likelihood-ratio tests to evaluate alternativepartitions under the null hypothesis that adding morepartitions (i.e., parameters) does not significantly alterlikelihood scores. Failure to reject the null hypothesismeans that an increase in parameter number does notimprove the phylogenetic result, whereas significantdifferences in likelihood scores suggest that more com-plex models add phylogenetic information (Sullivanand Joyce, 2005).
Maximum parsimony (MP) analyses were run underequal character weighted heuristic searches with 1000replicates of random addition and tree bisection andreconnection branch swapping (TBR). A max trees limitof 1000 and 10,000 was used for single and concatenatedgenes, respectively. MP was implemented in PAUP*4.0b5 (Swofford, 2002), with branch support estimatedfrom 500 bootstrap pseudoreplicates (summarizing fiveindependent runs of 100 replicates with 10 randomaddition replicates each). Maximum likelihood (ML)bootstrap values were obtained through 1000 pseu-doreplicates using a fast algorithm (PHYML; Guindonand Gascuel, 2003).
Replicated Bayesian analyses (started from indepen-dent random trees) coupled with Markov chain MonteCarlo (MCMC) simulations were run for 10 million gen-erations using four incrementally heated Markov chainssampled every 1000 generations. Model selection for allpartitions was based on DT-ModSel (Minin et al., 2003),because it typically selects simpler (less parameter rich)models. Simpler models have been shown to estimatebranch lengths and tree topologies with less error andyet the same accuracy as more complex models selectedby hLRTs, AIC, or BIC approaches (see Abdo et al., 2005).Mixing of phylogenetic parameters and stationarity oflikelihood scores were assessed using the program Tracervl.2 (Rambaut and Drummond, 2003).
All analyses were run using the parallel version of Mr.Bayes (v3.04b; Ronquist and Huelsenbeck, 2003) on theBeowulf cluster housed in the Department of IntegrativeBiology at Brigham Young University. Nodal supportwas arbitrarily considered strong with bootstrap values>70% (but see caveats in Hillis and Bull, 1993) and pos-terior probability values >95% (Alfaro et al., 2003; seeLewis et al., 2005 for caveats), and gene trees recoveringstrongly supported conflicting nodes are interpreted asreal conflict (Wiens, 1998). Conflict between gene treesmight be due to differences in coalescent histories, re-combination, nonorthology, pseudogene amplification,or human error, and the absence of conflict by these crite-ria is taken here to imply that these potentially confound-ing factors have minimal influence on the genealogies ofthe nuclear regions.
Coding Length Mutations for Phylogenetic Analyses
Single length mutational events inferred from man-ual and PRANK alignments were coded as individualbinary characters following Simmons and Ochoterena(2000). Indel information was incorporated in both MPand Bayesian tree searches, with the Bayesian analysesof indel partitions based on the maximum likelihoodmodel (Markov k) developed for morphological char-acters (Lewis, 2001). In all cases we assumed that theindel partitions had unequal rates among characters andso we incorporated a gamma distribution (Mk+G). Weassessed the effect of including the indel partition withBremer partitioned support values (PBS; using TreeRot[Sorenson, 1999] under the heuristic search parameters:addseq = random nreps = 1000 swap = tbr hold = 10)over the preferred Bayesian topologies. We are awareof the limitations of Bremer support values (see DeBry,2001) and do not interpret any of these values as rela-tive support for a given node. Below we show that in-dividual nuclear gene trees are topologically congruentamong themselves but conflict with the mtDNA locusat some nodes, and we use PBS to identify character in-congruence localized to specific nodes. This conflict hassignificant evolutionary ramifications in our study.
RESULTS
Patterns of Sequence Variability
Ten genomic regions (the mtDNA locus, nine nu-clear gene regions) were collected for all terminals, andafter coding for length mutations, an eleventh parti-tion was added. Both mitochondrial and nuclear genesshow moderate to high levels of variation; the ND4and the tRNAs regions were the most variable mito-chondrial regions, whereas Cryba was the most vari-able among nuclear introns (estimated by maximumpairwise uncorrected distance values; online Appendix4; http://www.systematicbiology.org). BLAST searchesdid not reveal any match to known genes for the Anonlocus, and patterns of variation showed that the nuclearintron regions evolve roughly at the same rate as ribo-somal genes (12S and 16S) and two to four times morerapidly than the two nuclear exoris (Cmos and Rag-1).
by guest on February 13, 2016http://sysbio.oxfordjournals.org/
Dow
nloaded from
784 SYSTEMATIC BIOLOGY VOL. 56
Protein-Coding and Ribosomal Gene Alignments
Alignment of mitochondrial protein and nuclearprotein-coding genes (Cyt-b and ND4; Cmos and Rag-1,respectively) was facilitated by conservation of the codonreading frames. Alignment of the ribosomal 12S, 16S,and tRNAWs+ tRNAser regions first identified conservedblocks that, upon comparison with secondary structuremodels, allowed the recognition of stem and loop par-titions. Regions of questionable homology—commonlyfound in loops—were excluded; 9 of 10 excluded regionsin the 12S gene corresponded to loop regions (80 bp intotal), and 4 of the 5 excluded regions in the 16S genewere located in regions identified as loops (32 bp in to-tal). Only four tRNA loop base positions were deemedambiguously aligned and removed from phylogeneticanalyses.
Manual lndel AlignmentsWe inferred a total of 117 length mutation events across
all 73 terminals in the seven noncoding gene regions(Table 1), with numbers of indels/parsimony informa-tive indels ranging from lows in Enol (6/5) and Gapdh(13/4) to a high in Cryba (51/39). Online Appendix 5(http://www.systematicbiology.org) lists these eventsand provides a detailed description of the 117 manu-ally aligned length mutations coded in the indel ma-trix. On a single gene basis, we inferred 51 indels inCryba (the gapless length of this intron ranges from 185to 839 bp; Table 1), and we derived these as 45 dele-tions, five insertions, and a single simple sequence re-peat (SSR) insertion. Large length modifications are alsoapparent in the RP40 intron (327 to 755 bp; Table 1);here the original intron length has been increased byan insertion that characterizes terminals of M. occipitalis(mainland; northern Peru) and M. habeli and M. bivit-tatus (Eastern Galapagos; Marchena and San CristobalIslands).
We were unable to discern nucleotide positional ho-mology for parts of two gene regions (CK and Cryba).In the first case, CK presents a SSR trinucleotide re-peat (TCC) between positions 76 to 95 in the Pe-ruvianus group (PAUP file in online Appendix 6A;http://www.systematicbiology.org). The CK alignmentshows two continuous homonucleotide strings (cytosineand guanine between positions 267 to 288) in all taxaexcept Tropidurus and M. thoracicus terminals that seemto have independently lost this repeat. Homonucleotidestrings can be considered as stepwise indels (Lohne andBorsch, 2005), but we ignored this region (it was codedas missing data) because we could not reject the possibil-ity it may have resulted from inaccurate Taq enzymaticactivity during PCR (Kelchner, 2000; several amplifica-tion/sequence attempts failed to show a repeatable num-ber of mononucleotide repeats). In the second case, theCryba intron shows an insertion of a nonrepeat 8-bp seg-ment in the Occipitalis group (positions 1001 to 1007; Ap-pendix 6A) that has no apparent positional homologywith remaining ingroup or outgroup taxa, and it wasalso coded as missing data.
In some cases extensive variation between the ingroupand outgroup terminals forced indel placements thatproduced blocks of putatively homologous sites thatwere not continuous with blocks that showed nucleotideidentity. Tentatively aligned segments may result dueto high divergence between ingroup and outgroup taxa(e.g., positions 762 to 773 and 991 to 997; Appendix 6A).In a second case, a particular segment of outgroup se-quence is included within a larger indel in the ingroup(e.g., positions 790 to 811, 825 to 829, 837 to 859, 871to 880, and 974 to 983; Appendix 6A) and can only beshifted within the boundaries of the longest indel. Un-der this constraint, the limited number of possible ho-mology statements forces the outgroup blocks to alignwith the only available, but not necessarily similar, in-group positions within the larger indel. This constitutesover-alignment (i.e., overlapping of nonhomologous se-quences; Cline et al., 2002; Morrison, 2006), which by thecriterion of maximizing blocks of sequence identity is asuboptimal solution.
PRANK Alignments
The alignment of all intron sequences was optimizedunder the same guide tree obtained from the filteredunambiguous alignment of the nine nuclear regions(2568 bp in total; see Material and Methods). The guidetree (not shown) successfully recovered nodes at deepand intermediate levels of divergence, but shallowernodes were not fully resolved. Because PRANK ig-nores unresolved nodes, we used a neighbor-joiningtree based on uncorrected distances of this same dataset. The NJ tree (not shown) is fully resolved and com-pletely congruent with the topology resolved in thefiltered tree. PRANK allows the use of simpler mod-els of substitution (Jukes-Cantor [JC] and Hasegawa-Kishino-Yano [HKY]) so we approximated the modelsselected by DT-ModSel for the manually aligned par-titions (Appendix 4) by selecting the HKY optionin PRANK. Overall, results of the progressive align-ment contain more indels than the manual solution(up to 131 coded gaps; Table 1 and online Appendix6B [http://www.systematicbiology.org]). More specif-ically, the number of indel characters after the pair-wise alignment remained the same for two genes (Enoland RP40), decreased for one (Anon), increased slightlyin three (Gapdh, Atrp, and CK), and was substan-tially higher in the most variable nuclear intron (Cryba;Table 1).
Overall, PRANK found one third of the indels we in-ferred manually (38 of 117; Appendix 5) and it producedalternative solutions that accommodated hard-to-alignregions in more parsimonious ways than our manualalignments (e.g., positions 185 to 196 in Appendices6A and 6B). PRANK alignments normally increased thenumber of identical base pairs (2482 to 2571) and de-creased the number of parsimony informative sites inthe blocks of sequences flanking the indels (Table 1).Examining CK as an example, PRANK increased thenumber of identical base pairs from 248 to 254 and the
by guest on February 13, 2016http://sysbio.oxfordjournals.org/
Dow
nloaded from
2007 BENAVIDES ET AL.—NUCLEAR INTRONS AND LAVA LIZARD PHYLOGENY 785
a) M.atacamensis COLM.atacamensis ISMM.atacamensis TPLM.atacamensis TALM.atacamensis DLM.quadnyittatus CBM.quadrivittatus IOCM.quadrivittatus CZM.quadriyittatus CMM quadrivittatus ILMtheresipides CLM.theresioidBS PiM.yanezi PON_
helei
peruvianus
M.peruvianus ASAM peruvianus MAM peruvianus K262NM.penjvianus JAHM.pervvianus TAL
b)
per jvianus
T.insulanusT.preadicusM.atacamensis COLM.atacamensis ISM
M.quadrivittatus CZMdriittats CM
M.delanonis 10M.delanonisM.koepckeorum PARM.stolzmanni
q u tM.quadrivittatusM.quadrivittatus ILM.theresioidBS CLM.theresioides PiM.yanezi PONM.heterqlepis R
M.peruvianus ASAM.peruvianus K262NM.peruvianus JAHM.peruvianus TALM.peruvianus MAM.peruvianus SPV
M.iirisM.tlgris PUMtris LP
gris SCHM.atbemarlensis BEHM.albemarlensls FM.jaM.jacobi SCHM/£N
F
, sCDPM.indefat'aabilis DMM.indelatigabilis SYM.indefati&abllis EDM.lndefatigabllis FE
M.habeli PMMoccipilalis JEQ,k,M.occ!pltalisK777N
titalis KW49Ntitalis Kt245Nitalis TALitalis SRM
T.insulanusT.oreadicusM.atacamensis COLM.atacamensis ISMM.atacamensisTALM.atacamensis TPLM.quadrivittatus (M.quadrivittatus L .M.atacamensis DLM.quadrivittatus CZM.quadriyittatus CBM.quadrivittatus ILM.theresioides CLM.theresioides PiM.yanezi PON
heterolepisR
peruvianusM.peruvianus ASAM.peruvianus JAHM.peruvianusTALM.peruvianus SPVM.peruvianus K2B2NM.peruvianus MA
MM.trgris PUM.tigris LPM.tigris SCHM.aibemariensis BEHM.aibemariensis FM.TacM.jacobiSCHM.grayiiENM.Qrayii?MQuncanensisM.indelatigabilis CDPM.indefaligabilis DMM.indelatigabilis SYM.indetatigabilis EDMMetatigabilis FE"albeniarlen,sis I
pad'
d)
peruviaius
T.insulanusT.oreadicusM.atacamensis COLM.atacamensis ISMM i TALM.atacamen TPM.quadrivittatus CZM.quadrivittatus IOCM.quadrivittatus CM• talacarpensis DL
occipitalis
BEHM albemariensis FM.duncanensisM.indelatigabilis CDPM.indelatigabilis DMM.indelaligabilis SYM.indelBtigabijisEDM.indelat&abilis FEM.grayii ENM.grayii FM.facbbi BAM.jacobiSCHMpacificusPP,M.aibemariensis I
M.aibemariensis CWM.delanonis fM.delanonis iM.delanonisM.bivjttatus SCM.habeliNBM.habeliPM
M.occipltalis KW9NM.occipitalis K1245NM.occipitalis TALM.occipltalis SRMM.koepckeorum PARM.stolzmanni
by guest on February 13, 2016http://sysbio.oxfordjournals.org/
Dow
nloaded from
786 SYSTEMATIC BIOLOGY VOL. 56
number of indels from 11 to 15 (9 and 13 parsimony in-formative, respectively), whereas decreasing the numberof parsimony informative sites from 84 to 76 (Table 1).Additional differences were the rearrangement of thetrinucleotide simple sequence repeat (SSR) of positions76 to 95 (Appendices 6A and 6B), and PRANK inferredtwo single-base pair insertions restricted to the outgrouptaxa (positions 191 and 275; Appendix 6B).
The Cryba Intron as an Example
The alignment of Cryba underscored the need for se-lection of a substitution model and correction parametersimplemented in PRANK. Our preferred alignment (i.e.,the one consistent with the combined evidence tree) wasobtained when using the HKY model (kappa = 1.830 andempirical base frequencies 0.229/0.276/0.230/0.263 forA/C/G/T) and forcing insertions to be always skipped.Compared to the manual solution, the PRANK align-ment significantly reduced the number of parsimony in-formative sites (from 204 to 178; Table 1), increased thenumber of identical positions (from 583 to 657; implyingfewer point mutations after indel optimization), andobtained higher likelihood scores (see Fig. 5). PRANKopened a number of gaps and insertions already presentin the manual alignment but refined this alignmentby inferring more parsimonious solutions for the loca-tion of indels (see Appendix 6B for additional details).Most importantly, PRANK distributed the reduced se-quence of M. stolzmanni (185 versus 839 bp in the out-group) in a solution that maximized nucleotide identityin small blocks, without modifying the default values forthe gap extension (gaprate) and gap-opening (gaptext)probabilities.
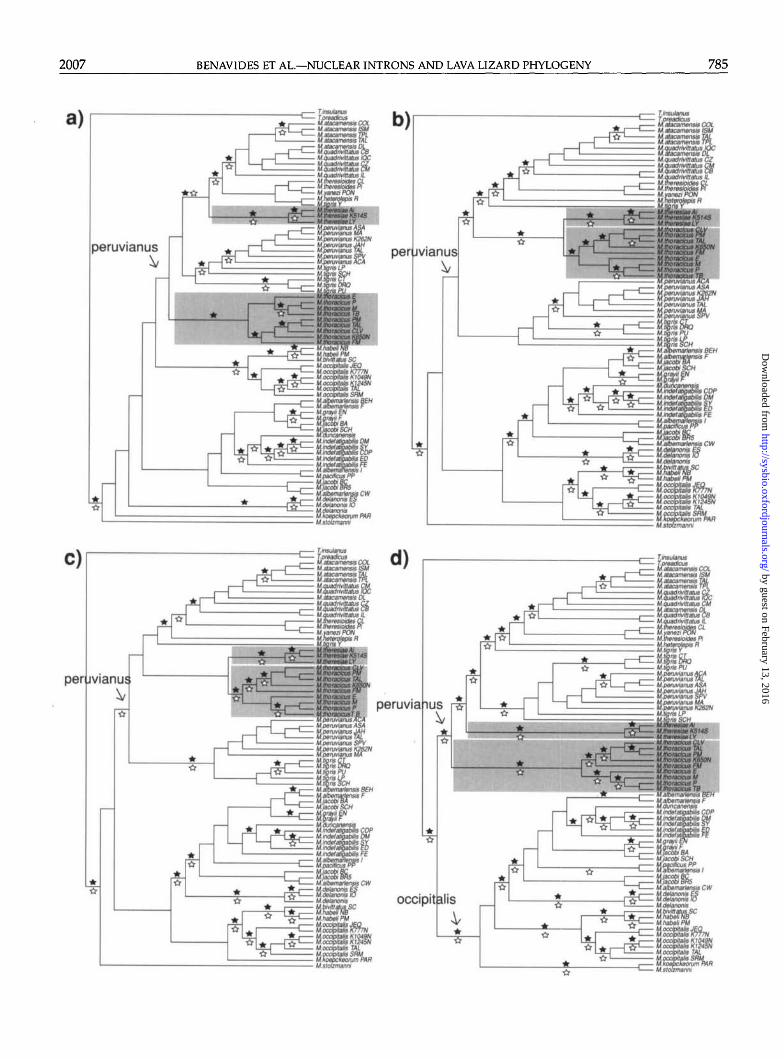
To compare the level of phylogenetic congruence of thePRANK versus other alignments, we realigned the Crybaintron with CLUSTAL and MUSCLE (using default pa-rameters in both) and then generated Cryba gene trees forthese plus the manual and PRANK alignments. Figure5 illustrates four gene trees and shows that the PRANKtree recovers more of the deep nodes present in the com-bined tree, and with higher support, than any of the oth-ers. It is the only topology that, for example, recoversthe Occipitalis and Peruvianus clades with strong supportand, within the latter, the M. thoracicus and M. there-siae clades at the base of the Peruvianus group (all withstrong support). Gene trees obtained from CLUSTAL,MUSCLE, and manual alignments recovered "wrong"topologies in conflict with the combined tree and havingfewer well-supported clades. Notably, the PRANK align-ment that modeled the Cryba transition/trans version ra-tio (using the HKY model) recovered a similar topologybut 126.2 likelihood units better and 18 steps shorter
(TL = 312) than the PRANK Jukes and Cantor defaultalignment.
Phylogenetic Analyses—Mitochondrial DNA
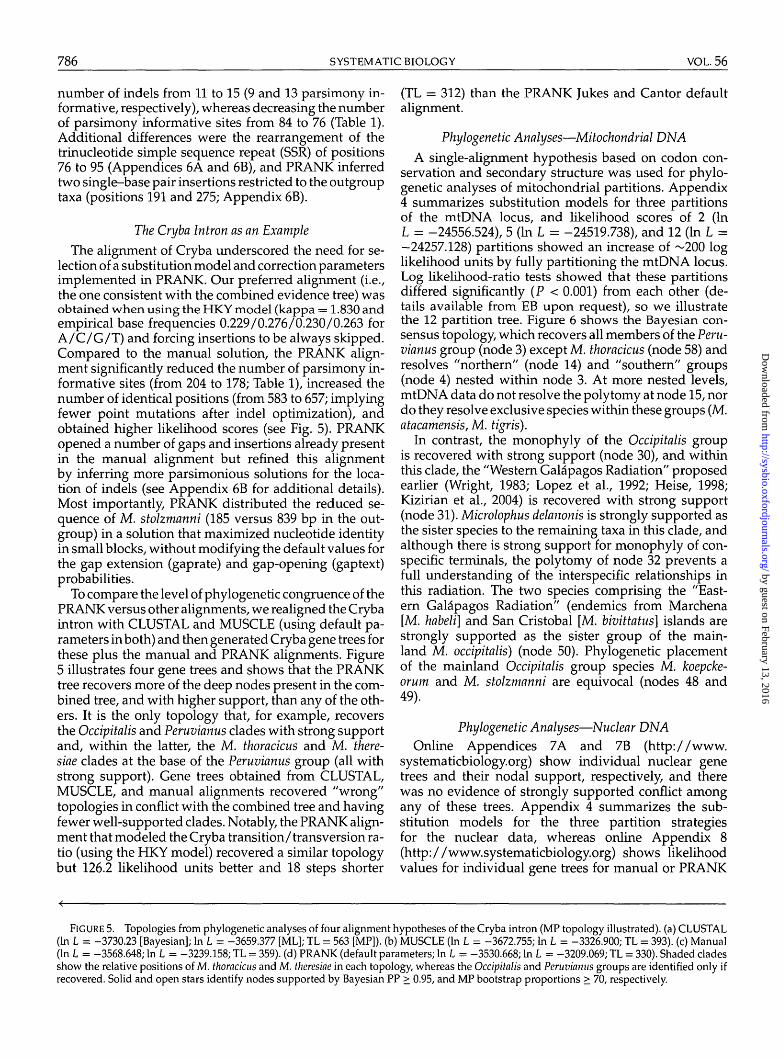
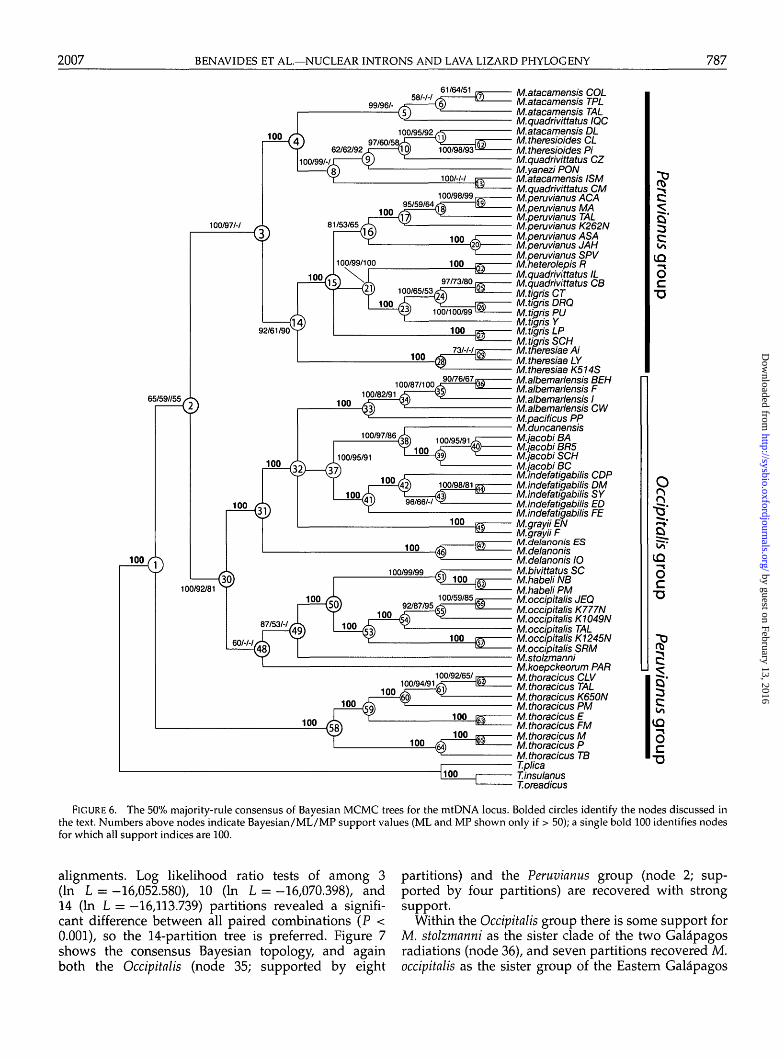
A single-alignment hypothesis based on codon con-servation and secondary structure was used for phylo-genetic analyses of mitochondrial partitions. Appendix4 summarizes substitution models for three partitionsof the mtDNA locus, and likelihood scores of 2 (InL = -24556.524), 5 (In L = -24519.738), and 12 (In L =-24257.128) partitions showed an increase of ~200 loglikelihood units by fully partitioning the mtDNA locus.Log likelihood-ratio tests showed that these partitionsdiffered significantly (P < 0.001) from each other (de-tails available from EB upon request), so we illustratethe 12 partition tree. Figure 6 shows the Bayesian con-sensus topology, which recovers all members of the Peru-vianus group (node 3) except M. thoracicus (node 58) andresolves "northern" (node 14) and "southern" groups(node 4) nested within node 3. At more nested levels,mtDNA data do not resolve the polytomy at node 15, nordo they resolve exclusive species within these groups (M.atacamensis, M. tigris).
In contrast, the monophyly of the Occipitalis groupis recovered with strong support (node 30), and withinthis clade, the "Western Galapagos Radiation" proposedearlier (Wright, 1983; Lopez et al, 1992; Heise, 1998;Kizirian et al., 2004) is recovered with strong support(node 31). Microlophus delanonis is strongly supported asthe sister species to the remaining taxa in this clade, andalthough there is strong support for monophyly of con-specific terminals, the polytomy of node 32 prevents afull understanding of the interspecific relationships inthis radiation. The two species comprising the "East-ern Galapagos Radiation" (endemics from Marchena[M. habeli) and San Cristobal [M. bivittatus] islands arestrongly supported as the sister group of the main-land M. occipitalis) (node 50). Phylogenetic placementof the mainland Occipitalis group species M. koepcke-orum and M. stolzmanni are equivocal (nodes 48 and49).
Phylogenetic Analyses—Nuclear DNA
Online Appendices 7 A and 7B (http://www.systematicbiology.org) show individual nuclear genetrees and their nodal support, respectively, and therewas no evidence of strongly supported conflict amongany of these trees. Appendix 4 summarizes the sub-stitution models for the three partition strategiesfor the nuclear data, whereas online Appendix 8(http://www.systematicbiology.org) shows likelihoodvalues for individual gene trees for manual or PRANK
FIGURE 5. Topologies from phylogenetic analyses of four alignment hypotheses of the Cryba intron (MP topology illustrated), (a) CLUSTAL(In L = -3730.23 [Bayesian]; In L = -3659.377 [ML]; TL = 563 [MP]). (b) MUSCLE (In L = -3672.755; In L = -3326.900; TL = 393). (c) Manual(In L = -3568.648; In L = -3239.158; TL = 359). (d) PRANK (default parameters; In L = -3530.668; In L = -3209.069; TL = 330). Shaded cladesshow the relative positions of M. thoracicus and M. theresiae in each topology, whereas the Occipitalis and Peruviamis groups are identified only ifrecovered. Solid and open stars identify nodes supported by Bayesian PP > 0.95, and MP bootstrap proportions > 70, respectively.
by guest on February 13, 2016http://sysbio.oxfordjournals.org/
Dow
nloaded from
2007 BENAVIDES ET AL.—NUCLEAR INTRONS AND LAVA LIZARD PHYLOGENY 787
58/-/-/,61/64/51 M.atacamensis COL
M.atacamensis TPLM.atacamensis TALM.quadrivittatus IQCM.atacamensis DLM.theresioides CLM.theresioides PiM.quadrivittatus CZM.yanezi PONM.atacamensis ISMM.quadrivittatus CMM.peruvianus ACAM.peruvianus MAM.peruvianus TALM.peruvianus K262NM.peruvianus ASAM.peruvianus JAHM.peruvianus SPVM.heterolepis RM.quadrivittatus ILM.quadrivittatus CBM.tigris CTM.tigris DRQM.tigris PUM.tigris YM.tigris LPM.tigris SCHM.theresiae AiM.theresiae LYM.theresiae K514SM.albemarlensis BEHM.albemarlensis FM.albemarlensis IM.albemarlensis CWM.pacificus PPM.duncanensisM.jacobi BAM.jacobi BR5M.jacobi SCHM.jacobi BCM.indefatigabilis CDPM.indefatigabilis DMM.indefatigabilis SYM.indefatigabilis EDM.indefatigabilis FEM.grayii ENM.grayii FM.delanonis ESM.delanonisM.delanonis 10M.bivittatus SCM.habeli NBM.habeli PMM.occipitalis JEQM.occipitalis K777NM.occipitalis K1049NM.occipitalis TALM.occipitalis K1245NM.occipitalis SRMM.stolzmanniM.koepckeorum PARM.thoracicus CLVM.thoracicus TALM.thoracicus K650NM.thoracicus PMM.thoracicus EM.thoracicus FMM.thoracicus MM.thoracicus PM.thoracicus TBT.plicaT.insulanusT.oreadicus
i
CD
3
on
CO
O
c
3Cen
CD
OC"O
FIGURE 6. The 50% majority-rule consensus of Bayesian MCMC trees for the mtDNA locus. Bolded circles identify the nodes discussed inthe text. Numbers above nodes indicate Bayesian/ML/MP support values (ML and MP shown only if > 50); a single bold 100 identifies nodesfor which all support indices are 100.
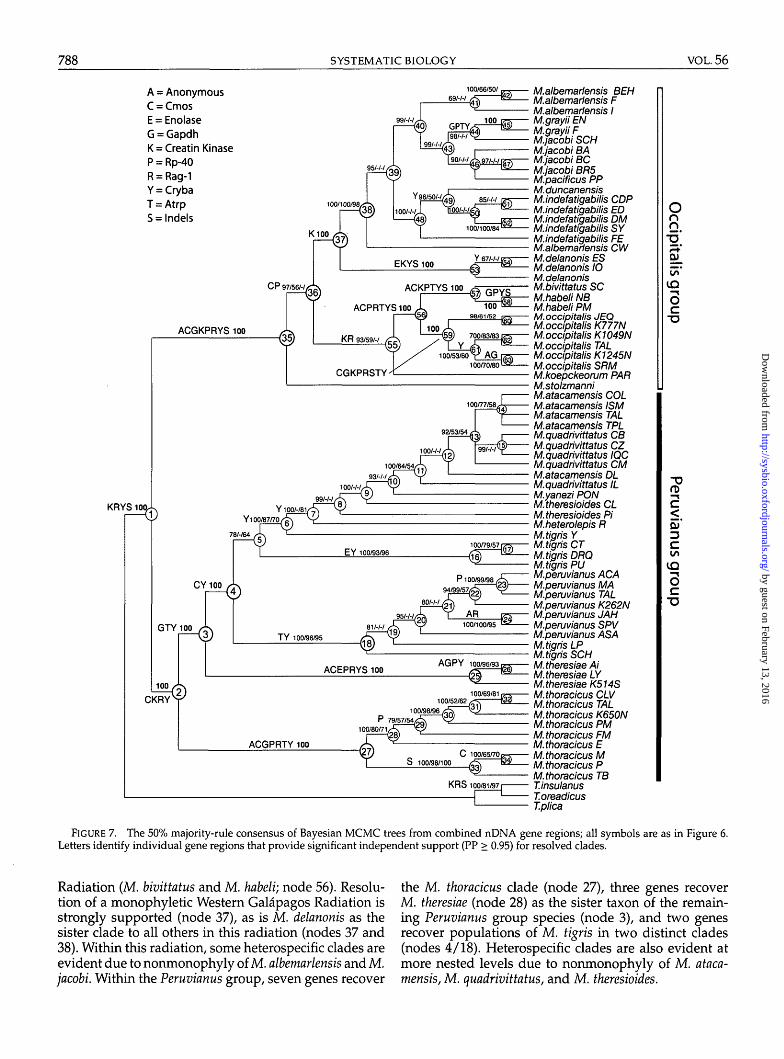
alignments. Log likelihood ratio tests of among 3(In L = -16,052.580), 10 (In L = -16,070.398), and14 (In L = -16,113.739) partitions revealed a signifi-cant difference between all paired combinations (P <0.001), so the 14-partition tree is preferred. Figure 7shows the consensus Bayesian topology, and againboth the Occipitalis (node 35; supported by eight
partitions) and the Peruvianus group (node 2; sup-ported by four partitions) are recovered with strongsupport.
Within the Occipitalis group there is some support forM. stolzmanni as the sister clade of the two Gal&pagosradiations (node 36), and seven partitions recovered M.occipitalis as the sister group of the Eastern Gal&pagos
by guest on February 13, 2016http://sysbio.oxfordjournals.org/
Dow
nloaded from
788 SYSTEMATIC BIOLOGY VOL. 56
A = AnonymousC = CmosE = EnolaseG = GapdhK = Creatin KinaseP = Rp-4OR = Rag-1Y = CrybaT = AtrpS = lndels o
nn
Oc
M.albemarlensis BEHM.albemarlensis FM.albemarlensis IM.grayii ENM.grayii FM.jacobi SCHM.jacobi BAM.jacobi BCM.jacobi BR5M.pacificus PPM.duncanensisM.indefatigabilis CDPM.indefatigabilis EDM.indefatigabilis DMM.indefatigabilis SYM.indefatigabilis FEM.albemarlensis CWM.delanonis ESM.delanonis 10M.delanonisM.bivittatus SCM.habeli NBM.habeli PM
jsTj M.occipitalis JEQm— M.occipitalis K777N
M.occipitalis K1049NM.occipitalis TALM.occipitalis K1245NM.occipitalis SRMM.koepckeorum PARM.stolzmanniM.atacamensis COLM.atacamensis ISMM.atacamensis TALM.atacamensis TPLM.quadriyittatus CBM.quadriyittatus CZM.quadriyittatus IQCM.quadrivittatus CMM.atacamensis DLM.quadrivittatus ILM.yanezi PONM.theresioides CLM.theresioides PiM.heterolepis RM.tigris YM.tigrisCTM.tigris DRQM.tigris PUM.peruvianus ACAM.peruvianus MAM.peruvianus TALM.peruvianus K262N
1̂5 M.peruvianus JAH^ — M.peruvianus SPV
M.peruvianus ASAM.tigris LPM.tigris SCHM.theresiae AiM.theresiae LYM.theresiae K514SM.thoracicus CLVM.thoracicus TALM.thoracicus K650NM.thoracicus PMM.thoracicus FMM.thoracicus EM.thoracicus MM.thoracicus PM.thoracicus TBT.insulanusT.oreadicusT.plica
FIGURE 7. The 50% majority-rule consensus of Bayesian MCMC trees from combined nDNA gene regions; all symbols are as in Figure 6.Letters identify individual gene regions that provide significant independent support (PP > 0.95) for resolved clades.
DCto
3
Radiation (M. bivittatus and M. habeli; node 56). Resolu-tion of a monophyletic Western Galapagos Radiation isstrongly supported (node 37), as is M. delanonis as thesister clade to all others in this radiation (nodes 37 and38). Within this radiation, some heterospecific clades areevident due to nonmonophyly of M. albemarlensis and M.jacobi. Within the Peruvianus group, seven genes recover
the M. thoracicus clade (node 27), three genes recoverM. theresiae (node 28) as the sister taxon of the remain-ing Peruvianus group species (node 3), and two genesrecover populations of M. tigris in two distinct clades(nodes 4/18). Heterospecific clades are also evident atmore nested levels due to nonmonophyly of M. ataca-mensis, M. quadrivittatus, and M. theresioides.
by guest on February 13, 2016http://sysbio.oxfordjournals.org/
Dow
nloaded from
2007 BENAVIDES ET AL.—NUCLEAR INTRONS AND LAVA LIZARD PHYLOGENY 789
Combined Data and a Phylogenetic Hypothesis forMicrolophus
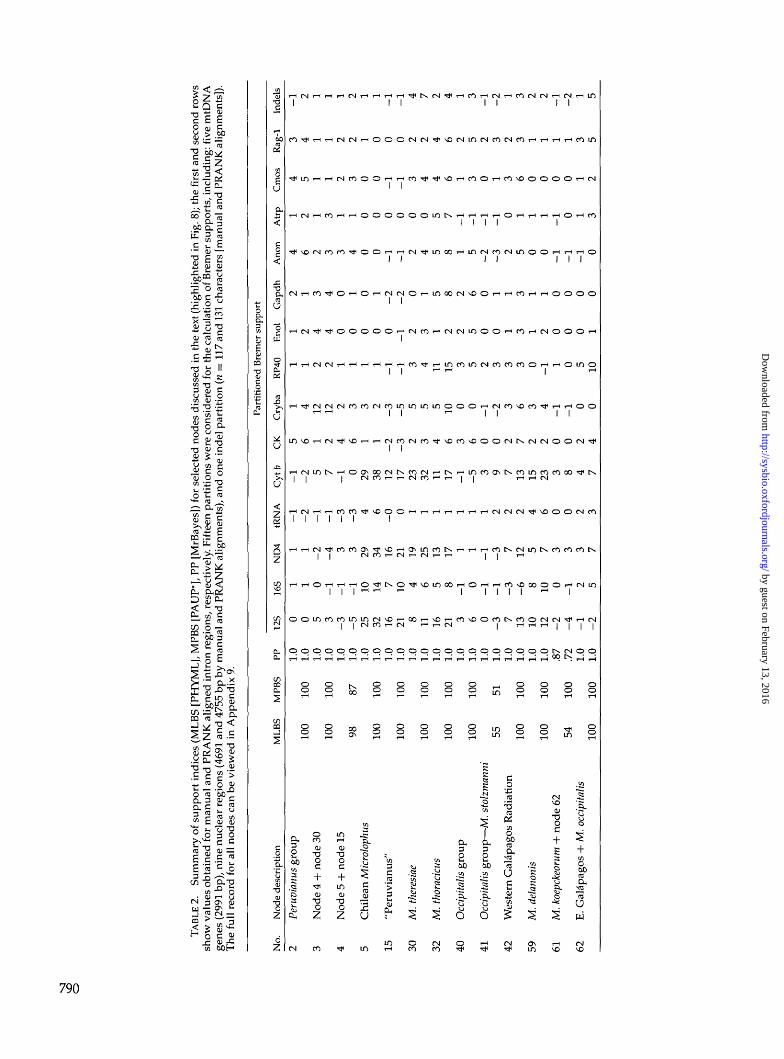
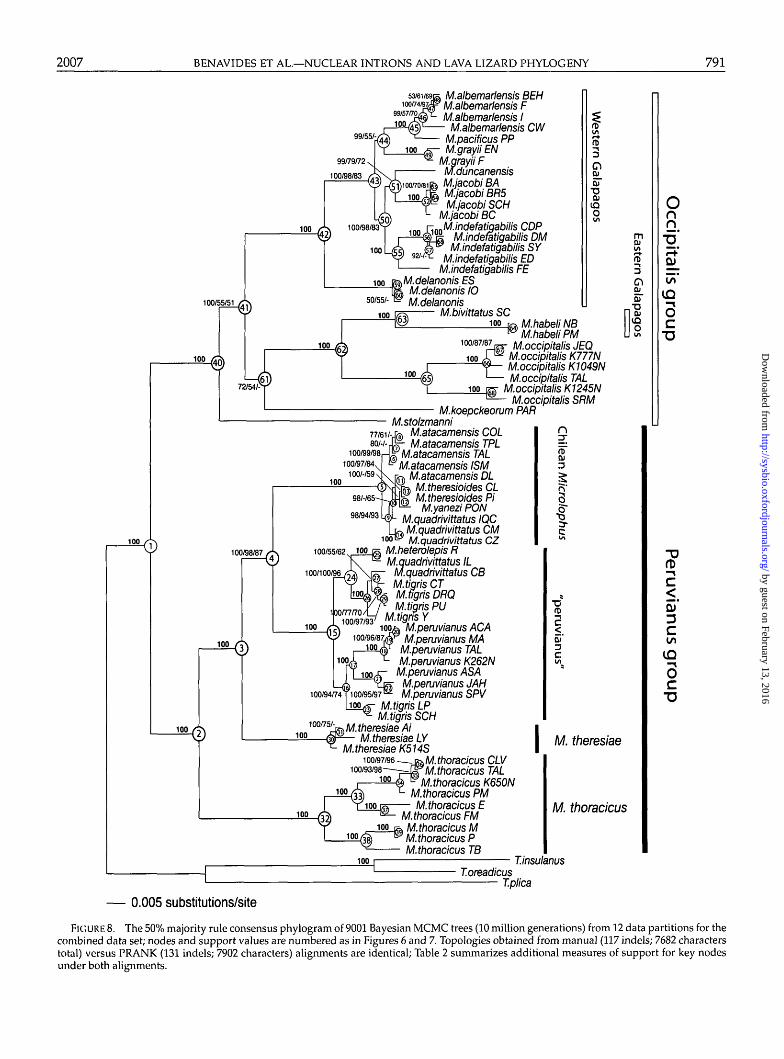
Partitioned Bayesian analysis of the combined mtDNAand nuclear DNA (with coded indels) data sets produceda 50% majority rule consensus tree with an average InL = -42,033.714 and an average of In L = -42,091.843for the manual and PRANK-aligned introns, respectively(Appendix 5). There are no differences in the topologybetween these trees and Figure 8 displays the topologyrecovered with PRANK-aligned introns. For this data set,likelihood values extracted from Bayesian analyseswith 12 and 26 partitions were not significantly dif-ferent (x2 = 48.627; df = 104; P = 1.000), thus wepreferred the partition format that estimated the op-timal topology with fewer parameters. Table 2 sum-marizes different measures of clade support for keynodes shown in Figure 8 (details for all nodes are givenin online Appendix 9; http://www.systematicbiology.org).
The combined data topology recovers the majority ofthe clades previously recovered with either the mtDNAor nuclear data sets (see exceptions below). At the deep-est levels of divergence, these include the Peruvianus andOccipitalis groups (nodes 2 and 40, respectively), eachof which is strongly supported by all support indices(Bayesian, ML, and MP), as well as multiple data parti-tions. Within the Occipitalis group, there is strong supportfor the Western and Eastern Galapagos clades (nodes42 and 62, respectively). Within the Peruvianus group,there is strong support for the placement of M. thoracicus(nodes 2) and M. theresiae (nodes 3) as second and firstoutgroups, respectively, to a strongly supported "peru-vianus" plus "Chilean Microlophus" clade (node 4). Eachof these two latter clades also received strong support(nodes 15 and 5, respectively), and the general patternis strong support of the deepest clades by the nuclearpartitions and shallower clades by the mtDNA (Table 2).
We note some topological discordance between mi-tochondrial and nuclear genes stemming from (1)suboptimal node resolution due to markers resolvingdifferent temporal scales, coupled with probable inflatedPP values at short nodes; and (2) conflict due to signif-icant incongruence between the mitochondrial and nu-clear data sets (Wiens, 1998). An example of suboptimalnode resolution is the ambiguous placement of M. stolz-manni and M. koepckeorum within the Occipitalis group(nodes 41 and 61; Fig. 8); this appears to be due to alimited number of characters and weak conflict amongdata sets, as both species are equivocally placed by eithergenome.
The most obvious example of mtDNA versus nDNAconflict is found at clades nested within the Peru-vianus group; compare the symmetrical mtDNA topol-ogy (nodes 4 and 14 in Fig. 6) with the pectinate nDNAtopology (nodes 5 to 13 in Fig. 7) versus the combineddata that differs slightly from both (nodes 5 and 15 in Fig.8). As an example, terminals in the strongly supportedChilean Microlophus clade in the combined tree (node 5;Fig. 8) are grouped in the mtDNA topology into an ar-
rangement that does not correlate with the geographicdistribution of populations of the putative species M. at-acamensis and M. quadrivittatus. Nodes within this cladeare short (Fig. 8) and weakly supported except for somehigh PP values, suggesting inflated Bayesian support(Lewis et al., 2005). We nevertheless accept this topol-ogy as the best working hypothesis for Microlophus, al-though as a species tree it suggests that both the ChileanMicrolophus and "peruvianus" clades (nodes 5 and 15)need revisionary work.
DISCUSSION
Alignment ofNoncoding Regions: Manual and ProgressiveApproaches
Most of the indels inferred by PRANK and by ourmanual assessments are phylogenetically consistent (i.e.,they recover the same synapomorphies for the samenodes), but PRANK found additional indels that wecould not find by manual adjustments in ambiguousregions (Table 1). In our experience, trying to resolvelength-variable nucleotide regions flanked by conservedblocks is a daunting task that requires sliding and parti-tioning sequence blocks in a highly subjective manner. Inthe Cryba alignment, for example, the CLUSTAL matrix(not shown) was characterized by outgroup aligned se-quences that are more or less in the same positions as ourmanual alignment, and these positions were overaligned(i.e., nonsimilar regions that should not be aligned; seepositions 804 to 828; Appendix 6A). Applying differentgap costs do not solve the issue; gap costs set too highresult in few or no gaps in the matrix (and hence theoveraligned sequences), or if too low the alignment is ex-tensively fragmented into many small gaps with little orno phylogenetic consistency among sequences (i.e., theyrecover the same gaps for terminals that are not related).For the Cryba intron the degree of congruence to the com-bined tree, likelihood scores, and tree lengths based onfour alignment strategies is directly proportional to thenumber of invariant positions (CLUSTAL [418], MUS-CLE [550], manual [583], PRANK [657]) and inverselyproportional to the number of parsimony informativesites. Using congruence to the combined data tree asa proxy of alignment accuracy, the PRANK alignmentsuggests that an increase in the number of invariantbases (i.e., more statements of sequence homology) in-creases the phylogenetic signal in the remaining vari-able characters. This observation corroborates a recentsimulation study (Ogden and Rosenberg, 2006) showingthat sequence homology accuracy correlates positivelywith accuracy of inferred phylogenies across differenttree shapes and phylogenetic methods.
It can be argued that the score functions of theCLUSTAL and MUSCLE algorithms applied to the align-ment of an indel-rich intron are not accurate becausethey do not incorporate, for instance, penalties for over-alignment (Cline et al., 2002; Edgar and Sjolander, 2004;Blackshields et al., 2006). However, PRANK bypassesthis objective function problem by using outgroupsfor "weighing" indels, and the HMM solution and
by guest on February 13, 2016http://sysbio.oxfordjournals.org/
Dow
nloaded from
TABL
E 2.
S
umm
ary
of s
uppo
rt i
ndic
es (
MLB
S [P
HY
ML
], M
PBS
[PA
UP*
], PP
[M
rBay
es])
for
sel
ecte
d no
des
disc
usse
d in
the
text
(hig
hlig
hted
in
Fig.
8);
the
first
and
sec
ond
row
ssh
ow v
alue
s ob
tain
ed f
or m
anua
l an
d PR
AN
K a
lign
ed i
ntro
n re
gion
s, re
spec
tivel
y. F
ifte
en p
arti
tion
s w
ere
cons
ider
ed f
or t
he c
alcu
latio
n of
Bre
mer
sup
port
s, in
clud
ing:
five
mtD
NA
gene
s (2
991
bp),
nin
e nu
clea
r re
gion
s (4
691
and
4755
bp
by m
anua
l and
PR
AN
K a
lign
men
ts),
and
one
inde
l par
titi
on (
« =
117
and
131
cha
ract
ers
[man
ual a
nd P
RA
NK
alig
nmen
ts])
.T
he f
ull
reco
rd f
or a
ll no
des
can
be v
iew
ed i
n A
ppen
dix
9.
No
.
2 3 4 5 15 30 32 40 41 42 59 61 62
Nod
e de
scri
ptio
n
Per
uvia
nus
grou
p
Nod
e 4
+ n
ode
30
Nod
e 5
+ n
ode
15
Chi
lean
Mic
rolo
phus
"Per
uvia
nus"
M.
ther
esia
e
M.
thor
acic
us
Occ
ipit
alis
g
rou
p
Occ
ipit
alis
g
rou
p—
M.
stol
zman
ni
Wes
tern
Gal
apag
os R
adia
tion
M.
dela
noni
s
M.
koep
ckeo
rum
+
no
de
62
E.
Gal
apag
os
+ M
. oc
cipi
tali
s
MLB
S
100
100
98 100
100
100
100
100
55 100
100
54 100
MPB
S
100
100
87 100
100
100
100
100
51 100
100
100
100
PP
1.0
1.0
1.0
1.0
1.0
1.0
1.0
1.0
1.0
1.0
1.0
1.0
1.0
1.0
1.0
1.0
1.0
1.0
1.0
1.0
1.0
1.0
.87
.72
1.0
1.0
12S 0 0 5 3
-3 -5 25 32 16 21 8 11 16 21 3 6 0-3
7 13 10 12 -2 -4 -1 -2
16S 1 1 0
-1 -1 -1 10 14 7 10 4 6 5 8-1
0-1 -1 -3 -6
8 10 0-1
2 5
ND
4 1 1-2 -4
3 3 29 34 16 21 19 25 13 17 1 1-1 -3
7 12 5 7 3 3 3 7
tRN
A
-1 -2 -1 -1 -3 -3 4 6
-00 1 1 1 1 1 1 1 2 2 2 4 6 0 0 2 3
Cyt
b
-1 -25 7
-1 0 29 38 12 17 23 32 11 17 -1 -53 9 7 13 15 23 3 8 4 7
CK 5 6 1 2 4 6 1 1
-2 -3 2 3 4 6 3 6 0 0 2 7 2 2 0 0 2 4
Part
ition
ed B
rem
er s
uppo
rt
Cry
ba 1 4 12 12 2 3 3 2-3 -5
5 5 5 10 0 0-1 -2
3 6 3 4-1 -1
0 0
RP4
0 1 1 2 2 1 1 1 1-1 -1
3 4 11 15 3 5 2 3 3 3 0-1
1 0 5 10
Eno
l
1 2 4 4 0 0 0 0 0-1
2 3 1 2 2 5 0 0 1 3 1 2 0 0 0 1
Gap
dh 2 1 3 4 0 1 0 1-2 -2
0 1 5 8 2 6 0 1 1 3 1 1 0 0 0 0
Ano
n
4 6 2 3 3 4 0 0-1 -1
2 4 5 8 1 5-2 -3
2 5 0 0-1 -1 -1
0
Atr
p 1 2 1 3 1 1 0 0 0 0 0 0 5 7-1 -1 -1 -1
0 1 1 1-1
0 1 3
Cm
os 4 5 1 1 2 3 0 0-1 -1
3 4 4 6 1 3 0 1 3 6 0 0 0 0 1 2
Rag
-1 3 4 1 1 2 2 1 0 0 0 2 2 4 6 2 5 2 3 2 3 1 1 1 1 3 5
Inde
ls
-12 1 1 1 2 1 1
-1 -14 7 2 4 1 3
-1 -21 3 2 2
-1 -21 5
by guest on February 13, 2016http://sysbio.oxfordjournals.org/
Dow
nloaded from
2007 BENAVIDES ET AL.—NUCLEAR INTRONS AND LAVA LIZARD PHYLOGENY 791
M.tigris LPM.tigris SCH
M.theresiae AiM.theresiae LY
M.theresiae K514S
M.albemarlensis BEHM.albemarlensis FM.albemarlensis I
M.albemarlensis CWM.pacificus PPM.grayii EN
M.grayii FM.duncanensisM.jacobi BAM.jacobi BR5M.jacobi SCH
M.jacobi BCM.indefatiqabilis CDP
M.inderatigabilis DMM.indefatigabilis SY
M.indefatigabilis EDM.indefatigabilis FE
M.delanonis ESM.delanonis 10M.delanonis
M.bivittatus SC
100/87/87,
M.koepckeorum PARM.stolzmanni
77/61/-J® M.atacamensis COL""' ' - M.atacamensis TPL
M.atacamensis TALM.atacamensis ISM
M.atacamensis DLM.theresioides CLM.theresiqides PiM.yanezi PON
M.quadrivjttatus IQCM.quadriyittatus CMM.quadrivittatus CZ
M.heterolepis RM.quadrivittatus IL
M.quadrivittatus CBM.tigris CTM.tigris DRQM.tigris PU
M.tigris YM.peruvianus ACAM.peruyianus MA
M.peruvianus TALM.peruvianus K262NM.peruvianus ASA
M.peruvianus JAHM.peruvianus SPV
M.thoracicus CLVM.thoracicus TAL
M.thoracicus K650NM.thoracicus PMM.thoracicus E
M.thoracicus FMM.thoracicus MM.thoracicus PM.thoracicus TB
la M.habeli NBm M.habeliPMM.occipitalis JEQ
M.occipitalis K777NM.occipitalis K1049NM.occipitalis TAL
M.occipitalis K1245NM.occipitalis SRM
n
§I"3-C
M. theresiae
M. thoracicus
Onn
J7T
Oc
53'DCto
IDOC
T.insulanusT.oreadicus
T.plica
— 0.005 substitutions/site
FIGURE 8. The 50% majority rule consensus phylogram of 9001 Bayesian MCMC trees (10 million generations) from 12 data partitions for thecombined data set; nodes and support values are numbered as in Figures 6 and 7. Topologies obtained from manual (117 indels; 7682 characterstotal) versus PRANK (131 indels; 7902 characters) alignments are identical; Table 2 summarizes additional measures of support for key nodesunder both alignments.
by guest on February 13, 2016http://sysbio.oxfordjournals.org/
Dow
nloaded from
792 SYSTEMATIC BIOLOGY VOL. 56
evolutionary models result in "staggered alignments"(Higgins et alv 2005; Morrison, 2006) that recovered ahigher number of indels in all seven introns.
A practical difference among alignments refers to sen-sitivity (ability to detect all residues that should bealigned), selectivity (ability to align only those residuesthat should be aligned; Lambert et al., 2003; Morrison,2006), and the solution found by Loytynoja and Goldman(2005) implements this distinction successfully. Still, insome situations, manual alignment may be more sen-sitive and selective than PRANK. For example, in thealignment of simple sequence repeats (SSR) of positions70 to 110 (Appendices 6A and 6B), the manual approachprovides a more parsimonious solution of two versusfour evolutionary (indel) events.
As larger and more heterogeneous data sets becomeroutine in phylogenetic analyses, intron-rich data setswill become common because noncoding sequencescomprise the vast majority of metazoan genomes, par-ticularly in vertebrates (Roy and Gilbert, 2006). Accord-ingly, both theoretical and empirical studies focusing onalignment issues for these types of markers are critical(Metzler, 2003; Miklos et al., 2004; Keightley and John-son 2004; Holmes, 2005; Creer et al., 2006; Siddharthan,2006), but in contrast to protein and ribosomal gene re-gions, there are no sources of independent evidence (i.e.,secondary structure or codon conservation) to corrob-orate the correct alignment of noncoding DNA (Pollardet al., 2004). Furthermore, heuristic algorithms are under-mined by high-frequency length mutations and repeatmotifs of variable complexity, and the sheer number ofpossible mutation patterns of noncoding DNA defiesstandard procedures identified for other gene classes.
In practice, common heuristic methods search for un-ambiguously aligned regions first; they build an approx-imate guide tree and from this assemble an alignmentthat in the case of introns should optimize gap place-ment. Gaps are opened under the constraint of penaltiesthat define the extension and cost of each according to anobjective function that balances gaps and matches. Inter-estingly, most programs that rely on a guide tree regardinsertions introduced early in the matching of two sim-ilar sequences as a nuisance because, unlike deletions,they are not penalized only at the place where they oc-cur but rather have to be penalized repeatedly as thealgorithm progresses down to the root of the tree (Loyti-noja and Goldman, 2005). Heuristic algorithms (i.e., im-plemented in the CLUSTAL, MUSCLE, and T-COFFEprograms, among others) do find approximate solutionsto the alignment of both point and length mutations, butwith the caveat that insertion placements may be subop-timal as long as heuristic programs consider insertionsequivalent to deletions.
The complexity of inferring indels is also increased be-cause progressive methods that rely on the constructionof an initial guide tree assume that the best informationon gap placement will be found among the most sim-ilar sequences, when in reality there may be better in-formation in the alignment of all sequences consideredin the group of interest. No computer approach is fully
capable of correcting a particular alignment based on aglobal solution, but the first step in this direction shouldbe a program that handles insertions and deletions dif-ferently, and this is the advantage of the PRANK hiddenMarkov model (HMM) implementation. The method de-veloped by Loytynoja and Goldman (2005) distinguishesinsertions and deletions as separate events (via out-group rooting) and then corrects early mistakes in theplacement of gaps (indels) in a progressive alignmentcontext. A key innovation of this development is thatPRANK does not simply maximize a similarity functionscore to assess the accuracy of its alignment; rather it im-plements a phylogenetic scoring function that is basedon simple evolutionary models (Loytynoja and Gold-man, 2005). Normally, score or objective functions (e.g.,sum-of-pairs or column scores) are calculated by maxi-mizing the sum of similarities for pairs of sequences anda reference alignment (Blackshields et al., 2006; Edgarand Batzoglou, 2006), and their utilization represents thecore of the disagreement between biological correctnessand algorithm optimization (Lassmann and Sonnham-mer, 2005; Konagurthu and Stuckey, 2006). The use of dif-ferent objective functions is pivotal to understand whydifferent algorithms can produce different alignments(Edgar and Sjolander, 2003; Morrison, 2006; Ogden andRosenberg, 2006). The PRANK scoring function uses dy-namic programming to move among storage matricesand select the optimal subalignment based on substi-tution models, thereby avoiding entrapment on a localalignment optimum.
Aligning Length-Variable Introns and Guide Trees
A key component of tree-based progressive align-ments is the order in which pairwise alignmentsare made (Thompson et al., 1994). The modificationof the hierarchy of these successive alignments to-wards the root of the tree has a large effect in theoverall alignment (Redelings and Suchard, 2005). Thedegree to which guide trees affect downstream phylo-genetic analysis in a multigene approach has not beenstudied and deserves increased attention (Kumar andFilipski, 2007). We are also unaware of studies on theeffect of length polymorphisms on the construction ofguide trees, and a recent genomic approach showingdifferent starting trees produced distinct but equallywell supported topologies (Kumar and Filipski, 2007). Inour data set, Cryba shows "orphan" sequences and ex-tensive length polymorphisms that produce "incorrect"phylogenies with CLUSTAL or MUSCLE alignments(Fig. 5a, b).
Another issue is that coding and noncoding DNAmay be found as a mosaic of homologous and nonho-mologous regions for which differentiation in an align-ment context will be particularly difficult for noncodingDNA without independent evidence to corroborate pri-mary homology (Morrison, 2006). Recombination andlateral transfer are frequently mentioned for tree dis-crepancies in genomic studies (Raymond et al., 2002),implying that the hierarchy of the "Tree of Life" might
by guest on February 13, 2016http://sysbio.oxfordjournals.org/
Dow
nloaded from
2007 BENAVIDES ET AL.—NUCLEAR INTRONS AND LAVA LIZARD PHYLOGENY 793
be harder to obtain (Doolittle, 1999; Lebrun et al., 2006).Very few alignment programs model recombination andthey do so in a protein alignment context (Lee et al., 2002;Blanchette et al., 2004). We suggest that some of these con-cerns may be obviated by building a guide tree based onunambiguously aligned fragments. Its application maybe contested on grounds of circularity (see de Queiroz,1995, for contextual details), but it also represents a com-promise option for progressive alignments that requireguide trees.
Phylogenetic Information Content oflntron LengthSubstitutions
Several important observations emerged from the in-clusion of the length mutations from the seven nuclearintrons considered in this study. First, inclusion of man-ual and PRANK-aligned gap-coded partitions had noeffect on the final topology; these are identical for thenuclear data set with and without gap partitions (Fig. 7).The inclusion of gap partitions resulted in lowered like-lihood scores and the associated need for more intensesearches because a new partition was added, but in theabsence of topological differences, the likelihood scoreof the nuclear tree inferred using PRANK-aligned se-quences is higher than the manually aligned tree (Ap-pendix 8). Gap-coded partitions contributed positivesupport in 21 nodes in the combined data set, no sup-port in 44 nodes, and showed conflict in 6 nodes (Ap-pendix 9). Comparing manual and PRANK-aligned par-titions, these ratios (positive/zero/negative support) are21/44/6 and 21/40/10, respectively. These contributionswere independent of the differences in the number ofparsimony informative sites in both data sets. The totalnumber of parsimony informative characters gained af-ter coding the indel characters from manual and PRANKalignments is 82 and 94, respectively, suggesting that theoverall contribution of the gap partitions in the context ofthe remaining nuclear and the mitochondrial data is sur-prisingly important (Table 2). With eventual modelingof these kinds of mutations (which has begun; Holmes,2005), coded indel partitions should also improve esti-mates of branch lengths as noncoding sequences becomemore common in phylogenetic studies.
Phylogenetic and Evolutionary Implications
Within the genus Microlophus both the Occipitalis(Dixon and Wright, 1975; Frost, 1992) and Peruvianusgroups (Van Denburgh and Slevin, 1913; Frost, 1992;Heise, 1998) are only moderately supported by morpho-logical data, and previous molecular studies have not in-cluded all species, thereby precluding rigorous indepen-dent tests of the monophyly of each clade. In this study,nuclear and the combined data sets always recover theOccipitalis and Peruvianus groups with strong statisticalsupport, and this support is consistently spread acrossmany data partitions. The mtDNA partition corrobo-rated the nDNA data in strong support of the Occipitalisgroup, but it failed to recover the Peruvianus group; oneexplanation for this result is that the mtDNA data set
may show base compositional bias, so some terminalswould be attracted to branches sharing similar base fre-quencies rather than ancestry (Wiens and Hollingsworth,2000). We reevaluated the mtDNA locus using a log-determinant method to accommodate this bias (Jordanand Hewitt, 2004) and recovered a well-supported mono-phyletic Peruvianus group that places M. thoracicus asthe sister species to all others in the group (tree notshown). This result suggests that compositional bias par-tially accounts for failure of the mtDNA locus to cor-roborate the nuclear genes in support of the Peruvianusgroup.
Elsewhere, the resolution of relationships within Peru-vianus and Occipitalis groups depends on the combinedeffect of all markers. Resolution of relationships amongthe 12 species recognized within the Occipitalis groupcorroborates earlier studies supporting two coloniza-tions of the Galapagos (Lopez et al., 1992; Wright, 1983;Heise, 1998; Kizirian et al., 2004). Specifically, there isstrong support for a small Eastern Galapagos Radiationconsisting of the sister species M. bivittatus and M. habeliendemic to the islands of San Cristobal and Marchena,respectively, and sharing a sister clade relationship tothe mainland M. occipitalis. Our results also confirmmonophyly of the "Western Galapagos Radiation" thatincludes the remaining seven species, and the absenceof a close relationship of this radiation to any individualmainland species. The mtDNA data set shows conflictbetween genes for all nodes that resolve interspecific (in-terisland) relationships of the Western Radiation, and thesource of this conflict must reside in homoplasy, insuffi-cient sampling, or other confounding factors that are notfully accommodated by our methods. We accept the com-bined data topology (node 42; Fig. 8) as the best availableworking hypothesis for colonization of the GalapagosArchipelago and are conducting studies to test alterna-tive interisland colonization hypotheses for the WesternRadiation.
Nuclear-Cytoplasmic Conflict: Secondary Contact andHybridization?
The combined tree resolves many nodes within thePeruvianus group with strong support, and the nDNArecover a pectinate topology for many terminals in theChilean clade (see node 5; Fig. 7), albeit some sup-ported only by high PP values. The mtDNA gene treeis symmetrical for these taxa, and although not allnodes are in strong conflict by the criterion of Wiens(1998), the nuclear tree is qualitatively improved in thesense that its topology better agrees with both currentlyrecognized species for the Peruvianus group and theirdistributions (neither of which holds for the mtDNAtree). The nuclear gene tree match to species bound-aries is not exact, and several processes likely havecontributed to the discordance. In Figure 9 we havejuxtaposed the relevant clades from the mtDNA andnDNA trees and mapped the distributions of relevantterminals on this section of the coastal desert of westernSouth America.
by guest on February 13, 2016http://sysbio.oxfordjournals.org/
Dow
nloaded from
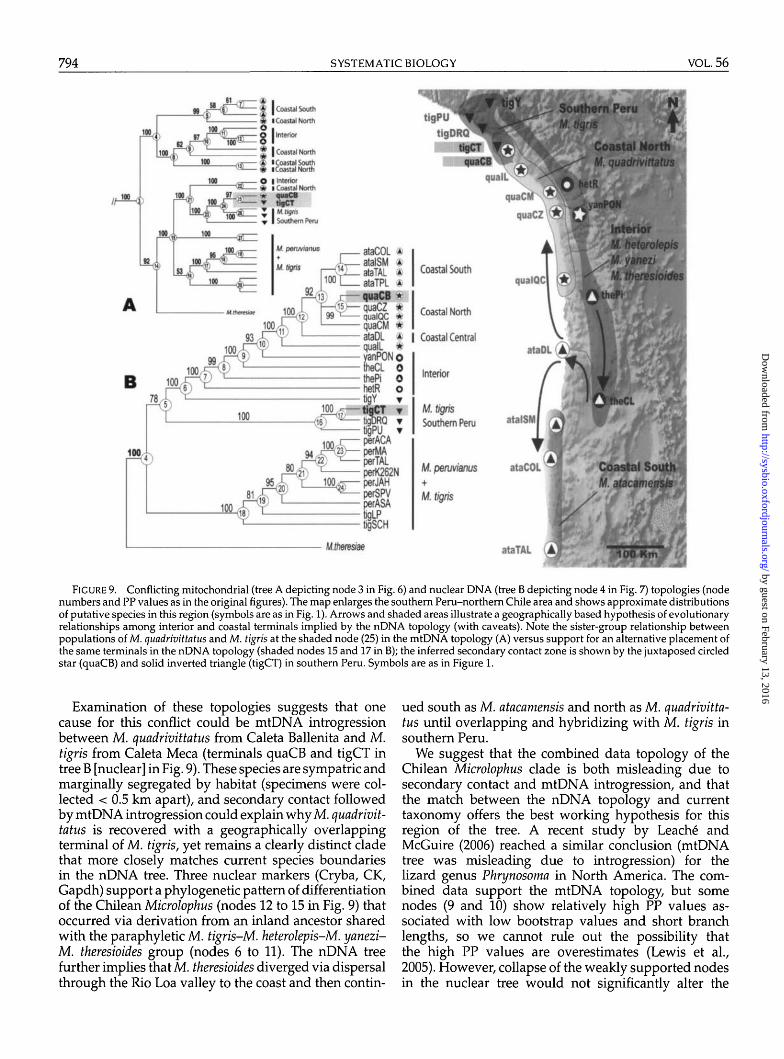
794 SYSTEMATIC BIOLOGY VOL. 56
| Coastal South
I Coastal North
® .« i Coastal North97 ^ <j? quaCB
• tigCT^ I M. tigris
• I
ataCOL ®ataISM ®ataTAL ®ataTPL ®
quaCB ®quaCZ ®qualQC ®quaCM ®ataDL ®qualL %yanPON otheCL 0thePi 0hetR otigY TtigCT TtigDRQ •tigPU •perACAperMAperTALperK262NperJAHperSPVperASAtigLPtigSCH
M.theresiae
Coastal South
Coastal North
I Coastal Central
Interior
M. tigris
Southern Peru
M. pervvianus
+
M. tigris
ataCOL
ataTAL
FIGURE 9. Conflicting mitochondrial (tree A depicting node 3 in Fig. 6) and nuclear DNA (tree B depicting node 4 in Fig. 7) topologies (nodenumbers and PP values as in the original figures). The map enlarges the southern Peru-northern Chile area and shows approximate distributionsof putative species in this region (symbols are as in Fig. 1). Arrows and shaded areas illustrate a geographically based hypothesis of evolutionaryrelationships among interior and coastal terminals implied by the nDNA topology (with caveats). Note the sister-group relationship betweenpopulations of M. quadrivittcitus and M. tigris at the shaded node (25) in the mtDNA topology (A) versus support for an alternative placement ofthe same terminals in the nDNA topology (shaded nodes 15 and 17 in B); the inferred secondary contact zone is shown by the juxtaposed circledstar (quaCB) and solid inverted triangle (tigCT) in southern Peru. Symbols are as in Figure 1.
Examination of these topologies suggests that onecause for this conflict could be mtDNA introgressionbetween M. quadrivittatus from Caleta Ballenita and M.tigris from Caleta Meca (terminals quaCB and tigCT intree B [nuclear] in Fig. 9). These species are sympatric andmarginally segregated by habitat (specimens were col-lected < 0.5 km apart), and secondary contact followedby mtDNA introgression could explain why M. quadrivit-tatus is recovered with a geographically overlappingterminal of M. tigris, yet remains a clearly distinct cladethat more closely matches current species boundariesin the nDNA tree. Three nuclear markers (Cryba, CK,Gapdh) support a phylogenetic pattern of differentiationof the Chilean Microlophus (nodes 12 to 15 in Fig. 9) thatoccurred via derivation from an inland ancestor sharedwith the paraphyletic M. tigris-M. heterolepis-M. yanezi-M. theresioides group (nodes 6 to 11). The nDNA treefurther implies that M. theresioides diverged via dispersalthrough the Rio Loa valley to the coast and then contin-
ued south as M. atacamensis and north as M. quadrivitta-tus until overlapping and hybridizing with M. tigris insouthern Peru.
We suggest that the combined data topology of theChilean Microlophus clade is both misleading due tosecondary contact and mtDNA introgression, and thatthe match between the nDNA topology and currenttaxonomy offers the best working hypothesis for thisregion of the tree. A recent study by Leach6 andMcGuire (2006) reached a similar conclusion (mtDNAtree was misleading due to introgression) for thelizard genus Phrynosoma in North America. The com-bined data support the mtDNA topology, but somenodes (9 and 10) show relatively high PP values as-sociated with low bootstrap values and short branchlengths, so we cannot rule out the possibility thatthe high PP values are overestimates (Lewis et al,2005). However, collapse of the weakly supported nodesin the nuclear tree would not significantly alter the
by guest on February 13, 2016http://sysbio.oxfordjournals.org/
Dow
nloaded from
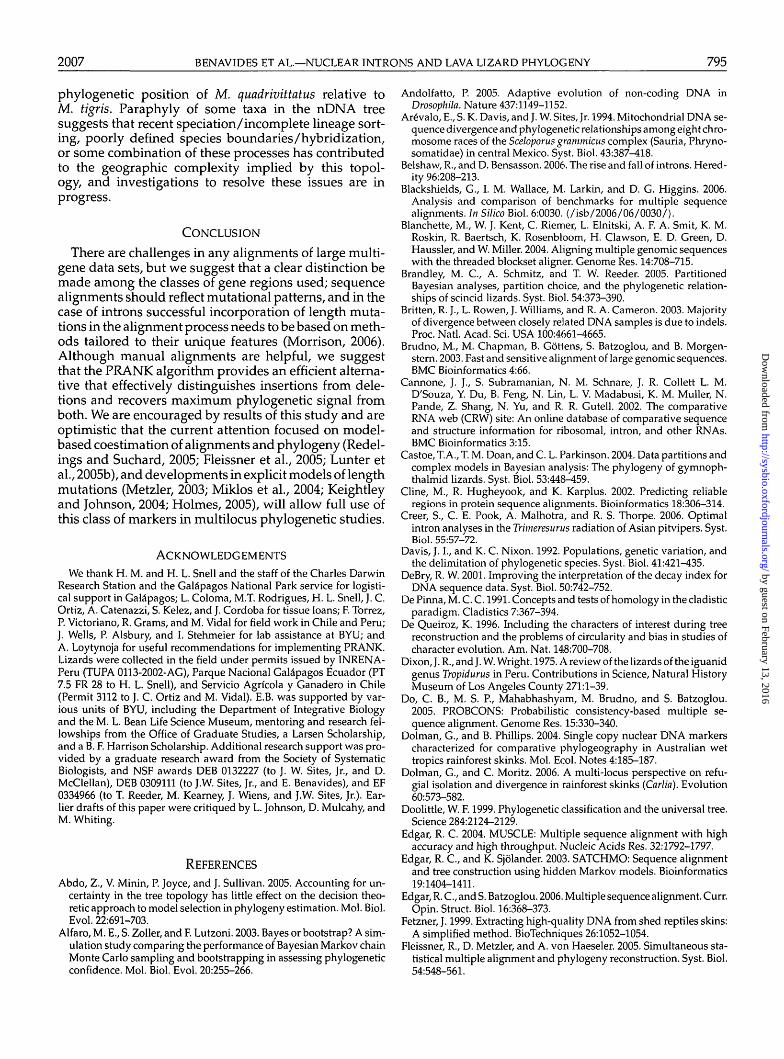
2007 BENAVIDES ET AL.—NUCLEAR INTRONS AND LAVA LIZARD PHYLOGENY 795
phylogenetic position of M. quadrivittatus relative toM. tigris. Paraphyly of some taxa in the nDNA treesuggests that recent speciation/incomplete lineage sort-ing, poorly defined species boundaries/hybridization,or some combination of these processes has contributedto the geographic complexity implied by this topol-ogy, and investigations to resolve these issues are inprogress.
CONCLUSION
There are challenges in any alignments of large multi-gene data sets, but we suggest that a clear distinction bemade among the classes of gene regions used; sequencealignments should reflect mutational patterns, and in thecase of introns successful incorporation of length muta-tions in the alignment process needs to be based on meth-ods tailored to their unique features (Morrison, 2006).Although manual alignments are helpful, we suggestthat the PRANK algorithm provides an efficient alterna-tive that effectively distinguishes insertions from dele-tions and recovers maximum phylogenetic signal fromboth. We are encouraged by results of this study and areoptimistic that the current attention focused on model-based coestimation of alignments and phylogeny (Redel-ings and Suchard, 2005; Fleissner et al., 2005; Lunter etal., 2005b), and developments in explicit models of lengthmutations (Metzler, 2003; Miklos et al., 2004; Keightleyand Johnson, 2004; Holmes, 2005), will allow full use ofthis class of markers in multilocus phylogenetic studies.
ACKNOWLEDGEMENTS
We thank H. M. and H. L. Snell and the staff of the Charles DarwinResearch Station and the Galapagos National Park service for logisti-cal support in Galapagos; L. Coloma, M.T. Rodrigues, H. L. Snell, J. C.Ortiz, A. Catenazzi, S. Kelez, and J. Cordoba for tissue loans; F. Torrez,P. Victoriano, R. Grams, and M. Vidal for field work in Chile and Peru;J. Wells, P. Alsbury, and I. Stehmeier for lab assistance at BYU; andA. Loytynoja for useful recommendations for implementing PRANK.Lizards were collected in the field under permits issued by INRENA-Peru (TUPA 0113-2002-AG), Parque Nacional Galapagos Ecuador (PT7.5 FR 28 to H. L. Snell), and Servicio Agricola y Ganadero in Chile(Permit 3112 to J. C. Ortiz and M. Vidal). E.B. was supported by var-ious units of BYU, including the Department of Integrative Biologyand the M. L. Bean Life Science Museum, mentoring and research fel-lowships from the Office of Graduate Studies, a Larsen Scholarship,and a B. F. Harrison Scholarship. Additional research support was pro-vided by a graduate research award from the Society of SystematicBiologists, and NSF awards DEB 0132227 (to J. W. Sites, Jr., and D.McClellan), DEB 0309111 (to J.W. Sites, Jr., and E. Benavides), and EF0334966 (to T. Reeder, M. Kearney, J. Wiens, and J.W. Sites, Jr.). Ear-lier drafts of this paper were critiqued by L. Johnson, D. Mulcahy, andM. Whiting.
REFERENCES
Abdo, Z., V. Minin, P. Joyce, and J. Sullivan. 2005. Accounting for un-certainty in the tree topology has little effect on the decision theo-retic approach to model selection in phylogeny estimation. Mol. Biol.Evol. 22:691-703.
Alfaro, M. E., S. Zoller, and F. Lutzoni. 2003. Bayes or bootstrap? A sim-ulation study comparing the performance of Bayesian Markov chainMonte Carlo sampling and bootstrapping in assessing phylogeneticconfidence. Mol. Biol. Evol. 20:255-266.
Andolfatto, P. 2005. Adaptive evolution of non-coding DNA inDrosophila. Nature 437:1149-1152.
Ar£valo, E., S. K. Davis, and J. W. Sites, Jr. 1994. Mitochondrial DNA se-quence divergence and phylogenetic relationships among eight chro-mosome races of the Sceloporus gmmmicus complex (Sauria, Phryno-somatidae) in central Mexico. Syst. Biol. 43:387-418.
Belshaw, R., and D. Bensasson. 2006. The rise and fall of introns. Hered-ity 96:208-213.
Blackshields, G., I. M. Wallace, M. Larkin, and D. G. Higgins. 2006.Analysis and comparison of benchmarks for multiple sequencealignments. In Silico Biol. 6:0030. (/isb/2006/06/0030/).
Blanchette, M., W. J. Kent, C. Riemer, L. Elnitski, A. F. A. Smit, K. M.Roskin, R. Baertsch, K. Rosenbloom, H. Clawson, E. D. Green, D.Haussler, and W. Miller. 2004. Aligning multiple genomic sequenceswith the threaded blockset aligner. Genome Res. 14:708-715.
Brandley, M. C, A. Schmitz, and T. W. Reeder. 2005. PartitionedBayesian analyses, partition choice, and the phylogenetic relation-ships of scincid lizards. Syst. Biol. 54:373-390.
Britten, R. J., L. Rowen, J. Williams, and R. A. Cameron. 2003. Majorityof divergence between closely related DNA samples is due to indels.Proc. Natl. Acad. Sci. USA 100:4661-4665.
Brudno, M., M. Chapman, B. Gottens, S. Batzoglou, and B. Morgen-stern. 2003. Fast and sensitive alignment of large genomic sequences.BMC Bioinformatics 4:66.
Cannone, J. J., S. Subramanian, N. M. Schnare, J. R. Collett L. M.D'Souza, Y. Du, B. Feng, N. Lin, L. V. Madabusi, K. M. Muller, N.Pande, Z. Shang, N. Yu, and R. R. Gutell. 2002. The comparativeRNA web (CRW) site: An online database of comparative sequenceand structure information for ribosomal, intron, and other RNAs.BMC Bioinformatics 3:15.
Castoe, T.A., T. M. Doan, and C. L. Parkinson. 2004. Data partitions andcomplex models in Bayesian analysis: The phylogeny of gymnoph-thalmid lizards. Syst. Biol. 53:448-459.
Cline, M., R. Hugheyook, and K. Karplus. 2002. Predicting reliableregions in protein sequence alignments. Bioinformatics 18:306-314.
Creer, S., C. E. Pook, A. Malhotra, and R. S. Thorpe. 2006. Optimalintron analyses in the Trimeresunts radiation of Asian pitvipers. Syst.Biol. 55:57-72.
Davis, J. I., and K. C. Nixon. 1992. Populations, genetic variation, andthe delimitation of phylogenetic species. Syst. Biol. 41:421-435.
DeBry, R. W. 2001. Improving the interpretation of the decay index forDNA sequence data. Syst. Biol. 50:742-752.
De Pinna, M. C. C. 1991. Concepts and tests of homology in the cladisticparadigm. Cladistics 7:367-394.
De Queiroz, K. 1996. Including the characters of interest during treereconstruction and the problems of circularity and bias in studies ofcharacter evolution. Am. Nat. 148:700-708.
Dixon, J. R., and J. W. Wright. 1975. A review of the lizards of the iguanidgenus Tropidurus in Peru. Contributions in Science, Natural HistoryMuseum of Los Angeles County 271:1-39.
Do, C. B., M. S. P., Mahabhashyam, M. Brudno, and S. Batzoglou.2005. PROBCONS: Probabilistic consistency-based multiple se-quence alignment. Genome Res. 15:330-340.
Dolman, G., and B. Phillips. 2004. Single copy nuclear DNA markerscharacterized for comparative phylogeography in Australian wettropics rainforest skinks. Mol. Ecol. Notes 4:185-187.
Dolman, G., and C. Moritz. 2006. A multi-locus perspective on refu-gial isolation and divergence in rainforest skinks (Carlia). Evolution60:573-582.
Doolittle, W. F. 1999. Phylogenetic classification and the universal tree.Science 284:2124-2129.
Edgar, R. C. 2004. MUSCLE: Multiple sequence alignment with highaccuracy and high throughput. Nucleic Acids Res. 32:1792-1797.
Edgar, R. C, and K. Sjolander. 2003. SATCHMO: Sequence alignmentand tree construction using hidden Markov models. Bioinformatics19:1404-1411.
Edgar, R. C, and S. Batzoglou. 2006. Multiple sequence alignment. Curr.Opin. Struct. Biol. 16:368-373.
Fetzner, J. 1999. Extracting high-quality DNA from shed reptiles skins:A simplified method. BioTechniques 26:1052-1054.
Fleissner, R., D. Metzler, and A. von Haeseler. 2005. Simultaneous sta-tistical multiple alignment and phylogeny reconstruction. Syst. Biol.54:548-561.
by guest on February 13, 2016http://sysbio.oxfordjournals.org/
Dow
nloaded from
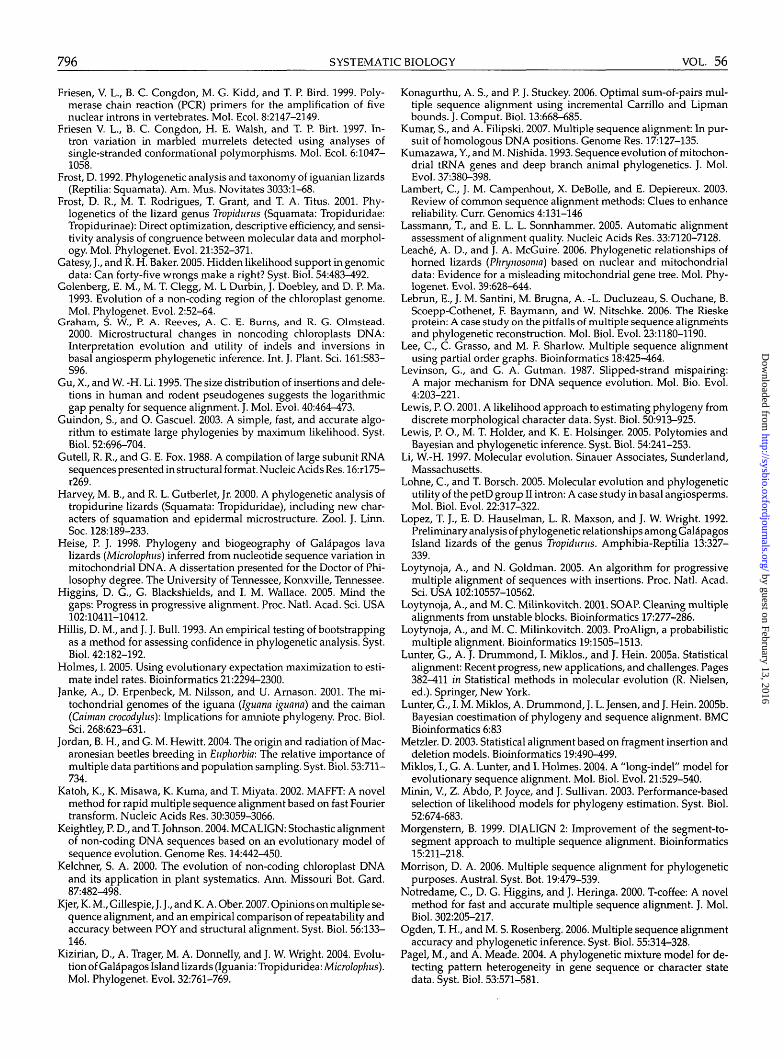
796 SYSTEMATIC BIOLOGY VOL. 56
Friesen, V. L., B. C. Congdon, M. G. Kidd, and T. P. Bird. 1999. Poly-merase chain reaction (PCR) primers for the amplification of fivenuclear introns in vertebrates. Mol. Ecol. 8:2147-2149.
Friesen V. L., B. C. Congdon, H. E. Walsh, and T. P. Birt. 1997. In-tron variation in marbled murrelets detected using analyses ofsingle-stranded conformational polymorphisms. Mol. Ecol. 6:1047-1058.
Frost, D. 1992. Phylogenetic analysis and taxonomy of iguanian lizards(Reptilia: Squamata). Am. Mus. Novitates 3033:1-68.
Frost, D. R., M. T. Rodrigues, T. Grant, and T. A. Titus. 2001. Phy-logenetics of the lizard genus Tropidnrus (Squamata: Tropiduridae:Tropidurinae): Direct optimization, descriptive efficiency, and sensi-tivity analysis of congruence between molecular data and morphol-ogy. Mol. Phylogenet. Evol. 21:352-371.
Gatesy, J., and R. H. Baker. 2005. Hidden likelihood support in genomicdata: Can forty-five wrongs make a right? Syst. Biol. 54:483^192.
Golenberg, E. M., M. T. Clegg, M. L Durbin, J. Doebley, and D. P. Ma.1993. Evolution of a non-coding region of the chloroplast genome.Mol. Phylogenet. Evol. 2:52-64.
Graham, S. W., P. A. Reeves, A. C. E. Burns, and R. G. Olmstead.2000. Microstructural changes in noncoding chloroplasts DNA:Interpretation evolution and utility of indels and inversions inbasal angiosperm phylogenetic inference. Int. }. Plant. Sci. 161:S83-S96.
Gu, X., and W. -H. Li. 1995. The size distribution of insertions and dele-tions in human and rodent pseudogenes suggests the logarithmicgap penalty for sequence alignment. J. Mol. Evol. 40:464-473.
Guindon, S., and O. Gascuel. 2003. A simple, fast, and accurate algo-rithm to estimate large phylogenies by maximum likelihood. Syst.Biol. 52:696-704.
Gutell, R. R., and G. E. Fox. 1988. A compilation of large subunit RNAsequences presented in structural format. Nucleic Acids Res. 16:rl75-r269.
Harvey, M. B., and R. L. Gutberlet, Jr. 2000. A phylogenetic analysis oftropidurine lizards (Squamata: Tropiduridae), including new char-acters of squamation and epidermal microstructure. Zool. J. Linn.Soc. 128:189-233.
Heise, P. J. 1998. Phylogeny and biogeography of Galapagos lavalizards (Microlophus) inferred from nucleotide sequence variation inmitochondrial DNA. A dissertation presented for the Doctor of Phi-losophy degree. The University of Tennessee, Konxville, Tennessee.
Higgins, D. G., G. Blackshields, and I. M. Wallace. 2005. Mind thegaps: Progress in progressive alignment. Proc. Natl. Acad. Sci. USA102:10411-10412.
Hillis, D. M., and J. J. Bull. 1993. An empirical testing of bootstrappingas a method for assessing confidence in phylogenetic analysis. Syst.Biol. 42:182-192.
Holmes, I. 2005. Using evolutionary expectation maximization to esti-mate indel rates. Bioinformatics 21:2294-2300.
Janke, A., D. Erpenbeck, M. Nilsson, and U. Arnason. 2001. The mi-tochondrial genomes of the iguana (Iguana iguana) and the caiman(Caiman crocodylus): Implications for amniote phylogeny. Proc. Biol.Sci. 268:623-631.
Jordan, B. H., and G. M. Hewitt. 2004. The origin and radiation of Mac-aronesian beetles breeding in Euphorbia: The relative importance ofmultiple data partitions and population sampling. Syst. Biol. 53:711-734.
Katoh, K., K. Misawa, K. Kuma, and T. Miyata. 2002. MAFFT: A novelmethod for rapid multiple sequence alignment based on fast Fouriertransform. Nucleic Acids Res. 30:3059-3066.
Keightley, P. D., and T. Johnson. 2004. MCALIGN: Stochastic alignmentof non-coding DNA sequences based on an evolutionary model ofsequence evolution. Genome Res. 14:442-450.
Kelchner, S. A. 2000. The evolution of non-coding chloroplast DNAand its application in plant systematics. Ann. Missouri Bot. Gard.87:482^98.
Kjer, K. M., Gillespie, J. J., and K. A. Ober. 2007. Opinions on multiple se-quence alignment, and an empirical comparison of repeatability andaccuracy between POY and structural alignment. Syst. Biol. 56:133-146.
Kizirian, D., A. Trager, M. A. Donnelly, and J. W. Wright. 2004. Evolu-tion of Galapagos Island lizards (Iguania: Tropiduridea: Microlophus).Mol. Phylogenet. Evol. 32:761-769.
Konagurthu, A. S., and P. J. Stuckey. 2006. Optimal sum-of-pairs mul-tiple sequence alignment using incremental Carrillo and Lipmanbounds. J. Comput. Biol. 13:668-685.
Kumar, S., and A. Filipski. 2007. Multiple sequence alignment: In pur-suit of homologous DNA positions. Genome Res. 17:127-135.
Kumazawa, Y, and M. Nishida. 1993. Sequence evolution of mitochon-drial tRNA genes and deep branch animal phylogenetics. J. Mol.Evol. 37:380-398.
Lambert, C, J. M. Campenhout, X. DeBolle, and E. Depiereux. 2003.Review of common sequence alignment methods: Clues to enhancereliability. Curr. Genomics 4:131-146
Lassmann, T, and E. L. L. Sonnhammer. 2005. Automatic alignmentassessment of alignment quality. Nucleic Acids Res. 33:7120-7128.
Leache, A. D., and J. A. McGuire. 2006. Phylogenetic relationships ofhorned lizards (Phrynosoma) based on nuclear and mitochondrialdata: Evidence for a misleading mitochondrial gene tree. Mol. Phy-logenet. Evol. 39:628-644.
Lebrun, E., J. M. Santini, M. Brugna, A. -L. Ducluzeau, S. Ouchane, B.Scoepp-Cothenet, E Baymann, and W. Nitschke. 2006. The Rieskeprotein: A case study on the pitfalls of multiple sequence alignmentsand phylogenetic reconstruction. Mol. Biol. Evol. 23:1180-1190.
Lee, C, C. Grasso, and M. F. Sharlow. Multiple sequence alignmentusing partial order graphs. Bioinformatics 18:425-464.
Levinson, G., and G. A. Gutman. 1987. Slipped-strand mispairing:A major mechanism for DNA sequence evolution. Mol. Bio. Evol.4:203-221.
Lewis, P. 0.2001. A likelihood approach to estimating phylogeny fromdiscrete morphological character data. Syst. Biol. 50:913-925.
Lewis, P. O., M. T. Holder, and K. E. Holsinger. 2005. Polytomies andBayesian and phylogenetic inference. Syst. Biol. 54:241-253.
Li, W.-H. 1997. Molecular evolution. Sinauer Associates, Sunderland,Massachusetts.
Lohne, C, and T. Borsch. 2005. Molecular evolution and phylogeneticutility of the petD group II intron: A case study in basal angiosperms.Mol. Biol. Evol. 22:317-322.
Lopez, T. J., E. D. Hauselman, L. R. Maxson, and J. W. Wright. 1992.Preliminary analysis of phylogenetic relationships among GalapagosIsland lizards of the genus Tropidurus. Amphibia-Reptilia 13:327-339.
Loytynoja, A., and N. Goldman. 2005. An algorithm for progressivemultiple alignment of sequences with insertions. Proc. Natl. Acad.Sci. USA 102:10557-10562.
Loytynoja, A., and M. C. Milinkovitch. 2001. SOAP. Cleaning multiplealignments from unstable blocks. Bioinformatics 17:277-286.
Loytynoja, A., and M. C. Milinkovitch. 2003. ProAlign, a probabilisticmultiple alignment. Bioinformatics 19:1505-1513.
Lunter, G., A. J. Drummond, I. Miklos., and J. Hein. 2005a. Statisticalalignment: Recent progress, new applications, and challenges. Pages382-411 in Statistical methods in molecular evolution (R. Nielsen,ed.). Springer, New York.
Lunter, G., I. M. Miklos, A. Drummond, J. L. Jensen, and J. Hein. 2005b.Bayesian coestimation of phylogeny and sequence alignment. BMCBioinformatics 6:83
Metzler. D. 2003. Statistical alignment based on fragment insertion anddeletion models. Bioinformatics 19:490-499.
Miklos, I., G. A. Lunter, and I. Holmes. 2004. A "long-indel" model forevolutionary sequence alignment. Mol. Biol. Evol. 21:529-540.
Minin, V., Z. Abdo, P. Joyce, and J. Sullivan. 2003. Performance-basedselection of likelihood models for phylogeny estimation. Syst. Biol.52:674-683.
Morgenstern, B. 1999. DIALIGN 2: Improvement of the segment-to-segment approach to multiple sequence alignment. Bioinformatics15:211-218.
Morrison, D. A. 2006. Multiple sequence alignment for phylogeneticpurposes. Austral. Syst. Bot. 19:479-539.
Notredame, C, D. G. Higgins, and J. Heringa. 2000. T-coffee: A novelmethod for fast and accurate multiple sequence alignment. J. Mol.Biol. 302:205-217.
Ogden, T. H., and M. S. Rosenberg. 2006. Multiple sequence alignmentaccuracy and phylogenetic inference. Syst. Biol. 55:314-328.
Pagel, M., and A. Meade. 2004. A phylogenetic mixture model for de-tecting pattern heterogeneity in gene sequence or character statedata. Syst. Biol. 53:571-581.
by guest on February 13, 2016http://sysbio.oxfordjournals.org/
Dow
nloaded from
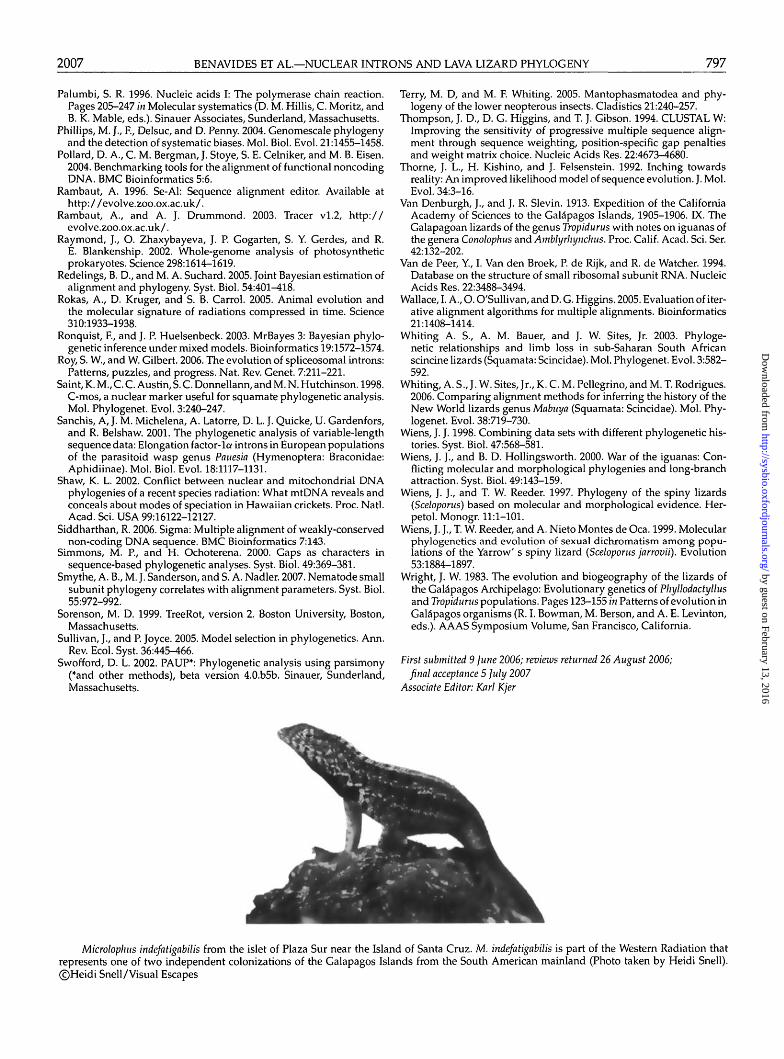
2007 BENAVIDES ET AL.—NUCLEAR INTRONS AND LAVA LIZARD PHYLOGENY 797
Palumbi, S. R. 1996. Nucleic acids I: The polymerase chain reaction.Pages 205-247 in Molecular systematics (D. M. Hillis, C. Moritz, andB. K. Mable, eds.). Sinauer Associates, Sunderland, Massachusetts.
Phillips, M. J., F., Delsuc, and D. Penny. 2004. Genomescale phylogenyand the detection of systematic biases. Mol. Biol. Evol. 21:1455-1458.
Pollard, D. A., C. M. Bergman, J. Stoye, S. E. Celniker, and M. B. Eisen.2004. Benchmarking tools for the alignment of functional noncodingDNA. BMC Bioinformatics 5:6.
Rambaut, A. 1996. Se-Al: Sequence alignment editor. Available athttp://evolve.zoo.ox.ac.uk/.
Rambaut, A., and A. J. Drummond. 2003. Tracer vl.2, http://evolve.zoo.ox.ac.uk/.
Raymond, J., O. Zhaxybayeva, J. P. Gogarten, S. Y. Gerdes, and R.E. Blankenship. 2002. Whole-genome analysis of photosyntheticprokaryotes. Science 298:1614-1619.
Redelings, B. D., and M. A. Suchard. 2005. Joint Bayesian estimation ofalignment and phylogeny. Syst. Biol. 54:401-418.
Rokas, A., D. Kruger, and S. B. Carrol. 2005. Animal evolution andthe molecular signature of radiations compressed in time. Science310:1933-1938.
Ronquist, R, and J. P. Huelsenbeck. 2003. MrBayes 3: Bayesian phylo-genetic inference under mixed models. Bioinformatics 19:1572-1574.
Roy, S. W., and W. Gilbert. 2006. The evolution of spliceosomal introns:Patterns, puzzles, and progress. Nat. Rev. Genet. 7:211-221.
Saint, K. M., C. C. Austin, S. C. Donnellann, and M. N. Hutchinson. 1998.C-mos, a nuclear marker useful for squamate phylogenetic analysis.Mol. Phylogenet. Evol. 3:240-247.
Sanchis, A,}. M. Michelena, A. Latorre, D. L. J. Quicke, U. Gardenfors,and R. Belshaw. 2001. The phylogenetic analysis of variable-lengthsequence data: Elongation factor-la introns in European populationsof the parasitoid wasp genus Pauesia (Hymenoptera: Braconidae:Aphidiinae). Mol. Biol. Evol. 18:1117-1131.
Shaw, K. L. 2002. Conflict between nuclear and mitochondrial DNAphylogenies of a recent species radiation: What mtDNA reveals andconceals about modes of speciation in Hawaiian crickets. Proc. Natl.Acad. Sci. USA 99:16122-12127.
Siddharthan, R. 2006. Sigma: Multiple alignment of weakly-conservednon-coding DNA sequence. BMC Bioinformatics 7:143.
Simmons, M. P., and H. Ochoterena. 2000. Gaps as characters insequence-based phylogenetic analyses. Syst. Biol. 49:369-381.
Smythe, A. B., M. J. Sanderson, and S. A. Nadler. 2007. Nematode smallsubunit phylogeny correlates with alignment parameters. Syst. Biol.55:972-992.
Sorenson, M. D. 1999. TreeRot, version 2. Boston University, Boston,Massachusetts.
Sullivan, J., and P. Joyce. 2005. Model selection in phylogenetics. Ann.Rev. Ecol. Syst. 36:445-466.
Swofford, D. L. 2002. PAUP*: Phylogenetic analysis using parsimony(*and other methods), beta version 4.0.b5b. Sinauer, Sunderland,Massachusetts.
Terry, M. D, and M. F. Whiting. 2005. Mantophasmatodea and phy-logeny of the lower neopterous insects. Cladistics 21:240-257.
Thompson, J. D., D. G. Higgins, and T. J. Gibson. 1994. CLUSTAL W:Improving the sensitivity of progressive multiple sequence align-ment through sequence weighting, position-specific gap penaltiesand weight matrix choice. Nucleic Acids Res. 22:4673-4680.
Thome, J. L., H. Kishino, and J. Felsenstein. 1992. Inching towardsreality: An improved likelihood model of sequence evolution. J. Mol.Evol. 34:3-16.
Van Denburgh, J., and J. R. Slevin. 1913. Expedition of the CaliforniaAcademy of Sciences to the Galapagos Islands, 1905-1906. IX. TheGalapagoan lizards of the genus Tropidums with notes on iguanas ofthe genera Conolophus and Amblyrhynchus. Proc. Calif. Acad. Sci. Ser.42:132-202.
Van de Peer, Y, I. Van den Broek, P. de Rijk, and R. de Watcher. 1994.Database on the structure of small ribosomal subunit RNA. NucleicAcids Res. 22:3488-3494.
Wallace, I. A., O. O'Sullivan, and D. G. Higgins. 2005. Evaluation of iter-ative alignment algorithms for multiple alignments. Bioinformatics21:1408-1414.
Whiting A. S., A. M. Bauer, and J. W. Sites, Jr. 2003. Phyloge-netic relationships and limb loss in sub-Saharan South Africanscincine lizards (Squamata: Scincidae). Mol. Phylogenet. Evol. 3:582-592.
Whiting, A. S., J. W. Sites, Jr., K. C. M. Pellegrino, and M. T. Rodrigues.2006. Comparing alignment methods for inferring the history of theNew World lizards genus Mabnya (Squamata: Scincidae). Mol. Phy-logenet. Evol. 38:719-730.
Wiens, J. J. 1998. Combining data sets with different phylogenetic his-tories. Syst. Biol. 47:568-581.
Wiens, J. J., and B. D. Hollingsworth. 2000. War of the iguanas: Con-flicting molecular and morphological phylogenies and long-branchattraction. Syst. Biol. 49:143-159.
Wiens, J. J., and T. W. Reeder. 1997. Phylogeny of the spiny lizards(Sceloporus) based on molecular and morphological evidence. Her-petol. Monogr. 11:1-101.
Wiens, J. J., T. W. Reeder, and A. Nieto Montes de Oca. 1999. Molecularphylogenetics and evolution of sexual dichromatism among popu-lations of the Yarrow' s spiny lizard (Sceloporus jarrovii). Evolution53:1884-1897.
Wright, J. W. 1983. The evolution and biogeography of the lizards ofthe Galdpagos Archipelago: Evolutionary genetics of Phyllodactyllusand Tropidums populations. Pages 123-155 in Patterns of evolutioninGalapagos organisms (R. I. Bowman, M. Berson, and A. E. Levinton,eds.). AAAS Symposium Volume, San Francisco, California.
First submitted 9 June 2006; reviews returned 26 August 2006;final acceptance 5 July 2007
Associate Editor: Karl Kjer
Microlophus indefatigabilis from the islet of Plaza Sur near the Island of Santa Cruz. M. indefatigabilis is part of the Western Radiation thatrepresents one of two independent colonizations of the Galapagos Islands from the South American mainland (Photo taken by Heidi Snell).©Heidi Snell/Visual Escapes
by guest on February 13, 2016http://sysbio.oxfordjournals.org/
Dow
nloaded from
Related Documents