Molecular Phenotyping of Retinal Ganglion Cells Robert E. Marc and Bryan W. Jones John Moran Eye Center, University of Utah School of Medicine, Salt Lake City, Utah 84132 Classifying all of the ganglion cells in the mammalian retina has long been a goal of anatomists, physiologists, and cell biolo- gists. The rabbit retinal ganglion cell layer was phenotyped using intrinsic small molecule signals (aspartate, glutamate, glycine, glutamine, GABA, and taurine) and glutamate receptor- gated 1-amino-4-guanidobutane excitation signals as the clus- tering dimensions for formal classification. Intrinsic signals alone yielded 7 ganglion cell superclasses and 1 amacrine cell superclass; the addition of excitation signals ultimately resolved 14 natural ganglion cell classes and 3 amacrine cell classes. Ganglion cells comprise two-thirds to three-quarters of the cells in the ganglion cell layer and exhibited distinct metabolic, coupling, and excitation phenotypes, as well as characteristic sizes, population fractions, and patterns. Metabolic signatures (mixtures of glutamate, aspartate, glutamine, and GABA) chem- ically discriminated ganglion from amacrine cells. Coupling signatures reflected heterologous coupling states across gan- glion cells: (1) uncoupled, (2) coupled to GABAergic amacrine cells, and (3) coupled to glycinergic amacrine cells. Excitation signatures reflected differential channel permeation rates across classes after AMPA activation. Extraction of unique size and patterning features from the data sets further validated the robustness of the classification. Because the classifications were explicitly blinded to structure, this is strong evidence that molecular phenotype classes are natural classes. Correspon- dences of molecular phenotype classes to functional classes were inferred from size, coupling, encounter, and physiological attributes. Ganglion cell classes display markedly different ionotropic drives, which may partly explain the physiological brisk–sluggish spectrum of ganglion cell spiking patterns. Key words: neuronal classification; molecular phenotyping; 1-amino-4-guanidobutane; AGB; retina; ganglion cells; ama- crine cells; patterning Efforts to assess the classes, numbers, and distributions of retinal ganglion cells have engaged diverse metrics: cell count, size, shape, axon diameter, and physiological encounter rates. Subsets of mammalian ganglion cell classes project to an array of central targets (Fukuda and Stone, 1974; Farmer and Rodieck, 1982; Leventhal et al., 1985; Rodieck and Watanabe, 1993; Pu et al., 1994; Rodieck, 1998), but a unified description of all classes and distributions in the ganglion cell layer has remained elusive. Several summaries of how neuronal typologies might be ab- stracted have emerged, some accompanied by debates regarding methods, definitions, and results (Rowe and Stone, 1977; Hughes, 1979; Holden, 1981; Rodieck and Brening, 1982; Famiglietti, 1992; Wingate et al., 1992; Cook, 1998; Masland and Raviola, 2000). We have performed a formal multispectral classification (Swain and Davis, 1978) of the rabbit ganglion cell layer using molecular signals as the dimensions of the multispectral space. The attributes of such a classification were precisely articulated by Famiglietti (1992): “. . .the ability to label neurons by neurotrans- mitter molecules. . .has provided a new means of identifying neurons repeatedly with some reliability. Nevertheless such labels are not unique markers. As a consequence of their very large range of diversity, neurons are likely to be identified and characterized as unique types by quantifying the expression of overlapping sets of markers, rather than by absolutely unique indicators....The plausible hypothesis has been advanced that ‘natural’ cell types emerge as distinct clusters of points in a parametric space. . .” Although Famiglietti and others (Rodieck and Brening, 1982; Cook, 1998) generally conceived this parametric space to be morphological, mixtures of small molecules do constitute distinc- tive signatures for many natural classes of retinal cells (Marc et al., 1995, 1998; Kalloniatis et al., 1996). On the basis of previous analyses, we expected that the signatures of natural ganglion cell classes would be poorly separable (Marc, 1999a,b), but when we expanded the set of molecular targets to include aspartate, glu- tamate, glycine, glutamine, GABA, and taurine signals, strongly heterogeneous multispectral signatures emerged in the ganglion cell layer, suggesting that detailed phenotyping was indeed pos- sible. Excitation signatures based on mapping AMPA-activated 1-amino-4-guanidobutane (AGB) permeation (Marc, 1999b) proved decisive. Fusion of excitation and intrinsic signals permit- ted the demonstration that the rabbit retinal ganglion cell layer contains no fewer than 14 natural types of ganglion cells, and some are further characterized by cell size, patterning, and pop- ulation fraction. This separability arises from three forms of molecular phenotype variation: (1) some ganglion cells display different intrinsic glutamatergic metabolite signatures; (2) other cells express different degrees of heterologous coupling with amacrine cells, leading to separable patterns of GABA and gly- cine leakage into the ganglion cells; and (3) each cell class expresses a characteristic AMPA receptor-mediated drive. MATERIALS AND METHODS Terminology. We define five retinal cell types as major cellular divisions traditionally distinguished by position and shape: photoreceptors, bipolar cells, horizontal cells, amacrine cells, and ganglion cells. We define Received Aug. 29, 2001; accepted Oct. 23, 2001. This work was supported by National Institutes of Health Grant EY02576 (R.E.M.) and a Jules and Doris Stein Research to Prevent Blindness Professorship (R.E.M.). R.E.M. is a principal of Signature Immunologics Inc. Correspondence should be addressed to Robert E. Marc, John Moran Eye Center, University of Utah, 75 North Medical Drive, Salt Lake City, UT 84132. E-mail: [email protected]. Copyright © 2002 Society for Neuroscience 0270-6474/02/220413-15$15.00/0 The Journal of Neuroscience, January 15, 2002, 22(2):413–427

Welcome message from author
This document is posted to help you gain knowledge. Please leave a comment to let me know what you think about it! Share it to your friends and learn new things together.
Transcript
Molecular Phenotyping of Retinal Ganglion Cells
Robert E. Marc and Bryan W. Jones
John Moran Eye Center, University of Utah School of Medicine, Salt Lake City, Utah 84132
Classifying all of the ganglion cells in the mammalian retina haslong been a goal of anatomists, physiologists, and cell biolo-gists. The rabbit retinal ganglion cell layer was phenotypedusing intrinsic small molecule signals (aspartate, glutamate,glycine, glutamine, GABA, and taurine) and glutamate receptor-gated 1-amino-4-guanidobutane excitation signals as the clus-tering dimensions for formal classification. Intrinsic signalsalone yielded 7 ganglion cell superclasses and 1 amacrine cellsuperclass; the addition of excitation signals ultimately resolved14 natural ganglion cell classes and 3 amacrine cell classes.Ganglion cells comprise two-thirds to three-quarters of the cellsin the ganglion cell layer and exhibited distinct metabolic,coupling, and excitation phenotypes, as well as characteristicsizes, population fractions, and patterns. Metabolic signatures(mixtures of glutamate, aspartate, glutamine, and GABA) chem-ically discriminated ganglion from amacrine cells. Couplingsignatures reflected heterologous coupling states across gan-
glion cells: (1) uncoupled, (2) coupled to GABAergic amacrinecells, and (3) coupled to glycinergic amacrine cells. Excitationsignatures reflected differential channel permeation ratesacross classes after AMPA activation. Extraction of unique sizeand patterning features from the data sets further validated therobustness of the classification. Because the classificationswere explicitly blinded to structure, this is strong evidence thatmolecular phenotype classes are natural classes. Correspon-dences of molecular phenotype classes to functional classeswere inferred from size, coupling, encounter, and physiologicalattributes. Ganglion cell classes display markedly differentionotropic drives, which may partly explain the physiologicalbrisk–sluggish spectrum of ganglion cell spiking patterns.
Key words: neuronal classification; molecular phenotyping;1-amino-4-guanidobutane; AGB; retina; ganglion cells; ama-crine cells; patterning
Efforts to assess the classes, numbers, and distributions of retinalganglion cells have engaged diverse metrics: cell count, size,shape, axon diameter, and physiological encounter rates. Subsetsof mammalian ganglion cell classes project to an array of centraltargets (Fukuda and Stone, 1974; Farmer and Rodieck, 1982;Leventhal et al., 1985; Rodieck and Watanabe, 1993; Pu et al.,1994; Rodieck, 1998), but a unified description of all classes anddistributions in the ganglion cell layer has remained elusive.Several summaries of how neuronal typologies might be ab-stracted have emerged, some accompanied by debates regardingmethods, definitions, and results (Rowe and Stone, 1977; Hughes,1979; Holden, 1981; Rodieck and Brening, 1982; Famiglietti,1992; Wingate et al., 1992; Cook, 1998; Masland and Raviola,2000). We have performed a formal multispectral classification(Swain and Davis, 1978) of the rabbit ganglion cell layer usingmolecular signals as the dimensions of the multispectral space.The attributes of such a classification were precisely articulated byFamiglietti (1992): “. . .the ability to label neurons by neurotrans-mitter molecules. . .has provided a new means of identifyingneurons repeatedly with some reliability. Nevertheless such labelsare not unique markers. As a consequence of their very largerange of diversity, neurons are likely to be identified andcharacterized as unique types by quantif ying the expression ofoverlapping sets of markers, rather than by absolutely unique
indicators. . . .The plausible hypothesis has been advanced that‘natural’ cell types emerge as distinct clusters of points in aparametric space. . .”
Although Famiglietti and others (Rodieck and Brening, 1982;Cook, 1998) generally conceived this parametric space to bemorphological, mixtures of small molecules do constitute distinc-tive signatures for many natural classes of retinal cells (Marc etal., 1995, 1998; Kalloniatis et al., 1996). On the basis of previousanalyses, we expected that the signatures of natural ganglion cellclasses would be poorly separable (Marc, 1999a,b), but when weexpanded the set of molecular targets to include aspartate, glu-tamate, glycine, glutamine, GABA, and taurine signals, stronglyheterogeneous multispectral signatures emerged in the ganglioncell layer, suggesting that detailed phenotyping was indeed pos-sible. Excitation signatures based on mapping AMPA-activated1-amino-4-guanidobutane (AGB) permeation (Marc, 1999b)proved decisive. Fusion of excitation and intrinsic signals permit-ted the demonstration that the rabbit retinal ganglion cell layercontains no fewer than 14 natural types of ganglion cells, andsome are further characterized by cell size, patterning, and pop-ulation fraction. This separability arises from three forms ofmolecular phenotype variation: (1) some ganglion cells displaydifferent intrinsic glutamatergic metabolite signatures; (2) othercells express different degrees of heterologous coupling withamacrine cells, leading to separable patterns of GABA and gly-cine leakage into the ganglion cells; and (3) each cell classexpresses a characteristic AMPA receptor-mediated drive.
MATERIALS AND METHODSTerminology. We define five retinal cell types as major cellular divisionstraditionally distinguished by position and shape: photoreceptors, bipolarcells, horizontal cells, amacrine cells, and ganglion cells. We define
Received Aug. 29, 2001; accepted Oct. 23, 2001.This work was supported by National Institutes of Health Grant EY02576
(R.E.M.) and a Jules and Doris Stein Research to Prevent Blindness Professorship(R.E.M.). R.E.M. is a principal of Signature Immunologics Inc.
Correspondence should be addressed to Robert E. Marc, John Moran EyeCenter, University of Utah, 75 North Medical Drive, Salt Lake City, UT 84132.E-mail: [email protected] © 2002 Society for Neuroscience 0270-6474/02/220413-15$15.00/0
The Journal of Neuroscience, January 15, 2002, 22(2):413–427
superclasses and classes as statistical groups within a type. Thus we areconcerned with discovering the natural classes of the ganglion cell type.A statistical class is defined by its position and dispersion inN-dimensional space. If it is well separated from its fellow classes andcannot be separated further, it may be a natural class. That hypothesis isstrengthened if the statistical class can be shown to possess additionalfeatures associated with presumed natural classes. In this process, we willsee that some natural classes form intermediate statistical groups assuperclasses.
Isolated retinal preparations. These methods follow those described inMarc (1999a). Light-adapted adult male and female pigmented rabbitswere tranquilized with intramuscular ketamine/xylazine, deeply anesthe-tized with intraperitoneal urethane in saline, and euthanized by thora-cotamy, all in accord with institutional animal care and use guidelines.Both eyes were rapidly removed and hemisected, and large retinal pieceswere mounted on cellulose acetate filter discs, then bathed in 35°C Amesmedium (Ames and Nesbett, 1981) equilibrated with 95% O2/5% CO2 orHEPES-based modified Ames medium equilibrated with 100% O2. Sin-gle 2 � 3 mm retinal chips taken within 2 mm of the visual streak wererazor cut from the large pieces and incubated for 10 min at 35°C undergas in 100 �l droplets of Ames or HEPES-based medium containing 5mM AGB and 25 �l AMPA. All incubations were performed underfluorescent room lighting as described in Marc (1999a). Samples fromfour rabbits (cases 2366, 2578, 2780, and 2781) were similarly processedand classified (see below). Horizontal sections from retinas of �20 otherspecimens with and without AGB or agonists were also analyzed. Allretinas were fixed by immersing chips in room temperature 1% parafor-maldehyde, 2.5% glutaraldehyde, 3% sucrose, 0.01% CaCl2, in 0.1 Mphosphate buffer, pH 7.4. All tissue was processed as described previ-ously (Marc et al., 1990).
Specimen preparation and immunocytochemical visualization. Each chipwas flat embedded in epoxy resin on a glass slide; a small rectangularsample was scribed from the slide (Stell and Lightfoot, 1975) and sec-tioned serially at 250 nm onto 12-spot Teflon-coated slides (Cel-Line,Fisher Scientific). The immunocytochemical and IgG production proce-dures were as described previously (Marc et al., 1990, 1995) using thesilver-intensification protocol of Kalloniatis and Fletcher (1993). Thesamples were serially probed with IgGs targeting aspartate, glutamate,glutamine, glycine, GABA, taurine, and AGB obtained from SignatureImmunologics Inc. (Salt Lake City, UT). Primary IgG signals weredetected with goat anti-rabbit IgGs adsorbed to 1 nm gold particles(Amersham Biosciences) and visualized with silver intensification. Thesilvering process was run at 30°C for 240 sec before quenching. Allpreparations received identical probing and visualization treatments,yielding two orders of magnitude of detection range with differentialconcentration sensitivity as low as 40 �M based on artificial standards.Single-letter amino acid codes were sometimes used to denote AGB (B),aspartate (D), glutamate (E), glycine (G), glutamine (Q), taurine (�), andGABA (�). The selectivities of each of these probes have been charac-terized extensively. This is particularly critical for the IgG targetingGABA, because we interpret variations in signal strength as reflectingtrue GABA content arising from different sources. It is important toknow the degree to which small signals could reflect contamination. Fullcross-reactivity data for the Signature Immunologics YY100 anti-GABAhave been obtained for the most plausible contaminating species: ala-nine, �-alanine, citrulline, cysteine, aspartate, glutamate, glycine, isoleu-cine, glutathione, lysine, leucine, methionine, asparagine, arginine, orni-thine, proline, glutamine, serine, threonine, valine, tryptophan, tyrosine,ATP, ADP, AMP, cAMP, and cGMP, as well as all macromoleculesexpressed in retina. With the exception of �-alanine, the YY100 IgG isselective for GABA at �10,000:1. The selectivity for �-alanine (thethree-carbon analog of GABA) is 80:1. This means that low levels ofGABA-like immunoreactivity could be produced by �-alanine only if itwere present in 80-fold excess over the inferred GABA level: a 0.1 mMYY100 signal could be produced by 8 mM �-alanine. However, this is animpossible level, because the ganglion cell layer shows little endogenous�-alanine immunoreactivity (�0.5 mM maximum) using our own�-alanine-selective IgG, and the cells in question (those showing the leastamount of GABA signal, �0.1–1 mM) have no detectable �-alanineimmunoreactivity. Thus we are confident that the GABA signal isaccurate and uncontaminated. Similar verifications hold for each of theIgGs used in this study.
Image analysis. All images of immunoreactivity were captured as 8-bit1536 pixel � 1152 line frames under constant flux light with feedbackregulation and fixed CCD camera gain and gamma as described previ-
ously (Marc, 1999a). Silver visualization produces density-scaled images,and linear image inversion produces intensity-scaled images that arelinear with log10(concentration) over a range of 0.05–10 mM. Serialimages were aligned to �250 nm root-mean-square error with registra-tion algorithms from PCI Geomatics (Richmond, Hill, Ontario, Canada).Image analysis and morphometry were performed with Image-Pro Plus2.0 (Media Cybernetics Inc., Silver Spring, MD).
Classification followed these steps: (1) capture of N molecular signalchannels, (2) registration of channels, (3) isodata clustering of N chan-nels, (4) theme map generation, (5) histogram and scatter plot explora-tion, and if necessary, (6) deconvolution and theme map correction.After theme map generation (step 4), univariate and bivariate signalhistograms were explored for each emergent class. In cases in which asignal was clearly multimodal, the histogram was deconvolved, and eachcell was recoded. This is roughly equivalent to another form of classifi-cation based on watershed filtering of N-space histograms to find deci-sion boundaries (Narendra and Goldberg, 1977). Classes completelyresolved by clustering were formally statistically separable, and thoseresolved by deconvolution were formally statistically significant (seebelow).
Classifications were performed using the isodata algorithm (PCI Geo-matics), and data were explored with applications written in IDL (Re-search Systems Inc., Boulder, CO). An overview of and reference lists forsimple classical pattern recognition methods are provided in Marc et al.(1995). Isodata resembles the simpler K-means clustering method butadds heuristic splitting of high variance classes and merging of highlyoverlapping classes (Ball and Hall, 1967). Statistical separability indicatesthat the means and covariances for a set of N-dimensional data allowclassification of a sample of those data into distinct classes. The proba-bility of error ( pe) in classification is estimated from the transformeddivergences of the classes assuming equal a priori probability densities.Cell classes described as separable have pe � 0.01. Separable classes arealso inherently statistically significant classes. Natural classes need not beinherently separable by clustering and could have signature overlapsgreater than required for pe � 0.01 yet still be statistically significantclasses. In the separations of class 5 from 9, and class 10 from 11, we useddeconvolution methods [previously detailed in Marc et al. (1995)] todetect signals arising from distinct classes that clustering failed to resolvecompletely. These cells were reassigned as classes associated with a modeof a bimodal distribution by thresholding above and below the modecrossover point.
The multidimensional signatures of classes were visualized as selectedrgb maps (encoding three molecular signals as red, green, and bluesignals, respectively) and as superimposed bivariate 2N-plots. Singlebivariate plots (Marc et al., 1995) display the area of concentration spaceoccupied by a class in a two-dimensional chemical space. 2N-plots su-perimpose several bivariate plots, capturing most of the features discrim-inating cell groupings in an N-space. This method was inspired by theparallel coordinate space described by Inselberg and Dimsdale (1990).Pairs of signals were displayed as class means bounded by 2 SD margins.The x–y axes spanned 0.1–10 mM with logarithmic scaling, and the [x,y]pairs were color coded: [AGB, AGB] gray; [E, �] orange; [D, Q] cyan;and [G, �] magenta.
Average cell diameters and cell spacings were acquired with the objectutilities in ImagePro Plus 2.0 (Media Cybernetics). Cell sizes in eachsample were measured only from glutamate signals in individual 250 nmsections, so cell size estimates contain no registration errors and requireno use of dissector methods. Some classified cells often appeared to formregular arrays, and these were numerically characterized by their con-formity ratios (CRs; also known as regularity indices): the ratio of theclass mean nearest-neighbor distance to its SD. The significance of thedeviation of a conformity ratio from that predicted for a random patternwas determined from significance charts in Cook (1996).
Agents and sources. Ames medium either was purchased from Sigma(St. Louis, MO) or made according to Ames and Nesbett (1981) andmodified as needed by equimolar Na � replacement with 15 mM HEPESand reduction of NaHCO3 to 1 mM. AGB and AMPA were addedwithout adjustment. All solutions were made before each preparation.AGB (agmatine sulfate) was obtained from Sigma, and AMPA was fromResearch Biochemicals International (Natick, MA).
Figure preparation. All images are digital, assembled from the raw datacaptured by CCD camera (see Image analysis above). Selected frames ofraw Tagged Image Format (*.tif) files were extracted for display, eachsharpened by unsharp masking, and after entire images were assembledas a single figure, contrasts were adjusted with linear remapping to
414 J. Neurosci., January 15, 2002, 22(2):413–427 Marc and Jones • Molecular Phenotyping of Retinal Ganglion Cells
correct for out-of-gamut effects during printing. All final images wereprepared in Adobe PhotoShop 5.0. Combinations of registered channelswere viewed as true-color rgb mappings, as described previously (Marc etal., 1995).
RESULTS
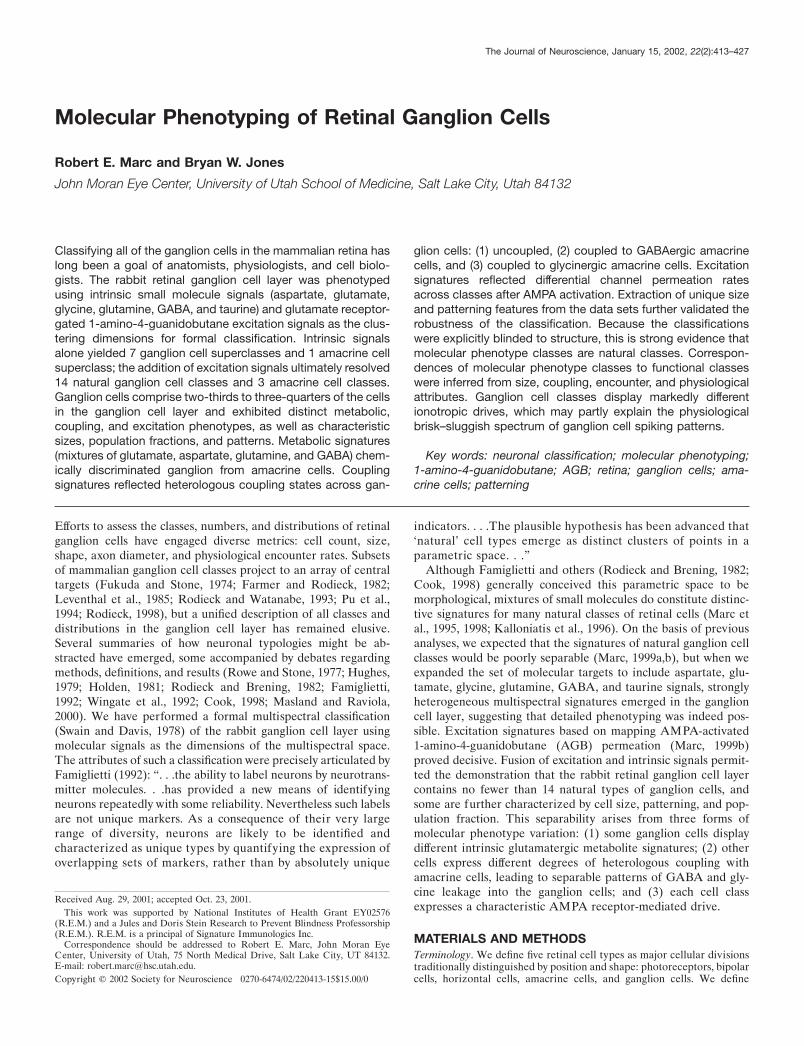
GABA signals demonstrate intrinsic heterogeneity inthe ganglion cell layerA common error in immunocytochemistry is the imputation, viaimagery, of binary states for small molecules: present versusabsent. This is almost never true for amino acids because absolutecontents vary across cell types. The error is often technical,arising from nonlinear and excessive amplification duringenzyme-linked visualization or saturation of signals (fluorescenceor absorption) during image capture or later processing. Silvervisualization of immunogold signals on thin sections offers un-paralleled signal differentiation. A spectrum of GABA signals,displayed in a single 250 nm section through the plane of theganglion cell layer in the central streak of the rabbit retina (Fig.1A) and ranging from �50 �M to �10 mM, characterizes differentcompartments. The basic reasons for this differentiation are thatsome ganglion cells contain no GABA; displaced starburst ama-
crine cells contain GAD65 (Brandon and Criswell, 1995) andsynthesize high GABA levels; Muller cells import GABA via ahigh-affinity GAT-3 transporter (Johnson et al., 1996) and me-tabolize it, yet have a persistent low level; and many ganglion cellsengage in heterologous dye coupling with amacrine cells (Xinand Bloomfield, 1997), and GABA could clearly leak into gan-glion cells. The concentration scaling of this image reveals thatMuller cells appear to contain �85 �M GABA (uncorrected forfixation loss) and that some large neuronal cells clearly containmeasurably less than that, whereas others contain much more.Some cells in the ganglion cell layer contain roughly the sameamount of GABA as the Muller cells and are nearly invisibleagainst the glial background (Fig. 1A, ellipse). An example of thesensitivity of the silvering method is also indicated, where a cleardifference between Muller cell and ganglion cell labeling can bedetected with as little as 40 �M calculated difference between thetwo compartments (Fig. 1A, box). Muller cell signals do varyacross preparations, primarily because the rate of GABA conver-sion to succinate semi-aldehyde is an explicitly aerobic reaction.This field was chosen for its slightly higher-than-average Mullercell signal, which highlights the range of ganglion cell GABAsignals. All of the signal diversity in Figure 1 is caused by
Figure 1. The diversity of GABA signals in theganglion cell layer. A, Differential GABA contentof cells in the ganglion cell layer of the rabbitretinal area centralis visualized by quantitativeGABA mapping on a 250 nm section. Scaling wasdetermined from artificial standards. Cellular con-tents range from �50 �M to �10 mM. Some gan-glion cells are literally invisible in the array be-cause they have the same GABA content as thesurrounding Muller cells (ellipse). Other cells canbe differentiated from the Muller cells by havingcontents roughly 40 �M higher (box); a stronglyimmunoreactive starburst amacrine cell is alsocontained in the box. Image is density scaled. Scalebar, 25 �m. B, C, Precision registered images ofGABA and glutamate immunoreactivity in serial250 nm sections through the optic fiber layer justproximal to the ganglion cell somas. Streaks ofGABA immunoreactivity represent axons of vary-ing caliber, and all GABA-immunoreactive axonsare contained in fascicles of glutamate-immunore-active axons. The grid overlay permits tracking ofcommon points in both images. Images are densityscaled. Scale bars, 25 �m.
Marc and Jones • Molecular Phenotyping of Retinal Ganglion Cells J. Neurosci., January 15, 2002, 22(2):413–427 415
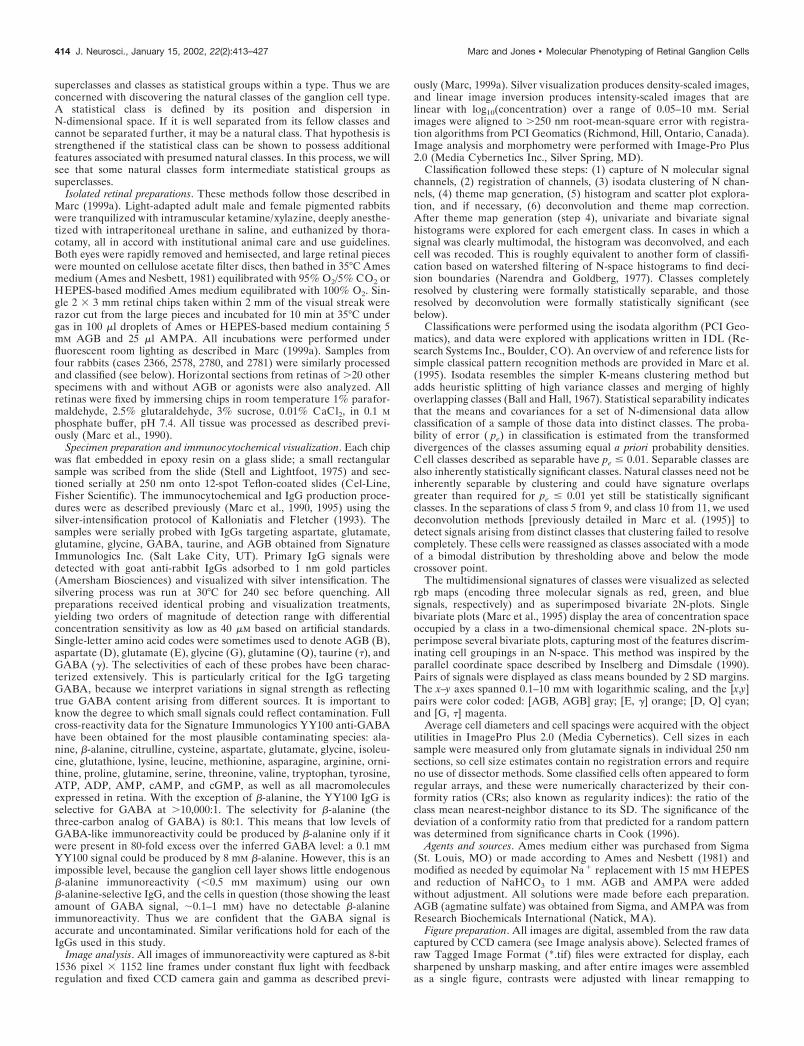
Figure 2. Excitation and intrinsic molecular signals in the ganglion cell layer visualized from an array of seven serial 250 nm sections (sequence: D GQ � � B E). All cells are embedded in a matrix of Muller cell cytoplasm. The reticulated patch at the top lef t of A and H represents intrusion of the innerplexiform layer into the plane. Sets of the same circled cells appear in every image: labels 1–12 indicate ganglion cell classes, labels dA1–3 indicateamacrine cell classes, and m indicates misplaced amacrine cells. All images are density scaled. Scale bar, 25 �m. A displays AMPA-activated AGBexcitation signals, and subsequent panels represent intrinsic signals: B, aspartate; C, glutamate; D, glycine; E, glutamine; F, glutamine with Muller cellsmasked; G, taurine; H, GABA. The inset in the glycine image (D) represents an array of glycine-immunoreactive amacrine cells from the same specimen.Ganglion cells contain a spectrum of glutamine signals (E, F ), and many cells, such as classes 5 and 9, closely match the glutamine contents of Mullercells. Some classes are significantly higher (class 1a), whereas others are substantially lower (classes 3, dA1, dA2, and dA3). In G, the black taurinebackground is Muller cell cytoplasm, revealing that taurine levels in ganglion cells are virtually zero.
416 J. Neurosci., January 15, 2002, 22(2):413–427 Marc and Jones • Molecular Phenotyping of Retinal Ganglion Cells
intercellular variations in GABA content; none can be caused bycorruption of the anti-GABA IgG signal with any known targets.This same pattern of GABA signals has been observed in �150rabbit retinas, at all loci, with variation in cell proportions. Sim-ilarly, fascicles of ganglion cell axons just beneath the layer ofsomas contain streaks of strong GABA signal (Fig. 1B) thatcorrespond to glutamate immunoreactive axons (Fig. 1C). Re-gardless of whether the GABA signal in ganglion cells arises fromcoupling leakage or synthesis, it appears in axons as well.
Full classification of the ganglion cell layerThe notion that one might be able to formally phenotype theganglion cell layer by applying pattern recognition algorithms tosets of molecular signatures (Marc et al., 1995) gains credencefrom images probed for excitation signals (Fig. 2A) and intrinsicsmall molecules (Fig. 2B–H) in a comprehensive data set ob-tained �2 mm below the visual streak. Aspartate levels varyacross cell types (Fig. 2B), even among cells displaying similarglutamate signals (Fig. 2C). This variation is not random, andstrong aspartate signals are biased toward large cells. Glutaminecontents (Fig. 2E,F) vary in a pattern similar but not identical toaspartate. The high glutamine contents of Muller cells form abackground against which many neurons are invisible, but mask-ing out Muller cells with their own signature class (Marc et al.,1990, 1995) exposes the full spectrum of neuronal glutaminecontents. Glycine signals in the ganglion cell layer are weak (Fig.2D), never exceeding a few hundred micromolar and never reach-ing the 5–10 mM levels achieved by glycinergic amacrine cells(Fig. 2D, inset). Nevertheless, certain cells always display glycinecontent higher than their neighbors. As in most vertebrates,taurine signals of the ganglion cell layer are restricted to Mullercells (Fig. 2G). Although none of these additional signals aloneexhibits differential patterning as dramatic as that of GABA (Fig.2H), separation improves with every dimension that adds evensmall correlations. Use of these intrinsic signals alone neverpermitted a complete segregation of all likely natural classes, butisodata clustering in five normal and four excitation-mappedretinas resolved eight neuronal superclasses, labeled according totheir dominant molecular signals: one amacrine cell and sevenganglion cell superclasses. At the simplest level, we can resolvetwo global N-dimensional clusters that distinguish amacrine andganglion cells as fully separable types, the details of which will bediscussed below. The superclasses of ganglion cells arise in partfrom fully separating or detecting strong three-dimensionalmodes of metabolic signatures dominated by glutamate (E) andcharacterized by increasing glutamine (Q) and aspartate (D)content: superclasses E, EQ, and EDQ. These basic superclasssignatures also are separable from their counterparts that alsopossess a GABA signal: superclasses E�, EQ�, and EDQ�. Asseen below, however, the EQ� and EDQ� modes do not com-pletely separate, because a bridging cell population overlaps thetwo, although it more appropriately fits in the EQ� superclass.Two variations on this simple theme emerge. First, one popula-tion of cells in the E� classification space further separates byevidencing coupling to glycinergic amacrine cells: superclassE�G. Finally, some members of the E� and EQ� classificationspaces contain GABA levels that are indistinguishable from thoseof bona fide amacrine cells. Several superclasses are compositesof natural classes.
The addition of an excitation signal proved decisive, enabling arobust estimate of the minimum number of ganglion cell naturalclasses and some of their morphological attributes. AGB is an
organic cation that permeates glutamate-gated ion channels, ac-cumulates in activated neurons, and can be detected with quan-titative immunochemical protocols (Marc, 1999a). AGB mappingthus reports recent excitation history. We have shown previouslythat activation of ionotropic glutamate receptors in the ganglioncell layer yields stable, heterogeneous patterns of AGB signals,implying intrinsic differences in the AMPA receptor properties ofganglion cells. We chose to analyze the excitation patterns gen-erated by 25 �M AMPA in the ganglion cell layer in combinationwith the signals that permit detection of the eight superclasses.Four normal adult rabbit retinas were incubated for 10 min inAmes medium containing 5 mM AGB and 25 �M AMPA. In allsamples, the ganglion cell layer displayed a spectrum of AMPA-driven responses (Fig. 2A). These signal differences must arisefrom variations in either the numbers or types of ionotropicglutamate receptors expressed by neurons and not simply cell sizevariation (Marc, 1999a). Both the very largest and smallest of cellsshow the strongest AMPA responsivity, whereas both large andsmall cell types also show very weak responses.
Inclusion of the AMPA-driven excitation signal in the AGB
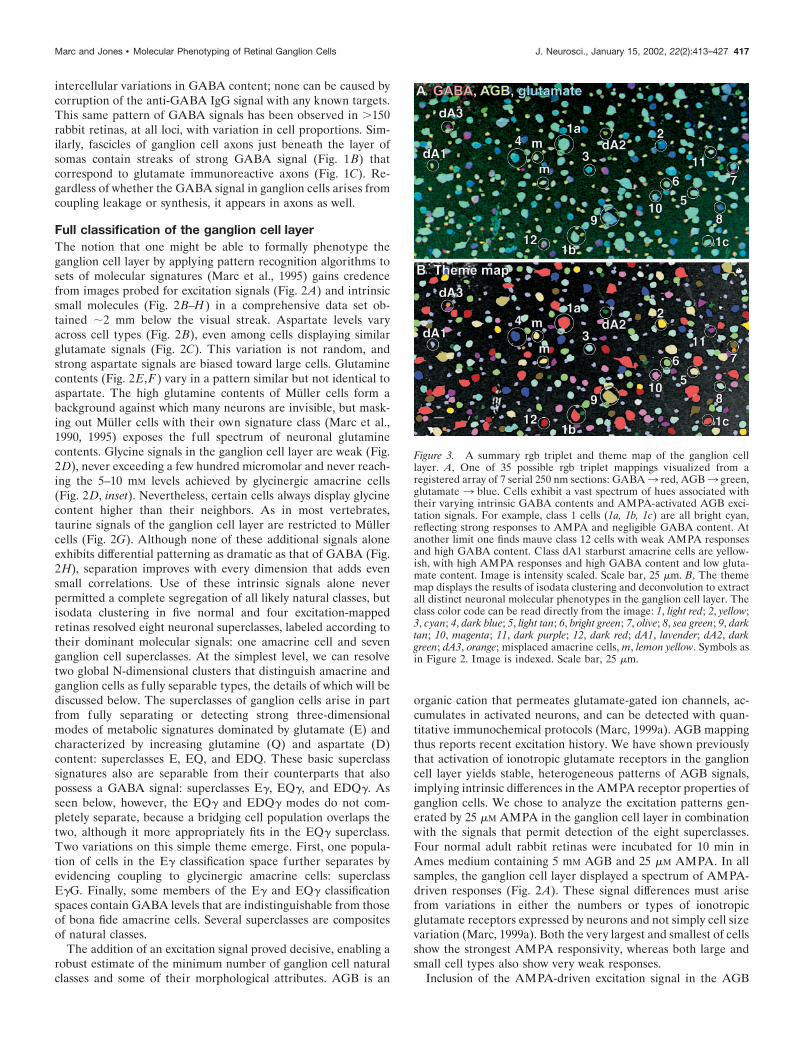
Figure 3. A summary rgb triplet and theme map of the ganglion celllayer. A, One of 35 possible rgb triplet mappings visualized from aregistered array of 7 serial 250 nm sections: GABA3 red, AGB3 green,glutamate 3 blue. Cells exhibit a vast spectrum of hues associated withtheir varying intrinsic GABA contents and AMPA-activated AGB exci-tation signals. For example, class 1 cells (1a, 1b, 1c) are all bright cyan,reflecting strong responses to AMPA and negligible GABA content. Atanother limit one finds mauve class 12 cells with weak AMPA responsesand high GABA content. Class dA1 starburst amacrine cells are yellow-ish, with high AMPA responses and high GABA content and low gluta-mate content. Image is intensity scaled. Scale bar, 25 �m. B, The thememap displays the results of isodata clustering and deconvolution to extractall distinct neuronal molecular phenotypes in the ganglion cell layer. Theclass color code can be read directly from the image: 1, light red; 2, yellow;3, cyan; 4, dark blue; 5, light tan; 6, bright green; 7, olive; 8, sea green; 9, darktan; 10, magenta; 11, dark purple; 12, dark red; dA1, lavender; dA2, darkgreen; dA3, orange; misplaced amacrine cells, m, lemon yellow. Symbols asin Figure 2. Image is indexed. Scale bar, 25 �m.
Marc and Jones • Molecular Phenotyping of Retinal Ganglion Cells J. Neurosci., January 15, 2002, 22(2):413–427 417
signal in the classification set resulted in enhanced differentiationof the ganglion cell layer, revealing molecular phenotype classesvisualized as rgb maps (Fig. 3A), theme maps (Fig. 3B), andsignature arrays (Fig. 4) of the constituent cells. Because the15-color theme map is complex, it is practical to decompose it intoits constituent cell patterns in Figure 5. The molecular phenotypedata suggest the existence of at least 14 natural classes of ganglioncells and 3 natural classes of displaced amacrine cells. In general,rgb maps suggest the existence of multiple cells classes by reveal-ing a spectrum of hues that correspond to a spectrum of molecularmixtures. Visual examination of such maps is not a proof, how-ever, and classification is essential, revealing both classes andtheir signature spaces.
Amacrine and ganglion cells are separate cell types in signa-ture space: amacrine cells are notably deficient in glutamate,aspartate, and glutamine signals, and they show enhanced GABAsignals, identical to GABA immunoreactive cells of the amacrinecell layer proper. The classification decision boundaries for ama-crine–ganglion cell discrimination are shown on the E� and DQbivariate signal channel summary plots (Fig. 4, lef t column) andthe univariate glutamate signal histogram of the ganglion celllayer (Fig. 6A). Although ganglion cells express various GABAsignals that may overlap into the amacrine cell range, they arenevertheless completely separable from amacrine cells in EDQ(glutamate–aspartate–glutamine) space.
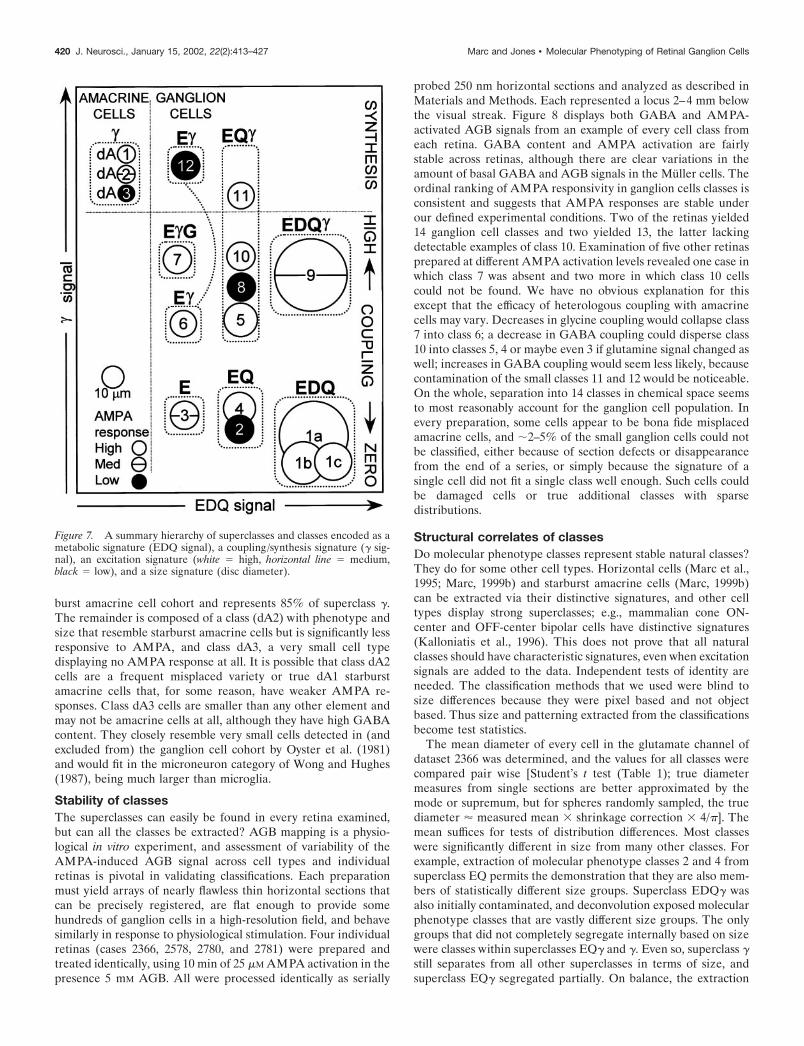
If molecular phenotype classes are natural classes, they musteventually map onto functional and morphological classes ofcells. As an interim naming strategy, we chose to label classes inordinal sequence by increasing GABA signals: i.e., class 1 cellscontain no detectable GABA and class 12 cells have high GABAcontents, with other classes ordered between. The relationshipsamong superclasses and classes are summarized in Figure 7 andbelow.
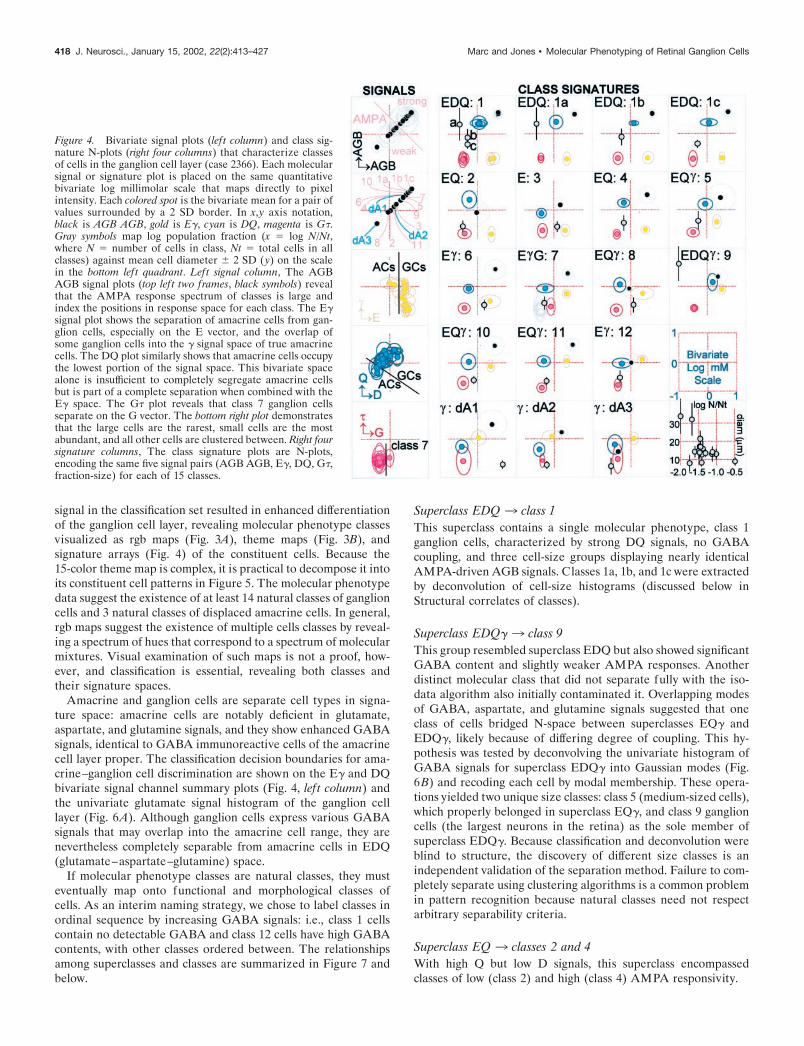
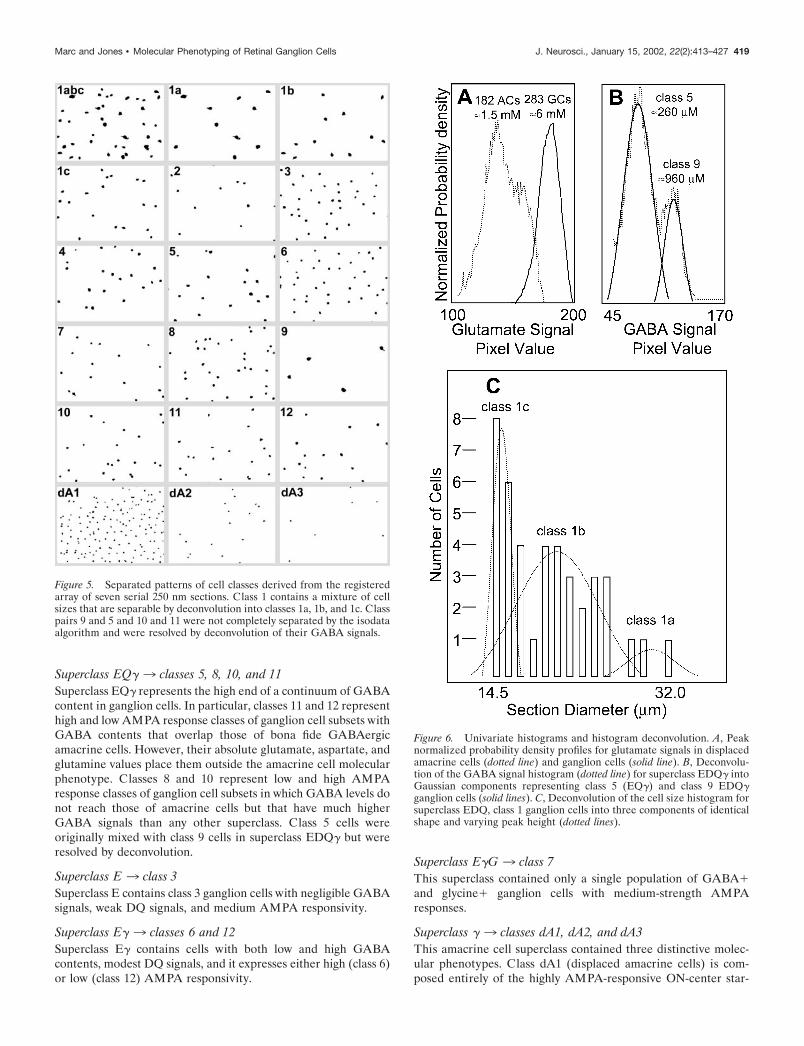
Superclass EDQ 3 class 1This superclass contains a single molecular phenotype, class 1ganglion cells, characterized by strong DQ signals, no GABAcoupling, and three cell-size groups displaying nearly identicalAMPA-driven AGB signals. Classes 1a, 1b, and 1c were extractedby deconvolution of cell-size histograms (discussed below inStructural correlates of classes).
Superclass EDQ� 3 class 9This group resembled superclass EDQ but also showed significantGABA content and slightly weaker AMPA responses. Anotherdistinct molecular class that did not separate fully with the iso-data algorithm also initially contaminated it. Overlapping modesof GABA, aspartate, and glutamine signals suggested that oneclass of cells bridged N-space between superclasses EQ� andEDQ�, likely because of differing degree of coupling. This hy-pothesis was tested by deconvolving the univariate histogram ofGABA signals for superclass EDQ� into Gaussian modes (Fig.6B) and recoding each cell by modal membership. These opera-tions yielded two unique size classes: class 5 (medium-sized cells),which properly belonged in superclass EQ�, and class 9 ganglioncells (the largest neurons in the retina) as the sole member ofsuperclass EDQ�. Because classification and deconvolution wereblind to structure, the discovery of different size classes is anindependent validation of the separation method. Failure to com-pletely separate using clustering algorithms is a common problemin pattern recognition because natural classes need not respectarbitrary separability criteria.
Superclass EQ 3 classes 2 and 4With high Q but low D signals, this superclass encompassedclasses of low (class 2) and high (class 4) AMPA responsivity.
Figure 4. Bivariate signal plots (lef t column) and class sig-nature N-plots (right four columns) that characterize classesof cells in the ganglion cell layer (case 2366). Each molecularsignal or signature plot is placed on the same quantitativebivariate log millimolar scale that maps directly to pixelintensity. Each colored spot is the bivariate mean for a pair ofvalues surrounded by a 2 SD border. In x, y axis notation,black is AGB AGB, gold is E�, cyan is DQ, magenta is G�.Gray symbols map log population fraction (x � log N/Nt,where N � number of cells in class, Nt � total cells in allclasses) against mean cell diameter � 2 SD ( y) on the scalein the bottom lef t quadrant. Left signal column, The AGBAGB signal plots (top lef t two frames, black symbols) revealthat the AMPA response spectrum of classes is large andindex the positions in response space for each class. The E�signal plot shows the separation of amacrine cells from gan-glion cells, especially on the E vector, and the overlap ofsome ganglion cells into the � signal space of true amacrinecells. The DQ plot similarly shows that amacrine cells occupythe lowest portion of the signal space. This bivariate spacealone is insufficient to completely segregate amacrine cellsbut is part of a complete separation when combined with theE� space. The G� plot reveals that class 7 ganglion cellsseparate on the G vector. The bottom right plot demonstratesthat the large cells are the rarest, small cells are the mostabundant, and all other cells are clustered between. Right foursignature columns, The class signature plots are N-plots,encoding the same five signal pairs (AGB AGB, E�, DQ, G�,fraction-size) for each of 15 classes.
418 J. Neurosci., January 15, 2002, 22(2):413–427 Marc and Jones • Molecular Phenotyping of Retinal Ganglion Cells
Superclass EQ� 3 classes 5, 8, 10, and 11Superclass EQ� represents the high end of a continuum of GABAcontent in ganglion cells. In particular, classes 11 and 12 representhigh and low AMPA response classes of ganglion cell subsets withGABA contents that overlap those of bona fide GABAergicamacrine cells. However, their absolute glutamate, aspartate, andglutamine values place them outside the amacrine cell molecularphenotype. Classes 8 and 10 represent low and high AMPAresponse classes of ganglion cell subsets in which GABA levels donot reach those of amacrine cells but that have much higherGABA signals than any other superclass. Class 5 cells wereoriginally mixed with class 9 cells in superclass EDQ� but wereresolved by deconvolution.
Superclass E 3 class 3Superclass E contains class 3 ganglion cells with negligible GABAsignals, weak DQ signals, and medium AMPA responsivity.
Superclass E� 3 classes 6 and 12Superclass E� contains cells with both low and high GABAcontents, modest DQ signals, and it expresses either high (class 6)or low (class 12) AMPA responsivity.
Superclass E�G 3 class 7This superclass contained only a single population of GABA�and glycine� ganglion cells with medium-strength AMPAresponses.
Superclass � 3 classes dA1, dA2, and dA3This amacrine cell superclass contained three distinctive molec-ular phenotypes. Class dA1 (displaced amacrine cells) is com-posed entirely of the highly AMPA-responsive ON-center star-
Figure 5. Separated patterns of cell classes derived from the registeredarray of seven serial 250 nm sections. Class 1 contains a mixture of cellsizes that are separable by deconvolution into classes 1a, 1b, and 1c. Classpairs 9 and 5 and 10 and 11 were not completely separated by the isodataalgorithm and were resolved by deconvolution of their GABA signals.
Figure 6. Univariate histograms and histogram deconvolution. A, Peaknormalized probability density profiles for glutamate signals in displacedamacrine cells (dotted line) and ganglion cells (solid line). B, Deconvolu-tion of the GABA signal histogram (dotted line) for superclass EDQ� intoGaussian components representing class 5 (EQ�) and class 9 EDQ�ganglion cells (solid lines). C, Deconvolution of the cell size histogram forsuperclass EDQ, class 1 ganglion cells into three components of identicalshape and varying peak height (dotted lines).
Marc and Jones • Molecular Phenotyping of Retinal Ganglion Cells J. Neurosci., January 15, 2002, 22(2):413–427 419
burst amacrine cell cohort and represents 85% of superclass �.The remainder is composed of a class (dA2) with phenotype andsize that resemble starburst amacrine cells but is significantly lessresponsive to AMPA, and class dA3, a very small cell typedisplaying no AMPA response at all. It is possible that class dA2cells are a frequent misplaced variety or true dA1 starburstamacrine cells that, for some reason, have weaker AMPA re-sponses. Class dA3 cells are smaller than any other element andmay not be amacrine cells at all, although they have high GABAcontent. They closely resemble very small cells detected in (andexcluded from) the ganglion cell cohort by Oyster et al. (1981)and would fit in the microneuron category of Wong and Hughes(1987), being much larger than microglia.
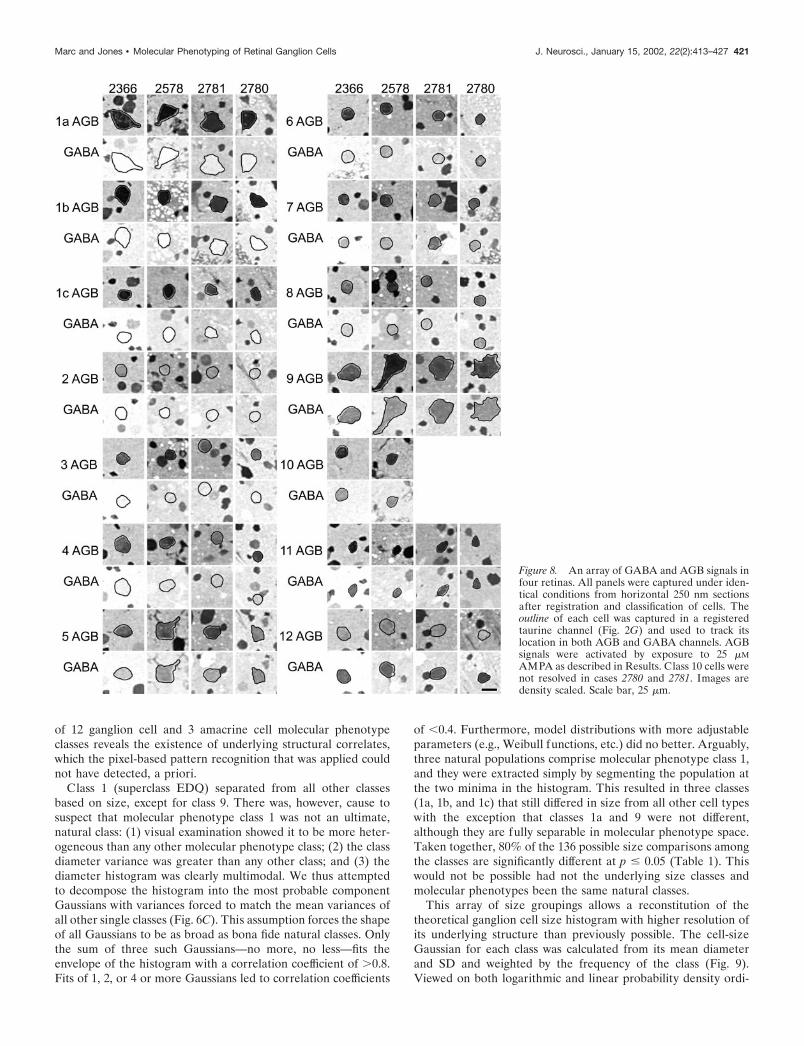
Stability of classesThe superclasses can easily be found in every retina examined,but can all the classes be extracted? AGB mapping is a physio-logical in vitro experiment, and assessment of variability of theAMPA-induced AGB signal across cell types and individualretinas is pivotal in validating classifications. Each preparationmust yield arrays of nearly flawless thin horizontal sections thatcan be precisely registered, are flat enough to provide somehundreds of ganglion cells in a high-resolution field, and behavesimilarly in response to physiological stimulation. Four individualretinas (cases 2366, 2578, 2780, and 2781) were prepared andtreated identically, using 10 min of 25 �M AMPA activation in thepresence 5 mM AGB. All were processed identically as serially
probed 250 nm horizontal sections and analyzed as described inMaterials and Methods. Each represented a locus 2–4 mm belowthe visual streak. Figure 8 displays both GABA and AMPA-activated AGB signals from an example of every cell class fromeach retina. GABA content and AMPA activation are fairlystable across retinas, although there are clear variations in theamount of basal GABA and AGB signals in the Muller cells. Theordinal ranking of AMPA responsivity in ganglion cells classes isconsistent and suggests that AMPA responses are stable underour defined experimental conditions. Two of the retinas yielded14 ganglion cell classes and two yielded 13, the latter lackingdetectable examples of class 10. Examination of five other retinasprepared at different AMPA activation levels revealed one case inwhich class 7 was absent and two more in which class 10 cellscould not be found. We have no obvious explanation for thisexcept that the efficacy of heterologous coupling with amacrinecells may vary. Decreases in glycine coupling would collapse class7 into class 6; a decrease in GABA coupling could disperse class10 into classes 5, 4 or maybe even 3 if glutamine signal changed aswell; increases in GABA coupling would seem less likely, becausecontamination of the small classes 11 and 12 would be noticeable.On the whole, separation into 14 classes in chemical space seemsto most reasonably account for the ganglion cell population. Inevery preparation, some cells appear to be bona fide misplacedamacrine cells, and �2–5% of the small ganglion cells could notbe classified, either because of section defects or disappearancefrom the end of a series, or simply because the signature of asingle cell did not fit a single class well enough. Such cells couldbe damaged cells or true additional classes with sparsedistributions.
Structural correlates of classesDo molecular phenotype classes represent stable natural classes?They do for some other cell types. Horizontal cells (Marc et al.,1995; Marc, 1999b) and starburst amacrine cells (Marc, 1999b)can be extracted via their distinctive signatures, and other celltypes display strong superclasses; e.g., mammalian cone ON-center and OFF-center bipolar cells have distinctive signatures(Kalloniatis et al., 1996). This does not prove that all naturalclasses should have characteristic signatures, even when excitationsignals are added to the data. Independent tests of identity areneeded. The classification methods that we used were blind tosize differences because they were pixel based and not objectbased. Thus size and patterning extracted from the classificationsbecome test statistics.
The mean diameter of every cell in the glutamate channel ofdataset 2366 was determined, and the values for all classes werecompared pair wise [Student’s t test (Table 1); true diametermeasures from single sections are better approximated by themode or supremum, but for spheres randomly sampled, the truediameter � measured mean � shrinkage correction � 4/�]. Themean suffices for tests of distribution differences. Most classeswere significantly different in size from many other classes. Forexample, extraction of molecular phenotype classes 2 and 4 fromsuperclass EQ permits the demonstration that they are also mem-bers of statistically different size groups. Superclass EDQ� wasalso initially contaminated, and deconvolution exposed molecularphenotype classes that are vastly different size groups. The onlygroups that did not completely segregate internally based on sizewere classes within superclasses EQ� and �. Even so, superclass �still separates from all other superclasses in terms of size, andsuperclass EQ� segregated partially. On balance, the extraction
Figure 7. A summary hierarchy of superclasses and classes encoded as ametabolic signature (EDQ signal), a coupling/synthesis signature (� sig-nal), an excitation signature (white � high, horizontal line � medium,black � low), and a size signature (disc diameter).
420 J. Neurosci., January 15, 2002, 22(2):413–427 Marc and Jones • Molecular Phenotyping of Retinal Ganglion Cells
of 12 ganglion cell and 3 amacrine cell molecular phenotypeclasses reveals the existence of underlying structural correlates,which the pixel-based pattern recognition that was applied couldnot have detected, a priori.
Class 1 (superclass EDQ) separated from all other classesbased on size, except for class 9. There was, however, cause tosuspect that molecular phenotype class 1 was not an ultimate,natural class: (1) visual examination showed it to be more heter-ogeneous than any other molecular phenotype class; (2) the classdiameter variance was greater than any other class; and (3) thediameter histogram was clearly multimodal. We thus attemptedto decompose the histogram into the most probable componentGaussians with variances forced to match the mean variances ofall other single classes (Fig. 6C). This assumption forces the shapeof all Gaussians to be as broad as bona fide natural classes. Onlythe sum of three such Gaussians—no more, no less—fits theenvelope of the histogram with a correlation coefficient of �0.8.Fits of 1, 2, or 4 or more Gaussians led to correlation coefficients
of �0.4. Furthermore, model distributions with more adjustableparameters (e.g., Weibull functions, etc.) did no better. Arguably,three natural populations comprise molecular phenotype class 1,and they were extracted simply by segmenting the population atthe two minima in the histogram. This resulted in three classes(1a, 1b, and 1c) that still differed in size from all other cell typeswith the exception that classes 1a and 9 were not different,although they are fully separable in molecular phenotype space.Taken together, 80% of the 136 possible size comparisons amongthe classes are significantly different at p � 0.05 (Table 1). Thiswould not be possible had not the underlying size classes andmolecular phenotypes been the same natural classes.
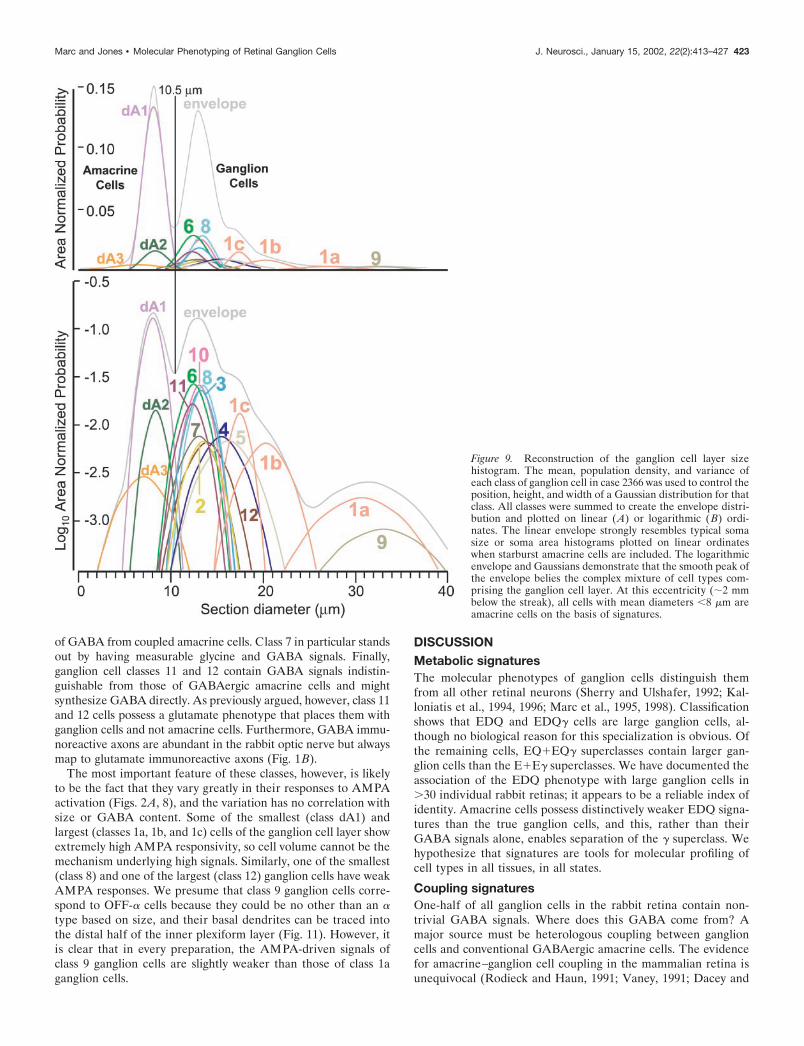
This array of size groupings allows a reconstitution of thetheoretical ganglion cell size histogram with higher resolution ofits underlying structure than previously possible. The cell-sizeGaussian for each class was calculated from its mean diameterand SD and weighted by the frequency of the class (Fig. 9).Viewed on both logarithmic and linear probability density ordi-
Figure 8. An array of GABA and AGB signals infour retinas. All panels were captured under iden-tical conditions from horizontal 250 nm sectionsafter registration and classification of cells. Theoutline of each cell was captured in a registeredtaurine channel (Fig. 2G) and used to track itslocation in both AGB and GABA channels. AGBsignals were activated by exposure to 25 �MAMPA as described in Results. Class 10 cells werenot resolved in cases 2780 and 2781. Images aredensity scaled. Scale bar, 25 �m.
Marc and Jones • Molecular Phenotyping of Retinal Ganglion Cells J. Neurosci., January 15, 2002, 22(2):413–427 421
nates, the envelope of all the individual classes resembles rabbitganglion cell layer density histograms acquired from wholemounts when the displaced amacrine cells are included (Vaney,1980; Tancred, 1981; Vaney et al., 1981; Rowe and Dreher, 1982).Several points emerge from inspection of the histograms. First,amacrine and ganglion cells are separable by size. Second, six cellclasses dominate the shape of the ganglion cell size histogram: 1a,1b, 1c, 3, 6, and 8. All other ganglion cell classes are submergedbeneath the envelope and are undetectable by simple populationcounting and sizing. Third, no deconvolution of the total cell sizehistogram of the ganglion cell layer can extract the correct num-ber of types, regardless of the underlying fundamental shapeschosen.
Molecular phenotyping also uncovers hidden patterning.Quantitative signatures must be extracted from serial thin sec-tions of nearly perfect horizontal orientations, strongly limitingcell numbers. Given that there are so many different classes, anyone class will occur with low frequency, and the number ofsampled cells in one comprehensive data set is usually lower thanpractical for robust tests of patterning. We cannot combine setsfrom other loci or retinas, and each horizontal section array muststand alone. Even so, three classes occurred with high enoughfrequencies in a single patch to test patterning by measuring theCR (also known as the regularity index) and testing significance(Cook, 1996). All three, (classes 3, 6, and dA1) were patternedsignificantly at p � 0.01 (Fig. 10, Table 1). Classes were extractedby signatures alone, so this demonstrates that molecular pheno-typing uncovers patterned classes, which would again be implau-sible were not the underlying elements natural classes. We ex-pected to see better patterning among the remaining classes, butthis is partly a consequence of the limited numbers of cells. If wepresumed that the patterning precision of each class was repli-cated over an area subtending 100 cells of that class, then 10 of 18classes would have been statistically patterned. In addition, somepatterns might represent mixed “subclasses.” For example, weknow that ON-OFF direction-selective (DS) ganglion cells existas four vector subclasses (Oyster and Barlow, 1967) but that they
are not morphologically distinguishable (Amthor et al., 1989b).Any class that contains the ON-OFF DS cells should be repre-sented by a mixture of patterns (a “mixed” pattern). Furthermore,it is not clear that somatic positions of all ganglion cell types mustbe well patterned, because the territory of dendritic coverage isthe critical tiling unit (Wassle et al., 1981), and cells with wide,sparse, asymmetrical dendritic arbors, such as many type “W”ganglion cells, are likely to be tiled with rather asymmetricalDirichlet (Voronoi) domains. In addition, some cells in a singlefunctional class, such as ON DS ganglion cells (ignoring vectorsubtypes), can be immediate neighbors (He and Masland, 1998),which will strongly break any patterning statistics based on so-matic spacings alone. This will again yield mixed patterns.
Finally, the fractions of some cell classes exposed by classifica-tion roughly correspond to previously determined groups. Classes1a and 9 clearly fit within the size group for � ganglion cells(Peichl et al., 1987) alone and are also the rarest of types,comprising but 1–2% of all cells in the ganglion cell layer in allpreparations. Conversely, the well known starburst amacrine cellswere the dominant cell class comprising 20–35% of the ganglioncell layer depending on eccentricity. As pointed out by Hughes(1985), the ganglion cell size spectrum in rabbit is quite unimodal,and the remaining populations are difficult to correlate withknown types.
Attributes of different ganglion cell classes: couplingand excitatory driveClassification allows exploration of important structural andfunctional properties of these cell types. Roughly three domainsof GABA signals can be assigned to ganglion cells (Fig. 7).Classes 1a, 1b, 1c, 2, 3, and 4 have little or no detectable GABAsignals. This is consistent with arguments that certain mammalianganglion cells such as a subset of � cells are not tracer coupled toamacrine cells (Xin and Bloomfield, 1997). A spectrum of classesincluding high population density class 8 cells, large class 9 cells,medium class 5 cells, and small class 10 cells show significantGABA signals, suggesting varying degrees of steady-state leakage
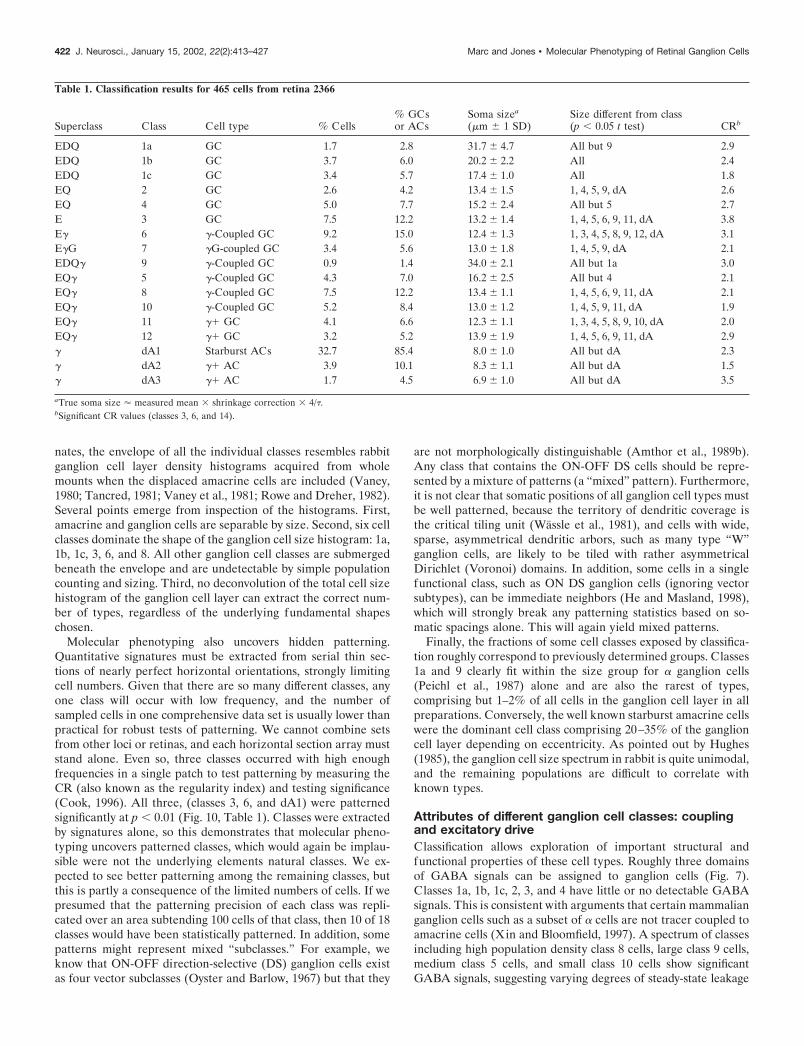
Table 1. Classification results for 465 cells from retina 2366
Superclass Class Cell type % Cells% GCsor ACs
Soma sizea
(�m � 1 SD)Size different from class(p � 0.05 t test) CRb
EDQ 1a GC 1.7 2.8 31.7 � 4.7 All but 9 2.9EDQ 1b GC 3.7 6.0 20.2 � 2.2 All 2.4EDQ 1c GC 3.4 5.7 17.4 � 1.0 All 1.8EQ 2 GC 2.6 4.2 13.4 � 1.5 1, 4, 5, 9, dA 2.6EQ 4 GC 5.0 7.7 15.2 � 2.4 All but 5 2.7E 3 GC 7.5 12.2 13.2 � 1.4 1, 4, 5, 6, 9, 11, dA 3.8E� 6 �-Coupled GC 9.2 15.0 12.4 � 1.3 1, 3, 4, 5, 8, 9, 12, dA 3.1E�G 7 �G-coupled GC 3.4 5.6 13.0 � 1.8 1, 4, 5, 9, dA 2.1EDQ� 9 �-Coupled GC 0.9 1.4 34.0 � 2.1 All but 1a 3.0EQ� 5 �-Coupled GC 4.3 7.0 16.2 � 2.5 All but 4 2.1EQ� 8 �-Coupled GC 7.5 12.2 13.4 � 1.1 1, 4, 5, 6, 9, 11, dA 2.1EQ� 10 �-Coupled GC 5.2 8.4 13.0 � 1.2 1, 4, 5, 9, 11, dA 1.9EQ� 11 �� GC 4.1 6.6 12.3 � 1.1 1, 3, 4, 5, 8, 9, 10, dA 2.0EQ� 12 �� GC 3.2 5.2 13.9 � 1.9 1, 4, 5, 6, 9, 11, dA 2.9� dA1 Starburst ACs 32.7 85.4 8.0 � 1.0 All but dA 2.3� dA2 �� AC 3.9 10.1 8.3 � 1.1 All but dA 1.5� dA3 �� AC 1.7 4.5 6.9 � 1.0 All but dA 3.5
aTrue soma size � measured mean � shrinkage correction � 4/�.bSignificant CR values (classes 3, 6, and 14).
422 J. Neurosci., January 15, 2002, 22(2):413–427 Marc and Jones • Molecular Phenotyping of Retinal Ganglion Cells
of GABA from coupled amacrine cells. Class 7 in particular standsout by having measurable glycine and GABA signals. Finally,ganglion cell classes 11 and 12 contain GABA signals indistin-guishable from those of GABAergic amacrine cells and mightsynthesize GABA directly. As previously argued, however, class 11and 12 cells possess a glutamate phenotype that places them withganglion cells and not amacrine cells. Furthermore, GABA immu-noreactive axons are abundant in the rabbit optic nerve but alwaysmap to glutamate immunoreactive axons (Fig. 1B).
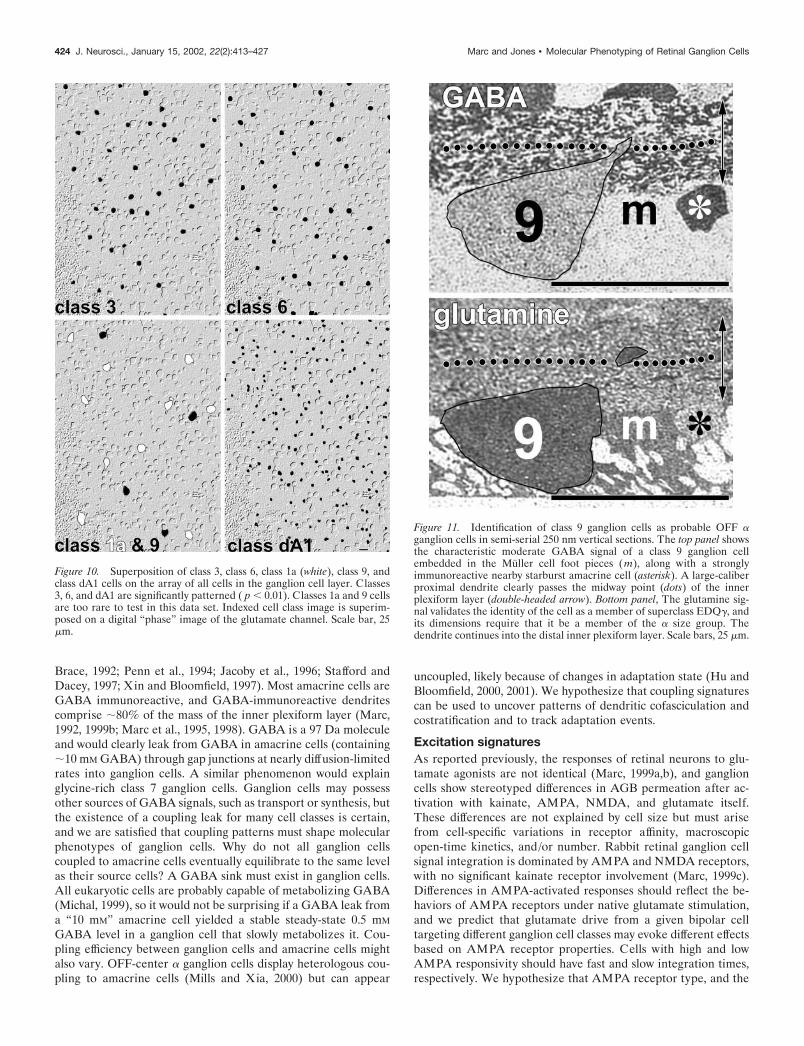
The most important feature of these classes, however, is likelyto be the fact that they vary greatly in their responses to AMPAactivation (Figs. 2A, 8), and the variation has no correlation withsize or GABA content. Some of the smallest (class dA1) andlargest (classes 1a, 1b, and 1c) cells of the ganglion cell layer showextremely high AMPA responsivity, so cell volume cannot be themechanism underlying high signals. Similarly, one of the smallest(class 8) and one of the largest (class 12) ganglion cells have weakAMPA responses. We presume that class 9 ganglion cells corre-spond to OFF-� cells because they could be no other than an �type based on size, and their basal dendrites can be traced intothe distal half of the inner plexiform layer (Fig. 11). However, itis clear that in every preparation, the AMPA-driven signals ofclass 9 ganglion cells are slightly weaker than those of class 1aganglion cells.
DISCUSSIONMetabolic signaturesThe molecular phenotypes of ganglion cells distinguish themfrom all other retinal neurons (Sherry and Ulshafer, 1992; Kal-loniatis et al., 1994, 1996; Marc et al., 1995, 1998). Classificationshows that EDQ and EDQ� cells are large ganglion cells, al-though no biological reason for this specialization is obvious. Ofthe remaining cells, EQ�EQ� superclasses contain larger gan-glion cells than the E�E� superclasses. We have documented theassociation of the EDQ phenotype with large ganglion cells in�30 individual rabbit retinas; it appears to be a reliable index ofidentity. Amacrine cells possess distinctively weaker EDQ signa-tures than the true ganglion cells, and this, rather than theirGABA signals alone, enables separation of the � superclass. Wehypothesize that signatures are tools for molecular profiling ofcell types in all tissues, in all states.
Coupling signaturesOne-half of all ganglion cells in the rabbit retina contain non-trivial GABA signals. Where does this GABA come from? Amajor source must be heterologous coupling between ganglioncells and conventional GABAergic amacrine cells. The evidencefor amacrine–ganglion cell coupling in the mammalian retina isunequivocal (Rodieck and Haun, 1991; Vaney, 1991; Dacey and
Figure 9. Reconstruction of the ganglion cell layer sizehistogram. The mean, population density, and variance ofeach class of ganglion cell in case 2366 was used to control theposition, height, and width of a Gaussian distribution for thatclass. All classes were summed to create the envelope distri-bution and plotted on linear (A) or logarithmic (B) ordi-nates. The linear envelope strongly resembles typical somasize or soma area histograms plotted on linear ordinateswhen starburst amacrine cells are included. The logarithmicenvelope and Gaussians demonstrate that the smooth peak ofthe envelope belies the complex mixture of cell types com-prising the ganglion cell layer. At this eccentricity (�2 mmbelow the streak), all cells with mean diameters �8 �m areamacrine cells on the basis of signatures.
Marc and Jones • Molecular Phenotyping of Retinal Ganglion Cells J. Neurosci., January 15, 2002, 22(2):413–427 423
Brace, 1992; Penn et al., 1994; Jacoby et al., 1996; Stafford andDacey, 1997; Xin and Bloomfield, 1997). Most amacrine cells areGABA immunoreactive, and GABA-immunoreactive dendritescomprise �80% of the mass of the inner plexiform layer (Marc,1992, 1999b; Marc et al., 1995, 1998). GABA is a 97 Da moleculeand would clearly leak from GABA in amacrine cells (containing�10 mM GABA) through gap junctions at nearly diffusion-limitedrates into ganglion cells. A similar phenomenon would explainglycine-rich class 7 ganglion cells. Ganglion cells may possessother sources of GABA signals, such as transport or synthesis, butthe existence of a coupling leak for many cell classes is certain,and we are satisfied that coupling patterns must shape molecularphenotypes of ganglion cells. Why do not all ganglion cellscoupled to amacrine cells eventually equilibrate to the same levelas their source cells? A GABA sink must exist in ganglion cells.All eukaryotic cells are probably capable of metabolizing GABA(Michal, 1999), so it would not be surprising if a GABA leak froma “10 mM” amacrine cell yielded a stable steady-state 0.5 mM
GABA level in a ganglion cell that slowly metabolizes it. Cou-pling efficiency between ganglion cells and amacrine cells mightalso vary. OFF-center � ganglion cells display heterologous cou-pling to amacrine cells (Mills and Xia, 2000) but can appear
uncoupled, likely because of changes in adaptation state (Hu andBloomfield, 2000, 2001). We hypothesize that coupling signaturescan be used to uncover patterns of dendritic cofasciculation andcostratification and to track adaptation events.
Excitation signaturesAs reported previously, the responses of retinal neurons to glu-tamate agonists are not identical (Marc, 1999a,b), and ganglioncells show stereotyped differences in AGB permeation after ac-tivation with kainate, AMPA, NMDA, and glutamate itself.These differences are not explained by cell size but must arisefrom cell-specific variations in receptor affinity, macroscopicopen-time kinetics, and/or number. Rabbit retinal ganglion cellsignal integration is dominated by AMPA and NMDA receptors,with no significant kainate receptor involvement (Marc, 1999c).Differences in AMPA-activated responses should reflect the be-haviors of AMPA receptors under native glutamate stimulation,and we predict that glutamate drive from a given bipolar celltargeting different ganglion cell classes may evoke different effectsbased on AMPA receptor properties. Cells with high and lowAMPA responsivity should have fast and slow integration times,respectively. We hypothesize that AMPA receptor type, and the
Figure 10. Superposition of class 3, class 6, class 1a (white), class 9, andclass dA1 cells on the array of all cells in the ganglion cell layer. Classes3, 6, and dA1 are significantly patterned ( p � 0.01). Classes 1a and 9 cellsare too rare to test in this data set. Indexed cell class image is superim-posed on a digital “phase” image of the glutamate channel. Scale bar, 25�m.
Figure 11. Identification of class 9 ganglion cells as probable OFF �ganglion cells in semi-serial 250 nm vertical sections. The top panel showsthe characteristic moderate GABA signal of a class 9 ganglion cellembedded in the Muller cell foot pieces (m), along with a stronglyimmunoreactive nearby starburst amacrine cell (asterisk). A large-caliberproximal dendrite clearly passes the midway point (dots) of the innerplexiform layer (double-headed arrow). Bottom panel, The glutamine sig-nal validates the identity of the cell as a member of superclass EDQ�, andits dimensions require that it be a member of the � size group. Thedendrite continues into the distal inner plexiform layer. Scale bars, 25 �m.
424 J. Neurosci., January 15, 2002, 22(2):413–427 Marc and Jones • Molecular Phenotyping of Retinal Ganglion Cells
absence or presence of GluR2-edited subunits in particular, maycontrol the brisk–sluggish spectrum of ganglion cell responses.
Correlation with physiological classesThe apparent numbers of molecular phenotype classes and phys-iological classes in rabbit are similar (Oyster et al., 1971; Amthoret al., 1989a,b,). Given data on coupling patterns (Xin andBloomfield, 1997; Mills and Xia, 2000; Hu and Bloomfield, 2001),the tabulation of morphologies of physiological classes (Amthoret al., 1989a,b), encounter frequencies (Oyster et al., 1971), andsoma size histograms (Provis, 1979; Vaney, 1980; Oyster et al.,1981; Vaney et al., 1981), we can construct provisional matchesbetween physiological and molecular phenotype classes (Table 2).We have made the matches as specific as possible and offer themas a target for argument and experiment.
Concentric brisk nonlinear transient cellsClasses 1a and 9 are the � ganglion cells of the rabbit retina(Peichl et al., 1987). Considering dye-coupling patterns (Mills andXia, 2000; Hu and Bloomfield, 2001) and our tracing of dendrites(Fig. 11), class 1a cells are ON-center and class 9 cells areOFF-center, corresponding directly to the concentric brisk non-linear transient cells of Amthor et al. (1989a) and the Y cells ofcarnivores.
Concentric brisk linear sustained cellsA presumed X-like, �-like class is one of the complex problems inrabbit retina. Rabbit � homologs have small somas (Amthor et al.,1989a), excluding candidate classes 1b and 1c. Brisk sustainedcells are a common cell type (Levick, 1967; Oyster et al., 1971;Amthor et al., 1989a) and should have good AMPA responses.The well patterned, frequent small cells of classes 3 and 6 seemthe best candidates. There are conceptual problems: class 6 is �coupled, whereas ferret � ganglion cells (Penn et al., 1994) and
primate midget ganglion cells (Dacey and Brace, 1992) show noamacrine cell coupling. At present, we ignore this conflict. Byanalogy with coupling patterns of ON and OFF � cells, wepropose class 3 as the ON-center and class 6 as the OFF-centerclasses.
Concentric brisk linear transient cellsAmthor et al. (1989a) distinguished these medium-sized cellsfrom � cells with caveats. Equating briskness and high AMPAresponsivity, the best matches are classes 1b (ON) and 5 (OFF).
Concentric sluggish cellsEquating sluggishness with low AMPA responsivity and match-ing sizes and encounter rates, the small sustained sluggish cellscould be members of class 2 or 8. The patterning of class 8suggests that the population could be mixed and may contain bothON and OFF varieties. Transient sluggish cells are of mediumsize, matching best with class 12 ganglion cells.
ON-OFF DS cellsThe ON-OFF DS cell class harbors four vector types (Oyster andBarlow, 1967) and lies in the small-to-medium soma size spec-trum (Amthor et al., 1989b). Because vector type might display awell patterned distribution (Vaney, 1994b) and a single classcontains two or more vector types, that class might show mixeddistribution patterns. Some ON-OFF DS cells are coupled toamacrine cells and others are not (Vaney, 1994a,b; Xin andBloomfield, 1997). We match small–medium class 10 andmedium-sized 1b cells as the coupled and uncoupled sets ofON-OFF DS cells.
ON DS cellsThe vector types of ON DS cells project to the medial terminalnucleus of the rabbit accessory optic system and are medium–
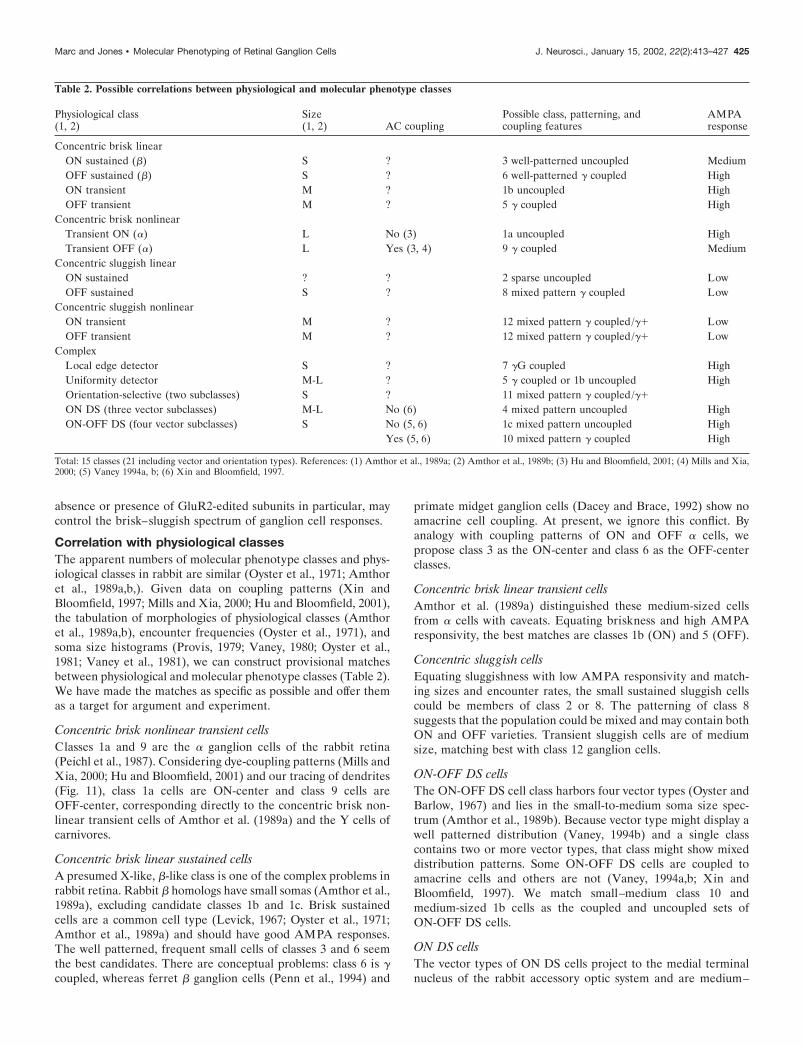
Table 2. Possible correlations between physiological and molecular phenotype classes
Physiological class(1, 2)
Size(1, 2) AC coupling
Possible class, patterning, andcoupling features
AMPAresponse
Concentric brisk linearON sustained (�) S ? 3 well-patterned uncoupled MediumOFF sustained (�) S ? 6 well-patterned � coupled HighON transient M ? 1b uncoupled HighOFF transient M ? 5 � coupled High
Concentric brisk nonlinearTransient ON (�) L No (3) 1a uncoupled HighTransient OFF (�) L Yes (3, 4) 9 � coupled Medium
Concentric sluggish linearON sustained ? ? 2 sparse uncoupled LowOFF sustained S ? 8 mixed pattern � coupled Low
Concentric sluggish nonlinearON transient M ? 12 mixed pattern � coupled/�� LowOFF transient M ? 12 mixed pattern � coupled/�� Low
ComplexLocal edge detector S ? 7 �G coupled HighUniformity detector M-L ? 5 � coupled or 1b uncoupled HighOrientation-selective (two subclasses) S ? 11 mixed pattern � coupled/��
ON DS (three vector subclasses) M-L No (6) 4 mixed pattern uncoupled HighON-OFF DS (four vector subclasses) S No (5, 6) 1c mixed pattern uncoupled High
Yes (5, 6) 10 mixed pattern � coupled High
Total: 15 classes (21 including vector and orientation types). References: (1) Amthor et al., 1989a; (2) Amthor et al., 1989b; (3) Hu and Bloomfield, 2001; (4) Mills and Xia,2000; (5) Vaney 1994a, b; (6) Xin and Bloomfield, 1997.
Marc and Jones • Molecular Phenotyping of Retinal Ganglion Cells J. Neurosci., January 15, 2002, 22(2):413–427 425
large ganglion cells (Oyster et al., 1981). Xin and Bloomfield(1997) suggest that this cell is not coupled. Class 4 seems the bestfit for ON DS ganglion cells.
Orientation-selective cellsThese cells, with two orientation-preference subclasses, areamong the smallest cells in soma size (Amthor et al., 1989b). Ofall the small cells, they appear to have the most elongate, poly-gonal somas, corresponding well to the mixed-pattern, �-coupledclass 11 ganglion cells.
Local edge detector cellsWith complex physiologies and small somas, local edge detector(LED) cells also have small, compact dendritic arbors. Xin andBloomfield (1997) illustrated small “narrow field” cells much likeLED cells injected by Amthor et al. (1989b), and they wereclearly coupled to amacrine cells. The only remaining group thatseems to fit is class 7, but Xin and Bloomfield (1997) speculatedthat the cell was coupled only to a single type of amacrine cell,and class 7 is apparently both � and G coupled. Furthermore, if allganglion cells have coverage factors of at least 1, the class 7distribution (Fig. 2D) does not suffice. LED cells are reported tocomprise nearly 19% of the cells in the streak, although this valueappears to drop to �2% in the periphery (Oyster et al., 1971).LED cells may be embedded in another class. The match of class7 cells is quite uncertain.
Uniformity detectorsA rare, medium-to-large cell, inhibited by any stimulus, unifor-mity detectors do not nicely fit anywhere. The size match corre-sponds to classes 5 and 1b.
Other cellsThere is room for more functional–morphological classes as longas they each comprise �1 or 2% of the cohort.
SummaryRabbit retinal ganglion cells contain mixtures of free small mol-ecules that, when combined with additional excitation markers,allow specification of a molecular phenotype for each cell and acomprehensive classification of the entire layer. The classificationappears robust and serves, we believe, as (1) a step towardcompleteness in describing this population of visual neurons and(2) a bridge for unification of physiological and morphologicalclassifications.
REFERENCESAmes A III, Nesbett FB (1981) In vitro retina as an experimental model
of the central nervous system. J Neurochem 37:867–877.Amthor FR, Takahashi ES, Oyster CW (1989a) Morphologies of rabbit
retinal ganglion cells with concentric receptive fields. J Comp Neurol280:72–96.
Amthor FR, Takahashi ES, Oyster CW (1989b) Morphologies of rabbitretinal ganglion cells with complex receptive fields. J Comp Neurol280:97–121.
Ball GB, Hall DJ (1967) Clustering technique for summarizing multi-variate data. Behav Sci 12:153–155.
Brandon C, Criswell MH (1995) Displaced starburst amacrine cells ofthe rabbit retina contain the 67-kDa isoform, but not the 65-kDaisoform, of glutamate decarboxylase. Vis Neurosci 12:1053–1061.
Cook JE (1996) Spatial properties of retinal mosaics: an empirical eval-uation of some existing measures. Vis Neurosci 13:15–30.
Cook JE (1998) Getting to grips with neuronal diversity: what is aneuronal type? In: Development and organization of the retina (Cha-lupa L, Finlay B, eds), pp 91–120. New York: Plenum.
Dacey DM, Brace S (1992) A coupled network for parasol but notmidget ganglion cells in the primate retina. Vis Neurosci 9:279–290.
Famiglietti EV (1992) New metrics for analysis of dendritic branchingpatterns demonstrating similarities and differences in ON and ON-OFF
directionally selective retinal ganglion cells. J Comp Neurol324:295–321.
Farmer SG, Rodieck RW (1982) Ganglion cells of the cat accessory opticsystem: morphology and retinal topography. J Comp Neurol205:190–198.
Fukuda Y, Stone J (1974) Retinal distribution and central projections ofY-, X- and W-cells of the cat’s retina. J Neurophysiol 37:749–772.
He S, Masland RH (1998) ON direction-selective ganglion cells in therabbit retina: dendritic morphology and pattern of fasciculation. VisNeurosci 15:369–375.
Holden AL (1981) Classifying and comparing retinal ganglion cells.Brain Behav Evol 18:188–193.
Hu EH, Bloomfield SA (2000) Modulation of the tracer coupling patternof �-ganglion cells in the rabbit retina. Invest Ophthalmol Vis Sci41:S936.
Hu EH, Bloomfield SA (2001) Comparison of the tracer coupling pat-tern and correlated activity of �-ganglion cells in the rabbit retina.Invest Ophthalmol Vis Sci 42:S677.
Hughes A (1979) A rose by any other name: on naming of neurones byRowe and Stone. Brain Behav Evol 16:52–64.
Hughes A (1985) New perspectives in retinal organization. Prog RetinalRes 4:243–313.
Inselberg A, Dimsdale B (1990) Parallel coordinates: a tool for visual-izing multi-dimensional geometry. Proc 1st IEEE Conf Visualization1:361–375.
Jacoby R, Stafford D, Kouyama N, Marshak D (1996) Synaptic inputs toON parasol ganglion cells in the primate retina. J Neurosci 16:8041–8056.
Johnson J, Chen TK, Rickman DW, Evans C, Brecha N (1996) Multiple�-aminobutyric acid plasma membrane transporters (GAT-1, GAT-2,GAT-3) in the rat retina. J Comp Neurol 375:212–224.
Kalloniatis M, Fletcher E (1993) Immunocytochemical localization ofamino acid neurotransmitters in the chicken retina. J Comp Neurol336:174–193.
Kalloniatis M, Tomisich G, Marc RE (1994) Neurochemical signaturesrevealed by glutamine labeling in the chicken retina. Vis Neurosci11:793–804.
Kalloniatis M, Marc RE, Murry RF (1996) Amino acid signatures in theprimate retina. J Neurosci 16:6807–6829.
Leventhal AG, Rodieck RW, Dreher B (1985) Central projections of catretinal ganglion cells. J Neurophysiol 237:216–226.
Levick WR (1967) Receptive fields and trigger features of ganglion cellsin the visual streak of the rabbit’s retina. J Physiol (Lond) 188:285–307.
Marc RE (1992) The structure of GABAergic circuits in ectothermretinas. In: GABA in the retina and central visual system (Mize R,Marc RE, Sillito A, eds), pp 61–92. Amsterdam: Elsevier.
Marc RE (1999a) Mapping glutamatergic drive in the vertebrate retinawith a channel-permeant organic cation. J Comp Neurol 407:47–64.
Marc RE (1999b) Kainate activation of horizontal, bipolar, amacrineand ganglion cells in the rabbit retina. J Comp Neurol 407:65–76.
Marc RE (1999c) Subtypes of OFF-center bipolar cells possess differentionotropic glutamate receptor channel properties. Invest OphthalmolVis Sci 40:S790.
Marc RE, Liu WLS, Kalloniatis M, Raiguel S, Van Haesendonck E(1990) Patterns of glutamate immunoreactivity in the goldfish retina.J Neurosci 10:4006–4034.
Marc RE, Basinger SF, Murry RF (1995) Pattern recognition of aminoacid signatures in retinal neurons. J Neurosci 15:5106–5129.
Marc RE, Murry R, Fisher SK, Linberg K, Lewis G, Kalloniatis M(1998) Amino acid signatures in the normal cat retina. Invest Ophthal-mol Vis Sci 39:1685–1693.
Masland RH, Raviola E (2000) Confronting complexity: strategies forunderstanding the microcircuitry of the retina. Annu Rev Neurosci23:249–284.
Michal G (1999) Amino acids and derivatives. In: Biochemical pathways(Michal G, ed), pp 46–67. New York: Wiley.
Mills SL, Xia XB (2000) The kinetics of tracer coupling between OFF �ganglion cells in the rabbit retina. Invest Ophthalmol Vis Sci 41:s936.
Narendra PM, Goldberg M (1977) A non-parametric clustering schemefor Landsat. Pattern Recogn 9:207–215.
Oyster CW, Barlow HB (1967) Direction-selective units in rabbit retina:distribution of preferred directions. Science 155:841–842.
Oyster CW, Takahashi E, Levick WR (1971) Information processing inthe rabbit visual system. Doc Ophthalmol 30:162–204.
Oyster CW, Takahashi ES, Hurst DC (1981) Density, soma size, andregional distribution of rabbit retinal ganglion cells. J Neurosci1:1331–1346.
Peichl L, Buhl EH, Boycott BB (1987) Alpha ganglion cells in the rabbitretina. J Comp Neurol 263:25–41.
Penn AA, Wong ROL, Shatz CJ (1994) Neuronal coupling in the devel-oping mammalian retina. J Neurosci 14:3805–3815.
Provis JM (1979) The distribution and size of ganglion cells in the retinaof the pigmented rabbit: a quantitative analysis. J Comp Neurol185:121–137.
Pu M, Berson DM, Pan T (1994) Structure and function of retinal
426 J. Neurosci., January 15, 2002, 22(2):413–427 Marc and Jones • Molecular Phenotyping of Retinal Ganglion Cells
ganglion cells innervating the cat’s geniculate wing: an in vitro study.J Neurosci 14:4338–4358.
Rodieck RW (1998) The first steps in seeing. Sunderland, MA: Sinauer.Rodieck RW, Brening RK (1982) On classifying retinal ganglion cells by
numerical methods. Brain Behav Evol 21:42–46.Rodieck RW, Haun TJ (1991) Parasol retinal ganglion cells in macaques
connect intracellularly to other parasol ganglion cells, and to amacrinecells found in the ganglion cell layer. Soc Neurosci Abstr 17:1375.
Rodieck RW, Watanabe M (1993) Survey of the morphology of macaqueretinal ganglion cells that project to the pretectum, superior colliculus,and parvicellular laminae of the lateral geniculate nucleus. J CompNeurol 338:289–303.
Rowe MH, Dreher B (1982) Retinal W-cell projections to the medialinterlaminar nucleus in the cat: implications for ganglion cell classifi-cation. J Comp Neurol 204:117.
Rowe MH, Stone J (1977) Naming of neurones: classification and nam-ing of cat retinal ganglion cells. Brain Behav Evol 14:185–216.
Sherry DM, Ulshafer RJ (1992) Neurotransmitter-specific identificationand characterization of neurons in the all-cone retina of Anolis caroli-nesis. II. Glutamate and aspartate. Vis Neurosci 9:313–323.
Stafford DK, Dacey DM (1997) Physiology of the A1 amacrine: a spik-ing, axon-bearing interneuron of the macaque monkey retina. VisNeurosci 14:507–522.
Stell WK, Lightfoot DO (1975) Color-specific interconnections of conesand horizontal cells in the retina of the goldfish. J Comp Neurol159:473–502.
Swain PH, Davis SM (1978) Remote sensing: a quantitative approach.New York: McGraw-Hill.
Tancred E (1981) The distribution and sizes of ganglion cells in theretinas of five Australian marsupials. J Comp Neurol 196:585–603.
Vaney DI (1980) A quantitative comparison between the ganglion cellpopulations and axonal outflows of the visual streak and periphery ofthe rabbit retina. J Comp Neurol 189:215–233.
Vaney, DI (1991) Many diverse types of retinal neurons show tracercoupling when injected with biocytin or Neurobiotin. Neurosci Lett125:187–190.
Vaney DI (1994a) Patterns of neuronal coupling in the retina. ProgRetinal Eye Res 13:301–355.
Vaney DI (1994b) Territorial organization of direction-selective gan-glion cells in rabbit retina. J Neurosci 14:6301–6316.
Vaney DI, Peichl L, Boycott BB (1981) Matching populations of ama-crine cells in the inner nuclear and ganglion cell layers of the rabbitretina. J Comp Neurol 199:373–391.
Wassle H, Peichl L, Boycott BB (1981) Dendritic territories of cat retinalganglion cells. Nature 292:344–345.
Wingate RJT, Fitzgibbon T, Thompson ID (1992) Lucifer yellow, ret-rograde tracers and fractal analysis characterize adult ferret retinalganglion cells. J Comp Neurol 323:449–474.
Wong ROL, Hughes A (1987) Developing neuronal populations of thecat retinal ganglion cell layer. J Comp Neurol 262:473–495.
Xin D, Bloomfield SA (1997) Tracer coupling pattern of amacrine andganglion cells in the rabbit retina. J Comp Neurol 383:512–528.
Marc and Jones • Molecular Phenotyping of Retinal Ganglion Cells J. Neurosci., January 15, 2002, 22(2):413–427 427
Related Documents


