ORIGINAL ARTICLE Reproductive biology Molecular pathways reflecting poor intrauterine growth are found in Wharton’s jelly-derived mesenchymal stem cells Rami Sukarieh 1,† , Roy Joseph 1,† , Shi Chi Leow 1 , Ying Li 2 , Mona Lo ¨ ffler 1 , Izzuddin M. Aris 3 , Jun Hao Tan 1 , Ai Ling Teh 1 , Li Chen 1 , Joanna D. Holbrook 1 , Kai Lyn Ng 4 , Yung Seng Lee 1,3 , Yap Seng Chong 1,4 , Scott A. Summers 2 , Peter D. Gluckman 1,5 , and Walter Stu ¨ nkel 1, * 1 Singapore Institute for Clinical Sciences, Agency for Science Technology and Research (A*STAR), Singapore, Singapore 2 Program in Cardiovascular and Metabolic Disorders, Duke-NUS Graduate Medical School, Singapore, Singapore 3 Department of Paediatrics, Yong Loo Lin School of Medicine, National University of Singapore, Singapore, Singapore 4 Department of Obstetrics and Gynaecology, Yong Loo Lin School of Medicine, National University of Singapore, Singapore, Singapore 5 Liggins Institute, University of Auckland, Auckland, New Zealand *Correspondence address: Brenner Centre for Molecular Medicine, 30 Medical Drive, Singapore 117609, Singapore. Tel: +65-64070689; Fax: +65-67766840; E-mail: [email protected] Submitted on April 2, 2014; resubmitted on June 12, 2014; accepted on July 11, 2014 study question: Are molecular pathways reflecting the biology of small for gestational age (SGA) neonates preserved in umbilical cord- derived mesenchymal stem cells (MSCs)? summary answer: MSCs from SGA newborns were found to express an altered EGR-1-dependent gene network involved in the regulation of cell proliferation and oxidative stress. what is known already: Individuals with suboptimal intrauterine development are at greater risk of metabolic diseases such as type II diabetes, obesity and cardiovascular disease. study design, size, duration: Umbilical cords (n ¼ 283) from the GUSTO (growing up in Singapore towards healthy outcomes) birth cohort study, and primary MSC isolates established from SGA and matched control cases (n ¼ 6 per group), were subjected to gene expression analysis and candidate genes were studied for functional validation. participants/materials, setting, methods: Umbilical cord specimens were derived from babies born at the National Uni- versity Hospital (NUH) in Singapore. Local ethical approval was obtained. MSC isolates were established in Wharton’s jelly and molecular analysis was conducted by gene expression microarrays and RT –PCR. Cells from SGA and control groups were compared in the presence and absence of insulin and candidate gene function was studied via siRNA-mediated gene knockdown and over-expression experiments in MSCs. main results and the role of chance: Using repeated measure ANOVAs, proliferation rates of MSCs isolated from SGA neo- nates were found to be significantly increased (P , 0.01). In the absence of insulin, EGR-1 levels were found to be significantly reduced in the group of SGA-derived MSCs, whereas EGR-1 expression was found to be up-regulated in the same group in the presence of insulin (P , 0.01). EGR-1 was found to induce expression of COX-2 in the SGA group (P , 0.01) and both, EGR-1 and COX-2 stimulated glucose uptake in MSCs (P , 0.01). EGR-1 and COX-2 levels were associated in whole umbilical cords (n ¼ 283, P , 0.01) and EGR-1 positively correlated with abdom- inal circumference and birthweight (n ¼ 91, P , 0.01 and n ¼ 91, P , 0.01). limitations, reasons for caution: Cell models may not entirely reflect the physiology of the host and patient follow-up studies will be necessary for further clinical validation. wider implications of the findings: Our study suggests that Wharton’s jelly-derived MSCs are useful in identifying pathways specific for fetal growth restriction. † R.S. and R.J. contributed equally to this work. & The Author 2014. Published by Oxford University Press on behalf of the European Society of Human Reproduction and Embryology. All rights reserved. For Permissions, please email: [email protected] Human Reproduction, Vol.29, No.10 pp. 2287– 2301, 2014 Advanced Access publication on August 16, 2014 doi:10.1093/humrep/deu209 by guest on June 15, 2016 http://humrep.oxfordjournals.org/ Downloaded from

Welcome message from author
This document is posted to help you gain knowledge. Please leave a comment to let me know what you think about it! Share it to your friends and learn new things together.
Transcript
ORIGINAL ARTICLE Reproductive biology
Molecular pathways reflecting poorintrauterine growth are found inWharton’s jelly-derived mesenchymalstem cellsRami Sukarieh1,†, Roy Joseph1,†, Shi Chi Leow1, Ying Li2, Mona Loffler1,Izzuddin M. Aris3, Jun Hao Tan1, Ai Ling Teh1, Li Chen1,Joanna D. Holbrook1, Kai Lyn Ng4, Yung Seng Lee1,3, Yap Seng Chong1,4,Scott A. Summers2, Peter D. Gluckman1,5, and Walter Stunkel1,*1Singapore Institute for Clinical Sciences, Agency for Science Technology and Research (A*STAR), Singapore, Singapore 2Program inCardiovascular and Metabolic Disorders, Duke-NUS Graduate Medical School, Singapore, Singapore 3Department of Paediatrics, Yong Loo LinSchool of Medicine, National University of Singapore, Singapore, Singapore 4Department of Obstetrics and Gynaecology, Yong Loo Lin School ofMedicine, National University of Singapore, Singapore, Singapore 5Liggins Institute, University of Auckland, Auckland, New Zealand
*Correspondence address: Brenner Centre for Molecular Medicine, 30 Medical Drive, Singapore 117609, Singapore. Tel: +65-64070689;Fax: +65-67766840; E-mail: [email protected]
Submitted on April 2, 2014; resubmitted on June 12, 2014; accepted on July 11, 2014
study question: Are molecular pathways reflecting the biology of small for gestational age (SGA) neonates preserved in umbilical cord-derived mesenchymal stem cells (MSCs)?
summary answer: MSCs from SGA newborns were found to express an altered EGR-1-dependent gene network involved in theregulation of cell proliferation and oxidative stress.
what is known already: Individuals with suboptimal intrauterine development are at greater risk of metabolic diseases such as type IIdiabetes, obesity and cardiovascular disease.
study design, size, duration: Umbilical cords (n ¼ 283) from the GUSTO (growing up in Singapore towards healthy outcomes)birth cohort study, and primary MSC isolates established from SGA and matched control cases (n ¼ 6 per group), were subjected to geneexpression analysis and candidate genes were studied for functional validation.
participants/materials, setting, methods: Umbilical cord specimens were derived from babies born at the National Uni-versity Hospital (NUH) in Singapore. Local ethical approval was obtained. MSC isolates were established in Wharton’s jelly and molecular analysiswas conducted by gene expression microarrays and RT–PCR. Cells from SGA and control groups were compared in the presence and absence ofinsulin and candidate gene function was studied via siRNA-mediated gene knockdown and over-expression experiments in MSCs.
main results and the role of chance: Using repeated measure ANOVAs, proliferation rates of MSCs isolated from SGA neo-nates were found to be significantly increased (P , 0.01). In the absence of insulin, EGR-1 levels were found to be significantly reduced in the groupof SGA-derived MSCs, whereas EGR-1 expression was found to be up-regulated in the same group in the presence of insulin (P , 0.01). EGR-1was found to induce expression of COX-2 in the SGA group (P , 0.01) and both, EGR-1 and COX-2 stimulated glucose uptake in MSCs(P , 0.01). EGR-1 and COX-2 levels were associated in whole umbilical cords (n ¼ 283, P , 0.01) and EGR-1 positively correlated with abdom-inal circumference and birthweight (n ¼ 91, P , 0.01 and n ¼ 91, P , 0.01).
limitations, reasons for caution: Cell models may not entirely reflect the physiology of the host and patient follow-up studieswill be necessary for further clinical validation.
wider implications of the findings: Our study suggests that Wharton’s jelly-derived MSCs are useful in identifying pathwaysspecific for fetal growth restriction.
† R.S. and R.J. contributed equally to this work.
& The Author 2014. Published by Oxford University Press on behalf of the European Society of Human Reproduction and Embryology. All rights reserved.For Permissions, please email: [email protected]
Human Reproduction, Vol.29, No.10 pp. 2287–2301, 2014
Advanced Access publication on August 16, 2014 doi:10.1093/humrep/deu209
by guest on June 15, 2016http://hum
rep.oxfordjournals.org/D
ownloaded from
study funding/competing interest(s): This work is supported by the Translational Clinical Research (TCR) Flagship Programon Developmental Pathways to Metabolic Disease funded by the National Research Foundation (NRF) and administered by the National MedicalResearch Council (NMRC), Singapore- NMRC/TCR/004-NUS/2008’. SICS Investigators are supported through the Agency for ScienceTechnology and Research (A*STAR) funding. No potential conflicts of interest relevant to this article were reported.
Key words: stem cells / gene expression / insulin
IntroductionIt is well established that suboptimal intrauterine experiences influencethe risk of developing type 2 diabetes mellitus, cardiovascular diseaseand obesity in later life: a phenomenon sometimes called developmentalprogramming and encapsulated within the developmental origins ofhealth and disease (DOHaD) paradigm (Hanson and Gluckman, 2011;Tarry-Adkins and Ozanne, 2011). Earlier studies have focused on birth-weight (BW)–disease risk relationships (Barker, 1994, 1997), and morerecently it has become clear that developmental programming can be in-dependent of fetal growth impairment (Roseboom et al., 2000; Godfreyet al., 2011). Current concepts of DOHaD suggest that fetal growth re-striction is an immediate response of the fetus to limiting conditions par-ticularly in the supply of nutrients and oxygen, whereas the longer termresponse is an epigenetically mediated developmentally plastic responseto more subtle intrauterine cues (Gluckman et al., 2011; Hanson et al.,2011; Low et al., 2011). In the absence of good biomarkers for develop-mental induction of programming, the study of the growth-restrictedinfants remains the dominant approach to study developmental pro-gramming in humans. This study was designed to explore whetherstem cells taken from the umbilical cord may be a useful tissue to over-come the obvious constraints and in particular to indicate a directionfor research into the mechanism of the development of insulin resistancewhich, although primed before birth, does not develop until later afterbirth (Mericq et al., 2005).
Small for gestational age (SGA) neonates are very insulin sensitive andindeed can have much higher glucose requirements than normal sizedinfants (Gentz et al., 1969). But limited data suggest that it is only at theage of expected weaning that insulin resistance develops (Bazaes et al.,2003; Mericq et al., 2005). It may be that this early insulin sensitivityassists in promoting adiposity once the child is born and fed on high fatmilk (Kuzawa, 1998), suggesting the critical role of fat reserves in bufferingthe energetically demanding brain at weaning (Leonard et al., 2003). But bythe age of seven, SGA children have pronounced insulin resistance(Hofman et al., 1997). Nothing is known of the mechanisms underpinningthis switch in insulin sensitivity. Lucas and Singhal (Singhal et al., 2003) andothers (Morrisonetal., 2010) have suggested the critical role of infant catchup growth although this is not supported by studies in the Helsinki cohort(Forsen et al., 2000; Barker et al., 2005). Whether the catch up growth is acause of the insulin sensitivity switch or not, it is well established in rodentsthatprenatal experiencesensitizesthe offspring to become moreobeseona high fat post-natal diet (Howie et al., 2009). Hyperinsulinemia might alsoplay a role in driving post-natal infant somatic growth since fasting insulinlevels are significantly higher in SGA infants who have had a rapid catchup growth in weight (Soto et al., 2003).
We isolated Wharton’s Jelly-derived mesenchymal stem cells (MSCs)from fresh umbilical cords of normal and growth-restricted infants, as
they are an abundant cell species and can be harvested with no significantethical issues beyond consent (Bongso and Fong, 2013). MSCs are multi-potent and can be differentiated in vitro into various lineages (reviewed inBatsali et al., 2013). We compared global transcriptome changes in MSCsfrom SGA and control infants prior to and following insulin stimulation.We found the expression level patterns of the immediate early geneEGR-1 and the pro-inflammatory gene COX-2 to be significantlyaltered in cells derived from SGA subjects. In addition to these alteredpatterns of gene expression, MSCs from SGA individuals show significantdifferences in glucose uptake and proliferation suggesting that they main-tain the cellular memory of growth restriction/programming. We con-firmed these expression changes in mRNA extracted from frozenumbilical cord samples from a birth cohort. We suggest that MSCs area useful system for studies of the molecular mechanisms underlying thedevelopmental trajectory towards metabolic diseases.
Materials and Methods
Clinical populations and sample collectionAll umbilical cord specimens were derived from babies born at the NationalUniversity Hospital (NUH), in Singapore. Written parental consent to par-ticipate in the study was given. Ethical approval was granted by the ethicsboard of NUH, which is the Domain Specific Review Board (DSRB). Thedata shown in Fig. 7 were generated from frozen umbilical cord specimenscollected from the growing up in Singapore towards healthy outcomes(GUSTO) birth cohort study (Soh et al., 2013).
Assessment of fetal growth characteristicsFor the isolation of fresh MSCs from SGA and corresponding normal controlneonates, subjects were randomly chosen from the obstetric ward at NUHbased on their fetal growth determined by ultrasonography. Ultrasound mea-surements were derived from Hadlock formulas (Hadlock et al., 1982, 1984)and scans were conducted in a standard manner, using ultrasound machines(Aloka SSD-4000,GE Voluson E8). Fetal growth characteristics (biparietal diam-eter, femur and humerus lengths, head and abdominal circumferences) weremeasured at 19–21, 26–28 and 32–34 (scan 4) weeks of gestation. All fetalgrowth characteristics for each subject were converted to standard deviationscores (SDS)using internallyderivedgestational age-specificmeansandstandarddeviations. SGA was diagnosed by ultrasonography as growth between the 5thand 10th percentile compared with a normal reference population.
Preparation and propagation of mesenchymalstem cells from human umbilical cordMesenchymal stem cells (MSCs) were prepared following published proce-dures (Fong et al., 2010). Primary cell isolates were passaged up to 10times and the same passage numbers were used for the experimentsshown. Wharton’s jelly-derived MSCs employed in the study isolated from
2288 Sukarieh et al.
by guest on June 15, 2016http://hum
rep.oxfordjournals.org/D
ownloaded from
SGA infants (MSC-01, MSC-23, MSC-45, MSC-56, MSC-70 and MSC-75),and control subjects (MSC-44, MSC-31, MSC-50, MSC-57, MSC-60 andMSC-67) were ethnicity and gender matched. The prevalence of SGA withdiagnosed fetal growth restriction was rather low at around 8% of all cordscollected in our study. In addition, not all MSC isolates from all incomingspecimens could be propagated successfully. All isolates were derivedfrom female neonates with gestational ages between 37 and 39 weeks.
Flow cytometry based characterizationof MSC isolates from Wharton’s jellyStemness features of Wharton Jelly-derived MSCs were determined by ana-lysis of specific cell surface markers using flow cytometry. MSCs from mono-layer cultures were trypsinized and washed twice with ice-cold PBS. Afterresuspending the cells in 1 ml PBS, formaldehyde was added to a finalconcentration of 4%. The cells were fixed for 10 min at room temperatureand chilled on ice for 1 min. The cells were then incubated for 1 h atroom temperature with conjugated primary antibodies (PE-CD29,APC-CD44, eBioscience, San Diego, CA, USA). The cells were resuspendedin 0.5 ml PBS and analysed using a BD FACS Canto flow cytometer (BectonDickinson).
Cell proliferationCell proliferation was measured using the AlamarBluew Cell Viability Reagent(Invitrogen) according to manufacturer’s instructions. Briefly, cells wereplated to allow them to adhere and grow for �24 h at 378C and 5% CO2.Then 1/10th volume AlamarBluew reagent was added directly to cells inculture medium and incubated for 2 h at 378C before fluorescence measure-ment is made. A fluorescence excitation wavelength of 540–570 nm wasused and fluorescence emission at 580–610 nm was read. The average fluor-escence values of the cell culture medium alone (background) was subtractedfrom the fluorescence values of experimental wells.
EGR-1/COX-2 over-expressionand knockdown studiesFor over-expression studies, human MSCs were transfected using Lipofecta-mine LTX (Invitrogen) with 2.5 mg GFP-tagged plasmid containing thehuman EGR-1 gene (RG209956; Origene Technologies) or COX-2 gene(SC323764; Origene Technologies). For knockdown studies, siRNA againsthEGR-1 (ON-TARGETplus SMARTpool—Human EGR1; Cat. No.L-006526-00-0005) was obtained from Thermo Scientific. Smartpool siRNAof the following sequences was used: 5′-GAUGAACGCAAGAGGCAUA-3′, 5′-CGACAGCAGUCCCAUUUAC-3′, 5′-GGACAUGACAGCAACCUUU-3′, 5′-GACCUGAAGGCCCUCAAUA-3′. Control siRNA (ON-TARGETplus Non-targeting Pool; Cat. No. D-001810-10-20) was also fromThermo Scientific. Cells were transfected with a final concentration of25 nM siRNA using Dharmafectw siRNA Transfection Reagent (ThermoScientific) for 48 h according to the manufacturer’s instructions before use inexperiments.
RNA extractionUmbilical cord tissue (300 mg) was first placed in a sterile Dispomix tube(Medic Tools, AG, Zug, Switzerland) and homogenized in Trizol. Thesamples were processed according to standard procedures using phenol/chloroform extractions and ethanol precipitations. The isolated RNA waspurified using the RNeasy Mini Kit (Qiagen, Hilden, Germany) according tothe manufacturer’s instructions. RNA concentration was measured using ananodrop ND-8000 spectrophotometer (Nanodrop Technologies, Wil-mington, DE, USA), and RNA integrity was determined using the Agilent2100 Bioanalyzer and RNA 6000 Nano Labchips (Agilent Technologies,Santa Clara, CA, USA). RNA samples from frozen umbilical cord acceptable
for downstream applications had RNA Integrity Numbers (RIN) ≥8. RNAextraction from MSCs followed the same procedures as described above ex-cluding the use of Dispomix tubes and RNA purified from MSC isolatesusually had RIN values around 10.
Gene expression microarrayHumanHT-12 v4 Expression BeadChips (cat#BD-103-0204, Illumina) wereused for gene expression analysis following the manufacturer’s instructions.The data were extracted by the Illumina GenomeBeadStudioTM softwarefor further analysis. Background subtraction was performed, data wereexported and probes were filtered for the determination of the P-values,0.05 and NBEADS .3 using R. Data were then loaded into Arraystudio(Omicsoft) and normalized using quantile normalization. All samples withMAD scores less than 25 were removed from the analysis. Data were sub-jected to principal component analysis and unsupervised hierarchical cluster-ing. To identify probes significantly differentially expressed, one-wayANOVAs (multiple testing correction: Benjamini & Hochberg) were per-formed. Processed and raw data were deposited in GEO (GSE52845).
Pathway analysisAll genes that were significantly differentially expressed between SGA andcontrol groups were subjected to pathway enrichment and de novo networkanalysis. Pathway analysis was performed in GeneGo (MetaCoreTM).
Quantitative real-time PCRFor qRT–PCR, total RNA (4 mg) was reverse transcribed using a High Cap-acity cDNA Reverse Transcription Kit (Applied Biosystems, Inc., ABI, CA,USA). Target genes and two endogenous control housekeeping genes(beta-actin and GAPDH) were analysed. The threshold cycles (Ct) ofsamples provided by the equipment software (SDS 2.4) were normalizedby the average Ct of controls using △Ct,Target¼Ct,Target–Ct,AvgControl.
In order to quantify relative gene expression levels, we used the 22DDCt
method (Livak and Schmittgen, 2001) and the data were plotted as foldchange (Figs 1C, 2B, 4C and 6). For the results shown in Fig. 7, linear regres-sion analysis was applied on the delta Ct values of target genes against avariety of clinical measures.
In vitro glucose uptake assayWe treated the cells with 100 nM insulin and transfected EGR-1, COX-2 orGFP at various time points (0, 24 h, 48 h). At each time point, we collected50 ml of the medium and determined the concentration of glucose by usingthe QuantiChrom Glucose Assay kit (Medibena Bioassay systems) followingthe manufactures instructions. In brief, glucose was directly measured in themedium supernatants using a proprietary o-toluidine method utilizing a spe-cific colourimetric reaction with glucose. Absorbance measured at 630 nm isdirectly proportional to the glucose concentration in the medium as validatedvia a standard curve against fixed glucose concentrations. The data were nor-malized against the total protein content for each individual sample. Cellswere collected via trypsinization and lysed with standard RIPA buffer. Theprotein concentration was measured using the Bio-Rad protein assay kit.For Supplementary data, Fig. S3, data were normalized against the totalgenomic DNA. Genomic DNA was extracted using the DNeasy Blood andTissue Kit (QIAGEN, Venlo, Netherlands) following the manufacturer’sprotocol. The concentration of the eluted DNA was determined using thenanodrop ND-8000 spectrophotometer (Nanodrop Technologies).
Western blottingMSCs were washed twice with PBS and grown in alpha-MEM (GIBCO)without serum for 18–20 h. After serum starvation, cells were treatedwith insulin (100 nM) for various time points. Cell lysates were prepared
EGR-1 pathways in MSCs from SGA babies 2289
by guest on June 15, 2016http://hum
rep.oxfordjournals.org/D
ownloaded from
following standard protocols, frozen on dry ice and kept at 2808C for furtherusage. Total protein lysates (30 mg) were loaded on SDS–PAGE, and pro-teins were transferred to polyvinyl difluoride (PVDF) membranes. Primaryantibodies used were anti-pAKT (S470), anti-AKT (Santa Cruz, CA, USA),anti-EGR1 (Cell Signaling, MA, USA) and anti-b-Actin (Abcam, Cambridge,MA, USA). Secondary antibodies used were either IRDye 680LT or800CW from LI-COR Biosciences. Bands were quantified by densitometricmeasurements using the LI-COR odyssey software. The band densities were
normalized to the density of b-actin. The data shown in Fig. 3B (right panel)represent mean+ SD from three different blots.
ELISAFor the measurement of PGE2 release upon insulin stimulation of MSCisolates (Fig. 4D), 0.5 ml of the supernatant (cell growth medium) werecollected from each time point and the concentration of PGE2 was measured
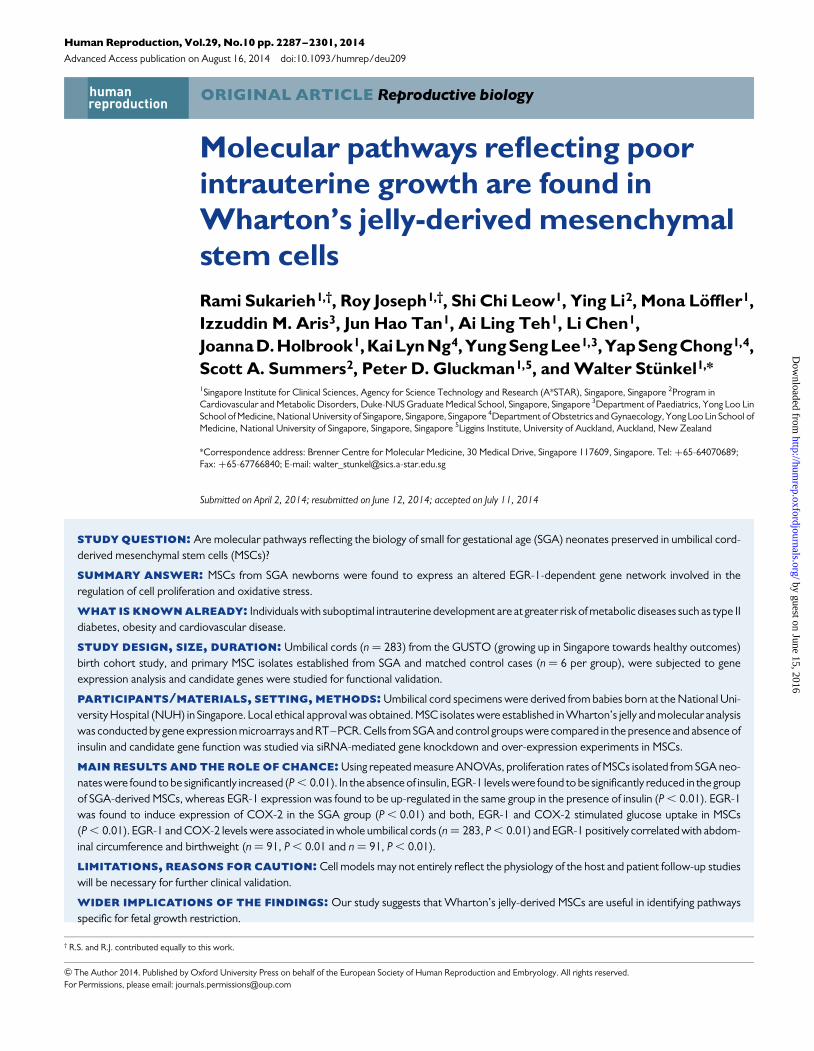
Figure 1 (A) Increased cell proliferation of SGA-derived MSCs. Growth of SGA-derived primary MSC isolates (MSC-56, -70, -75, -01 and -23) and con-trols (MSC-60, -50, -57 and -44) was determined over 5 days (n ¼ 3, **P , 0.01, repeated measures ANOVA). (B) EGR-1 is significantly under-expressedin SGA MSCs as shown by gene expression microarrayand RT–PCR studies. Gene expression microarrayexperiments were conducted comparing primaryMSC isolates from four SGA individuals versus four matched controls. Hierarchical clustering identified probes which were significantly differentiallyexpressed between the groups. (C) RT–PCR based confirmation of lower EGR-1 expression in the SGA group of MSC isolates (error bars representSD, n ¼ 3, **P , 0.01).
2290 Sukarieh et al.
by guest on June 15, 2016http://hum
rep.oxfordjournals.org/D
ownloaded from
using a high sensitivity ELISA kit from Abcam (cat# ab133055) following themanufacturer’s instructions.
StatisticsDifferences incell proliferationbetweentheSGAandcontrol groupsacross the5-day time period were analysed using repeated measures analysis of variance(ANOVA), testing for potential interactions between time and ‘SGA versuscontrol’ on the outcome of cell proliferation. In the case of a statistically signifi-cant interaction, differences in cell proliferation between the SGA and controlgroups were tested at each time point. The effects of acute insulin treatmentand EGR-1/COX-2 over-expression on cell proliferation as well as glucoseuptake were analysed using two-way ANOVA. For comparisons betweengroups in experiments describing fold gene expression and ELISA, paired
t-tests were conducted. Significant differences were expressed as ‘*’ forP-values ,0.05 and ‘**’ for P-values ,0.01. Statistical analysis was performedusing SPSS version 16.0 (IBM, SPSS Statistics, Armonk, NY, USA).
Results
MSCs derived from SGA neonates showhigher cell proliferation rates and expresslow basal levels of EGR-1After obtaining consent from the local Domain Specific Review Board,we established a collection of primary Wharton’s jelly-derived MSC
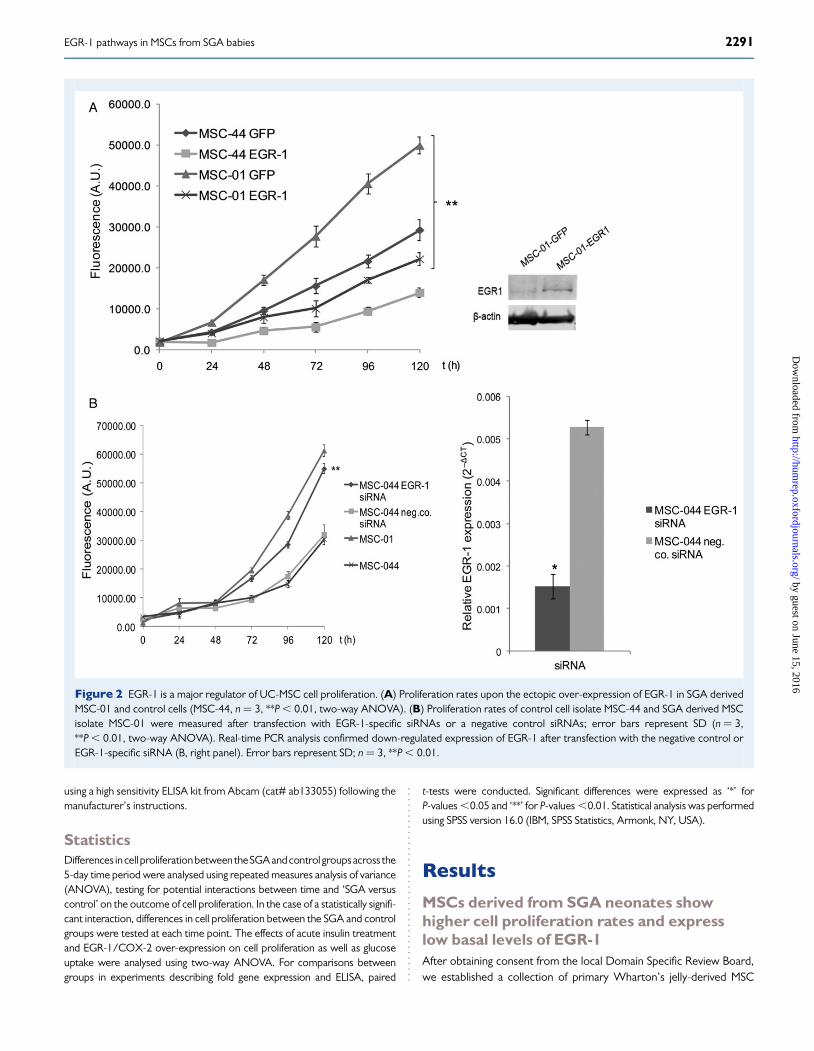
Figure 2 EGR-1 is a major regulator of UC-MSC cell proliferation. (A) Proliferation rates upon the ectopic over-expression of EGR-1 in SGA derivedMSC-01 and control cells (MSC-44, n ¼ 3, **P , 0.01, two-way ANOVA). (B) Proliferation rates of control cell isolate MSC-44 and SGA derived MSCisolate MSC-01 were measured after transfection with EGR-1-specific siRNAs or a negative control siRNAs; error bars represent SD (n ¼ 3,**P , 0.01, two-way ANOVA). Real-time PCR analysis confirmed down-regulated expression of EGR-1 after transfection with the negative control orEGR-1-specific siRNA (B, right panel). Error bars represent SD; n ¼ 3, **P , 0.01.
EGR-1 pathways in MSCs from SGA babies 2291
by guest on June 15, 2016http://hum
rep.oxfordjournals.org/D
ownloaded from
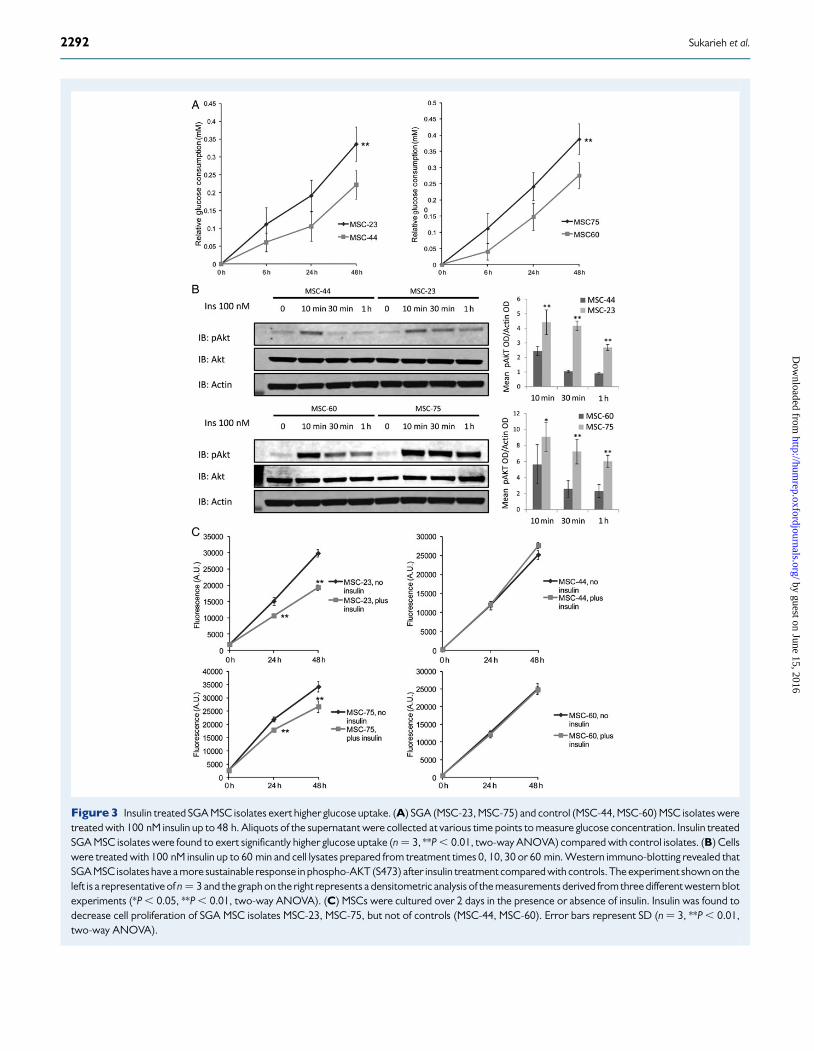
Figure 3 Insulin treated SGA MSC isolates exert higher glucose uptake. (A) SGA (MSC-23, MSC-75) and control (MSC-44, MSC-60) MSC isolates weretreated with 100 nM insulin up to 48 h. Aliquots of the supernatant were collected at various time points to measure glucose concentration. Insulin treatedSGA MSC isolates were found to exert significantly higher glucose uptake (n ¼ 3, **P , 0.01, two-way ANOVA) compared with control isolates. (B) Cellswere treated with 100 nM insulin up to 60 min and cell lysates prepared from treatment times 0, 10, 30 or 60 min. Western immuno-blotting revealed thatSGA MSC isolates have a more sustainable response in phospho-AKT (S473) after insulin treatment compared with controls. The experiment shown on theleft is a representative of n ¼ 3 and the graph on the right represents a densitometric analysis of the measurements derived from three different western blotexperiments (*P , 0.05, **P , 0.01, two-way ANOVA). (C) MSCs were cultured over 2 days in the presence or absence of insulin. Insulin was found todecrease cell proliferation of SGA MSC isolates MSC-23, MSC-75, but not of controls (MSC-44, MSC-60). Error bars represent SD (n ¼ 3, **P , 0.01,two-way ANOVA).
2292 Sukarieh et al.
by guest on June 15, 2016http://hum
rep.oxfordjournals.org/D
ownloaded from
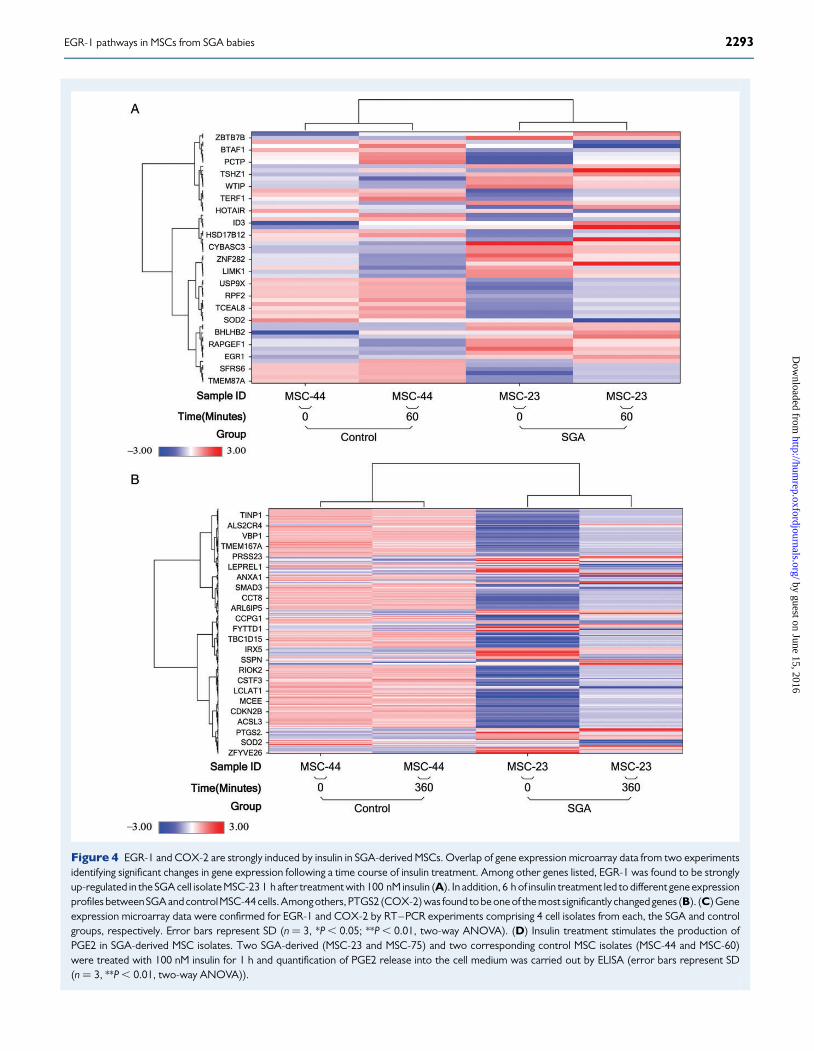
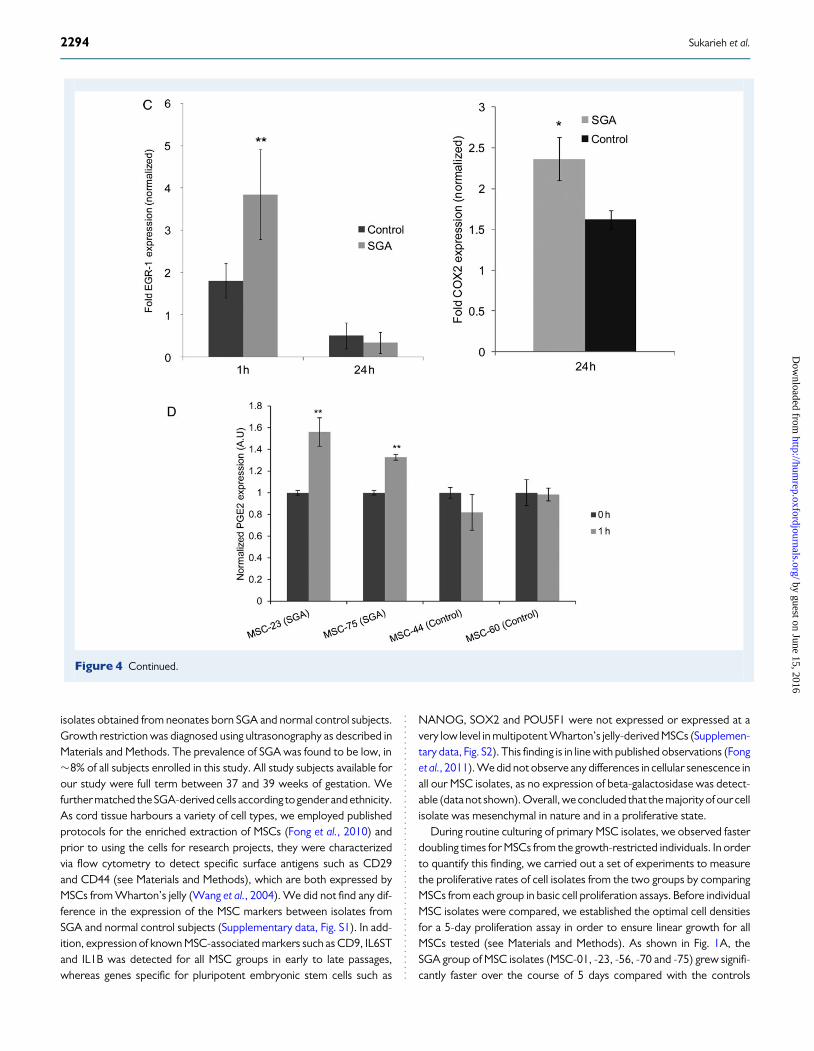
Figure 4 EGR-1 and COX-2 are strongly induced by insulin in SGA-derived MSCs. Overlap of gene expression microarray data from two experimentsidentifying significant changes in gene expression following a time course of insulin treatment. Among other genes listed, EGR-1 was found to be stronglyup-regulated in the SGA cell isolate MSC-23 1 h after treatment with 100 nM insulin (A). In addition, 6 h of insulin treatment led to different gene expressionprofiles between SGA and controlMSC-44 cells. Among others, PTGS2 (COX-2) was found to be one of the most significantly changed genes (B). (C) Geneexpression microarray data were confirmed for EGR-1 and COX-2 by RT–PCR experiments comprising 4 cell isolates from each, the SGA and controlgroups, respectively. Error bars represent SD (n ¼ 3, *P , 0.05; **P , 0.01, two-way ANOVA). (D) Insulin treatment stimulates the production ofPGE2 in SGA-derived MSC isolates. Two SGA-derived (MSC-23 and MSC-75) and two corresponding control MSC isolates (MSC-44 and MSC-60)were treated with 100 nM insulin for 1 h and quantification of PGE2 release into the cell medium was carried out by ELISA (error bars represent SD(n ¼ 3, **P , 0.01, two-way ANOVA)).
EGR-1 pathways in MSCs from SGA babies 2293
by guest on June 15, 2016http://hum
rep.oxfordjournals.org/D
ownloaded from
isolates obtained from neonates born SGA and normal control subjects.Growth restriction was diagnosed using ultrasonography as described inMaterials and Methods. The prevalence of SGA was found to be low, in�8% of all subjects enrolled in this study. All study subjects available forour study were full term between 37 and 39 weeks of gestation. Wefurther matched the SGA-derived cells according to genderand ethnicity.As cord tissue harbours a variety of cell types, we employed publishedprotocols for the enriched extraction of MSCs (Fong et al., 2010) andprior to using the cells for research projects, they were characterizedvia flow cytometry to detect specific surface antigens such as CD29and CD44 (see Materials and Methods), which are both expressed byMSCs from Wharton’s jelly (Wang et al., 2004). We did not find any dif-ference in the expression of the MSC markers between isolates fromSGA and normal control subjects (Supplementary data, Fig. S1). In add-ition, expression of known MSC-associated markers such as CD9, IL6STand IL1B was detected for all MSC groups in early to late passages,whereas genes specific for pluripotent embryonic stem cells such as
NANOG, SOX2 and POU5F1 were not expressed or expressed at avery low level in multipotent Wharton’s jelly-derived MSCs (Supplemen-tary data, Fig. S2). This finding is in line with published observations (Fonget al., 2011). We did not observe any differences in cellular senescence inall our MSC isolates, as no expression of beta-galactosidase was detect-able (data not shown). Overall, we concluded that the majority of our cellisolate was mesenchymal in nature and in a proliferative state.
During routine culturing of primary MSC isolates, we observed fasterdoubling times for MSCs from the growth-restricted individuals. In orderto quantify this finding, we carried out a set of experiments to measurethe proliferative rates of cell isolates from the two groups by comparingMSCs from each group in basic cell proliferation assays. Before individualMSC isolates were compared, we established the optimal cell densitiesfor a 5-day proliferation assay in order to ensure linear growth for allMSCs tested (see Materials and Methods). As shown in Fig. 1A, theSGA group of MSC isolates (MSC-01, -23, -56, -70 and -75) grew signifi-cantly faster over the course of 5 days compared with the controls
Figure 4 Continued.
2294 Sukarieh et al.
by guest on June 15, 2016http://hum
rep.oxfordjournals.org/D
ownloaded from
MSC-44, -50, -57 and -60. The differences between the groups weresignificant as shown by a two-way ANOVA (three biological samplerepeats, P , 0.01). In order to identify the molecular drivers accountingfor these differences in cell proliferation, we studied global transcrip-tomic changes between the groups by conducting gene expressionmicroarray experiments comparing MSCs from four SGA individualswith MSCs from four controls. We identified 83 differentially expressedprobes between the two groups with P-value ,0.05 and |FC| .1.5, (seeheat map shown in Fig. 1B). Analysis of the data revealed an enrichmentof pathways regulating cell proliferation, cytokine-mediated signalling andprostaglandin E2 function (Table I). One of the most significant genesidentified in the analysis was the transcription factor EGR-1, previouslyknown to regulate cell proliferation in cancer cells (Liu et al., 2007); itwas found to be down-regulated in our MSC isolates from SGA babiesand this was confirmed by RT–PCR comparing all MSC isolates fromthe two groups (Fig. 1C).
EGR-1 is a key regulator of MSC proliferationTo assess the putative regulatory role for EGR-1 in the growth of MSCs,we transfected an expression vector for EGR-1, or GFP which served asnegative control, into both a representative SGA (MSC-01), and a repre-sentative control, MSC line (MSC-44). EGR-1 inhibited cell proliferationin both MSC isolates, albeit to a greater extent in the SGA-derived lineMSC-01 (Fig. 2A; n ¼ 3, P , 0.01, two-way ANOVA). The reverse ap-proach was taken by employing EGR-1-specific siRNAs compared withscrambled control siRNAs (Fig. 2B) demonstrating that knockdown ofEGR-1 led to a significant increase in proliferation of MSC-44 controlcells to the level seen for the SGA cell line (n ¼ 3, P , 0.01, two-wayANOVA).
Wharton’s jelly-derived MSCs from SGAneonates exert enhanced insulin sensitivityWhen stimulated with insulin, MSCs derived from the SGA group (exam-ples MSC isolates #23 and #75) consumed significantly more glucosefrom the culture medium over time when compared with their ethnicity-matched controls (#44 and #60, Fig. 3A; P , 0.01, two-way ANOVA).Although we normalized the raw glucose uptake data against the totalamount of protein for every sample, to further ensure that the resultsof the glucose uptake assay were not confounded by differences in cellproliferation rates between the MSC isolates, we also normalized theglucose uptake data against the total amount of DNA. The resultswere found to be similar (see Supplementary data, Fig. S3). In parallel,we found that the SGA-derived MSCs have higher levels of pAKT from10 to 30 min after exposure to the insulin trigger than their ethnicity-matched controls (Fig. 3B). However, when exposed to insulin treat-ment, the SGA MSC isolate exerted slower proliferation rates comparedwith the controls, for which insulin had no effect (Fig. 3C; P , 0.01,two-way ANOVA).
COX-2 and EGR-1 are strongly up-regulatedin SGA-derived MSC isolates after insulinstimulationWe next investigated transcriptomic changes in the MSC isolates after ex-posure to insulin. For this purpose, we conducted a series of gene expres-sion microarray experiments with a selected SGA (MSC-23) and normalcontrolMSCpreparation (MSC-44)after treatmentwith insulin at different
time points. Interestingly, amongst others, one of the most significantlychanged genes, amongstothers,wasagainEGR-1,which,under these con-ditions, showed a strong up-regulation in the SGA group of MSCs in re-sponse to shorter insulin stimulation (Fig. 4A). After longer insulintreatment, various genes were differentially expressed. We were particu-larly interested in the geneencoding prostaglandin-endoperoxidesynthase2, also known as cyclooxygenase 2 (PTGS-2, COX-2, Fig. 4B). COX-2 andthe modulation of its activity have been related to important metabolicfunctions (Fain et al., 2001). We confirmed the general trend of an insulin-dependent and SGA-specific increase in COX-2 and EGR-1 expression bycomparing all SGA and control MSC isolates available, in addition to thoseused in the original microarray studies (Fig. 4C). COX-2 is a knownpro-inflammatory gene, which encodes the key enzyme for the biosyn-thesis of certain prostaglandins such as PGE2. As shown in Fig. 4D,PGE2 is secreted at higherconcentrations into the mediumfromrepresen-tative SGA-derived MSCs, which is in accordance with the observedenhanced COX-2 levels in these cells following the insulin challenge.
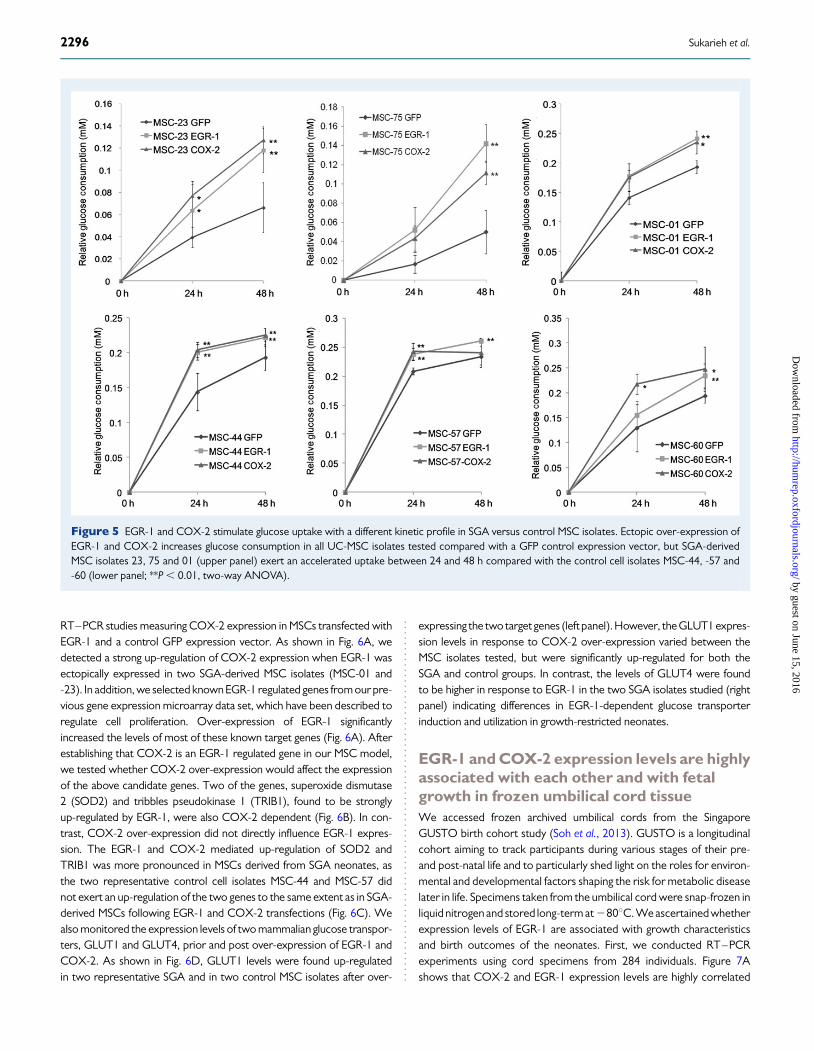
EGR-1 and COX-2 over-expression increaseglucose uptake in SGA-derived MSCsInsulin signalling has been shown to positively regulate COX-2 expres-sion (Cao et al., 2007), as well as EGR-1 induction in a PI3K-dependentmanner (Keeton et al., 2003). Both EGR-1 and COX-2 over-expressionsignificantly increased glucose uptake indicating a change in cellular me-tabolism. The increase in glucose uptake was found to be acceleratedin the SGA-derived MSC isolates between 24 and 48 h (Fig. 5, upperpanel), but not in the control MSCs (Fig. 5, lower panel).
EGR-1 up-regulates COX-2 levels and inducesEGR-1 target genes involved in the regulationof cell proliferation, oxidative stress andglucose uptakeCOX-2 expression may be regulated, either directly or indirectly, throughthe action of EGR-1. In order to test this hypothesis, we conducted
........................................................................................
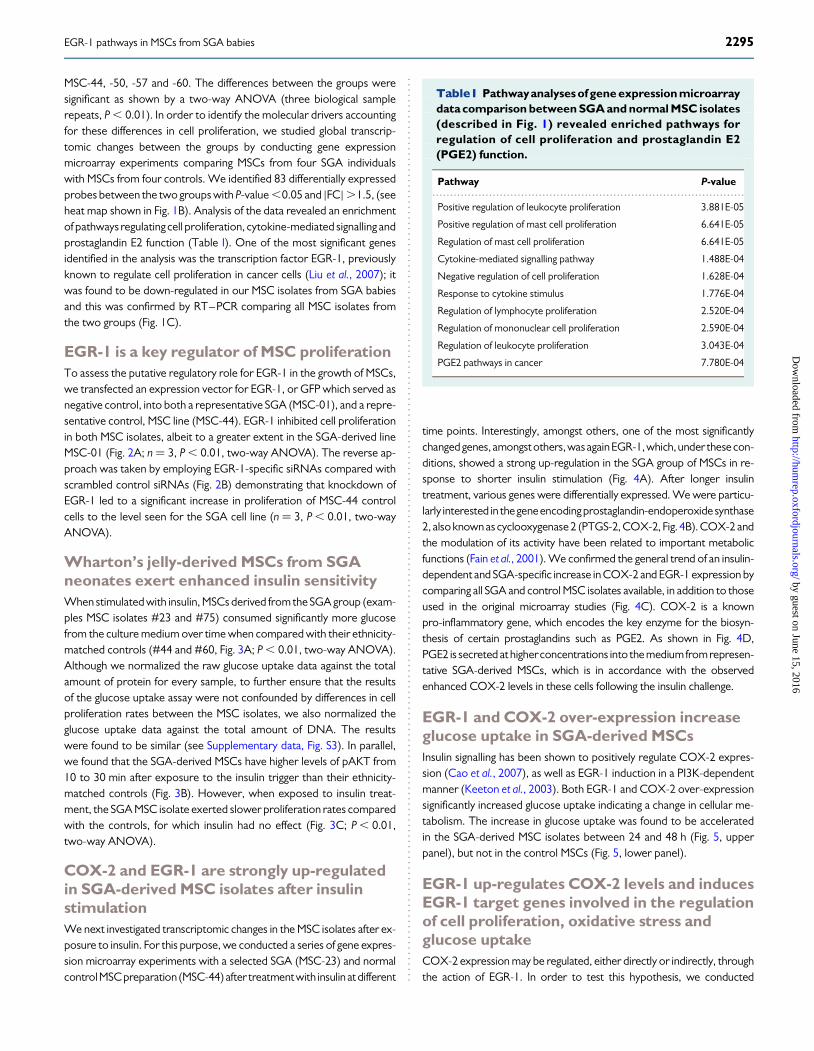
Table I Pathwayanalyses of gene expression microarraydata comparison between SGA and normal MSC isolates(described in Fig. 1) revealed enriched pathways forregulation of cell proliferation and prostaglandin E2(PGE2) function.
Pathway P-value
Positive regulation of leukocyte proliferation 3.881E-05
Positive regulation of mast cell proliferation 6.641E-05
Regulation of mast cell proliferation 6.641E-05
Cytokine-mediated signalling pathway 1.488E-04
Negative regulation of cell proliferation 1.628E-04
Response to cytokine stimulus 1.776E-04
Regulation of lymphocyte proliferation 2.520E-04
Regulation of mononuclear cell proliferation 2.590E-04
Regulation of leukocyte proliferation 3.043E-04
PGE2 pathways in cancer 7.780E-04
EGR-1 pathways in MSCs from SGA babies 2295
by guest on June 15, 2016http://hum
rep.oxfordjournals.org/D
ownloaded from
RT–PCR studies measuring COX-2 expression in MSCs transfected withEGR-1 and a control GFP expression vector. As shown in Fig. 6A, wedetected a strong up-regulation of COX-2 expression when EGR-1 wasectopically expressed in two SGA-derived MSC isolates (MSC-01 and-23). In addition, we selected known EGR-1 regulated genes from our pre-vious gene expression microarray data set, which have been described toregulate cell proliferation. Over-expression of EGR-1 significantlyincreased the levels of most of these known target genes (Fig. 6A). Afterestablishing that COX-2 is an EGR-1 regulated gene in our MSC model,we tested whether COX-2 over-expression would affect the expressionof the above candidate genes. Two of the genes, superoxide dismutase2 (SOD2) and tribbles pseudokinase 1 (TRIB1), found to be stronglyup-regulated by EGR-1, were also COX-2 dependent (Fig. 6B). In con-trast, COX-2 over-expression did not directly influence EGR-1 expres-sion. The EGR-1 and COX-2 mediated up-regulation of SOD2 andTRIB1 was more pronounced in MSCs derived from SGA neonates, asthe two representative control cell isolates MSC-44 and MSC-57 didnot exert an up-regulation of the two genes to the same extent as in SGA-derived MSCs following EGR-1 and COX-2 transfections (Fig. 6C). Wealso monitored the expression levels of two mammalian glucose transpor-ters, GLUT1 and GLUT4, prior and post over-expression of EGR-1 andCOX-2. As shown in Fig. 6D, GLUT1 levels were found up-regulatedin two representative SGA and in two control MSC isolates after over-
expressing the two target genes (leftpanel). However, the GLUT1 expres-sion levels in response to COX-2 over-expression varied between theMSC isolates tested, but were significantly up-regulated for both theSGA and control groups. In contrast, the levels of GLUT4 were foundto be higher in response to EGR-1 in the two SGA isolates studied (rightpanel) indicating differences in EGR-1-dependent glucose transporterinduction and utilization in growth-restricted neonates.
EGR-1 and COX-2 expression levels are highlyassociated with each other and with fetalgrowth in frozen umbilical cord tissueWe accessed frozen archived umbilical cords from the SingaporeGUSTO birth cohort study (Soh et al., 2013). GUSTO is a longitudinalcohort aiming to track participants during various stages of their pre-and post-natal life and to particularly shed light on the roles for environ-mental and developmental factors shaping the risk for metabolic diseaselater in life. Specimens taken from the umbilical cord were snap-frozen inliquid nitrogen and stored long-term at 2808C. We ascertained whetherexpression levels of EGR-1 are associated with growth characteristicsand birth outcomes of the neonates. First, we conducted RT–PCRexperiments using cord specimens from 284 individuals. Figure 7Ashows that COX-2 and EGR-1 expression levels are highly correlated
Figure 5 EGR-1 and COX-2 stimulate glucose uptake with a different kinetic profile in SGA versus control MSC isolates. Ectopic over-expression ofEGR-1 and COX-2 increases glucose consumption in all UC-MSC isolates tested compared with a GFP control expression vector, but SGA-derivedMSC isolates 23, 75 and 01 (upper panel) exert an accelerated uptake between 24 and 48 h compared with the control cell isolates MSC-44, -57 and-60 (lower panel; **P , 0.01, two-way ANOVA).
2296 Sukarieh et al.
by guest on June 15, 2016http://hum
rep.oxfordjournals.org/D
ownloaded from
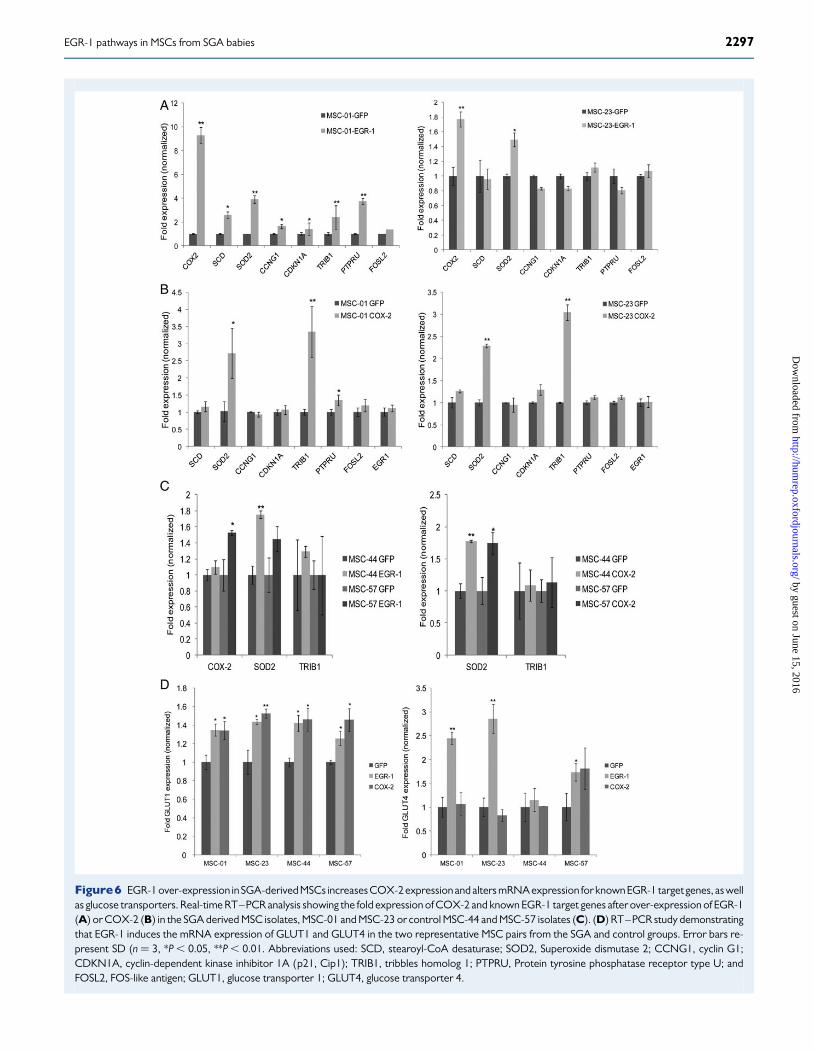
Figure6 EGR-1 over-expression in SGA-derived MSCs increases COX-2 expressionand alters mRNA expression for known EGR-1 target genes, as wellas glucose transporters. Real-time RT–PCR analysis showing the fold expression of COX-2 and known EGR-1 target genes after over-expression of EGR-1(A) or COX-2 (B) in the SGA derived MSC isolates, MSC-01 and MSC-23 or control MSC-44 and MSC-57 isolates (C). (D) RT–PCR study demonstratingthat EGR-1 induces the mRNA expression of GLUT1 and GLUT4 in the two representative MSC pairs from the SGA and control groups. Error bars re-present SD (n ¼ 3, *P , 0.05, **P , 0.01. Abbreviations used: SCD, stearoyl-CoA desaturase; SOD2, Superoxide dismutase 2; CCNG1, cyclin G1;CDKN1A, cyclin-dependent kinase inhibitor 1A (p21, Cip1); TRIB1, tribbles homolog 1; PTPRU, Protein tyrosine phosphatase receptor type U; andFOSL2, FOS-like antigen; GLUT1, glucose transporter 1; GLUT4, glucose transporter 4.
EGR-1 pathways in MSCs from SGA babies 2297
by guest on June 15, 2016http://hum
rep.oxfordjournals.org/D
ownloaded from
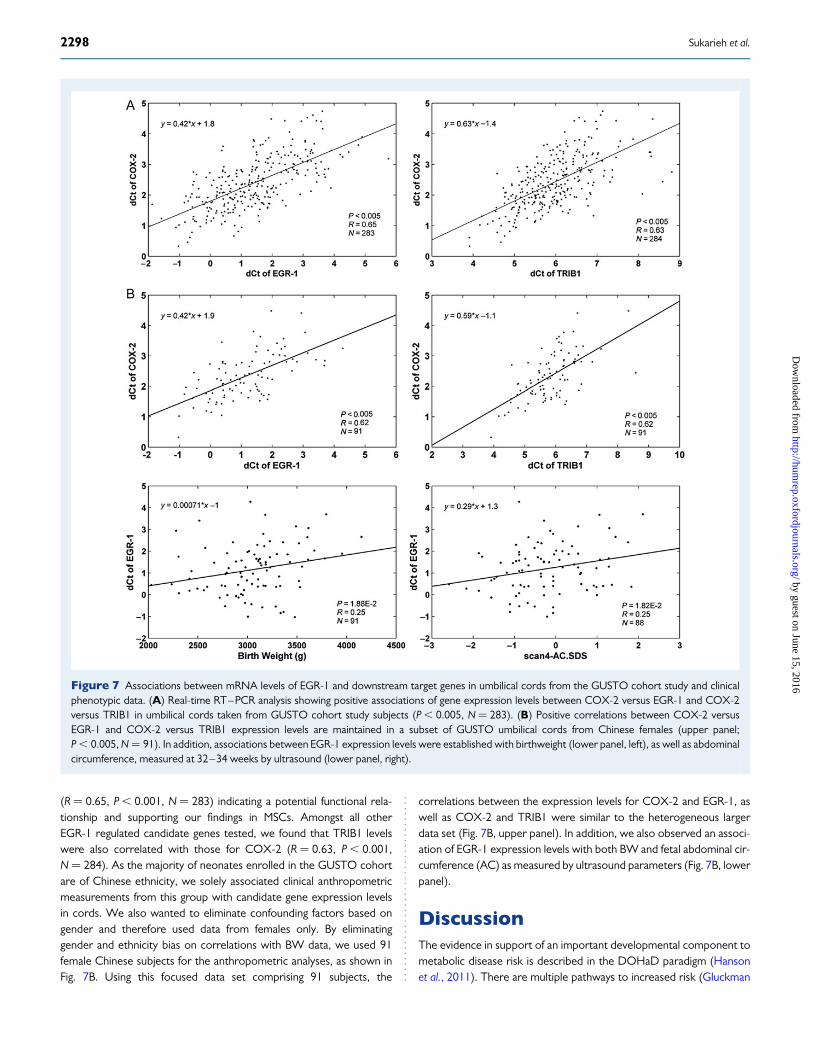
(R ¼ 0.65, P , 0.001, N ¼ 283) indicating a potential functional rela-tionship and supporting our findings in MSCs. Amongst all otherEGR-1 regulated candidate genes tested, we found that TRIB1 levelswere also correlated with those for COX-2 (R ¼ 0.63, P , 0.001,N ¼ 284). As the majority of neonates enrolled in the GUSTO cohortare of Chinese ethnicity, we solely associated clinical anthropometricmeasurements from this group with candidate gene expression levelsin cords. We also wanted to eliminate confounding factors based ongender and therefore used data from females only. By eliminatinggender and ethnicity bias on correlations with BW data, we used 91female Chinese subjects for the anthropometric analyses, as shown inFig. 7B. Using this focused data set comprising 91 subjects, the
correlations between the expression levels for COX-2 and EGR-1, aswell as COX-2 and TRIB1 were similar to the heterogeneous largerdata set (Fig. 7B, upper panel). In addition, we also observed an associ-ation of EGR-1 expression levels with both BW and fetal abdominal cir-cumference (AC) as measured by ultrasound parameters (Fig. 7B, lowerpanel).
DiscussionThe evidence in support of an important developmental component tometabolic disease risk is described in the DOHaD paradigm (Hansonet al., 2011). There are multiple pathways to increased risk (Gluckman
Figure 7 Associations between mRNA levels of EGR-1 and downstream target genes in umbilical cords from the GUSTO cohort study and clinicalphenotypic data. (A) Real-time RT–PCR analysis showing positive associations of gene expression levels between COX-2 versus EGR-1 and COX-2versus TRIB1 in umbilical cords taken from GUSTO cohort study subjects (P , 0.005, N ¼ 283). (B) Positive correlations between COX-2 versusEGR-1 and COX-2 versus TRIB1 expression levels are maintained in a subset of GUSTO umbilical cords from Chinese females (upper panel;P , 0.005, N ¼ 91). In addition, associations between EGR-1 expression levels were established with birthweight (lower panel, left), as well as abdominalcircumference, measured at 32–34 weeks by ultrasound (lower panel, right).
2298 Sukarieh et al.
by guest on June 15, 2016http://hum
rep.oxfordjournals.org/D
ownloaded from
and Hanson, 2004, 2006), but the one that has had the most attention isthat associated with less than optimal fetal nutrition. Fetal growth retard-ation can be seen as an immediate adaptive response to limiting nutrition-al conditions where longer term consequences, induced most probablyby epigenetic processes, are either a trade-off against that immediateadaptation or an anticipatory or predictive adaptive response (Bateson2008; Gluckman et al., 2011). Insulin hypersensitivity which is seen atbirth in SGA (Bazaes et al., 2003) could be an immediate adaptive re-sponse to promote adipogenesis either for thermoregulatory purposesor as a later metabolic buffer after weaning (Kuzawa, 1998). Insulin resist-ance which develops in childhood (Hofman et al., 1997; Mericq et al.,2005) is seen as a phenotype better adapted to poor nutritional circum-stance (Hales and Barker, 1992). But the underpinning mechanisms arepoorly understood and in humans, ethical and practical limitations limitthe types of investigation possible.
We employed Wharton’s jelly-derived MSCs as a potentially suitabletissue to study insulin sensitivity and the associated molecular pathways.To our knowledge, it has not been shown before that MSCs maintainphenotypic differences reflecting intrauterine experience. Two key ques-tions are what determines the neonatal insulin hypersensitivity and howthe transition is made from an insulin sensitive to a relatively insensitivestate in childhood. One possible factor may be post-natal catch-upgrowth (Berends et al., 2013). Rapid post-natal weight gain has beenlinked with insulin resistance in pre-pubertal children born with SGA(Faienza et al., 2013).
Our gene expression microarray data obtained after comparisonbetween the UC-MSC groups revealed that one of the most significantdifferentially expressed genes is the transcription factor EGR-1. Thedown-regulation of EGR-1 in the absence of insulin in UC-MSCsderived from SGA babies can explain their relative high proliferativerates as EGR-1 has been shown to function as tumour suppressorgene (Liu et al., 2007). It is also interesting to note that EGR-1 hasbeen indirectly implicated in mammalian growth restriction (Basergaet al., 2010). Furthermore, EGR-1 has been associated with insulin resist-ance and to be over-expressed in adipose tissue in adult subjects withtype 2 diabetes (Shen et al., 2011; Yu et al., 2011).
How can EGR-1 potentially exert its function in stem cells from growthrestricted babies? One explanation may be the concomitant over-expression of COX-2 in response to insulin, which we found only inthe SGA group. COX-2 has multiple implications for the developmentof metabolic diseases. It catalyses the first two steps in the biosynthesisof prostaglandins (PGs), and its induction is mainly associated with inflam-mation and cytokine expression (Simmons et al., 2004). COX-2 has im-portant functions in metabolism promoting adipogenesis and potentiallyobesity (Fain et al., 2001). Selective inhibitors of COX-2 have also beenshown to ameliorate insulin sensitivity in normal subjects (Gonzalez-Ortiz et al., 2001). Furthermore, in rodent studies, COX-2 activationmediates inflammation in fat tissue leading to insulin resistance (Hsiehet al., 2009).
More recent studies showed that the activity of COX-2 enhances theexpression of UCP1 (Uncoupling protein1) in white adipose tissue, butnot in brown adipose tissue (BAT) (Madsen et al., 2010). BAT is abundantin small children and it is conceivable that the COX-2 over-expression inMSCs from growth-restricted babies echoes an important mechanismfor producing body heat. For preterm and SGA babies, it is of primary im-portance to maintain body heat. In future, we will test this hypothesis inbrown adipocytes differentiated from cord-derived MSCs. EGR-1 may
be a key regulator in the biology of developmental programming andthe transition towards insulin resistance and metabolic disease.
SOD2 and TRIB1 are genes in the network downstream of EGR-1 andwere identified in our gene expression microarray experiments. Oxida-tive stress may be a contributing factor in the aetiology of metabolicdisease of growth restricted babies (reviewed in Simmons 2012).Indeed SOD2 mediates a metabolic switch during the progressionfrom non-proliferating to proliferating human cells (Sarsour et al.,2012). This could explain why EGR-1 and COX-2 mediated SOD2up-regulation in our MSC model could have a negative impact on cell pro-liferation. We do not understand at present, why EGR-1 and COX-2stimulate glucose uptake, but this effect may be mediated by the EGR-1-dependent increase in glucose transporters such as GLUT1 and GLUT4(Fig. 6D). This is afinding contradictory to previouslypublished results forEGR-1 function in the development of insulin resistance (Shen et al.,2011; Yu et al., 2011). It is tempting to speculate that alternative path-ways for glucose utilization are favoured in human MSCs and we are cur-rently investigating this possibility. It may also be that increased oxidativestress contributes to the enhanced glucose uptake, as has been shown inskeletal muscle (Higaki et al., 2008).
TRIB1 belongs to the Tribbles gene family, which comprises relatedserine/threonine kinase-like proteins (Yokoyama and Nakamura,2011). TRIB1 has been shown to be a negative regulator of smooth vas-cular muscle cell proliferation (Sung et al., 2007), providing an additionalpossible mechanism by which EGR-1 inhibits cell proliferation via adownstream gene.
In summary, employing Wharton’s jelly MSCs may prove a useful ex-perimental approach to explore the biology of developmental program-ming. In particular, umbilical cord-derived MSC isolates may help toexplain the transition from an early insulin-sensitive to an insulin-resistantphenotype in the course of developmental programming of insulin resist-ance in SGA individuals.
Supplementary dataSupplementary data areavailable athttp://humrep.oxfordjournals.org/.
AcknowledgementsWe are grateful for the expert technical assistance of Yhee Cheng Chngand Maggie Lim. We thank Prof. Kenneth Kwek and the GUSTO studygroup for enabling the collection of umbilical cord tissue.
Authors’ rolesW.S. and R.S. designed the experiments. R.S., R.J., S.C.L., Y.L., M.L.,I.M.A., J.H.T. executed the experiments. A.L.T., L.C. and J.D.H. per-formed the bioinformatics analysis. All other authors contributed tothe data analysis and preparation of clinical specimens. W.S. preparedthe manuscript. All authors reviewed and approved the final manuscript.W.S. is the guarantor and takes full responsibility for the work as a whole.
FundingThis work is supported by the Translational Clinical Research (TCR) Flag-ship Program on Developmental Pathways to Metabolic Disease fundedby the National Research Foundation (NRF) and administered by the
EGR-1 pathways in MSCs from SGA babies 2299
by guest on June 15, 2016http://hum
rep.oxfordjournals.org/D
ownloaded from
National Medical Research Council (NMRC), Singapore- NMRC/TCR/004-NUS/2008’. SICS Investigators are supported through the Agencyfor Science Technology and Research (A*STAR) funding.
Conflict of interestNone declared.
ReferencesBarker DJ. Outcome of low birthweight. Horm Res 1994;42:223–230.Barker DJ. The fetal origins of coronary heart disease. Acta Paediatr Suppl
1997;422:78–82.Barker DJ, Osmond C, Forsen TJ, Kajantie E, Eriksson JG. Trajectories of
growth among children who have coronary events as adults. N Engl JMed 2005;353:1802–1809.
Baserga M, Kaur R, Hale MA, Bares A, Yu X, Callaway CW, McKnight RA,Lane RH. Fetal growth restriction alters transcription factor binding andepigenetic mechanisms of renal 11beta-hydroxysteroid dehydrogenasetype 2 in a sex-specific manner. Am J Physiol Regul Integr Comp Physiol2010;299:R334–R342.
Bateson P. Preparing offspring for future conditions is adaptive. TrendsEndocrinol Metab 2008;19:111.
Batsali AK, Kastrinaki MC, Papadaki HA, Pontikoglou C. Mesenchymal stemcells derived from Wharton’s Jelly of the umbilical cord: biologicalproperties and emerging clinical applications. Curr Stem Cell Res Ther2013;8:144–155.
Bazaes RA, Salazar TE, Pittaluga E, Pena V, Alegrıa A, Iniguez G, Ong KK,Dunger DB, Mericq MV. Glucose and lipid metabolism in small forgestational age infants at 48 hours of age. Pediatrics 2003;111(4 Pt1):804–809.
Berends LM, Fernandez-Twinn DS, Martin-Gronert MS, Cripps RL,Ozanne SE. Catch-up growth following intra-uterine growth-restrictionprogrammes an insulin-resistant phenotype in adipose tissue. Int J Obes(Lond) 2013;37:1051–1057.
Bongso A, Fong CY. The therapeutic potential, challenges and future clinicaldirections of stem cells from the Wharton’s jelly of the human umbilicalcord. Stem Cell Rev 2013;9:226–240.
Cao Z, Liu LZ, Dixon DA, Zheng JZ, Chandran B, Jiang BH. Insulin-likegrowth factor-I induces cyclooxygenase-2 expression via PI3K, MAPKand PKC signaling pathways in human ovarian cancer cells. Cell Signal2007;19:1542–1553.
Faienza MF, Brunetti G, Ventura A, D’Aniello M, Pepe T, Giordano P,Monteduro M, Cavallo L. Nonalcoholic Fatty liver disease in prepubertalchildren born small for gestational age: influence of rapid weightcatch-up growth. Horm Res Paediatr 2013;79:103–109.
Fain JN, Ballou LR, Bahouth SW. Obesity is induced in mice heterozygous forcyclooxygenase-2. Prostaglandins Other Lipid Mediat 2001;65:199–209.
Fong CY, Subramanian A, Biswas A, Gauthaman K, Srikanth P, Hande MP,Bongso A. Derivation efficiency, cell proliferation, freeze-thaw survival,stem-cell properties and differentiation of human Wharton’s jelly stemcells. Reprod Biomed 2010;21:391–401.
Fong CY, Chak LL, Biswas A, Tan JH, Gauthaman K, Chan WK, Bongso A.Human Wharton’s jelly stem cells have unique transcriptome profilescompared to human embryonic stem cells and other mesenchymal stemcells. Stem Cell Rev 2011;7:1–16.
Forsen T, Eriksson J, Tuomilehto J, Reunanen A, Osmond C, Barker D. Thefetal and childhood growth of persons who develop type 2 diabetes. AnnIntern Med 2000;133:176–182.
Gentz JC, Warrner R, Persson BE. Intravenous glucose tolerance, plasmainsulin, free fatty acids and beta-hydroxybutyrate in underweightnewborn infants. Acta Paediatr Scand 1969;58:481–490.
Godfrey KM, Inskip HM, Hanson MA. The long-term effects of prenataldevelopment on growth and metabolism. Semin Reprod Med 2011;29:257–265.
Gonzalez-Ortiz M, Martınez-Abundis E, Balcazar-Munoz BR, Robles-Cervantes JA. Inhibition of cyclooxygenase-1 or -2 on insulin sensitivityin healthy subjects. Horm Metab Res 2001;33:250–253.
Gluckman PD, Hanson MA. Maternal constraint of fetal growth and itsconsequences. Semin Fetal Neonatal Med 2004;9:419–425.
Gluckman PD, Hanson MA. The consequences of being born small—anadaptive perspective. Horm Res 2006;65(Suppl 3):5–14.
Gluckman PD, Hanson MA, Low FM. The role of developmental plasticityand epigenetics in human health. Birth Defects Res C Embryo Today 2011;93:12–18.
Hadlock FP, Deter RL, Harrist RB, Park SK. Fetal abdominal circumference asa predictor of menstrual age. AJR Am J Roentgenol 1982;139:367–370.
Hadlock FP, Harrist RB, Carpenter RJ, Deter RL, Park SK. Sonographicestimation of fetal weight. The value of femur length in addition to headand abdomen measurements. Radiology 1984;150:535–540.
Hales CN, Barker DJ. Type 2 (non-insulin-dependent) diabetes mellitus: thethrifty phenotype hypothesis. Diabetologia 1992;35:595–601.
Hanson MA, Gluckman PD. Developmental origins of health and disease:moving from biological concepts to interventions and policy. Int JGynaecol Obstet 2011;115(Suppl 1):3.
Hanson M, Godfrey KM, Lillycrop KA, Burdge GC, Gluckman PD.Developmental plasticity and developmental origins of non-communicabledisease: theoretical considerations and epigenetic mechanisms. ProgBiophys Mol Biol 2011;106:272–280.
Higaki Y, Mikami T, Fujii N, Koyama K, Seino T, Tanaka K, Goodyear LJ.Oxidative stress stimulates skeletal muscle glucose uptake through aphosphatidylinositol 3-kinase-dependent pathway. Am J Physiol EndocrinolMetab 2008;294:E889–E897.
Hofman PL, Cutfield WS, Robinson EM, Bergman RN, Menon RK,Sperling MA, Gluckman PD. Insulin resistance in short childrenwith intrauterine growth retardation. J Clin Endocrinol Metab 1997;82:402–406.
Howie GJ, Sloboda DM, Kamal T, Vickers MH. Maternal nutritional historypredicts obesity in adult offspring independent of postnatal diet. J Physiol2009;587(Pt 4):905–915.
Hsieh PS, Jin JS, Chiang CF, Chan PC, Chen CH, Shih KC. COX-2-mediatedinflammation in fat is crucial for obesity-linked insulin resistance and fattyliver. Obesity (Silver Spring) 2009;17:1150–1157.
Keeton AB, Bortoff KD, Bennett WL, Franklin JL, Venable DY, Messina JL.Insulin-regulated expression of Egr-1 and Krox20: dependence onERK1/2 and interaction with p38 and PI3-kinase pathways. Endocrinology2003;144:5402–5410.
Kuzawa CW. Adipose tissue in human infancy and childhood: an evolutionaryperspective. Am J Phys Anthropol 1998;(Suppl 27):177–209.
Leonard WR, Robertson ML, Snodgrass JJ, Kuzawa CW. Metaboliccorrelates of hominid brain evolution. Comp Biochem Physiol A Mol IntegrPhysiol 2003;136:5–15.
Liu J, Liu YG, Huang R, Yao C, Li S, Yang W, Yang D, Huang RP. Concurrentdown-regulation of Egr-1 and gelsolin in the majority of human breastcancer cells. Cancer Genomics Proteomics 2007;4:377–385.
Livak KJ, Schmittgen TD. Analysis of relative gene expression data usingreal-time quantitative PCR and the 2(-Delta Delta C(T)) Method.Methods 2001;25:402–408.
Low FM, Gluckman PD, Hanson MA. Developmental plasticity andepigenetic mechanisms underpinning metabolic and cardiovasculardiseases. Epigenomics 2011;3:279–294.
2300 Sukarieh et al.
by guest on June 15, 2016http://hum
rep.oxfordjournals.org/D
ownloaded from
Madsen L, Pedersen LM, Lillefosse HH, Fjaere E, Bronstad I, Hao Q,Petersen RK, Hallenborg P, Ma T, De Matteis R et al. UCP1 inductionduring recruitment of brown adipocytes in white adipose tissue isdependent on cyclooxygenase activity. PLoS One 2010;5:e11391.
Mericq V, Ong KK, Bazaes R, Pena V, Avila A, Salazar T, Soto N, Iniguez G,Dunger DB. Longitudinal changes in insulin sensitivity and secretion frombirth to age three years in small- and appropriate-for-gestational-agechildren. Diabetologia 2005;48:2609–2614.
Morrison JL, Duffield JA, Muhlhausler BS, Gentili S, McMillen IC. Fetal growthrestriction, catch-up growth and the early origins of insulin resistance andvisceral obesity. Pediatr Nephrol 2010;25:669–677.
Roseboom TJ, van der Meulen JH, Osmond C, Barker DJ, Ravelli AC,Schroeder-Tanka JM, van Montfrans GA, Michels RP, Bleker OP.Coronary heart disease after prenatal exposure to the Dutch famine,1944–45. Heart 2000;84:595–598.
Sarsour EH, Sarsour EH, Kalen AL, Veenstra TD, Chaudhuri L,Venkataraman S, Reigan P, Buettner GR, Goswami PC. Manganesesuperoxide dismutase regulates a metabolic switch during themammalian cell cycle. Cancer Res 2012;72:3807–3816.
Shen N, Yu X, Pan FY, Gao X, Xue B, Li CJ. An early response transcriptionfactor, Egr-1, enhances insulin resistance in type 2 diabetes with chronichyperinsulinism. J Biol Chem 2011;286:14508–14515.
Simmons RA. Developmental origins of diabetes: the role of oxidative stress.Best Pract Res Clin Endocrinol Metab 2012;26:701–708.
Simmons DL, Botting RM, Hla T. Cyclooxygenase isozymes: thebiology of prostaglandin synthesis and inhibition. Pharmacol Rev 2004;56:387–437.
Singhal A, Fewtrell M, Cole TJ, Lucas A. Low nutrient intake and early growthfor later insulin resistance in adolescents born preterm. Lancet 2003;361:1089–1097.
Soh SE, Tint MT, Gluckman PD, Godfrey KM, Rifkin-Graboi A, Chan YH,Stunkel W, Holbrook JD, Kwek K, Chong YS et al. Cohort Profile:Growing Up in Singapore Towards healthy Outcomes (GUSTO) birthcohort study. Int J Epidemiol 2013. doi:10.1093/ije/dyt125.
Soto N, Bazaes RA, Pena V, Salazar T, Avila A, Iniguez G, Ong KK, Dunger DB,Mericq M. Insulin sensitivity and secretion are related to catch-up growth insmall-for-gestational-age infants at age 1 year: results from a prospectivecohort. J Clin Endocrinol Metab 2003;88:3645–3650.
Sung HY, Guan H, Czibula A, King AR, Eder K, Heath E, Suvarna SK,Dower SK, Wilson AG, Francis SE et al. Human tribbles-1 controlsproliferation and chemotaxis of smooth muscle cells via MAPK signalingpathways. J Biol Chem 2007;282:18379–18387.
Tarry-Adkins JL, Ozanne SE. Mechanisms of early life programming: currentknowledge and future directions. Am J Clin Nutr 2011;94:(6Suppl):1765S–1771S.
Wang HS, Hung SC, Peng ST, Huang CC, Wei HM, Guo YJ, Fu YS, Lai MC,Chen CC. Mesenchymal stem cells in the Wharton’s jelly of the humanumbilical cord. Stem Cells 2004;22:1330–1337.
Yokoyama T, Nakamura T. Tribbles in disease: signaling pathways importantfor cellular function and neoplastic transformation. Cancer Sci 2011;102:1115–1122.
Yu X, Shen N, Zhang ML, Pan FY, Wang C, Jia WP, Liu C, Gao Q, Gao X,Xue B et al. Egr-1 decreases adipocyte insulin sensitivity by tilting PI3K/Akt and MAPK signal balance in mice. EMBO J 2011;30:3754–3765.
EGR-1 pathways in MSCs from SGA babies 2301
by guest on June 15, 2016http://hum
rep.oxfordjournals.org/D
ownloaded from
Related Documents


![Early intrauterine development of mixed giant … · Early intrauterine development of mixed giant ... but with intrauterine death at 29 weeks [5]. Fetal . Early intrauterine development](https://static.cupdf.com/doc/110x72/5b63022f7f8b9ade588b8aac/early-intrauterine-development-of-mixed-giant-early-intrauterine-development.jpg)

