J Math Chem (2009) 46:820–833 DOI 10.1007/s10910-009-9552-2 ORIGINAL PAPER Molecular modeling of wine polyphenols V. Rastija · S. Nikoli´ c · M. Medi´ c-Šari´ c Received: 13 October 2006 / Accepted: 9 May 2009 / Published online: 22 July 2009 © Springer Science+Business Media, LLC 2009 Abstract Due to wide range of health effects of wine polyphenols, it is important to investigate the relationship between their structure and physical properties (quanti- tative structure–property relationship, QSPR). We have investigated linear, nonlinear (polynomial), and multiple linear relationships between given topological indices and molecular properties of main pharmacological active components of wine, such as molecular weight (MW), van der Waals volume (Vw), molar refractivity (MR), polar molecular surface area (PSA) and lipophilicity (log P ). Partition coefficient (log P ) was calculated using three different computer program (CLOGP, ALOGPS and MLOGP). The best models were achieved using the MLOGP program. Topological indices used for correlation analysis include: the Wiener index, W (G); connectivity indices, χ (G); the Balaban index, J (G); information-theoretic index, I (G); and the Schultz index, MTI(G). QSPR was performed on the set of 19 polyphenols and, particularly, on the group of phenolic acids, and on the group of flavonoids with resveratrol. The connectiv- ity index has been successfully used for describing almost all parameters. Significant correlations were achieved between the Wiener index and van der Waals volume, as well as molecular weight. V. Rastija Faculty of Agriculture, University J J. Strossmayer, Trg Sv. Trojstva 3, 31000 Osijek, Croatia e-mail: [email protected] S. Nikoli´ c(B ) The Rugjer Boškovi´ c Institute, Bijenicka cesta 54, P.O. Box 180, 10002 Zagreb, Croatia e-mail: [email protected] M. Medi´ c-Šari´ c Department of Pharmaceutical Chemistry, Faculty of Pharmacy and Biochemistry, University of Zagreb, A. Kovaˇ ci´ ca 1, 10000 Zagreb, Croatia e-mail: [email protected] 123

Welcome message from author
This document is posted to help you gain knowledge. Please leave a comment to let me know what you think about it! Share it to your friends and learn new things together.
Transcript
J Math Chem (2009) 46:820–833DOI 10.1007/s10910-009-9552-2
ORIGINAL PAPER
Molecular modeling of wine polyphenols
V. Rastija · S. Nikolic · M. Medic-Šaric
Received: 13 October 2006 / Accepted: 9 May 2009 / Published online: 22 July 2009© Springer Science+Business Media, LLC 2009
Abstract Due to wide range of health effects of wine polyphenols, it is importantto investigate the relationship between their structure and physical properties (quanti-tative structure–property relationship, QSPR). We have investigated linear, nonlinear(polynomial), and multiple linear relationships between given topological indices andmolecular properties of main pharmacological active components of wine, such asmolecular weight (MW), van der Waals volume (Vw), molar refractivity (MR), polarmolecular surface area (PSA) and lipophilicity (log P). Partition coefficient (log P) wascalculated using three different computer program (CLOGP, ALOGPS and MLOGP).The best models were achieved using the MLOGP program. Topological indices usedfor correlation analysis include: the Wiener index, W (G); connectivity indices, χ (G);the Balaban index, J (G); information-theoretic index, I (G); and the Schultz index,MTI(G). QSPR was performed on the set of 19 polyphenols and, particularly, on thegroup of phenolic acids, and on the group of flavonoids with resveratrol. The connectiv-ity index has been successfully used for describing almost all parameters. Significantcorrelations were achieved between the Wiener index and van der Waals volume, aswell as molecular weight.
V. RastijaFaculty of Agriculture, University J J. Strossmayer, Trg Sv. Trojstva 3, 31000 Osijek, Croatiae-mail: [email protected]
S. Nikolic (B)The Rugjer Boškovic Institute, Bijenicka cesta 54, P.O. Box 180, 10002 Zagreb, Croatiae-mail: [email protected]
M. Medic-ŠaricDepartment of Pharmaceutical Chemistry, Faculty of Pharmacy and Biochemistry,University of Zagreb, A. Kovacica 1, 10000 Zagreb, Croatiae-mail: [email protected]
123
J Math Chem (2009) 46:820–833 821
Keywords Polyphenols · Topological indices · Molecular descriptors ·Physico-chemical properties · QSPR modeling · Molecular modeling
1 Introduction
Polyphenols are secondary plant metabolites and they have been implicated in numberof varied roles including protection against ultraviolet light, pigmentation and defenceagainst pathogenic microorganisms [1]. Wines, especially red wines contain a widerange of polyphenols that include phenolic acids, the trihydroxystilbene resveratrol,the flavonols (e.g. quercetin and myricetin), flavanols (e.g. catechin and epicatechin),as well as polymers of the latter, defined as procyanidins, and anthocyanins that are thepigments responsible for the colour of red wines. The processes of viticulture and vini-fication determine the content and profile of polyphenols in wine. Vineyard factorsare: variety, quality, climate, ageing, geographical origin and diseases. Vinificationfactors are length of grape skin contact and temperature [2]. White wines are usuallymade from the free running juice, without the grape mash, having no contact with thegrape skins, and this is the main reason for relatively low phenolic content and lowerantioxidant activity of white wine in comparison to the red wine [3]. Polyphenols playa major role in wine quality. They are responsible for sensory characteristics such ascolour and bitter flavour of wine. Most of them show beneficial physiological proper-ties including cardioprotective, anticarcinogenic, anti-inflammatory, and antioxidantactivities [4,5]. Resveratrol is thought to be effective in lowering serum lipids andinhibiting platelet aggregation [6].
In our research we used an axiom that molecular structure of polyphenols is the basisof their molecular properties—from chemical and physical properties to the certainbiological activity [7]. Molecular structure is described with a number of molecularstructural parameters that can be calculated from molecular topology, e.g. topologicalindices. The topological indices, as nonempirical structural parameters, are convenienttools to formulate direct relationships between chemical structure and physical, chem-ical and biological properties of molecules [8]. Several quantitative structure–propertyrelationship (QSPR) models based on topological indices for modeling the propertiesof flavonoid glycosides isolated from Paliurus spina-christi Mill. were evaluated andthe best models were obtained using the connectivity index (χ ) [9].
In this work we have carried out the quantitative structure–property relationshipto estimate five physico-chemical properties of wine polyphenols: molecular weight(MW), the logarithm of n-octanol/water partition coefficient (log P), van der Waalsvolume (Vw), molar refractivity (MR), and polar surface area (PSA).
Lipophilicity is a physico-chemical property of primary interest for the medici-nal chemists determining pharmacokinetic and pharmacodinamic behaviour of drugs.Therefore, quantitative descriptor, log P , is one of the most important pharmacoki-netic parameter, which describes the oral absorption, cell uptake, protein binding,blood-brain penetration, metabolism and toxicity (ADME/Tox processes) of bioac-tive substances. In such a manner, some flavonoids are known to have low lipo-philicity making it difficult for them to penetrate into the cells [10]. Accompaniedby traditionally “shake flask” method, frequently used experimental methods for the
123
822 J Math Chem (2009) 46:820–833
determination of partition coefficient are chromatography and electrometric titration[11,12]. Moreover, a number of computer programs for prediction of lipophilicity,based on different theoretical approaches (CLOGP, ALOGPS, MLOGP, XLOGP, Log-Kow, etc.) have been developed [13].
The van der Waals volume (Vw) is a widely used descriptor in modeling physico-chemical properties. Values of Vw are used in quantitative structure–activity relation-ship modeling to explain factors affecting the biological activity of molecule. Also,the complementary of the shape of drug molecule and receptor cavity is importantfor the selectivity. For this reasons, van der Waals volume plays a central role in drugdesign [14]. Vw of single molecule is calculated according to the method describedby Moriguchi et al. [15]. Volumes of spheres are calculated using the atomic radii andthe overlapping volumes are subtracted.
The molar refractivity (MR) is a constitutive-additive property used in QSPR/QSARthat is calculated by the Lorenz-Lorentz formula:
M R = (n2 − 1)
(n2 + 2)
(M
d
)(1)
where n is the index of refraction, M is the molecular weight, and d is the density of amolecule. For a radiation of infinite wavelength, the molar refractivity represents thereal volume of the molecules contained in one mole of the substance. MR as a molecu-lar descriptor in QSAR studies correlates with lipophilicity, molar volume, and stericbulk [16]. Molar refractivity is related to the London dispersive forces that act in thedrug–receptor interaction.
Polar surface area (PSA) of a molecule is defined as the area of its van der Waalssurface that arises from oxygen or nitrogen atoms or hydrogen atoms attached to theoxygen or nitrogen atoms. PSA is useful parameter for prediction of drug transportproperties, such as intestinal absorption [17] or blood-brain barrier penetration [18].
In this work, we have investigated linear, polynomial and multiple linear rela-tionships between five topological indices (the Wiener index, connectivity index, theBalaban index, information-theoretic index and the Schultz index) and selected prop-erties of polyphenols, main pharmacological active components of wine. Since thatthe physico-chemical properties of polyphenols determine their biological activitiesthis work may be a preliminary study for the future QSAR investigation.
2 Materials and methods
2.1 Data set
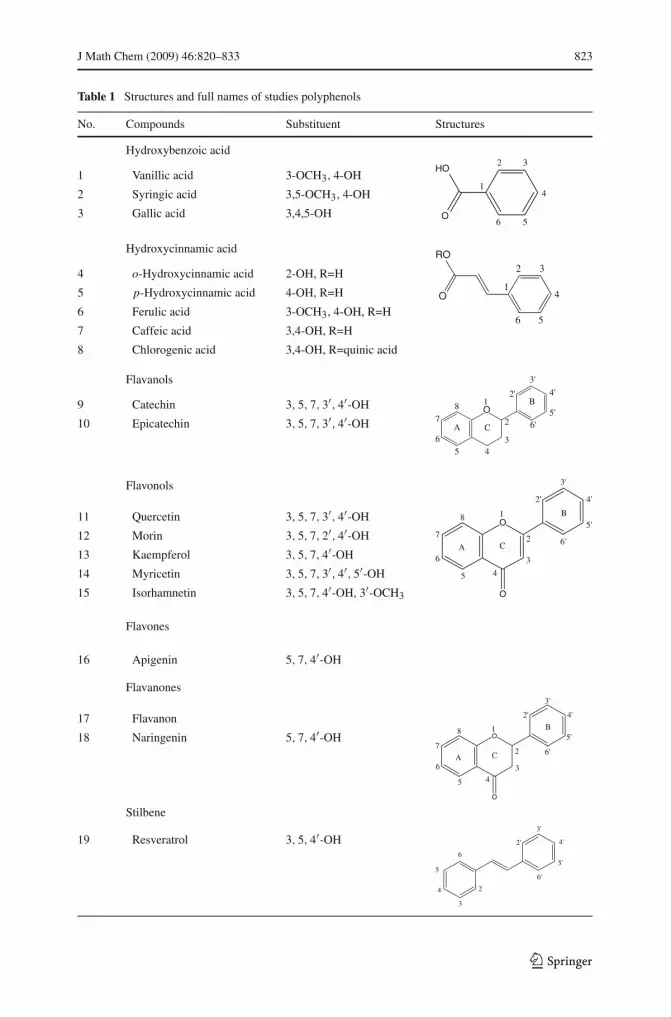
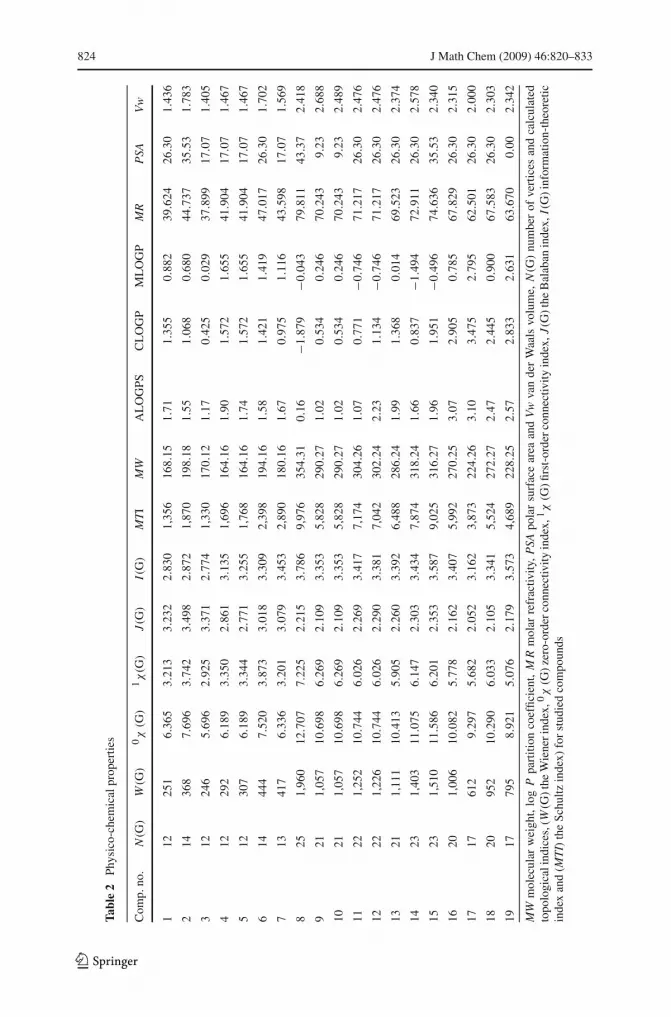
Data set contains nineteen polyphenols that comprises eight phenolic acids, ten flavo-noids, and one stillbene—resveratrol that were analyzed in Croatian wine by the thin-layer chromatography (TLC) and high-performance liquid chromatography (HPLC)[19]. List and structures of investigated polyphenols are given in Table 1. Calculatedtopological indices and selected physico-chemical properties for studied compoundsare given in Table 2. Regression analysis was performed on a set of all nineteencompounds, then separately, on the set of eight phenolic acids, and on the set often flavonoids with resveratrol.
123
J Math Chem (2009) 46:820–833 823
Table 1 Structures and full names of studies polyphenols
No. Compounds Substituent Structures
Hydroxybenzoic acid
O
HO
1
2 3
4
56
1 Vanillic acid 3-OCH3, 4-OH
2 Syringic acid 3,5-OCH3, 4-OH
3 Gallic acid 3,4,5-OH
Hydroxycinnamic acid
O
RO
1
2 3
4
56
4 o-Hydroxycinnamic acid 2-OH, R=H
5 p-Hydroxycinnamic acid 4-OH, R=H
6 Ferulic acid 3-OCH3, 4-OH, R=H
7 Caffeic acid 3,4-OH, R=H
8 Chlorogenic acid 3,4-OH, R=quinic acid
Flavanols
O
A
B1
2
345
6
78
2'
3'
4'
5'6'C
9 Catechin 3, 5, 7, 3′, 4′-OH
10 Epicatechin 3, 5, 7, 3′, 4′-OH
Flavonols
O
O
A C
B1
2
3
45
6
7
8
2'
3'
4'
5'
6'
11 Quercetin 3, 5, 7, 3′, 4′-OH
12 Morin 3, 5, 7, 2′, 4′-OH
13 Kaempferol 3, 5, 7, 4′-OH
14 Myricetin 3, 5, 7, 3′, 4′, 5′-OH
15 Isorhamnetin 3, 5, 7, 4′-OH, 3′-OCH3
Flavones
16 Apigenin 5, 7, 4′-OH
Flavanones
O
O
A C
B1
345
6
7
8
2'
3'
4'
5'
6'2
17 Flavanon
18 Naringenin 5, 7, 4′-OH
Stilbene
2
3
4
5
6
2'
3'
4'
5'
6'
19 Resveratrol 3, 5, 4′-OH
123
824 J Math Chem (2009) 46:820–833
Tabl
e2
Phys
ico-
chem
ical
prop
ertie
s
Com
p.no
.N
(G)
W(G
)0χ
(G)
1χ
(G)
J(G
)I(
G)
MT
IM
WA
LO
GPS
CL
OG
PM
LO
GP
MR
PSA
Vw
112
251
6.36
53.
213
3.23
22.
830
1,35
616
8.15
1.71
1.35
50.
882
39.6
2426
.30
1.43
6
214
368
7.69
63.
742
3.49
82.
872
1,87
019
8.18
1.55
1.06
80.
680
44.7
3735
.53
1.78
3
312
246
5.69
62.
925
3.37
12.
774
1,33
017
0.12
1.17
0.42
50.
029
37.8
9917
.07
1.40
5
412
292
6.18
93.
350
2.86
13.
135
1,69
616
4.16
1.90
1.57
21.
655
41.9
0417
.07
1.46
7
512
307
6.18
93.
344
2.77
13.
255
1,76
816
4 .16
1.74
1.57
21.
655
41.9
0417
.07
1.46
7
614
444
7.52
03.
873
3.01
83.
309
2,39
819
4.16
1.58
1.42
11.
419
47.0
1726
.30
1.70
2
713
417
6.33
63.
201
3.07
93.
453
2,89
018
0.16
1.67
0.97
51.
116
43.5
9817
.07
1.56
9
825
1,96
012
.707
7.22
52.
215
3.78
69,
976
354.
310.
16−1
.879
−0.0
4379
.811
43.3
72.
418
921
1,05
710
.698
6.26
92.
109
3.35
35,
828
290.
271.
020.
534
0.24
670
.243
9.23
2.68
8
1021
1,05
710
.698
6.26
92.
109
3.35
35,
828
290.
271.
020.
534
0.24
670
.243
9.23
2.48
9
1122
1,25
210
.744
6.02
62.
269
3.41
77,
174
304.
261.
070.
771
−0.7
4671
.217
26.3
02.
476
1222
1,22
610
.744
6.02
62.
290
3.38
17,
042
302.
242.
231.
134
−0.7
4671
.217
26.3
02.
476
1321
1,11
110
.413
5.90
52.
260
3.39
26,
488
286.
241.
991.
368
0.01
469
.523
26.3
02.
374
1423
1,40
311
.075
6.14
72.
303
3.43
47,
874
318.
241.
660.
837
−1.4
9472
.911
26.3
02.
578
1523
1,51
011
.586
6.20
12.
353
3.58
79,
025
316.
271.
961.
951
−0.4
9674
.636
35.5
32.
340
1620
1,00
610
.082
5.77
82.
162
3.40
75,
992
270.
253.
072.
905
0.78
567
.829
26.3
02.
315
1717
612
9.29
75.
682
2.05
23.
162
3,87
322
4.26
3.10
3.47
52.
795
62.5
0126
.30
2.00
0
1820
952
10.2
906.
033
2.10
53.
341
5,52
427
2.27
2.47
2.44
50.
900
67.5
8326
.30
2.30
3
1917
795
8.92
15.
076
2.17
93.
573
4,68
922
8.25
2.57
2.83
32.
631
63.6
700.
002.
342
MW
mol
ecul
arw
eigh
t,lo
gP
part
ition
coef
ficie
nt,
MR
mol
arre
frac
tivity
,PSA
pola
rsu
rfac
ear
eaan
dV
wva
nde
rW
aals
volu
me,
N(G
)nu
mbe
rof
vert
ices
and
calc
ulat
edto
polo
gica
lind
ices
,(W
(G)t
heW
iene
rind
ex,0
χ(G
)zer
o-or
derc
onne
ctiv
ityin
dex,
1χ
(G)fi
rst-
orde
rcon
nect
ivity
inde
x,J
(G)t
heB
alab
anin
dex,
I(G
)inf
orm
atio
n-th
eore
ticin
dex
and
(MT
I)th
eSc
hultz
inde
x)fo
rst
udie
dco
mpo
unds
123
J Math Chem (2009) 46:820–833 825
2.2 Calculation of topological indices
In this paper we have investigated whether five topological indices (the Wiener index,connectivity index, the Balaban index, information-theoretic index and the Schultzindex) are applicable to QSPR studies of polyphenols from wines. All indices usedin our work were calculated using TAM program [20]. The total number of vertices,N (G), in the molecular graph was considered as a topological parameter. It is identicalto the number of atoms in the hydrogen-depleted molecular structure.
2.3 Calculation of physico-chemical properties of polyphenols
2.3.1 Calculation of partition coefficient, log P
Molecular lipophilicity was calculated using three computer programs based on dif-ferent theoretical approach (CLOGP, ALOGPS and MLOGP). In this work, SMILES[21] (Simplified Molecular Input Line Entry System) notation created by the structuredrawing program CambridgeSoft‘s ChemDrawUltra was used as chemical structureinput for all three programs.
a) ALOGPS 2.1
This program provides interactive on-line estimation of log P and aqueous solubil-ity of compounds [22]. The program to predict lipophilicity was developed usingthe Efficient Partition Algorithm [23] and an Associative Neural Network (ASNN)approach [24]. This method combines electronic and topological characters to predictlipophilicity of the analyzed molecules.
b) CLOGP
Mannhold and van de Waterbeemd [25] described these programs as substructureapproaches where the final log Kow is determined by summing the single-atom orfragment contributions. The calculation result is accompanied by the picture of chem-ical structure as generated by the DEPICT algorithm. CLOGP values for studiedcompounds were calculated with the program accessible via Internet [26], workingwith the Hansch-Leo’s, “fragment constant” method [27].
c) MLOGP
This method for predicting log P values was developed by Moriguchi et al. [28].The method begins with a straightforward counting of lipophilic atoms (all carbonsand halogens with a multiplier rule for normalizing their contributions) and hydro-philic atoms (all nitrogen and oxygen atoms). The Moriguchi method then applies 11correction factors, four that increase the hydrophobicity, and seven that increase thelipophilicity.
123
826 J Math Chem (2009) 46:820–833
The MLOGP program is included in the DRAGON program [29], the software forthe calculation of a large number of molecular descriptors. In our work we used aDRAGON Evaluation version— Software version 5.3 downloaded from Internet [30].
2.3.2 Calculation of other physico-chemical properties
Molecular weight (MW/g mol−1), molar refractivity (M R/m3 mol−1), and polar sur-face area (PSA/Å2) were calculated using DRAGON Evaluation version. Van derWaals volume (Vw/Å3) was calculated according to the method described by Morig-uchi et al. [15].
2.4 Regression analysis
The statistical analysis was performed using STATISTICA 6.0 (StatSoft, Inc.) andCROMRsel (Rugjer Boškovic Institute, Zagreb) [31]. We have investigated linear,nonlinear (polynomial) and multivariate relationships between given topological indi-ces and selected properties of polyphenols. To test the quality and accuracy of derivedmodels, following statistical parameters were used: correlation coefficient (R), stan-dard deviation of regression (S) and F-test. Standard deviation of regression (S) wascalculated using a following equation:
S =√∑n
i = 1 (yi − y,i )
2
n(2)
where n denoted the total number of cases (molecules); yi and y,i denote the calcu-
lated value and value obtained by regression model. The validity of the QSPR modelwas tested in a leave-one-out cross-validation procedure and marked by the cross-validation correlation coefficient (Rcv) and standard error of estimate (Scv). The bestpossible QSPR models were presented in this paper.
3 Results and discussion
3.1 Molecular weight, MW
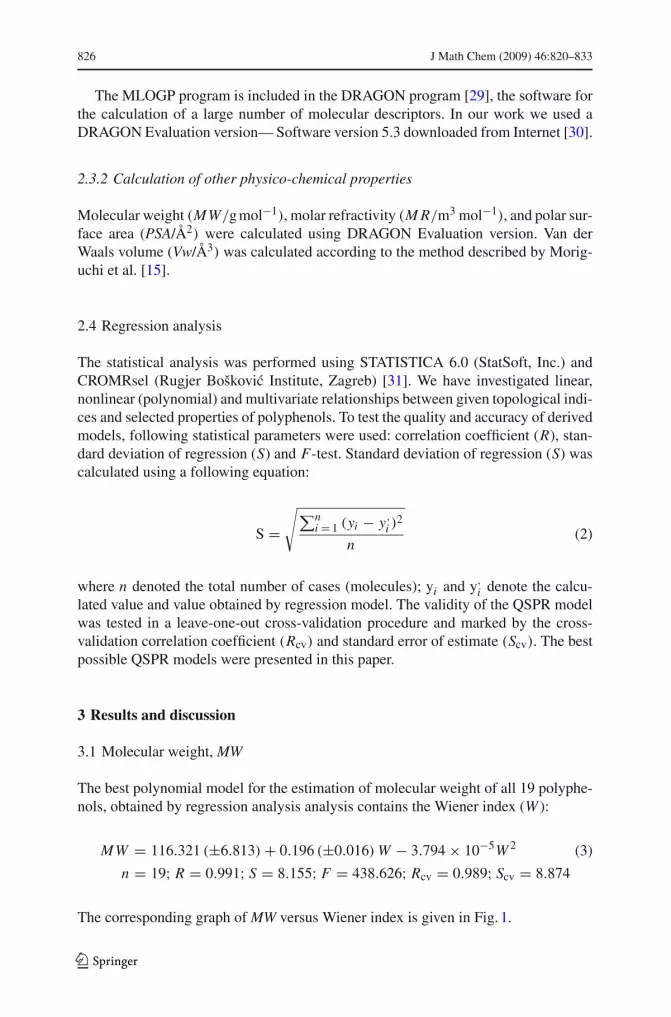
The best polynomial model for the estimation of molecular weight of all 19 polyphe-nols, obtained by regression analysis analysis contains the Wiener index (W ):
MW = 116.321 (±6.813) + 0.196 (±0.016) W − 3.794 × 10⁻⁵W 2 (3)
n = 19; R = 0.991; S = 8.155; F = 438.626; Rcv = 0.989; Scv = 8.874
The corresponding graph of MW versus Wiener index is given in Fig. 1.
123
J Math Chem (2009) 46:820–833 827
400 800 1200 1600 2000
W(G)
150
180
210
240
270
300
330
360
MW
/g m
ol-1
Fig. 1 Relationship between molecular weight (MW) of 19 polyphenols and Wiener index (W (G)) (secondorder polynomial regression, Eq. 3)
Also, good model was obtained by simple linear correlation with the Wiener indexfor the set of eight phenolic acids
MW = 140.601(±4.712) + 0.109(±0.006)W (4)
n = 8; R = 0.991; S = 8.214; F = 313.2; Rcv = 0.987, Scv = 11.240
The Wiener index, which is the sum of all the edges between all pairs of vertices inchemical graph, is highly related with molecular weight as additive properties that canbe expressed as a sum of atomic contributions.
For a set of compounds that includes 10 flavonoids and resveratrol, the best modelwas obtained by linear correlation of MW with the zero-order connectivity index (0χ):
MW = −136.282 (±37.006) + 40.175 (±3.545)0 χ (5)
n = 11; R = 0.967; S = 7.717; F = 128.429; Rcv = 0.939, Scv = 11.558
3.2 Partition coefficient
Between the three different computer programs for calculation of partition coefficient(CLOGP, ALOGPS and MLOGP), the best models were achieved using the MLOGPprogram.
The physico-chemical properties of polyphenols determine their in vivo character-istics of absorption and distribution. Only the molecules of appropriate lipophilicitycan diffuse across the phospholipids membrane. The total size of molecule, molec-ular weight, the three-dimensional shape, the number of functional groups, and the
123
828 J Math Chem (2009) 46:820–833
-2.0 -1.5 -1.0 -0.5 0.0 0.5 1.0 1.5 2.0 2.5 3.0 3.5
MLOGP
-2.0
-1.5
-1.0
-0.5
0.0
0.5
1.0
1.5
2.0
2.5
3.0
ML
OG
P va
lues
cal
cula
ted
by E
q. 6
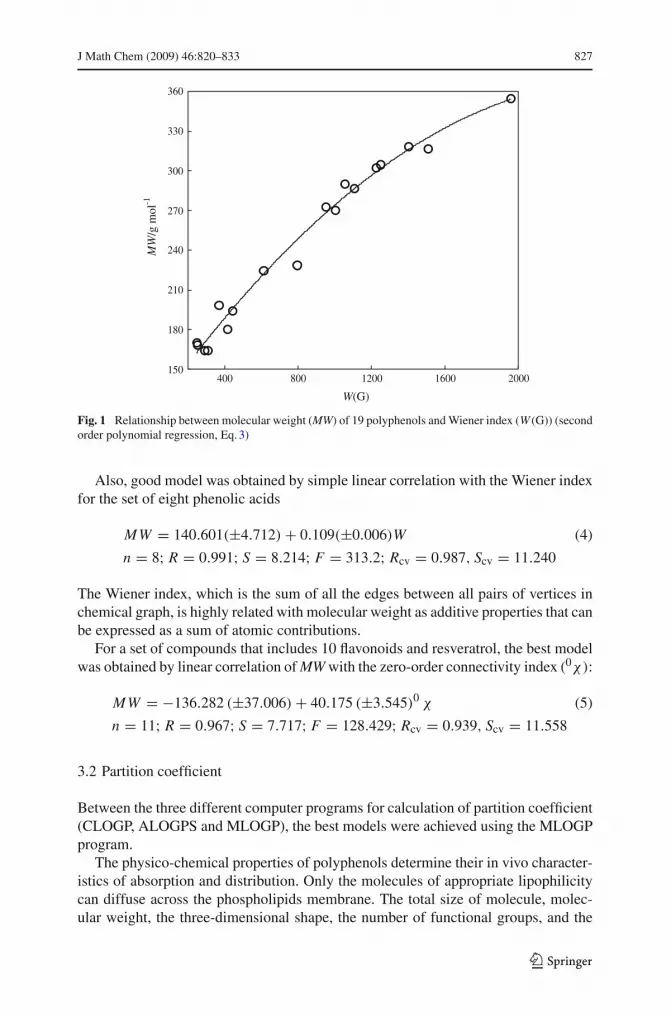
Fig. 2 A plot of the log P values of studied 19 polyphenols calculated using MLOGP method against theirvalues obtained by Eq. 6
number of ring substituents affect on lipophilicity. Among the studied polyphenols,the lowest log P value has myricetin (MLOGP=−1.494) and the highest value hasflavanon (MLOGP=2.795). p-Hydroxycinnamic acid and o-hydroxycinnamic acidare the most lipophilic phenolic acids (MLOGP=1.655), whereas chlorogenic acidhas the lowest lipophilicity (MLOGP=−0.043).
Multiple regression analysis found that the tri-parametric model containing thenumber of atoms (N ), the information-theoretic index I (G), and first-order connec-tivity index (1χ) gives the best results for the estimation of MLOGP values of 19polyphenols studied
MLOGP = −1.44 (±1.023) − 0.923 (±0.065) N + 2.116 (±0.382) I
+ 2.291 (±0.208)1χ (6)
n = 19; R = 0.972; S = 0.259; F = 84.604; Rcv = 0.953; Scv = 0.374
The plot of log P values calculated by MLOGP program versus MLOGP values cal-culated by Eq. 6 for studied 19 polyphenols is shown in Fig. 2.
Polynomial regression resulted in the following statistically significant model forthe partition coefficient of phenolic acids using the information-theoretic index:
123
J Math Chem (2009) 46:820–833 829
MLOGP = −58.747 (±8.104) + 37.170 (±5.031) I − 5.727 (±0.774) I 2 (7)
n = 8; R = 0.957; S = 0.182; F = 27.4; Rcv = 0.837; Scv = 0.544.
The regression analysis, performed over the set of ten flavonoids with resveratrol,yielded the following bi-parametric model that contains the zero-order connectivityindex (0χ) in combination with the number of atoms (N):
MLOGP = 9.762 (±0.847) − 1.101 (±0.088) N + 1.281 (±0.238)0 χ (8)
n = 11; R = 0.996; S = 0.119; F = 462.679; Rcv = 0.986; Scv = 0.253
The obtained models demonstrate the significance of connectivity index for the mod-eling of lipophilicity. Among the existing topological indices, the connectivity indexis one of the most commonly used and it has found wide applications in QSPR/QSARstudies [32,33]. Derived directly from the structural formula, given index encodeimportant structural features such as size, branching, unsaturation, cyclicity, andheteroatom content. The valence connectivity index has been successfully used fordescribing of lipophilicity in sets of closely related compounds [34] and heterogeneouscompounds [35]. In study of Medic-Šaric et al. [9], application of this descriptor todata set of 15 flavonoids and flavonoid glycosides resulted in excellent correlationwith log P(R = 0, 993; F = 926.046).
3.3 Molar refractivity, MR
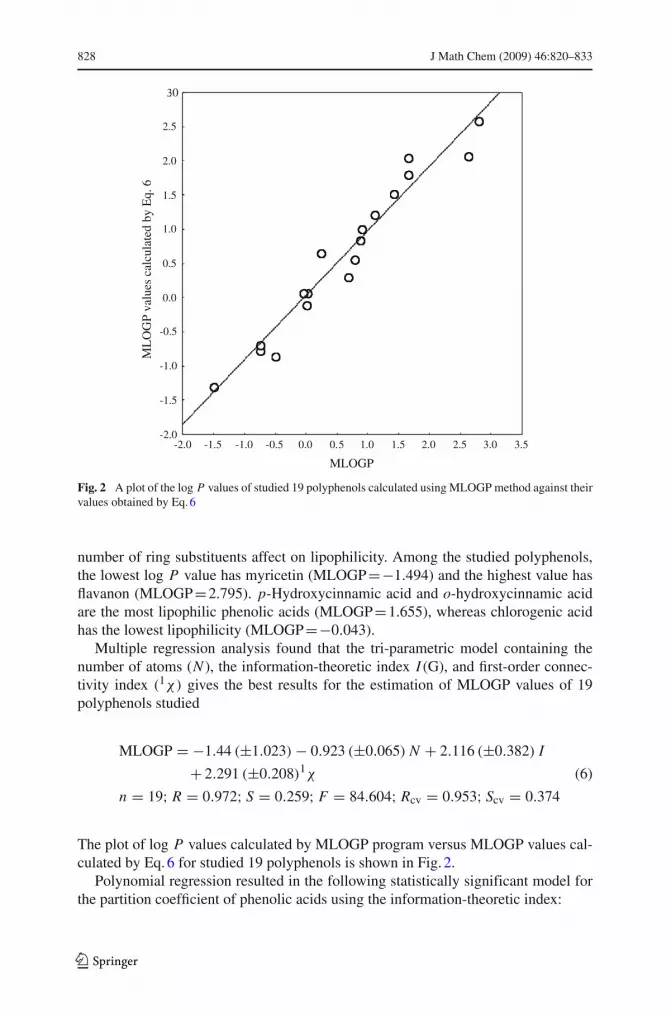
The simple linear correlation obtained between the values of the first-order connec-tivity index (1χ) and values of the molar refractivity (MR) for the data set of 19polyphenols gave the excellent results in accordance with the following expression:
M R = 8.360 (±1.885) + 10.17 (±0.359)1 χ (9)
n = 19; R = 0.990; S = 2.010; F = 800.712; Rcv = 0.987; Scv = 0.2342
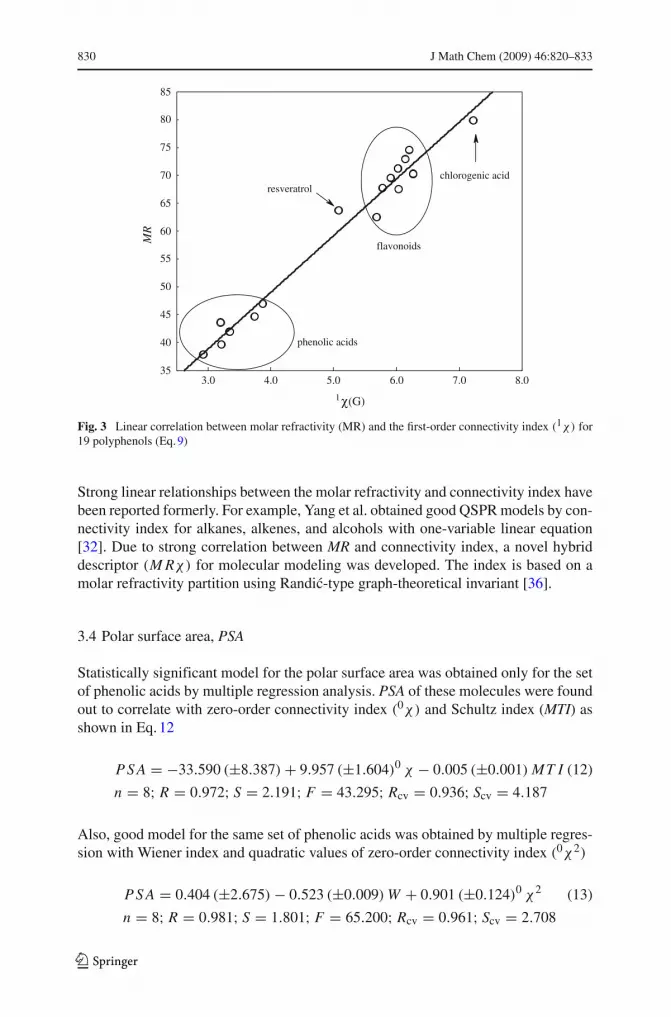
Corresponding graphs of linear correlations between the molar refractivity (MR) andfirst-order connectivity index (1χ) calculated for above-mentioned data set is given inFig. 3.
The best QSPR model for a data set of phenolic acids is also based on the first-orderconnectivity index:
M R = 9.742 (±1.525) + 9.67 (±0.374)1 χ (10)
n = 8; R = 0.996; S = 1.195; F = 667.529; Rcv = 0.992; Scv = 1.831
Significant correlation was established between zero-order connectivity index (0χ)
and molar refractivity of 11 flavonoids
M R = 20.434 (±3.681) + 4.686 (±0.353)0 χ (11)
n = 11; R = 0.975; S = 0.768; F = 176.564; Rcv = 0.946; Scv = 1.163
123
830 J Math Chem (2009) 46:820–833
3.0 4.0 5.0 6.0 7.0 8.0
1χ(G)
35
40
45
50
55
60
65
70
75
80
85
MR
resveratrolchlorogenic acid
flavonoids
phenolic acids
Fig. 3 Linear correlation between molar refractivity (MR) and the first-order connectivity index (1χ) for19 polyphenols (Eq. 9)
Strong linear relationships between the molar refractivity and connectivity index havebeen reported formerly. For example, Yang et al. obtained good QSPR models by con-nectivity index for alkanes, alkenes, and alcohols with one-variable linear equation[32]. Due to strong correlation between MR and connectivity index, a novel hybriddescriptor (M Rχ) for molecular modeling was developed. The index is based on amolar refractivity partition using Randic-type graph-theoretical invariant [36].
3.4 Polar surface area, PSA
Statistically significant model for the polar surface area was obtained only for the setof phenolic acids by multiple regression analysis. PSA of these molecules were foundout to correlate with zero-order connectivity index (0χ) and Schultz index (MTI) asshown in Eq. 12
P S A = −33.590 (±8.387) + 9.957 (±1.604)0 χ − 0.005 (±0.001) MT I (12)
n = 8; R = 0.972; S = 2.191; F = 43.295; Rcv = 0.936; Scv = 4.187
Also, good model for the same set of phenolic acids was obtained by multiple regres-sion with Wiener index and quadratic values of zero-order connectivity index (0χ2)
P S A = 0.404 (±2.675) − 0.523 (±0.009) W + 0.901 (±0.124)0 χ2 (13)
n = 8; R = 0.981; S = 1.801; F = 65.200; Rcv = 0.961; Scv = 2.708
123
J Math Chem (2009) 46:820–833 831
Very weak correlation with other topological indices refers to the fact that PSA dependson conformation and possible internal hydrogen bonding [37].
3.5 Van der Waals volume
The best polynomial model for the estimation of van der Waals volume (Vw) wasobtained by regression analysis based on Wiener index (W ) for a set of all 19 poly-phenols:
V w = 0.893 (±0.087) + 0.002 (±0.0002) W − 8 × 10⁻⁷W 2 (14)
n = 19; R = 0.971; S = 0.104; F = 133.662; Rcv = 0.937; Scv = 0.156
Good correlation between the van der Waals volume and Wiener index could be ratio-nalized by the fact that the Wiener index is convenient measure of compactness ofthe molecule [6,7]. Namely, the Wiener index is roughly proportional to the van derWaals surface area of the respective molecule [38].
Linear regression analysis was found suitable to describe the relation between thevan der Waals volume (Vw) and zero-order connectivity index (0χ) for the set ofphenolic acids:
V w = 0.585 (±0.068) + 0.146 (±0.009)0 χ (15)
n = 8; R = 0.989; S = 0.046; F = 271.585; Rcv = 0.978; Scv = 0.108
The best relation for the estimation the van der Waals volumes of flavonoids and res-veratrol was obtained by multiple linear regression analysis using Wiener index (W )
and Schultz index (MTI) as descriptors:
V w = 2.118 (±0.099) + 3.9 × 10⁻³(±5.9 × 10⁻⁴)W
−6.3 × 10⁻⁴(±1.1 × 10⁻⁴)MT I (16)
n = 11; R = 0.937; S = 0.059; F = 29.026; Rcv = 0.854; Scv = 0.089
4 Conclusions
QSPR studies are powerful tool for estimation the physical, pharmacological, and toxi-cological properties of chemical compounds. They have been frequently used in physi-cal, organic, analytical, pharmaceutical, and medicinal chemistry. The main advantageof QSPR techniques is possibility of estimating the properties of compounds whenthe experimental determination is very complex and expensive. The main hypothesisin the QSPR and QSAR approach is that all properties of a chemical substance arestatistically related to its molecular structure. Since the topological indices can bederived directly from the molecular structure, without any experimental effort, theyhave received great attention in QSPR/QSAR studies.
In this paper, significant regression equations were obtained by linear, polynomialand multiple linear regression analysis for examined physico-chemical properties of
123
832 J Math Chem (2009) 46:820–833
wine polyphenols. Models established are statistically stable. To achieve a better QSPRmodels for some properties, each group of polyphenols (flavonoids and phenolic acid)was investigated separately.
The best regression correlations were based on the following descriptor: the Wienerindex (W ), connectivity index (χ ), the Schultz index (MTI), and information theoreticindex (I ). Good correlations were obtained between Wiener index and van der Waalsvolume, as well as, molecular weight by linear and polynomial regression analysis.Strong relationship of connectivity index and molar refractivity was confirmed bysimple linear regression for all three different set of substances.
We calculated the log P values of studied polyphenols using three different com-puter programs and correlated them with topological indices. The best model forlipophilicity (MLOGP) was obtained for the group of flavonoids with resveratrol,using the zero-order connectivity index in combination with the number of atoms inmolecule.
Lipophilicity, van der Waals volume, molar refractivity and polar surface area areuseful parameters for structure–activity analysis that can be easily calculated for apolyphenols from wine and used for the modeling of their pharmacological proper-ties, so, here we give a preliminary study for the future QSAR investigation.
Acknowledgments This work was supported in part by grants nos. 098-1770495-2919 and 022-1770495-2901 (S.N.), no. 079-0000000-3211 (V.R.), and no. 006-0061117-1237 (M.M.-Š.), awarded by the Ministryof Science, Education, and Sport of the Republic of Croatia.
References
1. E.G.W.M. Schijlen, C.H.Ric de Vos, A.J. van Tunen, A.G. Bovy, Phytochemistry 65, 2631 (2004)2. J. Burns, P.T. Gardner, D. Matthews, G.G. Duthie, M.E.J. Lean, A. Crozier, J. Agric. Food Chem.
49, 5797 (2001)3. B. Fuhrman, N. Volkova, A. Suraski, M. Aviram, J. Agric. Food Chem. 49, 3164 (2001)4. G. Mazza, L. Fukumoto, P. Delaquis, B. Girard, B. Ewert, J. Agric. Food Chem. 47, 4009 (1999)5. N. Al-Awwadi, J. Azay, P. Poucheret, G. Cassanas, M. Krosniak, C. Auger, F. Gasc, J.-M. Mouanet,
G. Cros, P.-L. Teissedre, J. Agric. Food Chem. 52, 1008 (2004)6. C.R. Pace-Asciak, S. Hahn, E.P. Diamandis, G. Soleas, D.M. Goldberg, Clin. Chim. Acta
235, 207 (1995)7. N. Trinajstic, S. Nikolic, B. Lucic, D. Amic, Acta Pharm. 45, 24 (1996)8. N. Trinajstic, Chemical Graph Theory (CRC Press, Boca Raton, 1992)9. M. Medic-Šaric, Ž. Maleš, S. Šaric, A. Brantner, Croat. Chem. Acta 69, 1603 (1996)
10. M. Shichijo, N. Yamamoto, H. Tsujishita, M. Kimata, H. Nagal, T. Kokubo, Biol. Pharm. Bull.26, 1685 (2003)
11. K. Valko, C.M. Du, C. Bevan, D.P. Reynolds, M.H. Abraham, Curr. Med. Chem. 8, 1137 (2001)12. R.G. Franz, AAPS PharmSci 3 (2001) article 1013. M. Medic-Šaric, A. Mornar, T. Badovinac-Crnjevic, I. Jasprica, Croat. Chem. Acta 77, 367 (2004)14. S.P. Gupta, M.S. Babu, S. Sowmya, Bioorg. Med. Chem. 6, 2185 (1998)15. I. Moriguchi, Y. Kanada, K. Komatu, Chem. Pharm. Bull. 24, 1799 (1976)16. R. Carrasco, J.A. Padrón, J. Gálvez, J. Pharm. Pharm. Sci. 7, 19 (2004)17. D.E. Clark, J. Pharm. Sci. 88, 807 (1999)18. D.E. Clark, J. Pharm. Sci. 88, 815 (1999)19. V. Rastija, Chromatographic analysis of polyphenols in wines from Croatia. Ph.D. Thesis, University
of Zagreb (2007)20. M. Vedrina, S. Markovic, M. Medic-Šaric, N. Trinajstic, Comput. Chem. 21, 355 (1997)21. D.J. Weininger, Chem. Inf. Comput. Sci. 28, 31 (1988)
123
J Math Chem (2009) 46:820–833 833
22. http://146.107.217.178/lab/alogps/23. I.V. Tetko, A.E.P. Villa, Neural Networks 10, 1361 (1997)24. I.V. Tetko, V.Yu. Tanchuk, J. Chem. Inf. Comput. Sci. 42, 1136 (2002)25. R. Mannhold, H. van de Waterbeemd, J. Comput. Aided Mol. Des. 15, 337 (2001)26. www.daylight.com/27. C. Hansch, A. Leo, Substituent Constants for Correlation Analysis in Chemistry and Biol-
ogy (Wiley, New York, 1979)28. I. Moriguchi, S. Hirono, Q. Liu, Y. Nakagome, Y. Matsushita, Chem. Pharm. Bull. 40, 127 (1992)29. R. Todeschini, V. Consonni, Handbook of Molecular Descriptors (Wiley-VCH, Weinheim, 2000)30. http://www.talete.mi.it/download.htm31. B. Lucic, N. Trinajstic J. Chem. Inf. Comput. Sci. 39 121 (1999)32. C. Yang, C. Zhong, J. Chem. Inf. Comput. Sci. 43, 1998 (2003)33. S. Nikolic, N. Trinajstic, I. Baucic, J. Chem. Inf. Comput. Sci. 38, 42 (1998)34. L.B. Kier, L.H. Hall, Molecular Connectivity in Structure–Activity Analysis (Research Studies
Press/Wiley, New York, 1986)35. M. Šoškic, D. Plavšic, J. Chem. Inf. Comput. Sci. 45, 930 (2005)36. J.A. Padrón, R. Carrasco, R.F. Pellón, J. Pharm. Pharm. Sci. 5, 258 (2002)37. T. Österberg, U. Norinder, J. Chem. Inf. Comput. Sci. 40, 1408 (2000)38. J. Zheng, S.K. Han, K.H. Row, Bull. Korean Chem. Soc. 26, 629 (2005)
123
Related Documents