Molecular modeling and dynamics simulations of PNP from Streptococcus agalactiae Rafael Andrade Caceres, a Luis Fernando Saraiva Timmers, a Raquel Dias, a Luiz Augusto Basso, a,b Diogenes Santiago Santos b, * and Walter Filgueira de Azevedo, Jr. a, * a Faculdade de Biocie ˆncias, Pontifı ´cia Universidade Cato ´ lica do Rio Grande do Sul, Av. Ipiranga, 6681, CEP 90619-900, Porto Alegre—RS, Brazil b Centro de Pesquisas em Biologia Molecular e Funcional, Instituto de Pesquisas Biome ´dicas, Pontifica Universidade Cato ´ lica do Rio Grande do Sul, Porto Alegre—RS, Brazil Received 6 December 2007; revised 12 March 2008; accepted 14 March 2008 Available online 20 March 2008 Abstract—This work describes for the first time a structural model of purine nucleoside phosphorylase from Streptococcus agalac- tiae (SaPNP). PNP catalyzes the cleavage of N-ribosidic bonds of the purine ribonucleosides and 2-deoxyribonucleosides in the pres- ence of inorganic orthophosphate as a second substrate. This enzyme is a potential target for the development of antibacterial drugs. We modeled the complexes of SaPNP with 15 different ligands in order to determine the structural basis for the specificity of these ligands against SaPNP. The application of a novel empirical scoring function to estimate the affinity of a ligand for a protein was able to identify the ligands with high affinity for PNPs. The analysis of molecular dynamics trajectory for SaPNP indicates that the functionally important motifs have a very stable structure. This new structural model together with a novel empirical scoring func- tion opens the possibility to explorer larger library of compounds in order to identify the new inhibitors for PNPs in virtual screen- ing projects. Ó 2008 Elsevier Ltd. All rights reserved. 1. Introduction Streptococcus agalactiae is a member of Group B strep- tococcus gram positive spherical bacterium that causes some of the most common infections in humans. The polysaccharide capsule and the secreted hemolysin are of major importance for virulence, and superoxide dis- mutase and D-alanylated lipoteichic acid play significant roles. 1 Purine nucleoside phosphorylase (PNP) has been pro- posed as a target for the development of antibacterial drugs. 2 The catalyzed reaction generates the purine base and ribose(deoxyribose)-1-phosphate. 3 PNP is specific for purine nucleosides in the beta-configuration and cleaves the glycosidic bond with the inversion of config- uration to produce a-ribose-1-phosphate. 4 PNP is a ubiquitous enzyme of purine metabolism that functions in the salvage pathway, including those of Apicom- plexan parasites. 5 PNP is classified as belonging to the class I of nucleoside phosphorylase (NP-I). 6 Drugs that inhibit human PNP activity have the poten- tial of being utilized as the modulators of the immuno- logical system, to treat leukemia, autoimmune diseases, and rejection in organ transplantation. 7 PNP has been submitted to intensive studies focused on the identifica- tion of new inhibitors, most of them related to human PNP. In the present work we modeled the structure of PNP from S. agalactiae (SaPNP). Three binding sites present in the structures of human PNP and SaPNP were ana- lyzed. The analysis was carried out with different ligands in order to identify the structural basis for the specificity of different ligands against PNPs. Furthermore, the application of a novel empirical scoring function was able to evaluate the specificity of different ligands against PNP that could be used to help in the design 0968-0896/$ - see front matter Ó 2008 Elsevier Ltd. All rights reserved. doi:10.1016/j.bmc.2008.03.044 Keywords: Purine nucleoside phosphorylase; Molecular modeling; Bioinformatics; Streptococcus agalactiae. * Corresponding authors. Tel.: +55 51 33203500; e-mail addresses: [email protected]; [email protected] Available online at www.sciencedirect.com Bioorganic & Medicinal Chemistry 16 (2008) 4984–4993

Welcome message from author
This document is posted to help you gain knowledge. Please leave a comment to let me know what you think about it! Share it to your friends and learn new things together.
Transcript
Available online at www.sciencedirect.com
Bioorganic & Medicinal Chemistry 16 (2008) 4984–4993
Molecular modeling and dynamics simulations of PNPfrom Streptococcus agalactiae
Rafael Andrade Caceres,a Luis Fernando Saraiva Timmers,a Raquel Dias,a
Luiz Augusto Basso,a,b Diogenes Santiago Santosb,*
and Walter Filgueira de Azevedo, Jr.a,*
aFaculdade de Biociencias, Pontifıcia Universidade Catolica do Rio Grande do Sul, Av. Ipiranga, 6681,
CEP 90619-900, Porto Alegre—RS, BrazilbCentro de Pesquisas em Biologia Molecular e Funcional, Instituto de Pesquisas Biomedicas,
Pontifica Universidade Catolica do Rio Grande do Sul, Porto Alegre—RS, Brazil
Received 6 December 2007; revised 12 March 2008; accepted 14 March 2008
Available online 20 March 2008
Abstract—This work describes for the first time a structural model of purine nucleoside phosphorylase from Streptococcus agalac-tiae (SaPNP). PNP catalyzes the cleavage of N-ribosidic bonds of the purine ribonucleosides and 2-deoxyribonucleosides in the pres-ence of inorganic orthophosphate as a second substrate. This enzyme is a potential target for the development of antibacterial drugs.We modeled the complexes of SaPNP with 15 different ligands in order to determine the structural basis for the specificity of theseligands against SaPNP. The application of a novel empirical scoring function to estimate the affinity of a ligand for a protein wasable to identify the ligands with high affinity for PNPs. The analysis of molecular dynamics trajectory for SaPNP indicates that thefunctionally important motifs have a very stable structure. This new structural model together with a novel empirical scoring func-tion opens the possibility to explorer larger library of compounds in order to identify the new inhibitors for PNPs in virtual screen-ing projects.� 2008 Elsevier Ltd. All rights reserved.
1. Introduction
Streptococcus agalactiae is a member of Group B strep-tococcus gram positive spherical bacterium that causessome of the most common infections in humans. Thepolysaccharide capsule and the secreted hemolysin areof major importance for virulence, and superoxide dis-mutase and D-alanylated lipoteichic acid play significantroles.1
Purine nucleoside phosphorylase (PNP) has been pro-posed as a target for the development of antibacterialdrugs.2 The catalyzed reaction generates the purine baseand ribose(deoxyribose)-1-phosphate.3 PNP is specificfor purine nucleosides in the beta-configuration andcleaves the glycosidic bond with the inversion of config-uration to produce a-ribose-1-phosphate.4 PNP is a
0968-0896/$ - see front matter � 2008 Elsevier Ltd. All rights reserved.
doi:10.1016/j.bmc.2008.03.044
Keywords: Purine nucleoside phosphorylase; Molecular modeling;
Bioinformatics; Streptococcus agalactiae.* Corresponding authors. Tel.: +55 51 33203500; e-mail addresses:
[email protected]; [email protected]
ubiquitous enzyme of purine metabolism that functionsin the salvage pathway, including those of Apicom-plexan parasites.5 PNP is classified as belonging to theclass I of nucleoside phosphorylase (NP-I).6
Drugs that inhibit human PNP activity have the poten-tial of being utilized as the modulators of the immuno-logical system, to treat leukemia, autoimmune diseases,and rejection in organ transplantation.7 PNP has beensubmitted to intensive studies focused on the identifica-tion of new inhibitors, most of them related to humanPNP.
In the present work we modeled the structure of PNPfrom S. agalactiae (SaPNP). Three binding sites presentin the structures of human PNP and SaPNP were ana-lyzed. The analysis was carried out with different ligandsin order to identify the structural basis for the specificityof different ligands against PNPs. Furthermore, theapplication of a novel empirical scoring function wasable to evaluate the specificity of different ligandsagainst PNP that could be used to help in the design
R. A. Caceres et al. / Bioorg. Med. Chem. 16 (2008) 4984–4993 4985
of more specific inhibitors, and in the case of SaPNPhelp in the development of a new drug againstS. agalactiae.
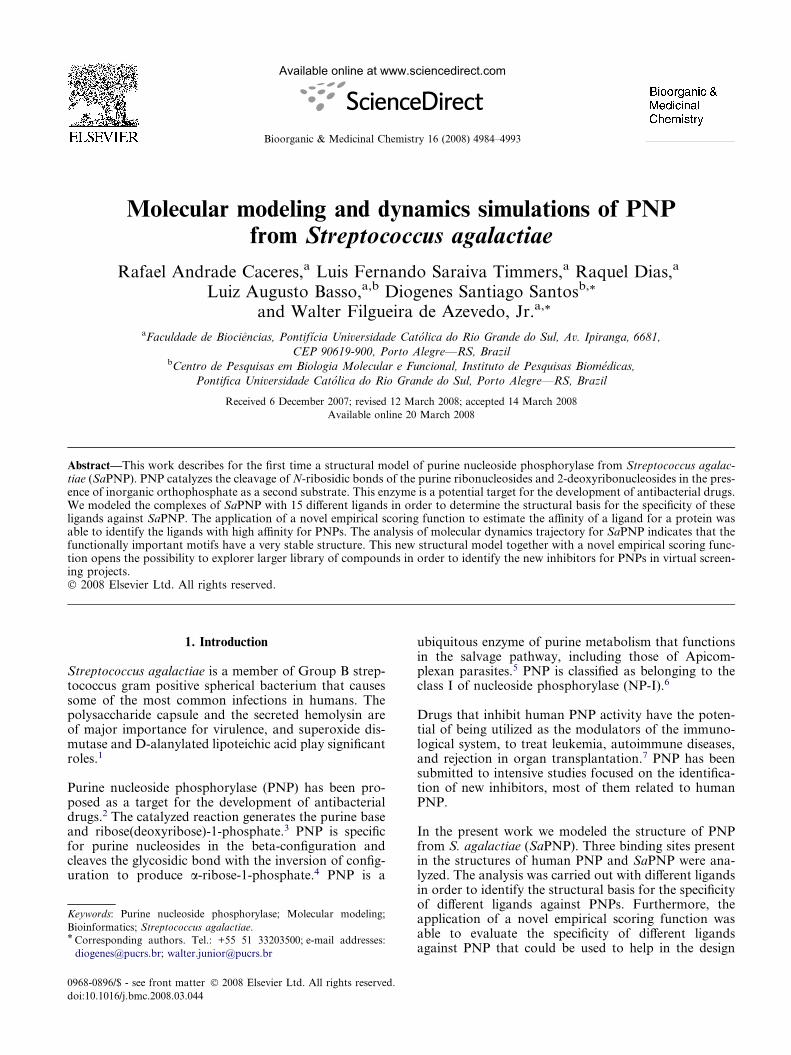
Figure 1. Tertiary structure of the SaPNP. The structure contains an
eight-stranded mixed beta-sheet a five-stranded mixed beta-sheet,
which joins to form a distorted beta-barrel. The image was generated
using Pymol.8
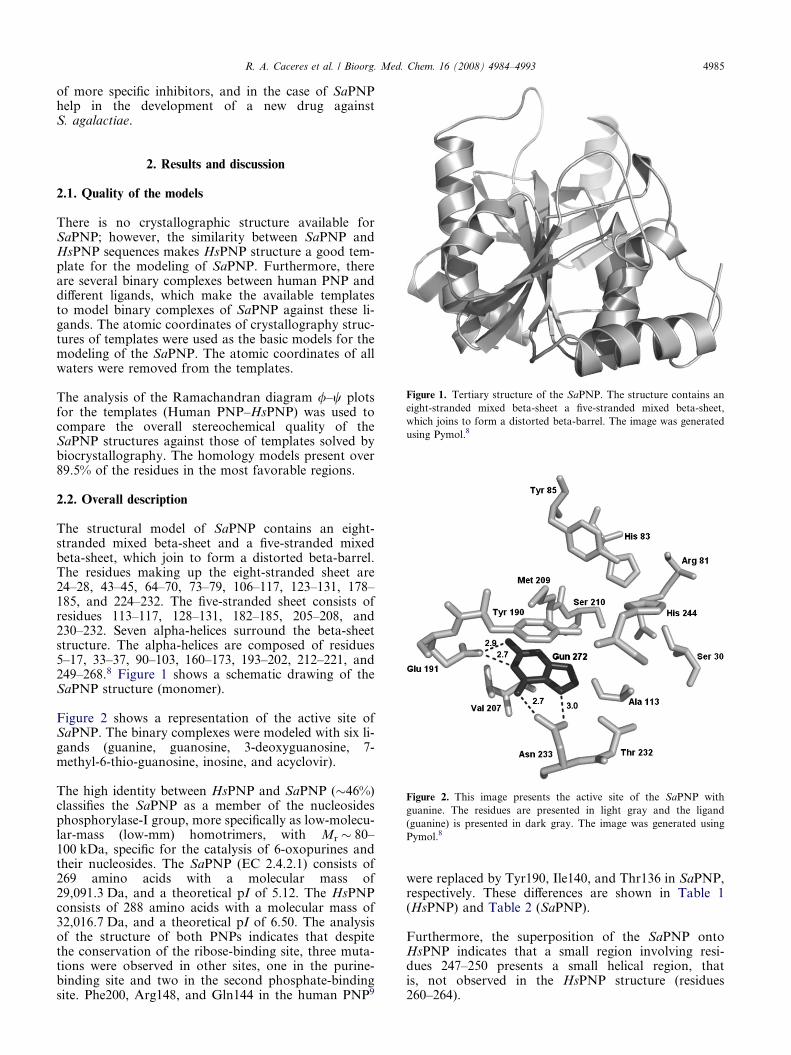
Figure 2. This image presents the active site of the SaPNP with
guanine. The residues are presented in light gray and the ligand
(guanine) is presented in dark gray. The image was generated using
Pymol.8
2. Results and discussion
2.1. Quality of the models
There is no crystallographic structure available forSaPNP; however, the similarity between SaPNP andHsPNP sequences makes HsPNP structure a good tem-plate for the modeling of SaPNP. Furthermore, thereare several binary complexes between human PNP anddifferent ligands, which make the available templatesto model binary complexes of SaPNP against these li-gands. The atomic coordinates of crystallography struc-tures of templates were used as the basic models for themodeling of the SaPNP. The atomic coordinates of allwaters were removed from the templates.
The analysis of the Ramachandran diagram /–w plotsfor the templates (Human PNP–HsPNP) was used tocompare the overall stereochemical quality of theSaPNP structures against those of templates solved bybiocrystallography. The homology models present over89.5% of the residues in the most favorable regions.
2.2. Overall description
The structural model of SaPNP contains an eight-stranded mixed beta-sheet and a five-stranded mixedbeta-sheet, which join to form a distorted beta-barrel.The residues making up the eight-stranded sheet are24–28, 43–45, 64–70, 73–79, 106–117, 123–131, 178–185, and 224–232. The five-stranded sheet consists ofresidues 113–117, 128–131, 182–185, 205–208, and230–232. Seven alpha-helices surround the beta-sheetstructure. The alpha-helices are composed of residues5–17, 33–37, 90–103, 160–173, 193–202, 212–221, and249–268.8 Figure 1 shows a schematic drawing of theSaPNP structure (monomer).
Figure 2 shows a representation of the active site ofSaPNP. The binary complexes were modeled with six li-gands (guanine, guanosine, 3-deoxyguanosine, 7-methyl-6-thio-guanosine, inosine, and acyclovir).
The high identity between HsPNP and SaPNP (�46%)classifies the SaPNP as a member of the nucleosidesphosphorylase-I group, more specifically as low-molecu-lar-mass (low-mm) homotrimers, with Mr � 80–100 kDa, specific for the catalysis of 6-oxopurines andtheir nucleosides. The SaPNP (EC 2.4.2.1) consists of269 amino acids with a molecular mass of29,091.3 Da, and a theoretical pI of 5.12. The HsPNPconsists of 288 amino acids with a molecular mass of32,016.7 Da, and a theoretical pI of 6.50. The analysisof the structure of both PNPs indicates that despitethe conservation of the ribose-binding site, three muta-tions were observed in other sites, one in the purine-binding site and two in the second phosphate-bindingsite. Phe200, Arg148, and Gln144 in the human PNP9
were replaced by Tyr190, Ile140, and Thr136 in SaPNP,respectively. These differences are shown in Table 1(HsPNP) and Table 2 (SaPNP).
Furthermore, the superposition of the SaPNP ontoHsPNP indicates that a small region involving resi-dues 247–250 presents a small helical region, thatis, not observed in the HsPNP structure (residues260–264).
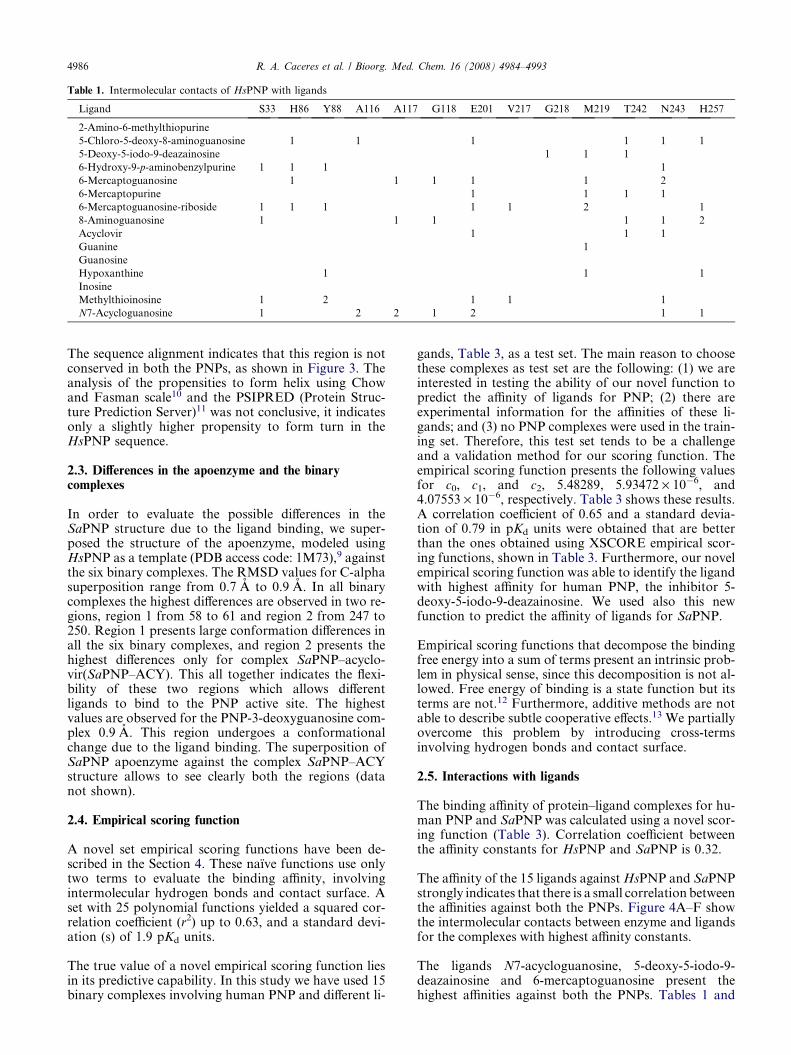
Table 1. Intermolecular contacts of HsPNP with ligands
Ligand S33 H86 Y88 A116 A117 G118 E201 V217 G218 M219 T242 N243 H257
2-Amino-6-methylthiopurine
5-Chloro-5-deoxy-8-aminoguanosine 1 1 1 1 1 1
5-Deoxy-5-iodo-9-deazainosine 1 1 1
6-Hydroxy-9-p-aminobenzylpurine 1 1 1 1
6-Mercaptoguanosine 1 1 1 1 1 2
6-Mercaptopurine 1 1 1 1
6-Mercaptoguanosine-riboside 1 1 1 1 1 2 1
8-Aminoguanosine 1 1 1 1 1 2
Acyclovir 1 1 1
Guanine 1
Guanosine
Hypoxanthine 1 1 1
Inosine
Methylthioinosine 1 2 1 1 1
N7-Acycloguanosine 1 2 2 1 2 1 1
4986 R. A. Caceres et al. / Bioorg. Med. Chem. 16 (2008) 4984–4993
The sequence alignment indicates that this region is notconserved in both the PNPs, as shown in Figure 3. Theanalysis of the propensities to form helix using Chowand Fasman scale10 and the PSIPRED (Protein Struc-ture Prediction Server)11 was not conclusive, it indicatesonly a slightly higher propensity to form turn in theHsPNP sequence.
2.3. Differences in the apoenzyme and the binarycomplexes
In order to evaluate the possible differences in theSaPNP structure due to the ligand binding, we super-posed the structure of the apoenzyme, modeled usingHsPNP as a template (PDB access code: 1M73),9 againstthe six binary complexes. The RMSD values for C-alphasuperposition range from 0.7 A to 0.9 A. In all binarycomplexes the highest differences are observed in two re-gions, region 1 from 58 to 61 and region 2 from 247 to250. Region 1 presents large conformation differences inall the six binary complexes, and region 2 presents thehighest differences only for complex SaPNP–acyclo-vir(SaPNP–ACY). This all together indicates the flexi-bility of these two regions which allows differentligands to bind to the PNP active site. The highestvalues are observed for the PNP-3-deoxyguanosine com-plex 0.9 A. This region undergoes a conformationalchange due to the ligand binding. The superposition ofSaPNP apoenzyme against the complex SaPNP–ACYstructure allows to see clearly both the regions (datanot shown).
2.4. Empirical scoring function
A novel set empirical scoring functions have been de-scribed in the Section 4. These naıve functions use onlytwo terms to evaluate the binding affinity, involvingintermolecular hydrogen bonds and contact surface. Aset with 25 polynomial functions yielded a squared cor-relation coefficient (r2) up to 0.63, and a standard devi-ation (s) of 1.9 pKd units.
The true value of a novel empirical scoring function liesin its predictive capability. In this study we have used 15binary complexes involving human PNP and different li-
gands, Table 3, as a test set. The main reason to choosethese complexes as test set are the following: (1) we areinterested in testing the ability of our novel function topredict the affinity of ligands for PNP; (2) there areexperimental information for the affinities of these li-gands; and (3) no PNP complexes were used in the train-ing set. Therefore, this test set tends to be a challengeand a validation method for our scoring function. Theempirical scoring function presents the following valuesfor c0, c1, and c2, 5.48289, 5.93472 · 10�6, and4.07553 · 10�6, respectively. Table 3 shows these results.A correlation coefficient of 0.65 and a standard devia-tion of 0.79 in pKd units were obtained that are betterthan the ones obtained using XSCORE empirical scor-ing functions, shown in Table 3. Furthermore, our novelempirical scoring function was able to identify the ligandwith highest affinity for human PNP, the inhibitor 5-deoxy-5-iodo-9-deazainosine. We used also this newfunction to predict the affinity of ligands for SaPNP.
Empirical scoring functions that decompose the bindingfree energy into a sum of terms present an intrinsic prob-lem in physical sense, since this decomposition is not al-lowed. Free energy of binding is a state function but itsterms are not.12 Furthermore, additive methods are notable to describe subtle cooperative effects.13 We partiallyovercome this problem by introducing cross-termsinvolving hydrogen bonds and contact surface.
2.5. Interactions with ligands
The binding affinity of protein–ligand complexes for hu-man PNP and SaPNP was calculated using a novel scor-ing function (Table 3). Correlation coefficient betweenthe affinity constants for HsPNP and SaPNP is 0.32.
The affinity of the 15 ligands against HsPNP and SaPNPstrongly indicates that there is a small correlation betweenthe affinities against both the PNPs. Figure 4A–F showthe intermolecular contacts between enzyme and ligandsfor the complexes with highest affinity constants.
The ligands N7-acycloguanosine, 5-deoxy-5-iodo-9-deazainosine and 6-mercaptoguanosine present thehighest affinities against both the PNPs. Tables 1 and
Ta
ble
2.
Inte
rmo
lecu
lar
con
tact
so
fS
aP
NP
wit
hli
ga
nd
s
Lig
an
dS
30
L3
2A
11
3G
12
2D
153
E1
91
G2
08
T2
32
N2
33
F2
34
A2
36
G2
37
F23
8Q
23
9S
240
E2
41
L24
2H
244
V2
62
L2
65
L26
9
2-A
min
o-6
-met
hy
lth
iop
uri
ne
11
1
5-C
hlo
ro-5
-deo
xy
-8-a
min
og
ua
no
sin
e1
22
11
5-D
eoxy
-5-i
od
o-9
-dea
zain
osi
ne
11
21
21
1
6-H
yd
rox
y-9
-p-a
min
ob
enzy
lpu
rin
e1
3
6-M
erca
pto
gu
an
osi
ne
21
21
11
6-M
erca
pto
pu
rin
e1
1
6-M
erca
pto
gu
an
osi
ne-
rib
osi
de
21
21
8-A
min
og
ua
no
sin
e2
21
11
11
Acy
clo
vir
Gu
an
ine
1
Gu
an
osi
ne
12
12
21
2
Hy
po
xa
nth
ine
11
Ino
sin
e2
11
21
11
1
Met
hy
lth
ioin
osi
ne
12
11
11
2
N7
-Acy
clo
gu
an
osi
ne
31
1
R. A. Caceres et al. / Bioorg. Med. Chem. 16 (2008) 4984–4993 4987
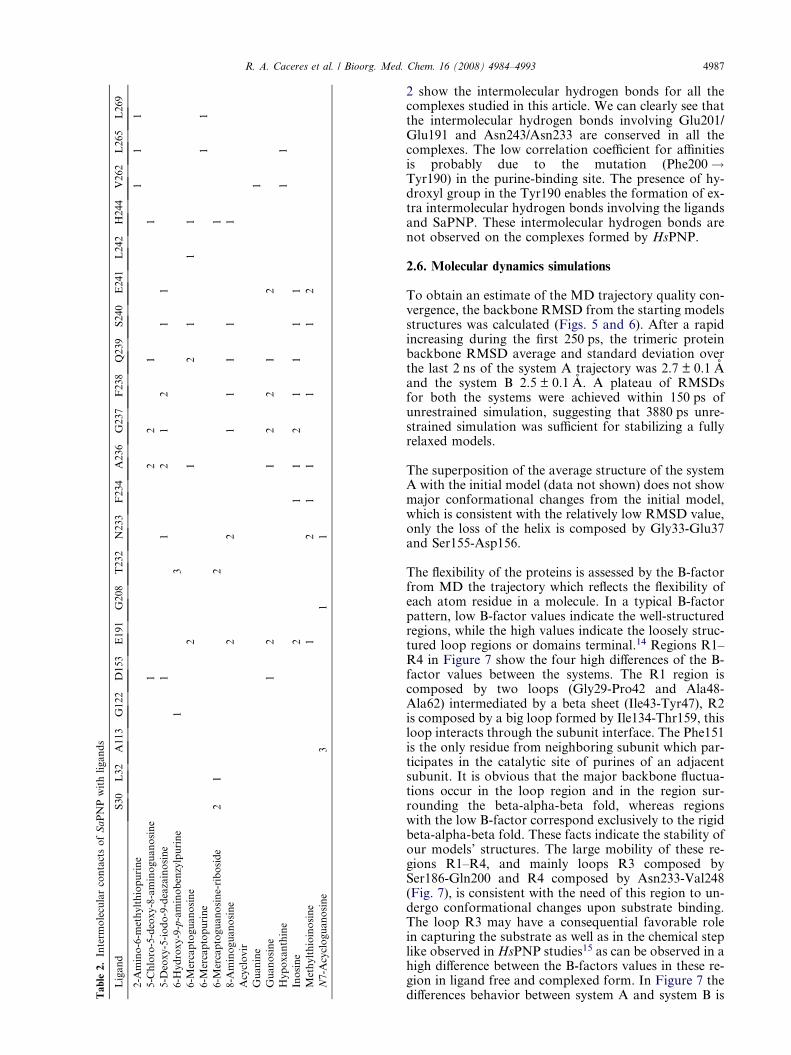
2 show the intermolecular hydrogen bonds for all thecomplexes studied in this article. We can clearly see thatthe intermolecular hydrogen bonds involving Glu201/Glu191 and Asn243/Asn233 are conserved in all thecomplexes. The low correlation coefficient for affinitiesis probably due to the mutation (Phe200!Tyr190) in the purine-binding site. The presence of hy-droxyl group in the Tyr190 enables the formation of ex-tra intermolecular hydrogen bonds involving the ligandsand SaPNP. These intermolecular hydrogen bonds arenot observed on the complexes formed by HsPNP.
2.6. Molecular dynamics simulations
To obtain an estimate of the MD trajectory quality con-vergence, the backbone RMSD from the starting modelsstructures was calculated (Figs. 5 and 6). After a rapidincreasing during the first 250 ps, the trimeric proteinbackbone RMSD average and standard deviation overthe last 2 ns of the system A trajectory was 2.7 ± 0.1 Aand the system B 2.5 ± 0.1 A. A plateau of RMSDsfor both the systems were achieved within 150 ps ofunrestrained simulation, suggesting that 3880 ps unre-strained simulation was sufficient for stabilizing a fullyrelaxed models.
The superposition of the average structure of the systemA with the initial model (data not shown) does not showmajor conformational changes from the initial model,which is consistent with the relatively low RMSD value,only the loss of the helix is composed by Gly33-Glu37and Ser155-Asp156.
The flexibility of the proteins is assessed by the B-factorfrom MD the trajectory which reflects the flexibility ofeach atom residue in a molecule. In a typical B-factorpattern, low B-factor values indicate the well-structuredregions, while the high values indicate the loosely struc-tured loop regions or domains terminal.14 Regions R1–R4 in Figure 7 show the four high differences of the B-factor values between the systems. The R1 region iscomposed by two loops (Gly29-Pro42 and Ala48-Ala62) intermediated by a beta sheet (Ile43-Tyr47), R2is composed by a big loop formed by Ile134-Thr159, thisloop interacts through the subunit interface. The Phe151is the only residue from neighboring subunit which par-ticipates in the catalytic site of purines of an adjacentsubunit. It is obvious that the major backbone fluctua-tions occur in the loop region and in the region sur-rounding the beta-alpha-beta fold, whereas regionswith the low B-factor correspond exclusively to the rigidbeta-alpha-beta fold. These facts indicate the stability ofour models’ structures. The large mobility of these re-gions R1–R4, and mainly loops R3 composed bySer186-Gln200 and R4 composed by Asn233-Val248(Fig. 7), is consistent with the need of this region to un-dergo conformational changes upon substrate binding.The loop R3 may have a consequential favorable rolein capturing the substrate as well as in the chemical steplike observed in HsPNP studies15 as can be observed in ahigh difference between the B-factors values in these re-gion in ligand free and complexed form. In Figure 7 thedifferences behavior between system A and system B is
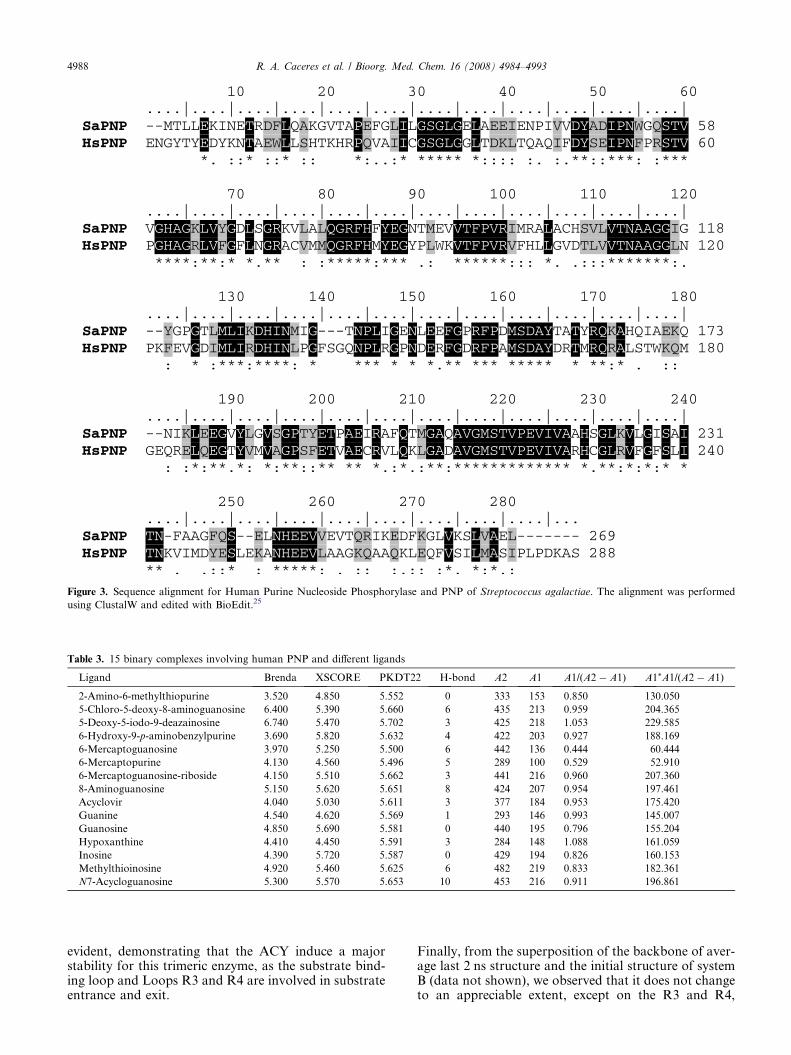
Figure 3. Sequence alignment for Human Purine Nucleoside Phosphorylase and PNP of Streptococcus agalactiae. The alignment was performed
using ClustalW and edited with BioEdit.25
Table 3. 15 binary complexes involving human PNP and different ligands
Ligand Brenda XSCORE PKDT22 H-bond A2 A1 A1/(A2 � A1) A1*A1/(A2 � A1)
2-Amino-6-methylthiopurine 3.520 4.850 5.552 0 333 153 0.850 130.050
5-Chloro-5-deoxy-8-aminoguanosine 6.400 5.390 5.660 6 435 213 0.959 204.365
5-Deoxy-5-iodo-9-deazainosine 6.740 5.470 5.702 3 425 218 1.053 229.585
6-Hydroxy-9-p-aminobenzylpurine 3.690 5.820 5.632 4 422 203 0.927 188.169
6-Mercaptoguanosine 3.970 5.250 5.500 6 442 136 0.444 60.444
6-Mercaptopurine 4.130 4.560 5.496 5 289 100 0.529 52.910
6-Mercaptoguanosine-riboside 4.150 5.510 5.662 3 441 216 0.960 207.360
8-Aminoguanosine 5.150 5.620 5.651 8 424 207 0.954 197.461
Acyclovir 4.040 5.030 5.611 3 377 184 0.953 175.420
Guanine 4.540 4.620 5.569 1 293 146 0.993 145.007
Guanosine 4.850 5.690 5.581 0 440 195 0.796 155.204
Hypoxanthine 4.410 4.450 5.591 3 284 148 1.088 161.059
Inosine 4.390 5.720 5.587 0 429 194 0.826 160.153
Methylthioinosine 4.920 5.460 5.625 6 482 219 0.833 182.361
N7-Acycloguanosine 5.300 5.570 5.653 10 453 216 0.911 196.861
4988 R. A. Caceres et al. / Bioorg. Med. Chem. 16 (2008) 4984–4993
evident, demonstrating that the ACY induce a majorstability for this trimeric enzyme, as the substrate bind-ing loop and Loops R3 and R4 are involved in substrateentrance and exit.
Finally, from the superposition of the backbone of aver-age last 2 ns structure and the initial structure of systemB (data not shown), we observed that it does not changeto an appreciable extent, except on the R3 and R4,
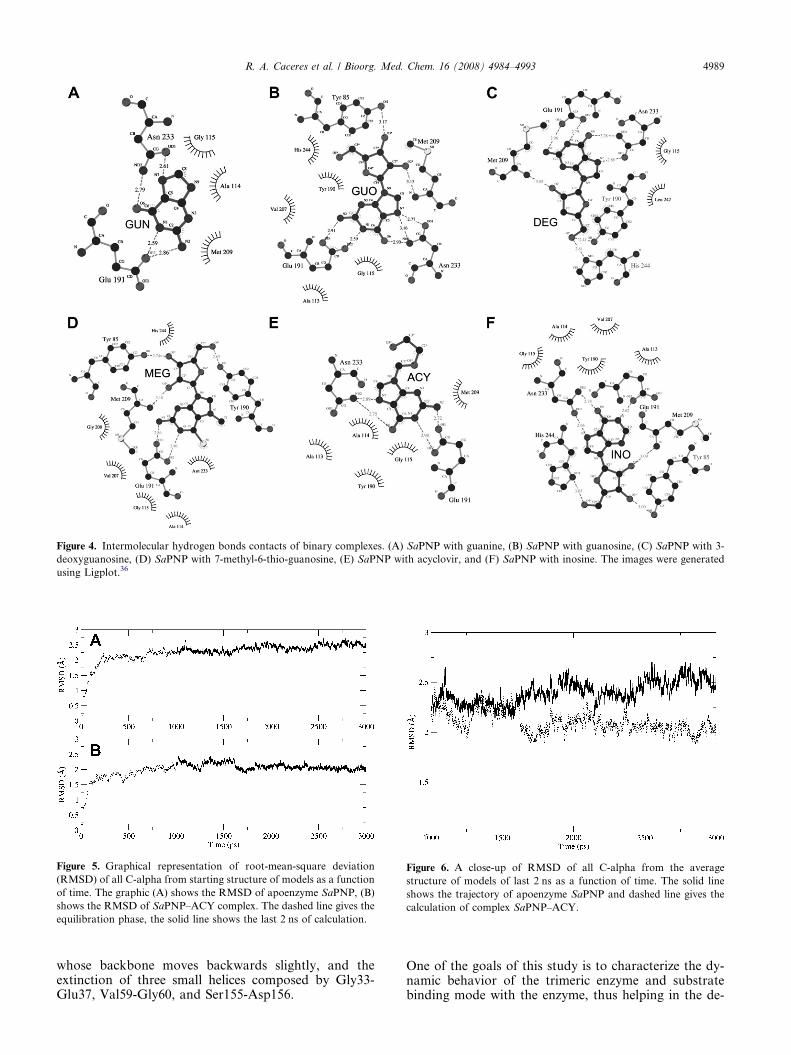
Figure 4. Intermolecular hydrogen bonds contacts of binary complexes. (A) SaPNP with guanine, (B) SaPNP with guanosine, (C) SaPNP with 3-
deoxyguanosine, (D) SaPNP with 7-methyl-6-thio-guanosine, (E) SaPNP with acyclovir, and (F) SaPNP with inosine. The images were generated
using Ligplot.36
Figure 5. Graphical representation of root-mean-square deviation
(RMSD) of all C-alpha from starting structure of models as a function
of time. The graphic (A) shows the RMSD of apoenzyme SaPNP, (B)
shows the RMSD of SaPNP–ACY complex. The dashed line gives the
equilibration phase, the solid line shows the last 2 ns of calculation.
Figure 6. A close-up of RMSD of all C-alpha from the average
structure of models of last 2 ns as a function of time. The solid line
shows the trajectory of apoenzyme SaPNP and dashed line gives the
calculation of complex SaPNP–ACY.
R. A. Caceres et al. / Bioorg. Med. Chem. 16 (2008) 4984–4993 4989
whose backbone moves backwards slightly, and theextinction of three small helices composed by Gly33-Glu37, Val59-Gly60, and Ser155-Asp156.
One of the goals of this study is to characterize the dy-namic behavior of the trimeric enzyme and substratebinding mode with the enzyme, thus helping in the de-
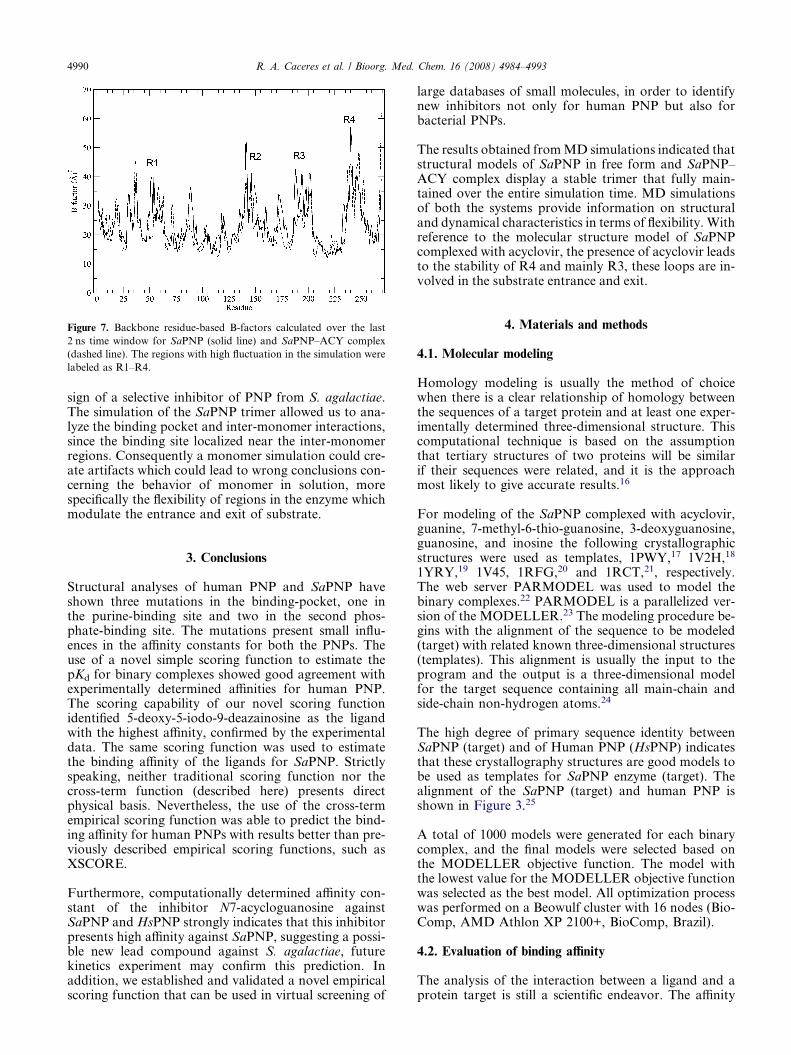
Figure 7. Backbone residue-based B-factors calculated over the last
2 ns time window for SaPNP (solid line) and SaPNP–ACY complex
(dashed line). The regions with high fluctuation in the simulation were
labeled as R1–R4.
4990 R. A. Caceres et al. / Bioorg. Med. Chem. 16 (2008) 4984–4993
sign of a selective inhibitor of PNP from S. agalactiae.The simulation of the SaPNP trimer allowed us to ana-lyze the binding pocket and inter-monomer interactions,since the binding site localized near the inter-monomerregions. Consequently a monomer simulation could cre-ate artifacts which could lead to wrong conclusions con-cerning the behavior of monomer in solution, morespecifically the flexibility of regions in the enzyme whichmodulate the entrance and exit of substrate.
3. Conclusions
Structural analyses of human PNP and SaPNP haveshown three mutations in the binding-pocket, one inthe purine-binding site and two in the second phos-phate-binding site. The mutations present small influ-ences in the affinity constants for both the PNPs. Theuse of a novel simple scoring function to estimate thepKd for binary complexes showed good agreement withexperimentally determined affinities for human PNP.The scoring capability of our novel scoring functionidentified 5-deoxy-5-iodo-9-deazainosine as the ligandwith the highest affinity, confirmed by the experimentaldata. The same scoring function was used to estimatethe binding affinity of the ligands for SaPNP. Strictlyspeaking, neither traditional scoring function nor thecross-term function (described here) presents directphysical basis. Nevertheless, the use of the cross-termempirical scoring function was able to predict the bind-ing affinity for human PNPs with results better than pre-viously described empirical scoring functions, such asXSCORE.
Furthermore, computationally determined affinity con-stant of the inhibitor N7-acycloguanosine againstSaPNP and HsPNP strongly indicates that this inhibitorpresents high affinity against SaPNP, suggesting a possi-ble new lead compound against S. agalactiae, futurekinetics experiment may confirm this prediction. Inaddition, we established and validated a novel empiricalscoring function that can be used in virtual screening of
large databases of small molecules, in order to identifynew inhibitors not only for human PNP but also forbacterial PNPs.
The results obtained from MD simulations indicated thatstructural models of SaPNP in free form and SaPNP–ACY complex display a stable trimer that fully main-tained over the entire simulation time. MD simulationsof both the systems provide information on structuraland dynamical characteristics in terms of flexibility. Withreference to the molecular structure model of SaPNPcomplexed with acyclovir, the presence of acyclovir leadsto the stability of R4 and mainly R3, these loops are in-volved in the substrate entrance and exit.
4. Materials and methods
4.1. Molecular modeling
Homology modeling is usually the method of choicewhen there is a clear relationship of homology betweenthe sequences of a target protein and at least one exper-imentally determined three-dimensional structure. Thiscomputational technique is based on the assumptionthat tertiary structures of two proteins will be similarif their sequences were related, and it is the approachmost likely to give accurate results.16
For modeling of the SaPNP complexed with acyclovir,guanine, 7-methyl-6-thio-guanosine, 3-deoxyguanosine,guanosine, and inosine the following crystallographicstructures were used as templates, 1PWY,17 1V2H,18
1YRY,19 1V45, 1RFG,20 and 1RCT,21, respectively.The web server PARMODEL was used to model thebinary complexes.22 PARMODEL is a parallelized ver-sion of the MODELLER.23 The modeling procedure be-gins with the alignment of the sequence to be modeled(target) with related known three-dimensional structures(templates). This alignment is usually the input to theprogram and the output is a three-dimensional modelfor the target sequence containing all main-chain andside-chain non-hydrogen atoms.24
The high degree of primary sequence identity betweenSaPNP (target) and of Human PNP (HsPNP) indicatesthat these crystallography structures are good models tobe used as templates for SaPNP enzyme (target). Thealignment of the SaPNP (target) and human PNP isshown in Figure 3.25
A total of 1000 models were generated for each binarycomplex, and the final models were selected based onthe MODELLER objective function. The model withthe lowest value for the MODELLER objective functionwas selected as the best model. All optimization processwas performed on a Beowulf cluster with 16 nodes (Bio-Comp, AMD Athlon XP 2100+, BioComp, Brazil).
4.2. Evaluation of binding affinity
The analysis of the interaction between a ligand and aprotein target is still a scientific endeavor. The affinity
Table 4. Polinomial functions
pKdT Function
1 c0 + c1 Æ x + c2 Æ y
2 c0 + c1 Æ x + c2 Æ y2
3 c0 + c1 Æ x + c2 Æ x2 + c3 Æ y
4 c0 + c1 Æ x + c2 Æ x2 + c3 Æ y2
5 c0 + c1 Æ x + c2 Æ x2 + c3 Æ y + c4 Æ y2
6 c0 + c1 Æ x + c2 Æ y + c3 Æ y2
7 c0 + c1 Æ x2 + c2 Æ y + c3 Æ y2
8 c0 + c1 Æ x2 + c2 Æ y
9 c0 + c1 Æ x2 + c2 Æ y2
10 c0 + c1 Æ x + c2 Æ x Æ y
11 c0 + c1 Æ x Æ y + c2 Æ y
12 c0 + c1 Æ x + c2 Æ x2 + c3 Æ x Æ y
13 c0 + c1 Æ x + c2 Æ x Æ y + c3 Æ y
14 c0 + c1 Æ x + c2 Æ x2 + c3 Æ x Æ y + c4 Æ y
15 c0 + c1 Æ x2 + c2 Æ x Æ y + c3 Æ y
16 c0 + c1 Æ x2 + c2 Æ x Æ y
17 c0 + c1 Æ x + c2 Æ x2 + c3 Æ x Æ y + c4 Æ y + c5 Æ y2
18 c0 + c1 Æ x + c2 Æ x Æ y + c3 Æ y + c4 Æ y2
19 c0 + c1 Æ x Æ y + c2 Æ y + c3 Æ y2
20 c0 + c1 Æ x2 + c2 Æ x Æ y + c3 Æ y2
21 c0 + c1 Æ x2 + c2 Æ x Æ y + c3 Æ y + c4 Æ y2
22 c0 + c1 Æ x Æ y + c2 Æ y2
23 c0 + c1 Æ x Æ y
24 c0 + c1 Æ x + c2 Æ x Æ y + c3 Æ y2
25 c0 + c1 Æ x + c2 Æ x2 + c3 Æ x Æ y + c4 Æ y2
x = number of intermolecular hydrogen bonds (HB).
y = A.
R. A. Caceres et al. / Bioorg. Med. Chem. 16 (2008) 4984–4993 4991
and specificity between a ligand and its protein targetdepend on directional hydrogen bonds and ionic interac-tions, as well as on shape complementarity of the con-tact surfaces of both partners.26 Attempts to use theprograms XSCORE27 to evaluate the binding affinityof the ligands against HsPNP generated unsatisfactoryresults, with low correlation coefficient between experi-mental and predicted affinities.
In order to improve the results for computationallydetermined binding affinities, we developed a novelempirical scoring function. In spite of many problemsin the understanding of the structural features importantfor binding affinity, most of the experimental availabledata indicate that additive functions for protein–ligandinteractions might be good approach for the develop-ment of empirical scoring functions. With atomic coor-dinates (x,y,z) available for protein–ligand complexes,the analysis of the binding can be estimated as a sumof interactions multiplied by weighting coefficients (cj),as indicated by the following equation:
pKd ¼ c0 þXN
j¼1
cjfjðx; y; zÞ
pKd is the �logKd where Kd could also be either KM orKi, c0 is a regression constant, fjs are functions that ac-counts for van der Waals interactions, intermolecularhydrogen bonds, deformation, hydrophobic effect, andothers that may be included.
Most of the empirical functions use the size of the contactsurface at the protein–ligand interface to estimate thehydrophobic interaction. A reasonable correlation be-tween experimental affinities can be obtained with contactareas alone. We proposed here a novel set of scoring func-tions which are based on the observation that the majordeterminants to ligand specificity are intermolecularhydrogen bonds and hydrophobic contacts.28–30. Thepresent set of scoring functions contains 25 polynomialfunctions Table 4, comprising terms up to degree 2, whichmay involve cross-terms (HB and A). Determination ofthe intermolecular hydrogen bonds and contact areas of123 binary complexes available at PDBBIND31 was usedto propose this set of function (supplementary material).No human PNP structures were included in this dataset.This novel function is based exclusively on the hydrogenbonds (HB), contact area (A1), and accessible surface areafor the ligand (A2). The additive nature of the empiricalscoring functions generally leads to large ligands obtain-ing high scores. This effect is undesirable. Due to the over-estimation of the contact area term contribution to theempirical scoring function we devise a simple scheme toreduce this contribution. We introduced a penalty termthat diminishes the dependence of the score on molecularsize. We divided the squared contact area (A1 * A1) by theterm A2 � A1, which presents the highest values for com-plexes with A1 much smaller than A2. This scheme re-duces the contribution of the contact area term in theempirical function for those ligands with relatively smallcontact area. The empirical function that presents thehighest correlation coefficient between empirical and pre-dict binding affinity is composed of a polynomial function
involving the number of intermolecular hydrogen bonds(HB) and the modified contact area (A) as follows:
pKd ¼ c0 þ c1HB � Aþ c2A2
where c0 is the regression constant, c1 is the weight forthe term HB multiplied by contact area A, and c2 isthe weight for the squared A. The term A is determinedby the following equation:
A ¼ A12
ðA2� A1Þ
The terms A1 and A2 were calculated using the Lee andRichards algorithm32 implemented in the CCP4.33 Theintermolecular hydrogen bonds were determined usinga method derived from the one described for the pro-gram XSCORE.27 Standard multivariate regressionwas carried out on the whole training set.
4.3. Molecular docking
In order to generate binary complexes for HsPNP andSaPNP in complexes with different ligands, we usedthe docking program ZDOCK.34 We generated binarycomplexes for complexes between HsPNP and the li-gands for which crystallographic structures were notavailable. The same procedure was used to generate bin-ary complexes for SaPNP structure. In order to validateour methodology we generate binary complexes usingZDOCK for the crystallographic structures of HsPNPin complex with ligands. The docking simulation wasable to identify the ligand position with RMSD below0.5 A. We used the trimeric structure in all the docking
4992 R. A. Caceres et al. / Bioorg. Med. Chem. 16 (2008) 4984–4993
simulations. The trimers were generated based on thecrystallographic symmetry presenting the HsPNP.9
4.4. Analysis of the models
The overall stereochemical quality of the final modelsfor each enzyme of the SaPNP was assessed by the pro-gram PROCHECK35 and the objective function sup-plied by the program MODELLER. Atomic modelswere superposed using the program LSQKAB fromCCP433 and the intermolecular hydrogen bonds were as-sessed by the program LIGPLOT.36
4.5. Molecular dynamics simulations protocol
The SaPNP is biologically functional as a trimer so tobetter understand, the structure and dynamics featureswere submitted a molecular dynamics simulation(MD). The trimer of SaPNP was built following thecrystallographic HsPNP.9
MD were performed with the GROMACS37 packageusing the Gromos 96.1 (53A6) force field.38 The acyclo-vir (ACY) topology was generated with the PRODRGprogram.39 Accurate force fields are essential for repro-ducing the conformational and dynamic behavior of thecondensed-phase systems, the Gromos 96.1 force fieldswell parameterized for proteins but the parameters forsmall molecules are still limited for the simulations ofmore complicated biological systems, so for the atomiccharges in the ACY molecule was used GAMESS40
which were submitted to single-point ab initio calcula-tions at RHF 6-31G* level in order to obtain Lowdin de-rived charges. Manipulation of structures wasperformed with Pymol program.8 The first system wascomposed by apoenzyme SaPNP (system A) and thesecond by SaPNP enzyme and ACY ligand (system B).The simulations of two systems were performed by atime period of 4 ns. In both the systems were addedNa+ counter ions (33 Na+ ions on the system A and45 Na+ ions on the system B) using Genion Programof the GROMACS simulation suite to neutralize thenegative charge density of the systems.
Each structure was placed in the center of a truncatedcubic box filled with Extended Simple Point Charge(SPC/E) water molecules,41 containing 34,520 for thesystem A and 33,690 water molecules for the system B.The initial simulation cell dimensions were 79.54 A,83.76 A and 51.79 A for the system A and 79.49 A,80.17 A and 48.16 A for the system B, and had the pro-tein solvated by a layer of water molecules of at least10 A in all the directions in both the systems. Duringthe simulations, bonds lengths within the proteins wereconstrained by using LINCS algorithm.42 The SETTLEalgorithm was used to constrain the geometry of watermolecules.43 In the MD protocol, the binary complex,ions, and water molecules were first subjected to 1500steps of energy minimization by steepest descent fol-lowed 1500 steps of conjugate gradient to remove closevan der Waals contacts. The systems were then submit-ted to a short molecular dynamics with position re-strains for period of 20 ps and afterwards performed a
full molecular dynamics without restrains. The tempera-ture of the system was then increased from 50 K to300 K in five steps (50–100 K, 100–150 K, 150–200 K,200–250 K, 250–300 K), and the velocities at each stepwere reassigned according to the Maxwell–Boltzmanndistribution at that temperature and equilibrated for10 ps except the last part of thermalization phase, whichwas for 40 ps. Energy minimization and MD were car-ried out under periodic boundary conditions. The simu-lation was computed in the NPT ensemble at 300 K withthe Berendsen temperature coupling and constant pres-sure of 1 atm with isotropic molecule-based scaling.44
The LINCS algorithm, with a 10�5 A tolerance, was ap-plied to fix all bonds containing a hydrogen atom, allow-ing the use of a time step of 2.0 fs in the integration ofthe equations of motion. No extra restraints were ap-plied after the equilibration phase. The electrostaticinteractions between nonligand atoms were evaluatedby the particle-mesh Ewald method45 with a charge gridspacing of �1.0 A and the charge grid was interpolatedon a cubic grid with the direct sum tolerance set to1.0 · 10�5. The Lennard–Jones interactions were evalu-ated using a 9.0 A atom-based cutoff.46
All the analysis were performed on the ensemble of sys-tem configurations extracted at 0.5-ps time intervalsfrom the simulation, and MD trajectory collection wasinitiated after 2 ns of dynamics to guarantee a com-pletely equilibrated evolution. The MD simulation andresults analysis were performed on a personal computeIntel Core 2 Duo E6300—1.86 GHz and 4 GB RAM.
The convergence of the different simulations was ana-lyzed in terms of the secondary structure, rootmean-square deviation (RMSD) from the initial modelsstructures, and root mean-square fluctuation (RMSF) toestimate the B-factor. For the B-factor calculation, theRMSFs were calculated relative to the last 2 ns averagedbackbone structures, and all coordinate frames from thetrajectories were first superimposed on the initial confor-mation to remove any effect of overall translation androtation. Atomic isotropic B-factors were calculatedfrom trajectories using the equation
B-factori ¼ ð8p2=3Þðhr2i i � hrii2Þ;
where ðhr2i i � hrii2Þ is the mean-square positional fluctu-
ation of atom i.47,48
Acknowledgments
This work was supported by grants from CNPq,CAPES, and Instituto do Milenio (CNPq-MCT).WFA, DSS and LAB are senior researchers of CNPq(Conselho Nacional de Pesquisas, Brazil).
Supplementary data
Supplementary data associated with this article can befound, in the online version, at doi:10.1016/j.bmc.2008.03.044.
R. A. Caceres et al. / Bioorg. Med. Chem. 16 (2008) 4984–4993 4993
References and notes
1. Lindahl, G.; Stalhammar-Carlemalm, M.; Areschoug, T.Clin. Microbiol. Rev. 2005, 18, 102.
2. Montgomery, J. A. Med. Res. Rev. 1993, 13, 209.3. Kalckar, H. M. J. Biol. Chem. 1947, 167, 429.4. Canduri, F.; Fadel, V.; Basso, L. A.; Palma, M. S.; Santos,
D. S.; de Azevedo, W. F., Jr. Biochem. Biophys. Res.Commun. 2005, 327, 646.
5. Bzowska, A.; Kulikowska, E.; Shugar, D. Pharmacol.Ther. 2000, 88, 349.
6. Pugmire, M. J.; Ealick, S. E. Biochem. J. 2002, 361, 1.7. Silva, R. G.; Nunes, J. E. S.; Canduri, F.; Borges, J. C.;
Gava, L. M.; Moreno, F. B.; Basso, L. A.; Santos, D. S.Curr. Drugs Target 2007, 8, 413.
8. Delano, W. L.; Lam, J. W. Abstr. Pap. Am. Chem. Soc.2005, 230, 1371.
9. Azevedo, W. F.; Canduri, F.; dos Santos, D. M.; Silva, R.G.; Oliveira, J. S.; Carvalho, L. P. S.; Basso, L. A.;Mendes, M. A.; Palma, M. S.; Santos, D. S. Biochem.Biophys. Res. Commun. 2003, 308, 545.
10. Chou, P. Y.; Fasman, G. D. Adv. Enzymol. Relat. AreasMol. Biol. 1978, 47, 45.
11. Jones, D. T. J. Mol. Biol. 1999, 292, 195.12. Mark, A. E.; van Gunsteren, W. F. J. Mol. Biol. 1994, 240,
167.13. Williams, D.; Bardsley, B. Perspect. Drug Discovery Des.
1999, 17, 43.14. Alexander, C. S.; Yan, X.; Pei, T. Biophys. J. 2005, 88,
1009.15. Nunez, S.; Wing, C.; Antoniou, D.; Schramm, V. L.;
Schwartz, S. D. J. Phys. Chem. 2006, 110, 463.16. Kroemer, R. T.; Doughty, S. W.; Robinson, A. J.;
Richards, W. G. Protein Eng. 1996, 9, 493.17. dos Santos, D. M.; Canduri, F.; Pereira, J. H.; Dias, M. V.
B.; Silva, R. G.; Mendes, M. A.; Palma, M. S.; Basso, L.A.; de Azevedo, W. F.; Santos, D. S. Biochem. Biophys.Res. Commun. 2003, 308, 553.
18. de Azevedo, W. F.; Canduri, F.; dos Santos, M. D.;Pereira, J. H.; Dias, M. V. B.; Silva, R. G.; Mendes, M. A.;Basso, L. A.; Palma, M. S.; Santos, D. S. Biochem.Biophys. Res. Commun. 2003, 312, 767.
19. Silva, R. G.; Pereira, J. H.; Canduri, F.; de Azevedo, W.F., Jr.; Basso, L. A.; Santos, D. S. Arch. Biochem. Biophys.2005, 442, 49.
20. Canduri, F.; Silva, R. G.; dos Santos, D. M.; Palma, M.S.; Basso, L. A.; Santos, D. S.; de Azevedo, W. F. ActaCrystallogr., Sect. D Biol. Crystallogr. 2005, 61, 856.
21. Canduri, F.; dos Santos, D. M.; Silva, R. G.; Mendes, M.A.; Basso, L. A.; Palma, M. S.; de Azevedo, W. F., Jr.;Santos, D. S. Biochem. Biophys. Res. Commun. 2004, 313,907.
22. Uchoa, H. B.; Jorge, G. E.; Da Silveira, N. J. F.; Camera,J. C.; Canduri, F.; de Azevedo, W. F. Biophys. Res.Commun. 2004, 325, 1481.
23. Sali, A.; Blundell, T. L. J. Mol. Biol. 1993, 234, 779.
24. Canduri, F.; Uchoa, H. B.; de Azevedo, W. F., Jr.Biochem. Biophys. Res. Commun. 2004, 324, 661.
25. Hall, T. A. Nucleic Acids Symp. Ser. 1999, 41, 95.26. De Azevedo, W. F.; Mueller-Dieckmann, J. H.; Schulze-
Gahmen, U.; Worland, P. J.; Sausville, E.; Kim, S. H.Proc. Natl. Acad. Sci. U.S.A. 1996, 93, 2735.
27. Wang, R.; Liu, L.; Lai, L.; Tang, Y. J. Mol. Mod. 1998, 4,379.
28. Boehm, H. –J.; Klebe, G. Angew. Chem. Int. Ed. Engl.1996, 35, 2588.
29. Matsumara, M.; Becktel, W. J.; Matthews, B. W. Nature1988, 334, 406.
30. Nauchatel, V.; Villaverde, M. C.; Sussman, F. Protein Sci.1995, 4, 1356.
31. Wang, R.; Fang, X.; Lu, Y.; Yang, C. Y.; Wang, S.J. Med. Chem. 2005, 48, 4111.
32. Lee, R.; Richards, F. M. J. Mol. Biol. 1971, 55, 379.33. Collaborative Computation Project, Number 4 Acta
Crystallogr., Sect. D Biol. Crystallogr. 1994, 50, 760.34. Chen, R.; Li, L.; Weng, Z. Proteins 2003, 52, 80.35. Laskowski, R. A.; Macarthur, M. W.; Moss, D. S.;
Thornton, J. M. J. Appl. Crystallogr. 1993, 26, 283.36. Wallace, A. C.; Laskowski, R. A.; Thornton, J. M. Protein
Eng. 1995, 8, 127.37. van der Spoel, D.; Lindahl, E.; Hess, B.; Groenhof, G.;
Mark, A. E.; Berendsen, H. J. C. J. Comput. Chem. 2005,26, 1701.
38. Ooestenbrik, C.; Soares, T. A.; van der Vegt, N. F. A.; vanGunsteren, W. F. Eur. Biophys. J. 2005, 34, 273.
39. van Aalten, D. M. F.; Bywater, B.; Findlay, J. B. C.;Hendlich, M.; Hooft, R. W. W.; Vriend, G. J. Comput.Aided Mol. Des. 1996, 10, 255.
40. Schmidt, M. W.; Baldridge, K. K.; Boatz, J. A.; Elbert,S. T.; Gordon, M. S.; Jensen, J. H.; Koseki, S.;Matsunaga, N.; Nguyen, K. A.; Su, S. J.; Windus, T.L.; Dupuis, M.; Montgomery, J. A. J. Comput. Chem.1993, 14, 1347.
41. Berendsen, H. J. C.; Postma, J. P. M.; van Gunsteren, W.F.; Hermans, J. Interaction models for water in relation toprotein hydration. In Intermolecular Forces; Pullman, B.,Ed.; Reidel D. Publishing Company: Dordrecht, TheNetherlands, 1981; p 331.
42. Hess, B.; Bekker, H.; Berendsen, H. J. C.; Fraaije, J. G. E.M. J. Comput. Chem. 1997, 18, 1463.
43. Miyamoto, S.; Kollman, P. A. J. Comput. Chem. 1992, 13,952.
44. Chowdhuri, S.; Tan, Ming-Liang; Ichiye, T. J. Chem.Phys. 2006, 125, 144513.
45. Darden, T.; York, D.; Pedersen, L. A. J. Chem. Phys.1993, 98, 10089.
46. de Souza, O. N.; Ornstein, R. L. J. Biomol. Struct. Dyn.1999, 16, 1205.
47. Hunenberger, P. H.; Mark, A. E.; van Gunsteren, W. F. J.Mol. Biol. 1995, 252, 492.
48. van Gunsteren, W. F.; Mark, A. E. J. Chem. Phys. 1998,108, 6109.
Related Documents

![Streptococcus agalactiae Sequence Type 283 in Farmed Fish ... › eid › article › 25 › 4 › pdfs › 18-0543.pdf · treptococcus agalactiae (group B Streptococcus [GBS]) is](https://static.cupdf.com/doc/110x72/5f20816083700258507b93a1/streptococcus-agalactiae-sequence-type-283-in-farmed-fish-a-eid-a-article.jpg)


