The interaction of actin with myosin powers motility of striated and smooth muscle and is the basis for many different kinds of biological motility. Due to its regular organization at all structural levels, skeletal muscle is the most suitable object for investigation of the mechanism of the actin–myosin biological motor. This review presents a brief description of investigations of intramuscular actin– myosin interaction and the presentday data of protein crystallography, electron microscopy, biochemistry, and protein engineering. Special attention is given to Xray studies of intact muscle and isolated muscle fibers with permeable membrane able to generate active force and perform mechanical work. Such studies carried out on advanced sources of synchrotron radiation make it possi ble to study the motility of myosin molecular motors under conditions close to physiological with high time and spatial resolution. The first experimental data on structure of the mus cle contractile apparatus were obtained by Hugh Huxley using the Xray diffraction technique [1]. He used a labo ratory source of Xray radiation and a miniature chamber (a window for the 5 µm ray and 3 cm distance between preparation and detector) and obtained smallangle Xray diffraction patterns of living muscle at rest and under active contraction. These data combined with those of electron microscopy made it possible to design the first scheme of package of thick and thin filaments in a sar comere. The development of synchrotron radiation sources and occurrence of highspeed twodimensional detectors opened new possibilities for structural investiga tions of actin–myosin motor with unique time [2] and spatial [3] resolution. This method is still attractive for presentday experimenters because, unlike many differ ent high technology methods, it allows structural alter ations of muscle proteins directly in a cell to be followed simultaneously with changes in its physical parameters. STRUCTURE OF SKELETAL MUSCLE. MYOSIN, ACTIN, REGULATORY PROTEINS. THE SLIDING FILAMENT THEORY A skeletal muscle consists of bundles of cells or fibers packed in parallel (Fig. 1). The characteristic cell diame ter is 50100 µm, and the length varies widely. Each fiber is a single big multinuclear cell in which nuclei are locat ed on the surface, while all the remaining space is occu ISSN 00062979, Biochemistry (Moscow), 2011, Vol. 76, No. 13, pp. 14841506. © Pleiades Publishing, Ltd., 2011. Original Russian Text © N. A. Koubassova, A. K. Tsaturyan, 2011, published in Uspekhi Biologicheskoi Khimii, 2011, Vol. 51, pp. 233282. REVIEW 1484 * To whom correspondence should be addressed. Molecular Mechanism of Actin–Myosin Motor in Muscle N. A. Koubassova* and A. K. Tsaturyan Institute of Mechanics, Lomonosov Moscow State University, Michurinsky pr. 1, 119192 Moscow, Russia; Email: [email protected] Received May 31, 2011 Revision received June 21, 2011 Abstract—The interaction of actin and myosin powers striated and smooth muscles and some other types of cell motility. Due to its highly ordered structure, skeletal muscle is a very convenient object for studying the general mechanism of the actin–myosin molecular motor. The history of investigation of the actin–myosin motor is briefly described. Modern con cepts and data obtained with different techniques including protein crystallography, electron microscopy, biochemistry, and protein engineering are reviewed. Particular attention is given to Xray diffraction studies of intact muscles and single mus cle fibers with permeabilized membrane as they give insight into structural changes that underlie force generation and work production by the motor. Timeresolved lowangle Xray diffraction on contracting muscle fibers using modern synchrotron radiation sources is used to follow movement of myosin heads with unique time and spatial resolution under near physio logical conditions. DOI: 10.1134/S0006297911130086 Key words: actin, myosin, muscle, ATPase, structure, Xray diffraction

Welcome message from author
This document is posted to help you gain knowledge. Please leave a comment to let me know what you think about it! Share it to your friends and learn new things together.
Transcript

The interaction of actin with myosin powers motility
of striated and smooth muscle and is the basis for many
different kinds of biological motility. Due to its regular
organization at all structural levels, skeletal muscle is the
most suitable object for investigation of the mechanism of
the actin–myosin biological motor. This review presents a
brief description of investigations of intramuscular actin–
myosin interaction and the present�day data of protein
crystallography, electron microscopy, biochemistry, and
protein engineering. Special attention is given to X�ray
studies of intact muscle and isolated muscle fibers with
permeable membrane able to generate active force and
perform mechanical work. Such studies carried out on
advanced sources of synchrotron radiation make it possi�
ble to study the motility of myosin molecular motors
under conditions close to physiological with high time
and spatial resolution.
The first experimental data on structure of the mus�
cle contractile apparatus were obtained by Hugh Huxley
using the X�ray diffraction technique [1]. He used a labo�
ratory source of X�ray radiation and a miniature chamber
(a window for the 5 µm ray and 3 cm distance between
preparation and detector) and obtained small�angle X�ray
diffraction patterns of living muscle at rest and under
active contraction. These data combined with those of
electron microscopy made it possible to design the first
scheme of package of thick and thin filaments in a sar�
comere. The development of synchrotron radiation
sources and occurrence of high�speed two�dimensional
detectors opened new possibilities for structural investiga�
tions of actin–myosin motor with unique time [2] and
spatial [3] resolution. This method is still attractive for
present�day experimenters because, unlike many differ�
ent high technology methods, it allows structural alter�
ations of muscle proteins directly in a cell to be followed
simultaneously with changes in its physical parameters.
STRUCTURE OF SKELETAL MUSCLE. MYOSIN,
ACTIN, REGULATORY PROTEINS.
THE SLIDING FILAMENT THEORY
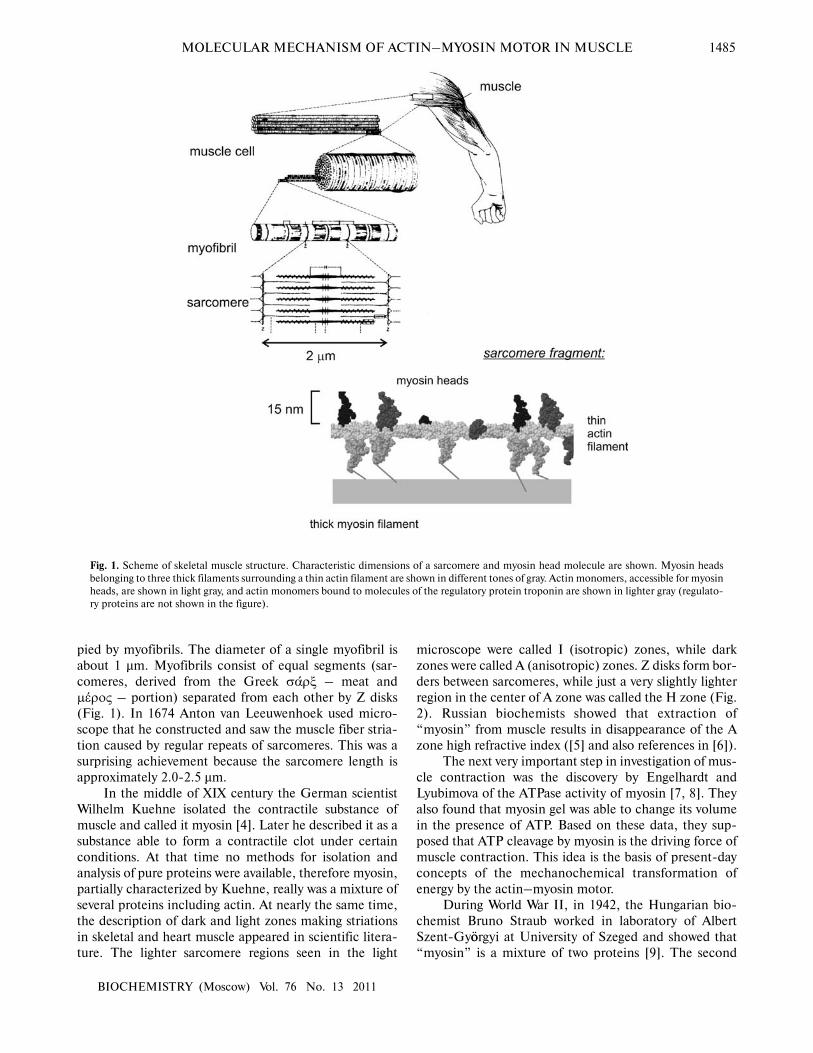
A skeletal muscle consists of bundles of cells or fibers
packed in parallel (Fig. 1). The characteristic cell diame�
ter is 50�100 µm, and the length varies widely. Each fiber
is a single big multinuclear cell in which nuclei are locat�
ed on the surface, while all the remaining space is occu�
ISSN 0006�2979, Biochemistry (Moscow), 2011, Vol. 76, No. 13, pp. 1484�1506. © Pleiades Publishing, Ltd., 2011.
Original Russian Text © N. A. Koubassova, A. K. Tsaturyan, 2011, published in Uspekhi Biologicheskoi Khimii, 2011, Vol. 51, pp. 233�282.
REVIEW
1484
* To whom correspondence should be addressed.
Molecular Mechanism of Actin–Myosin Motor in Muscle
N. A. Koubassova* and A. K. Tsaturyan
Institute of Mechanics, Lomonosov Moscow State University, Michurinsky pr. 1,
119192 Moscow, Russia; E�mail: [email protected]
Received May 31, 2011
Revision received June 21, 2011
Abstract—The interaction of actin and myosin powers striated and smooth muscles and some other types of cell motility.
Due to its highly ordered structure, skeletal muscle is a very convenient object for studying the general mechanism of the
actin–myosin molecular motor. The history of investigation of the actin–myosin motor is briefly described. Modern con�
cepts and data obtained with different techniques including protein crystallography, electron microscopy, biochemistry, and
protein engineering are reviewed. Particular attention is given to X�ray diffraction studies of intact muscles and single mus�
cle fibers with permeabilized membrane as they give insight into structural changes that underlie force generation and work
production by the motor. Time�resolved low�angle X�ray diffraction on contracting muscle fibers using modern synchrotron
radiation sources is used to follow movement of myosin heads with unique time and spatial resolution under near physio�
logical conditions.
DOI: 10.1134/S0006297911130086
Key words: actin, myosin, muscle, ATPase, structure, X�ray diffraction
MOLECULAR MECHANISM OF ACTIN–MYOSIN MOTOR IN MUSCLE 1485
BIOCHEMISTRY (Moscow) Vol. 76 No. 13 2011
pied by myofibrils. The diameter of a single myofibril is
about 1 µm. Myofibrils consist of equal segments (sar�
comeres, derived from the Greek σαρξ – meat and
µερος – portion) separated from each other by Z disks
(Fig. 1). In 1674 Anton van Leeuwenhoek used micro�
scope that he constructed and saw the muscle fiber stria�
tion caused by regular repeats of sarcomeres. This was a
surprising achievement because the sarcomere length is
approximately 2.0�2.5 µm.
In the middle of XIX century the German scientist
Wilhelm Kuehne isolated the contractile substance of
muscle and called it myosin [4]. Later he described it as a
substance able to form a contractile clot under certain
conditions. At that time no methods for isolation and
analysis of pure proteins were available, therefore myosin,
partially characterized by Kuehne, really was a mixture of
several proteins including actin. At nearly the same time,
the description of dark and light zones making striations
in skeletal and heart muscle appeared in scientific litera�
ture. The lighter sarcomere regions seen in the light
microscope were called I (isotropic) zones, while dark
zones were called A (anisotropic) zones. Z disks form bor�
ders between sarcomeres, while just a very slightly lighter
region in the center of A zone was called the H zone (Fig.
2). Russian biochemists showed that extraction of
“myosin” from muscle results in disappearance of the A
zone high refractive index ([5] and also references in [6]).
The next very important step in investigation of mus�
cle contraction was the discovery by Engelhardt and
Lyubimova of the ATPase activity of myosin [7, 8]. They
also found that myosin gel was able to change its volume
in the presence of ATP. Based on these data, they sup�
posed that ATP cleavage by myosin is the driving force of
muscle contraction. This idea is the basis of present�day
concepts of the mechanochemical transformation of
energy by the actin–myosin motor.
During World War II, in 1942, the Hungarian bio�
chemist Bruno Straub worked in laboratory of Albert
Szent�Gyoörgyi at University of Szeged and showed that
“myosin” is a mixture of two proteins [9]. The second
Fig. 1. Scheme of skeletal muscle structure. Characteristic dimensions of a sarcomere and myosin head molecule are shown. Myosin heads
belonging to three thick filaments surrounding a thin actin filament are shown in different tones of gray. Actin monomers, accessible for myosin
heads, are shown in light gray, and actin monomers bound to molecules of the regulatory protein troponin are shown in lighter gray (regulato�
ry proteins are not shown in the figure).

1486 KOUBASSOVA, TSATURYAN
BIOCHEMISTRY (Moscow) Vol. 76 No. 13 2011
protein was called actin due to its ability to activate ATP
hydrolysis by myosin. It was shown that actin and myosin
dissociate after addition of ATP. Later Szent�Gyoörgyi
showed that glycerol�treated muscle fibers containing
only the main contractile proteins shorten after addition
of ATP [10].
In 1953, Hugh Huxley and Jean Hanson showed
using electron microscopy that there are two filament
families within sarcomere, thick and thin, but they were
very careful in interpreting the results and did not try to
combine them with any of the then existing hypotheses
on the nature of muscle contraction [11]. In the next year
two works appeared independently in Nature [12, 13].
The authors used different experimental methods and
showed that I zones contain only thin filaments, while A
zones contain filaments of both types, and sarcomeres
shorten upon contraction so that the length of the A zone
does not change and only I zones become shorter (Fig. 3).
The authors supposed that the filaments do not change
their length upon contraction, but they slide with respect
to each other. This hypothesis of sliding filaments was
later repeatedly confirmed experimentally and became
the basis for present�day concepts on the physics of mus�
cle contraction.
Of course, the term “muscle contraction” is histori�
cal and not quite correct. It implies accomplishment by a
muscle of mechanical work, i.e. shortening against exter�
nal force, free active shortening without load, or develop�
ment of active mechanical tension upon constant length
(isometric contraction) in the absence of mechanical
work. The muscle is able to lengthen only in response to
external forces exceeding the isometric one.
Thin filaments consist mainly of actin protein. Actin
is a very widespread and highly conservative protein with
molecular mass 42 kDa. Actin monomers (they are often
called globular or G�actin) are able to polymerize and
form fibrillar F�actin. The polymeric actin filament has
helical structure (Figs. 1 and 9) that is often presented as
a simple left helix 13/6 (i.e. a complete helix pitch is
formed by 13 subunits and contains six full turns). The
axial pitch between monomers is about 2.75 nm and the
angle of rotation of neighboring monomers is about 167°,
i.e. the full period is equal to 13 × 2.75 ≈ 36 nm [55]. The
length of artificial actin filament obtained by G�actin
polymerization may reach 20 µm; its length in a sarco�
mere of the skeletal muscle of warm�blooded animals is
about 1 µm. Some other proteins are also present in thin
filaments of striated muscle. The most important of them
are the regulatory proteins tropomyosin and troponin
controlled by Ca2+ and providing both activation of mus�
cle contraction and muscle relaxation [14, 15].
Tropomyosin (Tm) was discovered already during the
post�war period [16]. Its molecule consists of two mutu�
ally twisted α�helices and looks like a long slightly bent
helix, approximately complementary to actin helix [17];
the molecular mass of tropomyosin is 65 kDa. Adjacent
tropomyosin molecules are joined to each other in the
“tail�to�head” manner [18] and form two long rods along
the whole actin filament. Troponin is a globular 80�kDa
protein discovered in Ebashi’s laboratory in the 1960s
[19�21]. It consists of three subunits (Tn�I, Tn�C, and
Tn�T). Tn�C (calcium binding) exhibits significant affin�
ity to calcium ions, Tn�I (inhibiting) can bind actin, thus
fixing the whole troponin–tropomyosin complex on its
surface and thus inhibiting both binding of myosin heads
a
b
Fig. 2. Contractile apparatus of skeletal muscle. a) The photo�
graph was obtained under a light microscope. Optically distin�
guished sarcomere zones are shown. b) Electron microphoto�
graph.
Fig. 3. Illustration of the sliding filament hypothesis. It is seen
that when the length of the sarcomere changes, the length of the
A zone (the thick filament zone) remains constant and only the
length of the I zone (the part of actin filaments not overlapped
with myosin) changes. The region including both actin filaments
and parts of the head�containing myosin filaments is called the
overlap zone.

MOLECULAR MECHANISM OF ACTIN–MYOSIN MOTOR IN MUSCLE 1487
BIOCHEMISTRY (Moscow) Vol. 76 No. 13 2011
to actin and their ATPase activity, or it itself joins Tn�C,
thus weakening contacts of regulatory proteins with actin.
Tn�T (tropomyosin�binding) provides association of two
other subunits with each other and with tropomyosin.
Each troponin complex is bound to one tropomyosin
molecule, the axial period of the troponin–tropomyosin
complex repeat on the thin filament being 14 pitches of
the main actin helix, i.e. 14 × 2.75 nm ≈ 38.5 nm, a bit
higher than the period of the actin helix.
The muscle would not be able to fulfill its function if
it constantly existed in “on” condition. The presence of
controlled contact “switches” is necessary for efficient
work. Calcium ions serve as these “switches”. In response
to stimulation, intracellular Ca2+ concentration increases
from 10–7 to 10–5 M. Depending on localization of Ca2+�
binding proteins, the following activation types are distin�
guished: the myosin one, characteristic of smooth muscle
and some mollusk proteins, and actin one, predominant
in striated muscle.
The model of actin regulation of striated muscle [22�
24] suggests that in response to Ca2+ binding to Tn�C
[25], troponin turns the bound tropomyosin rod along the
surface of actin so that myosin�binding sites are available
on actin monomers (Fig. 4). Works of different research
groups (for example, [26]) presently deal with investiga�
tion of coupling between muscle regulation and mechan�
ics of its contraction.
It is known that the motor protein myosin, forming
thick filaments, exhibits high variability [27]. By now, 24
myosin classes have been described and amino acid
sequences of over 100 members of this protein superfam�
ily identified [28, 29]. All myosins contain one or two
heavy and several light polypeptide chains. The N�termi�
nus of each heavy chain forms a globular myosin head or
subfragment 1 (S1) able to bind actin and hydrolyze ATP
[30, 31]. ATP hydrolysis results in release of chemical
energy that is transformed into mechanical work during
the actin–myosin interaction [8].
Myosin head continues to the neck, a long α�helical
region of heavy chain, with which light chains are associ�
ated. Their number in different types of myosins varies
over wide limits. The muscle type II myosin contains two
heavy and four light chains. The C�terminal regions of
each heavy chain form coiled�coil subfragment 2 (S2)
connected via a flexible link to a long rod also coiled�coil
region called light meromyosin (LMM). At physiological
Fig. 4. Scheme of sarcomere structure. Packing of main muscle proteins in thin (a, b) and thick (c, d) filaments is shown. The number of
myosin molecules in the thick filament crowns may vary depending on species, in muscle of higher vertebrates being three.
H�zone
1488 KOUBASSOVA, TSATURYAN
BIOCHEMISTRY (Moscow) Vol. 76 No. 13 2011
ionic strength of the surrounding solution, rod regions of
myosin molecules aggregate and form myosin filaments
(Fig. 4). In skeletal muscle these filaments have helical
symmetry and constitute a three�strand right helix with
period of about 43 nm and axial distance between crowns
of protruding myosin heads ~14.3 nm. Long superhelical
parts of myosin molecules (LMM) form the backbone of
the 15�nm thick myosin filament. In addition to the main
protein of thick filament, myosin, there are also different
proteins like titin, myosin binding protein C, MyBP�C,
etc. [32, 33].
CROSS�BRIDGE MODEL OF MUSCLE
CONTRACTION, LEVER ARM HYPOTHESIS
The first molecular theories describing the mecha�
nism of muscle contraction appeared in the 1930s, but
none of them was correct. The basis of present�day con�
cepts is the above�described hypothesis of sliding fila�
ments [12, 13]. In these works there was a question con�
cerning the force that makes filaments slide, and it was
supposed that some structures joining thin and thick fila�
ments are responsible for this action. Soon it was shown
using electron microscopy that there are protrusions of
myosin filaments forming cross�bridges with actin [34,
35], and it was shown later that just myosin heads, form�
ing these bridge, exhibit ATPase activity. Two positions of
cross�bridges were found in the flight muscle of insects:
perpendicular to actin filaments and inclined at approxi�
mately 45° [36].
Structural and biochemical experimental data avail�
able at the beginning of the 1970s were combined in the
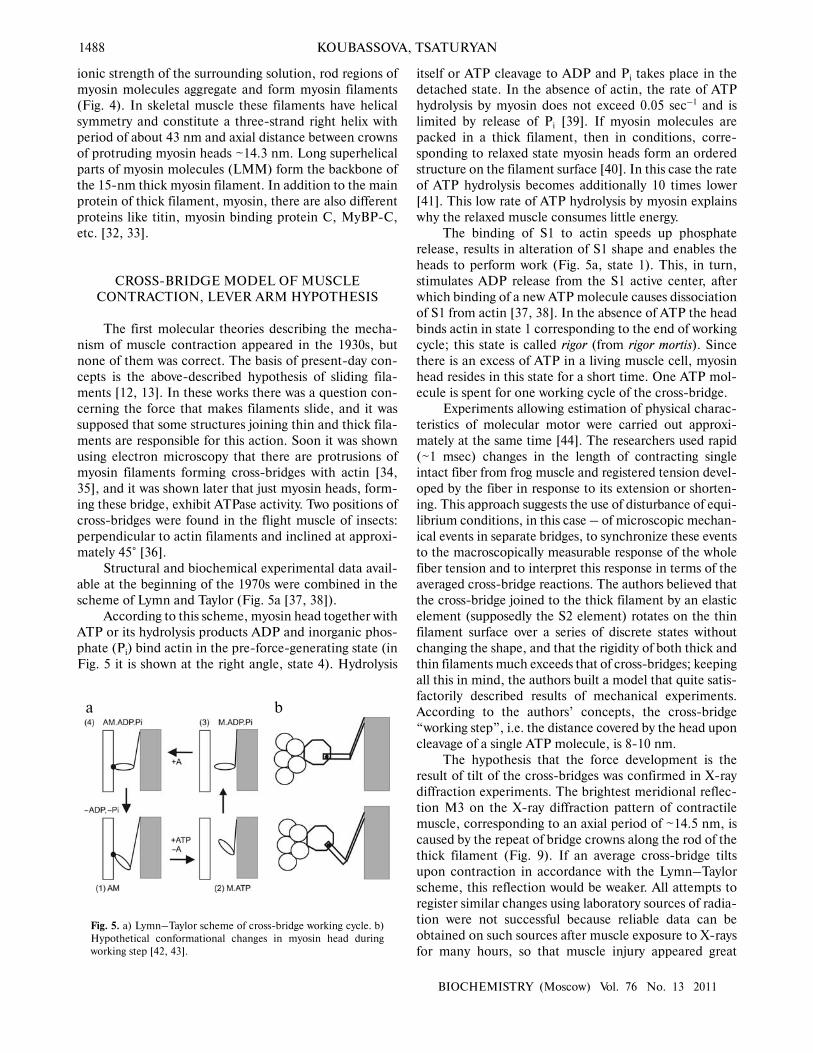
scheme of Lymn and Taylor (Fig. 5a [37, 38]).
According to this scheme, myosin head together with
ATP or its hydrolysis products ADP and inorganic phos�
phate (Pi) bind actin in the pre�force�generating state (in
Fig. 5 it is shown at the right angle, state 4). Hydrolysis
itself or ATP cleavage to ADP and Pi takes place in the
detached state. In the absence of actin, the rate of ATP
hydrolysis by myosin does not exceed 0.05 sec–1 and is
limited by release of Pi [39]. If myosin molecules are
packed in a thick filament, then in conditions, corre�
sponding to relaxed state myosin heads form an ordered
structure on the filament surface [40]. In this case the rate
of ATP hydrolysis becomes additionally 10 times lower
[41]. This low rate of ATP hydrolysis by myosin explains
why the relaxed muscle consumes little energy.
The binding of S1 to actin speeds up phosphate
release, results in alteration of S1 shape and enables the
heads to perform work (Fig. 5a, state 1). This, in turn,
stimulates ADP release from the S1 active center, after
which binding of a new ATP molecule causes dissociation
of S1 from actin [37, 38]. In the absence of ATP the head
binds actin in state 1 corresponding to the end of working
cycle; this state is called rigor (from rigor mortis). Since
there is an excess of ATP in a living muscle cell, myosin
head resides in this state for a short time. One ATP mol�
ecule is spent for one working cycle of the cross�bridge.
Experiments allowing estimation of physical charac�
teristics of molecular motor were carried out approxi�
mately at the same time [44]. The researchers used rapid
(~1 msec) changes in the length of contracting single
intact fiber from frog muscle and registered tension devel�
oped by the fiber in response to its extension or shorten�
ing. This approach suggests the use of disturbance of equi�
librium conditions, in this case – of microscopic mechan�
ical events in separate bridges, to synchronize these events
to the macroscopically measurable response of the whole
fiber tension and to interpret this response in terms of the
averaged cross�bridge reactions. The authors believed that
the cross�bridge joined to the thick filament by an elastic
element (supposedly the S2 element) rotates on the thin
filament surface over a series of discrete states without
changing the shape, and that the rigidity of both thick and
thin filaments much exceeds that of cross�bridges; keeping
all this in mind, the authors built a model that quite satis�
factorily described results of mechanical experiments.
According to the authors’ concepts, the cross�bridge
“working step”, i.e. the distance covered by the head upon
cleavage of a single ATP molecule, is 8�10 nm.
The hypothesis that the force development is the
result of tilt of the cross�bridges was confirmed in X�ray
diffraction experiments. The brightest meridional reflec�
tion M3 on the X�ray diffraction pattern of contractile
muscle, corresponding to an axial period of ~14.5 nm, is
caused by the repeat of bridge crowns along the rod of the
thick filament (Fig. 9). If an average cross�bridge tilts
upon contraction in accordance with the Lymn–Taylor
scheme, this reflection would be weaker. All attempts to
register similar changes using laboratory sources of radia�
tion were not successful because reliable data can be
obtained on such sources after muscle exposure to X�rays
for many hours, so that muscle injury appeared great
Fig. 5. a) Lymn–Taylor scheme of cross�bridge working cycle. b)
Hypothetical conformational changes in myosin head during
working step [42, 43].
a b

MOLECULAR MECHANISM OF ACTIN–MYOSIN MOTOR IN MUSCLE 1489
BIOCHEMISTRY (Moscow) Vol. 76 No. 13 2011
before the reliable measurement of reflection intensity
became possible. The first centers using synchrotron radi�
ation for investigation of biological objects were built in
Hamburg (DESY [45, 46]). Key experiments were carried
out in the 1980s. It was shown that the change in the
14.5 nm reflection intensity takes place on the same mil�
lisecond time scale as the tension changes [47]. If the
contractile muscle undergoes rapid shortening like in
experiments of Huxley and Simmons [44], then the
intensity of the M3 meridional reflection decreases. If the
specimen quickly (during 1�2 msec) returns to its initial
length, the reflection intensity also returns to the initial
level. However, if the specimen length was not restored
and kept constant after shortening, then the reflection
intensity was also restored, although much more slowly
[48]. As soon as all used methods were improved, these
experiments were repeated on single intact frog muscle
fiber at the synchrotron radiation source SRS with sub�
millisecond time resolution (Daresbury Laboratory, GB)
[49]. Experimental recording of cross�bridge movements
simultaneously with changes in tension provided powerful
support of the tilting cross�bridge hypothesis.
In the second half of 1980s in vitro motility systems
were created in which proteins actin and myosin, isolated
from muscle, moved relative each other in vitro in the
presence of ATP [50�52]. Thus, it was finally proved that
ATP, actin, and myosin, or more exactly S1, are able to
provide active mechanical motility in the absence of
supramolecular organization and other substances.
Remarkable experiments were carried out by Hugh
Huxley et al. They registered changes at the second actin
layer line upon activation of the whole muscle. It
appeared that the increase of intensity at this line over
sufficiently large reciprocal radii happens immediately
after the beginning of activation and leaves tension devel�
opment behind. Such intensity increase could be caused
only by the thin filament proteins, namely by the
tropomyosin turn along the actin surface which intensi�
fies four�folded filament symmetry. This was an obvious
confirmation of the mechanism of steric regulation of the
thin filaments [53].
In 1990, protein crystallography was used to obtain
the first atomic structure of actin monomer and to pro�
pose a model structure of F�actin [54, 55], while the
atomic structure of S1 of chicken muscle myosin was
determined in 1993 [56]. Later different actin and S1
structures were also obtained. The latest actin model that
can be considered as really atomic was obtained recently
[57]. It appeared that conformation of actin monomers
noticeably changes upon polymerization. This explains
why only actin filaments rather than globular actin are
able to bind myosin and maintain its motility.
The myosin head or the myosin proteolytic fragment
S1 contains a heavy chain (95 kDa) and two associated
light chains (~15�20 kDa each). It retains the whole
enzymic activity of myosin and is the minimal fragment
that retains motor activity of the whole molecule. Further
proteolysis divides the S1 heavy chain to three fragments
named after their molecular mass values 25 kDa N�termi�
nal fragment, 50 kDa central fragment, and 20 kDa C�
terminal fragment. The first crystallographic structure of
S1 was obtained at high salt concentration and in the
absence of bound nucleotide [56], its heavy chain con�
tains 843 amino acids (PDB code 2MYS).
It appeared that myosin head resembles in shape the
head of a small beast with slightly open jaws (Fig. 6). A
long neck is formed by the heavy chain α�helical region
and associated light chains, one of which is called essen�
tial, and the other regulatory. The neck as a lever increas�
es small changes in converter domain to significant
changes; in terms of protein, these are transfers of C ter�
minus where the head is connected to S2 and then to the
thick filament. In fact, the motor head region consists of
several domains involved in binding of actin and ATP (and
after hydrolysis – to its hydrolysis products Pi and ADP).
The cleft divides the central 50 kDa domain to two subdo�
mains, upper and lower, and both of them are involved in
actin binding. The ATP binding site or “pocket” is local�
Fig. 6. Structure of myosin head (S1) according to [56]. A general view is shown on the left and the main structure–functional elements are
designated; the region of catalytic domain contact with lever arm and some of their details are shown at high magnification on the right: relay
helix, relay loop, and converter.
NC
1490 KOUBASSOVA, TSATURYAN
BIOCHEMISTRY (Moscow) Vol. 76 No. 13 2011
ized between the upper “jaw” (upper subdomain) and N�
terminal region of S1 and is situated near a 7�strand βsheet. This sheet serves as a “frame” to which the main
motor details are fixed. The lower “jaw” is also joined to
the ATPase active center via “switch�2”. All these details
can move relative to each other and their correct coordi�
nated movement provides the motor functioning.
Soon after first S1 structure was determined, rather
quickly several other structures of different types of
myosin heads in different configurations were obtained
[58�67]. Biochemists offered enormous help to crystallo�
graphers when they discovered the way to express short�
fragment myosin motor domain [68]. Although obtaining
the atomic structure of the complete S1 is a heroic prob�
lem, the shortened S1 (without the long “lever” or its
part) are crystallized rather easily. It appeared that S1 of
myosin II from scallop muscle crystallizes better than S1
of striated muscle of vertebrates, and their crystal struc�
tures very much resembled each other [69].
It appeared that most determined S1 structures
could be divided into two classes depending on the con�
tent of their active center. These two classes differ by the
orientation of the converter domain by approximately
60°. Since the long neck of S1 is strongly bound to the
converter, upon its turn the neck turns as a lever relative
to the catalytic (and actin�binding) S1 domain. Such
rotation, in turn, is equivalent to the axial movement of
the S1 C�terminal region by 8�10 nm relative to its actin�
binding site.
It was shown experimentally that the rate of
unloaded movement of the actin filaments along the
myosin�covered surface linearly depends on the length of
its α�helical neck, which can be changed using gene engi�
neering techniques [70].
These results lead to the proposal of the “lever arm”
hypothesis ([42, 43], Fig. 5b). According to this hypothe�
sis, the “lever arm” tilt is the process that results in rela�
tive sliding of the thick and thin filaments, while bound
catalytic domain S1 does not change its position on actin.
Since this hypothesis was formulated on the basis of
investigation of S1 crystal structure in the absence of
actin, it remains unclear whether in reality all changes in
actin–myosin complex, which provide tension develop�
ment or filament sliding, are limited only by rearrange�
ment within S1 and do not include changes in the zone of
its contact with actin. To answer this question, it is neces�
sary to have data on structural changes of the actin–
myosin complex in functioning system, able to develop
active force and sliding.
Myosin V is an intracellular transport protein. It
delivers vesicles via long actin bundles from the cell cen�
ter to its periphery. Like myosin II, it is two�headed, but
its neck is much longer, and therefore it is able to move by
big steps equal to a full 36 nm period of actin helix.
Unlike myosin II, myosin V is a processive protein, i.e. its
single molecule is able to move along actin, so at any
moment at least one of its heads is bound to actin and
therefore it is able to transfer the load alone for a signifi�
cant distance along the filament. From a biochemical
point of view, this means that even after being bound to
ATP or ADP and phosphate, S1 of myosin V is strongly
bound to actin. In the structure of shortened S1 of
myosin V without nucleotide, obtained by X�ray crystal�
lography, the cleft between upper and lower jaws of the
central domain is closed [64].
Comparison of the new S1 structure with the earlier
obtained one has shown that closing the cleft also coin�
cides with the movement of switch�1, which opens the
nucleotide�binding pocket and bending of the β�sheet
[64]. Very similar changes in the position of switch�1 and
in β�sheet are seen in structure of S1 of the Dictyostelium
myosin II in the absence of nucleotide [71]. As is shown
in experiments [72], unlike myosin V, the switch�1 open�
ing in myosin II in the absence of nucleotide does not
result in cleft closure. S1 binding to actin is necessary to
achieve this. Therefore, just structures with closed cleft
correspond to the myosin state firmly bound to actin and
can serve as a model of the rigor state, and all structures
with separated upper and lower jaws correspond to the
myosin weakly binding actin. Later S1 structures of
myosin II were obtained for myosin preparations isolated
from some sea animals in which switch�1 was open in the
absence of nucleotide and the cleft was closed, also not so
tightly as in myosin V [67]. Now structural states of S1
with low affinity to actin are classified as pre�force�gen�
erating and post�rigorous, depending on lever position.
The first obtained structure of myosin II head from chick�
en muscle [56] belongs just to the post�rigor class.
It is interesting to trace the relationships of structur�
al data with results of biochemical experiments carried
out with S1, actin, and ATP in solution. This is the sub�
ject of a large review [69], but here we shall emphasize
only key points.
The tightness of the myosin head binding to actin is
maximal if the ATPase pocket is empty or contains only
ADP. The constant of equilibrium between free and actin
bound S1 is below 0.1 µM. Under conditions of intra�
muscular ATP exhaustion, all myosin heads firmly bind
actin and muscle becomes very rigid, i.e. muscle goes to
the rigor state. This happens because for tight actin bind�
ing the upper and lower jaws should approach and close
the cleft between them (Fig. 7). Only in this case the
actin�binding site of the head becomes complementary to
the corresponding actin surface and is capable of tight
binding to the latter (Fig. 7). Upon closing of the cleft,
the upper jaw as a whole rotates relative the rest of the
catalytic domain and opens the ATPase pocket. Thus, the
active and actin�binding S1 centers function in conform�
ity, although they are localized at a distance of 3�4 nm
from each other. If ATP or both its hydrolysis products
ADP and Pi are present in the head active center, then the
tightness of their binding to actin decreases almost 1000�

MOLECULAR MECHANISM OF ACTIN–MYOSIN MOTOR IN MUSCLE 1491
BIOCHEMISTRY (Moscow) Vol. 76 No. 13 2011
fold. This happens because ATP binding results in pocket
closure and, correspondingly, in cleft opening. During the
time when the active center remains closed, the actin�
binding cleft is open independently of hydrolysis. In this
case S1 can easily dissociate from actin and then bind
another monomer. It is necessary for successful hydroly�
sis that the pocket of the active center should be com�
pletely closed because only in this case establishment of
numerous bonds is possible between atoms of protein
amino acids, Mg, and ATP that weaken binding between
γ phosphate and the remaining part of the ATP. Without
this, a water molecule is not able to cleave ATP. There is
dynamic equilibrium between the active center open and
closed states [73, 74]. It is strongly temperature depend�
ent: temperature increase stimulates closing of the
nucleotide “pocket”.
There is certain competition between S1 binding to
nucleotide and actin. The binding constant of ATP or
ADP to S1 significantly decreases if S1 is tightly bound to
actin. This is evidently explained by the fact that tight
binding to actin is accompanied by a rotation of the upper
“jaw”. Such rotation results not only in the closure of the
cleft but also in opening of the nucleotide “pocket” (Fig.
7), which makes the nucleotide binding weaker. In con�
trast, binding of ATP or its analogs to S1 makes weaker its
affinity to actin, because it stimulates closing the
nucleotide pocket and opening the cleft at the actin�bind�
ing surface of S1.
Note, at first sight a paradoxical fact: ATP hydrolysis
per se in S1 is easily reversible – the equilibrium constant
of this reaction is about 10, i.e. one ATP molecule is syn�
thesized de novo from ADP and Pi for 10 hydrolyzed ATP
molecules, which corresponds to the difference of free
energies altogether in kBT ln(10) ≈ 10–20 J, where kB is
Boltzmann constant and T is absolute temperature. Free
energy of ATP hydrolysis is ten times higher, about 10–19 J.
For what is the rest of the energy spent? It is accumulated
within the myosin head – the motor “is charged” and is
ready “to fire” – to carry out mechanical work upon inter�
action with actin. Translocations of separate S1 details
upon ATP binding are small. However, internal stress val�
ues within the S1 molecule are, evidently, rather high. For
example, they result in untwisting of rigid β sheet [69].
Now we shall consider the motor work cycle begin�
ning from the stage when the head bound and hydrolyzed
ATP, i.e. it is completely “charged” and ready to work. If
actin is inaccessible, then the ATP hydrolysis products
remain for a long time in the active center, until, due to
large�scale and therefore rare fluctuation, the ATPase
pocket does not open itself and Pi and then ADP too
become able to leave the active center. S1 is able to bind a
new ATP molecule only after release of the hydrolysis
products. Owing to such slow discharge of products, the
S1 head in relaxed muscle cleaves only two ATP mole�
cules per minute, and the fuel expense during rest is very
low. In condition of active contraction, phosphate release
is sharply accelerated. The interaction of the head with
actin passes over several stages. In the first stage the head
weakly binds actin, mainly due to electrostatic interaction
of negatively charged groups on the actin surface with
positively charged groups in the disordered loop 2
between the upper and lower jaws of S1. In the second
stage, the jaws join and the weak bond with actin is trans�
formed to the tight one. It is not known exactly how and
why the presence of actin stimulates closing of the S1
cleft, because all atomic structures of myosin heads were
obtained in the absence of actin. As was said above, cleft
closure is accompanied by a rotation of the upper jaw and
partial opening the ATPase pocket.
The next stage is associated with release of stored
energy and its transformation into mechanical work.
Formation of S1 tight complex with actin and closing the
cleft also makes easier movement of switch�1 that binds the
lower “jaw” with the ATPase pocket. Small, only 0.2�nm
switch movements stimulate large�scale rearrangement of
the whole myosin head. Switch movement pass to the
lower jaw of S1 and causes there a set of conformational
changes. The opening of switch�1 results in twisting of
one, partially untwisted turn of the so�called “relay” α�
helix extended from the lower jaw actin�binding site to
the “lever arm” region (Fig. 6). This results in a rotation
of the relay�loop at the end of relay�helix and its shift rel�
ative to so�called SH helix. After these changes in lower
part of S1 low 50�kDa domain, being in tight contact with
the rigid lever arm domain called converter, the latter
turns by 60�65°, thus “switching over” to an energetically
more advantageous position. Since the lever length is
8 nm, such turn causes the shift of its terminus by 10 nm,
a distance that many times exceeds the switch motion.
Just the displacement of the distal part of the lever arm
along the actin axis is an elementary “step” of the myosin
motor.
Fig. 7. S1 myosin V structures without nucleotide (left, PDB code
1W8J) and in the presence of ADP and inorganic phosphate ana�
log BeF (right, PDB code 1W7J). Upper and lower pictures were
obtained by turning by 90°. To visualize the nucleotide pocket of
free S1, the ATP molecule was deliberately inserted into it. The
figure was obtained using the ICM (Molsoft, USA) program.

1492 KOUBASSOVA, TSATURYAN
BIOCHEMISTRY (Moscow) Vol. 76 No. 13 2011
When, after the turn of the upper jaw and the switch�
1 coming into action, thus causing a turn of the lever, the
ATPase pocket of S1 completely opens, and the hydroly�
sis products easily leave it and free the place for a new
ATP molecule. Therefore, actin binding accelerates the
cycle of ATP hydrolysis by a single myosin head at up to
40 molecules per second, which is at least 100 times more
rapidly than in the absence of actin [75]. ATP binding and
pocket closing, in turn, result in cleft opening and weak�
ening the binding of the head to actin. Now it is easily
detached from the latter. Binding of a new ATP molecule
results in pocket closing. When it is completely closed, it
draws the switch in and the lever arm returns to initial
position. Now the motor is “charged” de novo and is
ready for a new cycle of work with involvement of anoth�
er actin monomer.
Note again that the above�described scheme of
myosin motor work is based on comparison of different
S1 crystal structures obtained in the absence of actin.
Therefore it is still not clear how its interaction with actin
as well as forces developed upon actin–myosin interac�
tion and translocations in organized system within sar�
comere influence the alteration of S1 shape and what
changes in the actin–myosin complex really result in car�
rying out mechanical work.
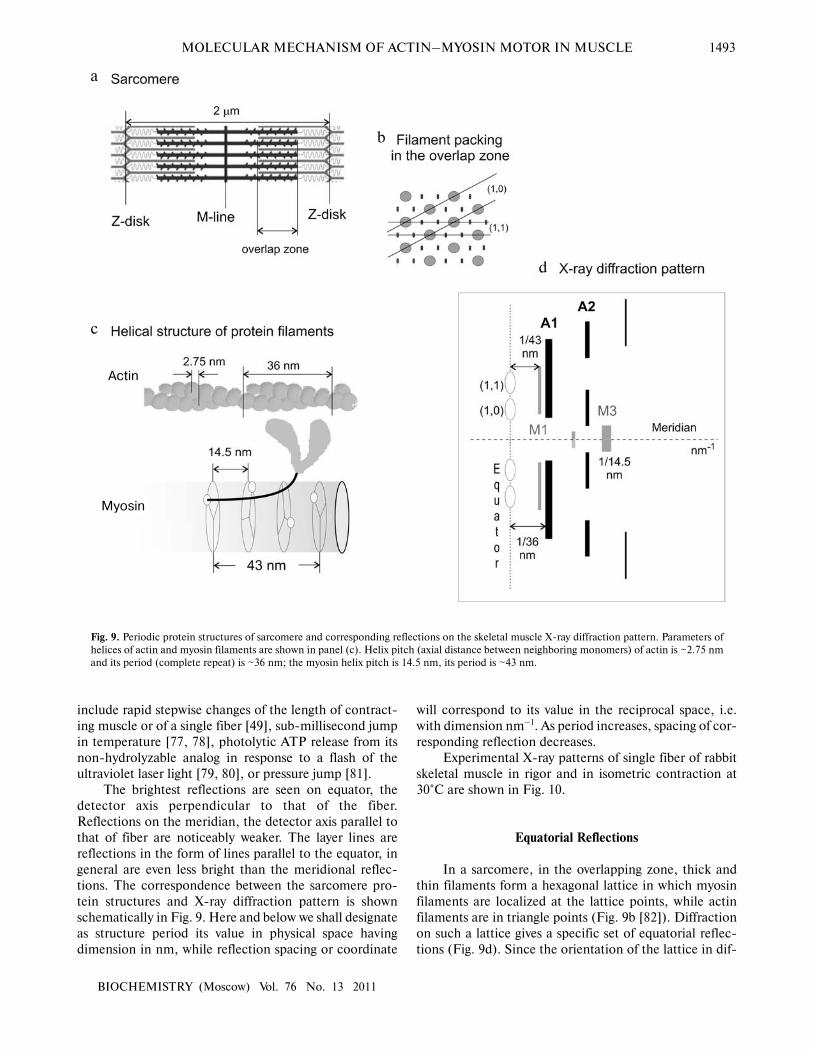
X�RAY DIFFRACTION PATTERN OF MUSCLE
Myofibrils in skeletal muscle are so well arranged
that the package of contractile proteins in a sarcomere is
close to crystalline. Actin, myosin, and other proteins of
thick and thin filaments generate a rich set of equatorial
and meridional reflections and layer lines on diffraction
diagrams. In the first works by H. E. Huxley on diffrac�
tion of muscle, these reflections were successfully used for
obtaining information on muscle structure in different
physiological and biochemical conditions [1, 76].
The scheme of the X�ray diffraction experiment is
shown in Fig. 8. The specimen is placed in the experi�
mental set up. The incoming beam of monochromatic X�
ray radiation scatters on the specimen, and scattered
radiation is registered by a two�dimensional detector.
Since muscle exhibits low scattering power for X�rays
and does not form a really crystalline structure, all regis�
tered reflections are localized within the small angle
regions and therefore a flat detector can be used.
Specimens in experiments are set vertically or horizon�
tally. It is more convenient to work with horizontally set
preparation, but vertical position provides better spatial
resolution along the meridian because the synchrotron
beam is better collimated in vertical direction than in the
horizontal.
Contemporary sources of synchrotron radiation gen�
erate a beam of monochromatic X�rays up to intensity of
5⋅1013 photon/sec with a size of 0.2�0.3 mm that only
slightly exceeds the muscle fiber diameter. This makes it
possible to obtain X�ray diffraction movie of a single cell
with resolution 1000 frames/sec and to achieve the record
time resolution of 0.02 msec for the brightest M3 reflec�
tion [2]. Fast perturbations can be used to synchronize
movements of separate motor molecules. Such effects can
Fig. 8. Scheme of X�ray diffraction experiment. Equatorial and meridional axes of detector are marked by letters “e” and “m”, respectively.
MOLECULAR MECHANISM OF ACTIN–MYOSIN MOTOR IN MUSCLE 1493
BIOCHEMISTRY (Moscow) Vol. 76 No. 13 2011
include rapid stepwise changes of the length of contract�
ing muscle or of a single fiber [49], sub�millisecond jump
in temperature [77, 78], photolytic ATP release from its
non�hydrolyzable analog in response to a flash of the
ultraviolet laser light [79, 80], or pressure jump [81].
The brightest reflections are seen on equator, the
detector axis perpendicular to that of the fiber.
Reflections on the meridian, the detector axis parallel to
that of fiber are noticeably weaker. The layer lines are
reflections in the form of lines parallel to the equator, in
general are even less bright than the meridional reflec�
tions. The correspondence between the sarcomere pro�
tein structures and X�ray diffraction pattern is shown
schematically in Fig. 9. Here and below we shall designate
as structure period its value in physical space having
dimension in nm, while reflection spacing or coordinate
will correspond to its value in the reciprocal space, i.e.
with dimension nm–1. As period increases, spacing of cor�
responding reflection decreases.
Experimental X�ray patterns of single fiber of rabbit
skeletal muscle in rigor and in isometric contraction at
30°C are shown in Fig. 10.
Equatorial Reflections
In a sarcomere, in the overlapping zone, thick and
thin filaments form a hexagonal lattice in which myosin
filaments are localized at the lattice points, while actin
filaments are in triangle points (Fig. 9b [82]). Diffraction
on such a lattice gives a specific set of equatorial reflec�
tions (Fig. 9d). Since the orientation of the lattice in dif�
Fig. 9. Periodic protein structures of sarcomere and corresponding reflections on the skeletal muscle X�ray diffraction pattern. Parameters of
helices of actin and myosin filaments are shown in panel (c). Helix pitch (axial distance between neighboring monomers) of actin is ~2.75 nm
and its period (complete repeat) is ~36 nm; the myosin helix pitch is 14.5 nm, its period is ~43 nm.
a
c
b
d
Myosin
Actin

1494 KOUBASSOVA, TSATURYAN
BIOCHEMISTRY (Moscow) Vol. 76 No. 13 2011
ferent myofibrils is random relative to the incoming
beam, the X�ray diffraction pattern of the muscle shows
the square of Fourier transform of protein filament elec�
tron densities averaged over all possible azimuth angles.
Any equatorial reflection contains contribution of only
those sarcomere regions for which the angle between the
corresponding plane (h,k) and incoming beam is equal to
the Bragg angle for a given reflection.
Two brightest equatorial reflections 1,0 and 1,1 cor�
respond to diffraction on the planes shown in Fig. 9. The
period of these reflections is equal to √_3d/2 for (1,0) and
d/2 for (1,1), where d is the distance between two neigh�
boring thick filaments within the sarcomere. Changes of
absolute values and ratios of intensities of these reflec�
tions I1,0 and I1,1 were noticed in comparison of the
relaxed muscle X�ray patterns with those of muscle in
rigor condition ([83], Fig. 11). In rigor I1,1 increases,
while I1,0 decreases. Qualitatively this can be explained by
movements of myosin heads, in relaxed muscle concen�
trated near the myosin filament surfaces or in planes
(1,0), towards actin filaments localized in planes (1,1)
[83]. In active contraction, I1,0 and I1,1 acquire intermedi�
ate values between those that are achieved in rigor and at
rest (Fig. 11 [84]).
The ratio I1,1/I1,0 was used for estimation of the frac�
tion of myosin heads in active contraction [84, 85]. This
approach is still used [86], especially for studies of heart
muscle [87]. However, intensity distribution along the
equator depends not only on the number of attached
heads, but on some other parameters as well. In particu�
lar, this distribution is much influenced by the extent of
actin–myosin lattice ordering [88].
In non�overlapping sarcomere zones (I zones), thin
filaments form a different rectangular lattice caused by
geometry of their incorporation into the Z line [82].
This rectangular lattice is seen on the equator as the Z
reflection localized between reflections 1,0 and 1,1 (Fig.
11).
The equatorial reflection intensities are also influ�
enced by distribution of detached heads around thick
filaments. It was shown that in relaxed mammalian mus�
cle increasing temperature from 5 to 20°C stimulates
transition of detached myosin heads from disordered
state into helical package on the backbone of the thick
filament [89]. This transition is also accompanied by
decrease in I1,1/I1,0 ratio [89, 90] and increased disorder
of actin filaments observed on electron micropho�
tographs [91, 92].
It is also known that small changes in lattice size
cause significant changes in equatorial reflections [88]. In
the case of the skinned muscle fiber transition from
relaxed state to rigor the lattice shrinks. Upon increasing
ionic strength the decrease in lattice spacing can reach
10% (Fig. 11). In intact muscle fiber development of con�
traction does not result in any significant lattice shrinkage
[93]. A slight reduction of lattice spacing takes place
when the fiber develops active tension in the presence of
ATP and Ca2+ (Fig. 11). This is probably due to the radi�
al component of the active strength of cross�bridges [94].
An intact fiber in tetanus upon feedback of sarcomere
length also shrinks but rather little, about 2% [93]. In
heart muscle changes in lattice spacing due to changes in
sarcomere length and activation extent may explain the
known Frank–Starling law [95, 96].
Fig. 10. X�Ray diffraction pattern of a single fiber of rabbit skele�
tal muscle in rigor (a) and in active contraction at 30°C (b). For
each state only one of four symmetrical quadrants (0.155 nm–1 ×0.155 nm–1 in reciprocal space) is shown, the equator position
being vertical. Two ~3.5 mm segments of permeabilized muscle
fiber were used, exposure for 400 msec in each state, camera
length 4.2 m; intensity is shown in logarithmic scale to make visi�
ble both weak and bright reflections, the lighter is the point color,
the higher is the intensity in it. The brightest reflections are
labelled. An attenuator was placed on the detector along the equa�
tor to prevent detector saturation.
a b
Fig. 11. Diffraction of muscle in the equatorial plane. The equa�
torial intensity profile on X�ray photograph of a single permeabi�
lized fiber of flounder fin muscle in relaxed state (dotted line), in
rigor (black), and during isometric contraction at 5°C (gray). Data
were obtained on station ID02 of the European Synchrotron
Radiation Facility (ESRF). Exposure time in each state is 100
msec, wavelength is 0.1 nm, the length of chamber is 2.5 m. An
attenuator placed along the equator lowered intensity in the
region of reciprocal axial coordinates below 0.064 nm–1 to prevent
detector saturation. The main reflections are labeled. Here and in
Figs. 12 and 13, arbitrary units mean units of CCD detector.
1,0
3,13,0
2,22,1
2,0
1,1

MOLECULAR MECHANISM OF ACTIN–MYOSIN MOTOR IN MUSCLE 1495
BIOCHEMISTRY (Moscow) Vol. 76 No. 13 2011
Meridional Reflections
Meridional reflections on the X�ray diffraction pat�
tern indicate structures exhibiting periodicity along the
fiber axis. Meridional distributions of intensity on a low�
angle X�ray pattern of rabbit skeletal muscle are shown in
Fig. 12.
Meridional reflections of thin filaments. The main
actin meridional reflection corresponds to the distance
between two adjacent monomers, its position in recipro�
cal space being ~(2.75 nm)–1 (Fig. 9). We call this reflec�
tion A13 in accordance with the simplest model of actin
helix 13/6 in which 13 monomers fall within six full turns
of left�hand helix. Binding of myosin heads to actin in
rigor or during active contraction results in increase in
A13 intensity (Fig. 12b) due to efficient increase in elec�
tron density of the actin helix.
Changes in this reflection position were used for
determination of the thin filament axial extension upon
increase in tension, Ca2+�activation, and upon myosin
head binding to actin filament. In X�ray diffraction
experiments, the compliance of actin filaments was esti�
mated as 0.2�0.3%/T0, where T0 is isometric tension
equal to 200�300 kPa for the whole frog m. sartorius at
10°C [97, 98]. Soon it was shown that activation causes
shortening the actin filament, and estimations of actin
extensibility increased to 0.6%/T0 [99, 100]. We have
shown that strong binding of myosin heads to actin with�
out development of high tension results in 0.2% elonga�
tion of thin filaments [101]. With account of these results,
the value of thin filament compliance obtained in our
previous mechanical experiment [102] now agrees with
X�ray diffraction data.
In addition to actin meridional reflections (A13 and
its higher orders) in thin filaments, there is always an
additional series of meridional reflections caused by
repeated axial structure of the thin filament regulatory
proteins. Troponin and tropomyosin have an axial period
of ~38.5 nm, which exceeds the period of the actin helix;
it is about 14 times longer than the pitch of the actin helix.
The contribution of troponin to meridional reflections is
evidently significantly higher than the contribution of
tropomyosin; therefore, these reflections are called tro�
ponin Tn1, Tn2, and Tn3 (Fig. 10). Intensities of these
reflections also change upon change of muscle condition
(Fig. 12a [103]).
Meridional reflections of thick filaments. Thick fila�
ment reflections are called myosin reflections, although
they are in part due to diffraction on other thick filament
proteins. Their period is approximately 43 nm, i.e. posi�
tion M1 ≈ (43 nm)–1, of next maximum M2 – 2/43 =
(21.5 nm)–1, 3/43 nm = (14.33 nm)–1 for M3, etc. (Fig.
a
b
Fig. 12. Distribution of meridional diffraction intensity on rabbit muscle in different states. Intensity distribution along the meridian on X�ray
diffraction patterns of thin bundles of rabbit muscle in relaxed state (dotted line), in rigor at low tension (black), and during isometric con�
traction at ~30°C (gray line). Data were collected at beamline ID02 of ESRF, camera length 10 m (a) and 2.5 m (b); experimental data are
described in our work [101] in more detail. Indexes A, M, and Tn correspond to actin, myosin, and troponin reflections.

1496 KOUBASSOVA, TSATURYAN
BIOCHEMISTRY (Moscow) Vol. 76 No. 13 2011
9). The brightest myosin reflection M3 corresponds to
axial periodicity of the myosin head crowns on the thick
filament backbone. If myosin filaments were an ideal
three�strand helix in which each crown of myosin heads is
turned relative to the previous one by 40° and is shifted
along the axis by fixed distance ~14.3 nm, the observed
meridional reflections would have indexes divisible by 3:
M3, M6, M9, etc. [82]. Indeed, there are also different
meridional reflections M1, M2, M4, M5, etc., called for�
bidden because they are caused by the deviations of thick
filament from ideal three�strand helix. Forbidden reflec�
tions are very well seen on the diffraction pattern of
relaxed muscle; they are less bright in rigor and extreme�
ly weak in isometric contraction (Fig. 10).
Deviations from three�strand symmetry were
ascribed to the effect of protein C on the thick filament
structures [104, 105]. The protein C or MyBP�C is the
myosin�binding protein present in the form of 7�9 rings
on the backbone of thick filament in the zone of overlap�
ping with actin in the case of sarcomere physiological
length with period very close to or coinciding with that of
M1 [82]. Recent experiments on heart muscle of mice
with knockout of MyBP�C�encoding gene have shown
that only reflections multiple of M3 are characteristic of
such thick filaments, whereas forbidden reflections disap�
pear, i.e. the structure approaches regular three�strand
helix [33].
The thick filament axial period estimated from the
position of the brightest reflection M3 is 14.34 nm in rest�
ing frog muscle, 14.42 nm in rigor [106], and 14.56 nm
during isometric contraction [107]. Similar up to 1.5%
changes in positions upon activation were registered for
M6 and myosin reflections of higher orders [97, 98, 107�
109]. Such structural changes are evidently caused not by
extension of myosin filaments in response to the external
force, but rather by rearrangement of the thick filament
backbone upon activation. The nature of this phenome�
non is still unknown. The dependence of changes in the
myosin reflection positions on the sarcomere length is
rather complicated. When relaxed muscle was extended
to the sarcomere lengths at which thick and thin filaments
almost do not overlap, coordinates of high order myosin
reflections (M6, M9, and M15) increased by 0.4�0.8%
[98]. At these sarcomere lengths, electric stimulation also
did not cause changes in the reflection positions,
although at the sarcomere lengths when overlapping is
half�maximal, an increase in the reflection positions by
~1% was observed [98]. When muscle or single fibers con�
tracting at full filament overlap were allowed to shorten in
response to a low load, spacing of M3 (and M6) partially
returned to their values in relaxed muscle (to 14.4�
14.45 nm for M3 [109, 110]).
It is believed that in a contractile muscle only myosin
heads, both actin�bound and unbound, contribute to the
M3 intensity, IM3 [48]. The linear decrease in IM3 with
reduction in the overlap zone upon fiber extension to long
sarcomere length has shown that attached heads made the
main contribution to this reflection [111]. Many authors
believe that M6 and higher order myosin reflections orig�
inate from the thick filament backbone structures, differ�
ent from myosin heads, and therefore changes in the
reflection positions can be used for determination of the
thick filament compliance [48, 112�114]. Others believe
that all myosin reflections include a significant contribu�
tion from the heads [115, 116]. The increase in M6 inten�
sity by 60% after step�wise shortening and 25% decrease
after step�wise extension [113, 117], or during shortening
at maximal velocity [110] show that both heads and the
thick filament backbone contribute to M6 intensity, and
therefore nothing should be ignored in interpreting the
results of measurements of the reflection positions and
intensity.
There have been attempts to estimate the thick fila�
ment elastic extensibility by imposing on the contractile
muscle or to single muscle fibers step�wise length changes
whose time (~0.1 msec) is significantly shorter than the
characteristic time of the head detachment�reattachment
and even than the force�generating step of the myosin
cross�bridge. At the end of step�wise fiber shortening, SM3
in a single intact frog fiber declined by 0.14%/T0 ([3],
here and below SX means periodicity in physical space,
which corresponds to the observed meridional coordinate
of reflection X in inverse space). At the end of the phase
of rapid partial tension recovery (or phase 2 according to
[44]) the SM3 decrease was even more pronounced –
0.34%/T0 [3]. For single fiber of m. tibialis anterior of the
frog Rana temporaria at 4°C T0 is 280�290 kPa. Similar
changes by 0.33�0.36%/T0 were found for SM3 in later
phases of responses to shortening and in experiments on
whole frog muscle [113].
The value of thick filament compliance of 0.26%/T0
was obtained by measuring M6 position in experiments
with rapid load changes [112, 113]. It should be noted
that changes in positions of myosin meridional reflections
can be caused by two factors: (a) changes in the ~14.5 nm
axial period of myosin head crowns along the thick fila�
ment backbone and (b) length changes of actin filaments
to which myosin heads are attached, which contribute to
the corresponding reflection intensity. Interpretation of
these changes may be even more complicated if myosin
heads undergo conformational changes during step�wise
change of fiber length and/or load. The estimations of the
compliance by M6 and high order reflection measure�
ments may be more correct, although, as indicated above,
the contribution of attached myosin heads to intensities
of these reflections cannot be excluded.
In the case of isometric tetanus development in
intact fiber [109, 110] or in whole frog muscle [48, 118],
at the beginning IM3 decreases and then increases again.
These changes in IM3 are accompanied by increase in its
radial width (Fig. 13). It was supposed that the increase in
the reflection width is caused by higher lateral disordering
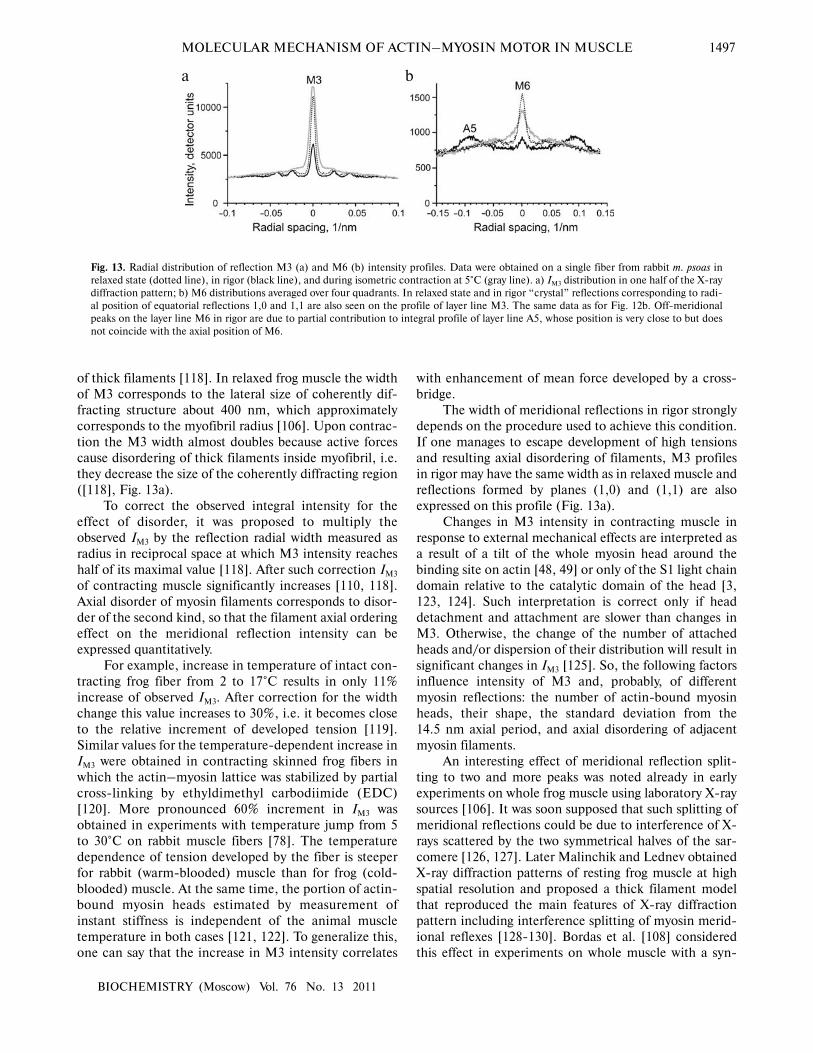
MOLECULAR MECHANISM OF ACTIN–MYOSIN MOTOR IN MUSCLE 1497
BIOCHEMISTRY (Moscow) Vol. 76 No. 13 2011
of thick filaments [118]. In relaxed frog muscle the width
of M3 corresponds to the lateral size of coherently dif�
fracting structure about 400 nm, which approximately
corresponds to the myofibril radius [106]. Upon contrac�
tion the M3 width almost doubles because active forces
cause disordering of thick filaments inside myofibril, i.e.
they decrease the size of the coherently diffracting region
([118], Fig. 13a).
To correct the observed integral intensity for the
effect of disorder, it was proposed to multiply the
observed IM3 by the reflection radial width measured as
radius in reciprocal space at which M3 intensity reaches
half of its maximal value [118]. After such correction IM3
of contracting muscle significantly increases [110, 118].
Axial disorder of myosin filaments corresponds to disor�
der of the second kind, so that the filament axial ordering
effect on the meridional reflection intensity can be
expressed quantitatively.
For example, increase in temperature of intact con�
tracting frog fiber from 2 to 17°C results in only 11%
increase of observed IM3. After correction for the width
change this value increases to 30%, i.e. it becomes close
to the relative increment of developed tension [119].
Similar values for the temperature�dependent increase in
IM3 were obtained in contracting skinned frog fibers in
which the actin–myosin lattice was stabilized by partial
cross�linking by ethyldimethyl carbodiimide (EDC)
[120]. More pronounced 60% increment in IM3 was
obtained in experiments with temperature jump from 5
to 30°C on rabbit muscle fibers [78]. The temperature
dependence of tension developed by the fiber is steeper
for rabbit (warm�blooded) muscle than for frog (cold�
blooded) muscle. At the same time, the portion of actin�
bound myosin heads estimated by measurement of
instant stiffness is independent of the animal muscle
temperature in both cases [121, 122]. To generalize this,
one can say that the increase in M3 intensity correlates
with enhancement of mean force developed by a cross�
bridge.
The width of meridional reflections in rigor strongly
depends on the procedure used to achieve this condition.
If one manages to escape development of high tensions
and resulting axial disordering of filaments, M3 profiles
in rigor may have the same width as in relaxed muscle and
reflections formed by planes (1,0) and (1,1) are also
expressed on this profile (Fig. 13a).
Changes in M3 intensity in contracting muscle in
response to external mechanical effects are interpreted as
a result of a tilt of the whole myosin head around the
binding site on actin [48, 49] or only of the S1 light chain
domain relative to the catalytic domain of the head [3,
123, 124]. Such interpretation is correct only if head
detachment and attachment are slower than changes in
M3. Otherwise, the change of the number of attached
heads and/or dispersion of their distribution will result in
significant changes in IM3 [125]. So, the following factors
influence intensity of M3 and, probably, of different
myosin reflections: the number of actin�bound myosin
heads, their shape, the standard deviation from the
14.5 nm axial period, and axial disordering of adjacent
myosin filaments.
An interesting effect of meridional reflection split�
ting to two and more peaks was noted already in early
experiments on whole frog muscle using laboratory X�ray
sources [106]. It was soon supposed that such splitting of
meridional reflections could be due to interference of X�
rays scattered by the two symmetrical halves of the sar�
comere [126, 127]. Later Malinchik and Lednev obtained
X�ray diffraction patterns of resting frog muscle at high
spatial resolution and proposed a thick filament model
that reproduced the main features of X�ray diffraction
pattern including interference splitting of myosin merid�
ional reflexes [128�130]. Bordas et al. [108] considered
this effect in experiments on whole muscle with a syn�
a b
Fig. 13. Radial distribution of reflection M3 (a) and M6 (b) intensity profiles. Data were obtained on a single fiber from rabbit m. psoas in
relaxed state (dotted line), in rigor (black line), and during isometric contraction at 5°C (gray line). a) IM3 distribution in one half of the X�ray
diffraction pattern; b) M6 distributions averaged over four quadrants. In relaxed state and in rigor “crystal” reflections corresponding to radi�
al position of equatorial reflections 1,0 and 1,1 are also seen on the profile of layer line M3. The same data as for Fig. 12b. Off�meridional
peaks on the layer line M6 in rigor are due to partial contribution to integral profile of layer line A5, whose position is very close to but does
not coincide with the axial position of M6.

1498 KOUBASSOVA, TSATURYAN
BIOCHEMISTRY (Moscow) Vol. 76 No. 13 2011
chrotron radiation source. They supposed that, as became
clear later by mistake, that this reflection was caused by
two sets of myosin heads with close but different perio�
dicity.
Layer Lines
Myosin layer lines. Myosin layer lines are parallel to
the equator at distances multiple to the myosin helix main
period 14.3 nm–1. In frog muscle at rest the intensity of all
myosin layer lines is very high [106]. In this state heads of
myosin molecules are packed close to the thick filament
backbone [106, 130, 131]. In muscle of warm�blooded ani�
mals intensities of myosin layer lines at low temperature
(about 5°C) are significantly lower due to disorder of
myosin heads, but they increase to levels characteristic of
cold�blooded animals as temperature increases to 20°C
and higher [89, 132�134]. Such transition from disorder to
order upon increase in temperature is associated with ATP
hydrolysis [89, 134] or more exactly, with transition of
myosin heads, with bound ATP or ADP and Pi, from
“open” to “closed” state [135]. It appeared that the head in
the “closed” state is localized mainly on the thick filament
backbone, and there it contacts the paired head of the same
molecule, forming an ordered structure [136], whereas
heads in the open state leave the thick filament backbone
and are disordered. Temperature increase or the use of ATP
analogs shift the equilibrium between the two states [135,
137]. Treatment of a fiber with N�ethylmaleimide, fixing
S1 in the open state, results in decrease in intensities of
myosin layer lines [138]. In rigor off�meridional intensities
of myosin meridional reflections are lower than in relaxed
muscle, although some of them, including M2, M3, and
M6, remain appreciable (Fig. 12) [106, 108].
In the course of isometric contraction, intensities of
forbidden myosin meridional reflections M1, M2 and
extra�meridional myosin layer lines strongly decrease
compared to relaxed state (Fig. 12) [108, 118]. In isomet�
ric tetanus of frog muscle at low temperature, the M1 off�
meridional intensity is about 15% of its value in the relaxed
state [108]. Even lower relative IM1 values were found upon
isometric contraction of single intact frog fibers [109]. If a
contracting muscle is allowed to shorten under low load,
then IM1 is approximately three times higher than in iso�
metric contraction, although it is only about half of its
value in the relaxed state [99]. Since the fraction of bound
myosin heads falls during rapid shortening of contracting
muscle [139, 140], these data show that the off�meridion�
al part of M1 and possibly the off�meridional parts of dif�
ferent myosin layer lines in contracting muscle mainly
result from X�ray diffraction on detached myosin heads.
On the other hand, there are data indicative of a sig�
nificant contribution to myosin layer lines of weakly
bound myosin heads containing in their active center
either ATP [141] or ADP⋅⋅Pi [142]. To estimate the contri�
bution of weakly bound and detached heads to the inten�
sity of different X�ray reflections, skinned muscle fibers
were placed under conditions that change the fractions of
strongly and weakly bound, or bound and detached
heads, and changes in X�ray diffraction patterns were
recorded [141, 142].
Actin layer lines. Actin layer lines correspond to helix
with period ~1/36 nm–1 (Fig. 9). The simplest model
describes the main actin reflections: meridional reflection
at (2.73 nm)–1, bright layer lines with axial position
~(5.9 nm)–1 and ~(5.1 nm)–1 that remain bright even in
the relaxed state of the muscle, and of the first layer line
at (~36 nm)–1, it is the integral model 13/6. This model is
approximate because actin filament is very motile and in
reality it is neither integral helix nor even truly periodical
structure [143]. This is confirmed by experimental obser�
vations showing that the width of the actin layer lines is
much higher than that of myosin layer lines (Fig. 10). For
different states of thin filaments or oriented F�actin gels,
different integer but more complex models are used such
as 67/31, 132/61, or 69/32 [144]. In this section we shall
hold on the simplest nomenclature in which A1 corre�
sponds to the first actin layer line at ~(36 nm)–1 while A6
and A7 correspond to layer lines with axial positions
~(5.9 nm)–1 and ~(5.1 nm)–1, respectively.
It is known that F�actin structure strongly depends
on many factors. Changes in intensities of A1, A2, and A6
actin layer lines [53, 145] as well as of their positions
indicative of changes in axial pitch and angle between
adjacent actin monomers in the helix [98, 99] were regis�
tered immediately after beginning of intact muscle elec�
tric stimulation, i.e. under conditions when myosin heads
still have no time to bind actin, as well as in the case of
maximally rapid muscle shortening causing disconnec�
tion of most heads from actin. Strong binding of myosin
heads to actin also extends and twists the actin helix even
in the absence of external extending force [101].
On X�ray patterns of relaxed muscle actin layer lines,
with the exception of A6 and A7, are weak. This is
because myosin heads are near thick filaments and do not
contribute to effective electron density of thin filaments.
All actin layer lines become very bright in rigor
because in this state all myosin heads strongly and stereo�
specifically bind actin, thus making contrast in the actin
helix (Fig. 10) [106]. Rigor values of layer line intensities
are often used to scale intensities in different physiologi�
cal or biochemical states. Even higher intensity of actin
layer lines can be obtained after addition of isolated
myosin heads to solution bathing skinned fibers. To do
this, fibers are extended to sarcomere length of 3�4 µm
and incubated in solution containing S1 [146, 147].
Whereas S1 without nucleotide or S1⋅⋅ADP complex
strongly bind actin, S1 complex with ATP or ADP and Pi
exhibit weaker affinity to actin [38]. The state of weak
binding of S1 to actin is still poorly studied. It was shown
that upon lowering ionic strength of the relaxing solution

MOLECULAR MECHANISM OF ACTIN–MYOSIN MOTOR IN MUSCLE 1499
BIOCHEMISTRY (Moscow) Vol. 76 No. 13 2011
surrounding skinned fibers treated with N�phenyl�
maleimide, the intensity of the first layer line IA1 decreas�
es [141]. Such treatment stops ATP hydrolysis and leaves
myosin heads in conditions when only weak binding to
actin is possible. Besides, it is known that low ionic
strength stimulates weak binding of myosin heads to actin
[148]. In this case no changes in IA6 were found, which
suggests that the weak binding is not stereospecific [141,
149, 150]. Such attachment is possible within a broad
range of axial and azimuthal angles between actin
monomer and myosin head. Since weak binding is sensi�
tive to ionic strength [148], its nature is, most likely, elec�
trostatic.
In early synchrotron experiments with mainly one�
dimensional detectors, no noticeable changes in IA1 were
found upon development of contraction [48]. The model
for explanation of this effect was based on the supposition
that during contraction a significant fraction of myosin
heads are weakly bound to actin [151]. When two�dimen�
sional detectors became available, it became possible to
register IA1 increase during isometric contraction com�
pared to that at rest [152]. Due to good X�ray focusing
(stations 2.1 and 16.1, SRS, Great Britain) and use of a
long chamber, X�ray patterns with good spatial resolution
were obtained. It became possible to distinguish reliably
close peaks M1 and A1 of the first axial layer line in con�
tractile muscle and to measure their intensity in different
states [108].
In a frog muscle contracting at low temperature, IA1
is 10�15% of its level in rigor [120]. As the temperature of
contracting muscle increased, IA1 increased approximate�
ly in proportion with increase of tension, although the
number of actin�bound myosin heads remained
unchanged judging by measurements of dynamic stiffness
of fibers and intensity of equatorial reflection 1,1 [120�
122]. In the course of isometric contraction at high tem�
perature, IA1 in frog muscle was about one third of its level
in rigor [120]. In the case of shortening under low load,
i.e. at the velocity close to maximal, IA1 approximately
halved [99] in parallel with decrease in number of actin�
bound myosin heads [153]. Other actin layer lines A2, A4,
and A5 are also seen on X�ray pattern, although their
intensities are much lower than in rigor [108].
Actin–myosin layer lines. There are two rather bright
layer lines on X�ray diffraction pattern of muscle in the
rigor state. The periods of these lines ~23�24 and ~10.2�
10.4 nm coincide neither with myosin nor with actin
based periodicities [106]. These layer lines were not found
on X�ray pattern of relaxed muscle, but emerged upon
contraction when muscle develops force [108] (Fig. 10).
Yagi explained the presence of these layer lines by modu�
lation of function of myosin head binding to actin fila�
ments with thick filament period 14.5 nm and suggested
theoretical explanation of this event [154]. The modula�
tion results in appearance of layer lines at 1/14.5 – 1/36 =
~1/24 nm–1 for the layer line designated as AM–1 and
1/14.5 + 1/36 = ~1/10.4 nm–1 for AM+1, where 36 nm is
the conventional period of the actin filament. Neither
detached heads nor thin filaments contribute to these
layer lines. Exact solution of the problem concerning dif�
fraction on partially filled integral rational helix is given
in [155].
MODELS OF X�RAY DIFFRACTION ON MUSCLE
Interpretation of muscle X�ray diffraction patterns is
impossible without mathematical models. First data on
helical structure of thick and thin filaments were obtained
from X�ray diffraction patterns using the known solution
of the problem concerning diffraction on helix, which was
used for solving DNA structure [156].
Modeling of Equatorial Reflections
The brightest equatorial reflections are caused by
diffraction on the planes (1,0) and (1,1) (Fig. 9). Changes
in intensities of these reflections were associated with
change of the fraction of actin�bound myosin heads with�
out carrying out digital analysis [83, 157]. If myosin heads
are laid near the thick filament backbone, then scattering
mass is concentrated in planes (1,0) passing only through
thick filaments, while in planes (1,1), passing through
thin and thick filaments in proportion 2 : 1, contribution
of the head mass is significantly lower; therefore,
I1,0 > I1,1. This situation is observed in relaxed muscle. In
contrast, if all heads of myosin molecules are attached to
thin actin filaments, then I1,1 increases and I1,0 decreases.
This situation is observed in rigor. In contracting muscle
only a fraction of myosin heads are actin�bound and
develop active force, and due to this the I1,1/I1,0 ratio is
intermediate between the considered extreme cases.
Actin filaments are kept in points of the hexagonal
lattice only due to interaction with the closest thick fila�
ments. In relaxed muscle myosin heads do not bind actin
but just push them from three sides, in active state and in
rigor heads bind actin and therefore they better control the
order of the actin lattice [92]. Thus, in the overlap zone
disorder in thin filaments is of the first kind, which sug�
gests random deviations from ideal positions within the
lattice. For this type of disorder, equatorial intensity will
be multiplied by thermal factor TR = exp(−4π2∆AR2R2),
where ∆AR and R are the root�mean�square actin filament
deviation from the ideal position (Fig. 14) and the radial
coordinate in reciprocal space, respectively [158]. In this
case intensity distribution within a reflection is independ�
ent of ∆AR, and the whole reflection intensity is multiplied
by TR. Model calculations have shown that it is possible to
reproduce quantitatively the I1,1/I1,0 ratio if we assume
significant disorder of the thin filament (∆AR up to 3 nm),
especially for cold�blooded animals frog or fish, in which

1500 KOUBASSOVA, TSATURYAN
BIOCHEMISTRY (Moscow) Vol. 76 No. 13 2011
I1,1 is especially low (Fig. 11). This conclusion agrees well
with electron microphotographs of thin slices of relaxed
rabbit fibers at high temperature, on which significant
uncorrelated disorder of thin filaments is seen [91] and
the I1,1/I1,0 ratio is almost the same as in frog muscle.
Thick filaments are kept in the lattice points by M
line proteins and possibly by different sarcomere proteins
that prevent their shift in axial and radial directions. This
structure may exhibit the second kind disorder character�
ized by the absence of long range order, and the distance
to the closest neighbor obeys some fixed distribution with
a certain root�mean�square deviation from the mean
value. Such disorder is characterized by reflection widen�
ing with increase in reflection index [158]. In fact, on the
muscle X�ray pattern reflection 1,1 is somewhat wider
than 1,0, while the higher order reflections are even wider
(Fig. 11). These data confirm the observation that both
the first and second kinds of disorders are present in the
actin–myosin lattice; it is very difficult to determine
parameters of these disorders on the basis of experimental
data. There have been several attempts to restore projec�
tion of electron density to the equatorial plane using
Fourier synthesis (for example, [88, 159, 160]), but it
appeared that the result of modeling strongly depends on
poorly determined parameters such as phases of equatori�
al reflections. Thus, the use of equatorial reflections for
quantitation of actin–myosin interaction was not very
successful.
Modeling the Diffraction Diagram of Relaxed Muscle
The first spatial muscle model, considering all then
known data on the thick filament geometry, was proposed
by Malinchik and Lednev for interpretation of an X�ray
diffraction pattern of relaxed muscle [129, 130]. They
parameterized deviations of myosin head positions on the
thick filament backbone caused by MyBP�C from the
ideal ones, corresponding to the helix axial period, and
optimized the choice of parameters by comparing results
of calculations on model with the experimental profile of
meridional intensity. This allowed them to explain the
appearance of forbidden meridional reflections on the X�
ray pattern of relaxed skeletal muscle. Moreover, they
proposed the thick filament model using the myosin head
approximations by a series of adjacent spheres.
Disordering the myosin filament packing to hexagonal
cells was described as the second kind disorder. This
model was used to calculate intensities of myosin layer
lines and compare them with experimental ones. This
comparison made possible approximate estimation of
myosin head distribution near the thick filament back�
bone.
A set of works by J. Squire (see for example [160�
162]) deal with detailed modeling of X�ray patterns of
relaxed muscle. To reconstruct myosin heads on the thick
filament backbone in the relaxed state, they used X�ray
patterns of the flounder fin muscle because in it, like in
many different fish muscles, hexagonal package of thick
and thin filaments is described by a simple elementary
cell, which means that its structure is closer to crystalline.
The concept was used to interpret X�ray patterns of the
muscle in different states and design a movie reproducing
motility of myosin heads in active muscle and their posi�
tions at rest and in rigor. The state of relaxed muscle
became the zero frame. Using data on the myosin lattice
disposition in a sarcomere, constantly improving data of
electron microscopy followed by data of protein crystal�
lography on the myosin head structure, they designed dif�
ferent structural models of the A zone in relaxed muscle,
using a substantial set of parameters that assigned position
of myosin heads in space, and compared the results with
data of X�ray diffraction [131, 161, 162]. The last of pub�
lished models contains 24 independent parameters, and
the best set provides for squared R factor of 1.19% for 56
reflections [162].
The research group of Leepo Yu at the US National
Institute of Health continued in parallel works on mod�
eling diffraction of resting muscle. A former PhD student
of V. V. Lednev, S. B. Malinchik, worked for several years
in this group. On the basis of current concepts of the
myosin head structure, they modeled the thick filament
structure taking into account thermal disorder of the first
kind of myosin heads. They compared modeling results
with experimental data and showed that with increase of
the resting muscle temperature, myosin heads are
arranged at the thick filament backbone and contrast the
myosin helix [133]. The same approach was used in fol�
lowing works of this group for investigation of myosin
head positions in resting muscle in different states [142,
150, 163].
Modeling X�Ray Patterns of Active Contractionand Rigor States
Transition from “frame zero” to modeling the states
in which myosin heads are bound to actin, namely, states
of active contraction and rigor, is more complicated, first
due to necessity to consider complete three�dimensional
Fig. 14. Distortions in the actin–myosin lattice regularity.
(1,1) (1,1)
(1,0)
(1,0)
MOLECULAR MECHANISM OF ACTIN–MYOSIN MOTOR IN MUSCLE 1501
BIOCHEMISTRY (Moscow) Vol. 76 No. 13 2011
actin–myosin lattice, and second, due to the presence of
unknown characteristics of myosin head arrangements
on the thin filament. Therefore, to simplify the model�
ing, either features of distribution of bound myosin heads
on actin or the shape of attached heads were usually
ignored.
In the first type of models only one efficient myosin
head is considered assuming that its electron density is
the mean density of all cross bridges and that in the over�
lap zone of thick and thin filaments myosin heads are
bound to actin with the same period equal to the period of
the M3 reflection. This model was used for description of
changes of meridional reflections M3, M6, and higher
orders. The first such model (Fig. 15) gave only a qualita�
tive description of the experimental data [49].
When the atomic structure of S1 and models of
actin�myosin binding became available, quantitative cal�
culations of changes in meridional reflection intensities
became possible [2]. Changes in the myosin head config�
urations were calculated using the known crystallograph�
ic atomic model of the actin–myosin complex ([164],
protein structure database ID PDB 2mys). Conforma�
tional changes in myosin head corresponding to the
“lever arm tilt” (Figs. 5 and 16) were modeled by the light
chain domain (LCD) tilt around the converter in the
plane passing through the actin axis and the straight line
passing through amino acid residues Cys707 (the hinge
between catalytic domain and “lever arm”) and Lys843
(point of joint between myosin subfragments S1 and S2).
The neck rotation center coincided with coordinates of
the Cα atom of amino acid residue Cys707 [60, 62]. The
catalytic domain of attached heads was considered as
rigid body upon the tilt of the lever arm. Elastic bending
of the neck of S1 caused by external forces was calculated
using formulas of elastic beam bending [2].
The catalytic domain (amino acid residues 1�770) of
bound myosin head remained unchanged, while the neck
bent like a beam with uniform bending rigidity, restrained
in a point, corresponding to amino acid residue Gly770,
controlled by the moment of external force applied to the
distal beam end or to amino acid residue Trp829. The
beam axis coincided with the straight line passing through
Gly770 and Trp829. It was assumed in calculations that
each sphere displacement is perpendicular to the beam
axis and lies in the plane passing through the beam axis
and vector of applied force. The displacement value was
calculated using the formula d829(3L – x)x2/2L3 [165],
where L = 8.47 nm is the length of the stretch [Gly770�
Trp829] or the beam length, x is the distance from Gly770
to the sphere projection to the beam axis, and d829 is the
displacement of Trp829. We used this model in calcula�
tions of IM3 intensity changes upon sinusoidal changes in
the fiber length in active contraction and in rigor [2].
We recently proposed a structure–kinetic model of
the cross bridge work (Fig. 17) [78]. It is based on the fol�
lowing experimental results: the IA1 and tension increase
in response to temperature jump occur simultaneously
[77, 78]; the fiber stiffness in active contraction is tem�
perature independent [121, 122], and no changes in the
intensity of reflection 1,1 after temperature jump are
observed [77], which suggests that the tension increase
with temperature occurs with a constant number of
myosin bridges attached to thin filaments. We believe that
the rise in intensity of actin layer lines after temperature
jump is caused by change in configuration of cross bridge
interactions with actin, namely, by their transition from
non�stereospecific attachment to stereospecific binding.
Fig. 15. A simple model of the myosin head working stroke, which
explains changes in M3 X�ray reflection in response to the step�
wise shortening of the fiber. Above are cross bridges approximated
by rectangles, below is a projection of the head electron density
onto the fiber axis (according to [49]).
Fig. 16. Model of myosin head strong binding to actin (according
to [56]; actin – 1atn.pdb, S1 – 2mys.pdb). Five actin monomers
are shown in black on the left, the thin filament axis is shown, the
arrow points to the direction towards the M line. Amino acid
residues important for modeling of the changes in the head shape
are shown by circles: Cys707 is black, Gly770 – gray, Trp829 –
open circle, Lys843 – crossed circle. Axis x coincides with the
“lever” axis [Gly770, Trp829] (see text).

1502 KOUBASSOVA, TSATURYAN
BIOCHEMISTRY (Moscow) Vol. 76 No. 13 2011
Synchronous increase in tension and actin helix contrast�
ing by myosin heads shows that stereospecific head “lock�
ing” on actin is a necessary phase of cross bridge force
generation. The decrease in I1,0 with relative stability of
I1,1 also favors non�stereospecifically attached head tran�
sition to stereospecifically bound state, because when the
catalytic domain of non�stereospecifically attached head
incorporates into actin helix, the tail domain of myosin
head departs from the thick filament backbone, thus low�
ering I1,0, although the total mass associated with the thin
filament and thus I1,1 does not change [120].
The model suggests that before ATP hydrolyzes, the
myosin head is able to bind actin only in non�stereospe�
cific manner, i.e. under different axial and azimuthal
angles, and its strong binding to actin is possible only after
ATP cleavage to ADP and phosphate. In the first three
biochemically different states myosin head non�stereo�
specifically binds actin and does not develop force. After
a
b
Fig. 17. Structural and kinetic schemes of the mechanism of force generation by myosin molecule heads [78]. a) Different states (1�5) of myosin
head (shown in gray and black) bound to actin filament (dark gray) are shown in two projections: in the upper row the actin filament axis is per�
pendicular, in the lower row it is parallel to the figure plane. In the lower row the sarcomere Z�line is on the right. b) Kinetic scheme of the
cross�bridge biochemical cycle used in the model. Pre� and post�hydrolysis states 2 and 3 are structurally identical but biochemically different.
In states 1, 2, and 3 heads are rigid in axial direction but they are able to bind actin at different angles in axial and azimuthal directions. The
full range of azimuthal and axial angles is ±60° and ±30°, respectively; the figure shows central and extreme positions of the heads. Distribution
along azimuthal and axial angles is random and uniform in the whole physical sector. Force or displacement is created both by the “roll and
lock” transition (step 3→4) with average axial rotation of subfragment 1 as a solid body by 26° and upon the lever arm tilt (step 4→5) with mean
axial rotation by 50° relative to the motor domain. Unstrained shapes of heads in force�generating states 4 and 5 are shown in gray (right posi�
tion in the pair, the lower row on (a)); strained forms are shown in black (left position). A and M on the kinetic scheme (b) designate actin and
myosin subfragment 1, respectively. Heads may reversibly detach from states 1, 2, and 3 to states 1′, 2′, and 3′, respectively.
′ ′ ′
MOLECULAR MECHANISM OF ACTIN–MYOSIN MOTOR IN MUSCLE 1503
BIOCHEMISTRY (Moscow) Vol. 76 No. 13 2011
hydrolysis the head quickly and reversibly “locks” into the
stereospecifically bound state and only after that the lever
tilts. Both locking and lever arm tilts are force�generating
transitions. This model based on the current biochemical
concepts of kinetics of ATP hydrolysis by myosin quanti�
tatively explains our experimental data, namely, changes
in intensities of X�ray reflection M3 and the first actin
layer line A1 in response to temperature jump [78] and
includes the lever arm model used by many authors for
explanation of changes in M3 intensities in experiments
with changes in lengths of actively contracting fibers.
Tomography of electron�microscopic slices of iso�
metrically contracting insect flight muscle, which were
obtained by rapid freezing [166, 167], have shown signif�
icant differences in motor domain configuration com�
pared to reconstructions of rigor acto�S1 complex. These
tomographies show both myosin heads with motor
domains bound to actin in approximately the same man�
ner as in rigor complex in vitro and their “neck” domains
tilted by different angles, as well as heads with catalytic
domains bound to actin under different axial and
azimuthal angles. These data agree well with our model
and additionally show that the mechanism of force devel�
opment by the actin–myosin motor is more complex than
simply a tilt of a long “neck”.
Instead of complex and difficult problem of sorting
out numerous configurations of attached myosin head, it
is possible to set the function of head arrangement on the
thin filament and, possibly, their orientation in space
using direct modeling of the layer line intensities and
known data on the structure of actin–myosin lattice. The
first work of this kind was interpreting the X�ray diffrac�
tion patterns of insect flight muscle in rigor [168]. The
authors considered a single unit cell of actin–myosin lat�
tice on the basis of features of the diffraction pattern,
selected a group of spatial symmetry, and checked differ�
ent assumptions concerning the shape and configuration
of attached heads and functions of their arrangement on
actin according to preliminary data of electron
microscopy. Satisfactory agreement between calculated
and experimental data was obtained, which indicated that
the cross bridge in rigor is inclined under the angle of
approximately 45° to the actin axis, heads interact with
about one third of actin monomers, and the most impor�
tant is that authors of this work proposed for the first time
a method for interpretation of the whole two�dimension�
al X�ray diffraction pattern of the actin–myosin lattice
rather than analysis of individual reflections.
Several models were proposed for arrangement of
myosin heads in a single unit cell without accounting for
their shape [169]. It was shown that myosin heads should
bind actin with periodicity of its helix to provide for the
presence in X�ray diffraction pattern of the family of bright
actin layer lines characteristic of rigor state. If myosin
heads are allowed to bind actin monomer closest by the
axial coordinate, assuming large azimuthal angles of head
tilt, then for such arrangement myosin layer lines will be
bright on the X�ray diffraction pattern, i.e. a rule of actin
monomer selection may take place upon weak binding.
Models of this kind can be improved using available
atomic structures of actin monomer, myosin head, as well
as models of strong actin–myosin binding [164, 170] to
design direct models of actin–myosin lattice in rigor and
active contraction states. The main difficulty in modeling
the three�dimensional actin–myosin lattice in the overlap
zone of thick and thin filament is that it is necessary to
find for each of hundreds of myosin heads, projecting
from one of six myosin filaments in an unit cell, that one
of hundreds of actin monomers, localized on one of six
actin filaments, to which it binds during active contrac�
tion or in rigor state. One of approaches to solution of this
problem is the use of the “principle of minimum of elas�
tic energy” according to which myosin head binds the
actin monomer on one adjacent thin filament for which
energy of the myosin head strain needed for such binding,
is minimal [171]. From application of this principle, the
disposition of myosin heads on the actin filament is
defined by just two parameters: the ratio of longitudinal
and transverse stiffness of the actin–myosin complex and
the fraction of myosin heads bound to actin in this state.
Calculations of complete two�dimensional X�ray diffrac�
tion pattern, carried out using this model, agreed with the
experimental data [125, 171]. This model also revealed on
experimental X�ray diffraction pattern the X�ray reflec�
tions whose change in intensity allows determination of
some characteristics of actin–myosin interaction in mus�
cle: the number of myosin heads stereospecifically bound
to actin, their conformation (“lever arm” tilt), axial dis�
placement of center of mass of heads, etc.
Owing to achievements of X�ray crystallography dur�
ing the past two decades, it has become possible to clarify
important details of atomic structure of the main ele�
ments of the actin–myosin motor in muscle such as
monomeric and fibrillar actin and myosin head in differ�
ent structural and biochemical states. Data on the struc�
ture of the actin–myosin complex obtained using modern
electron microscopy exhibit lower resolution and make it
possible to characterize only a single stage of myosin
interaction with actin and ATP, a stable complex formed
after release of the ATP hydrolysis products from the
active center of the head. Data on the character of struc�
tural rearrangement of actin–myosin complex, which
underlie muscle contraction, are still fragmentary and
incomplete. One of traditional methods of ultrastructural
investigation of striated muscle is low�angle X�ray diffrac�
tion. Owing to development of third generation synchro�
tron radiation sources and rapid detectors, this method is
useful because it makes it possible to obtain structural
information on motility of myosin heads in contractile
muscle with temporal resolution up to 20 µsec and spatial
resolution of some diffraction reflections up to 0.2 nm.

1504 KOUBASSOVA, TSATURYAN
BIOCHEMISTRY (Moscow) Vol. 76 No. 13 2011
Although X�ray diffraction experiments serve as a rich
source of information, analysis of their data in terms of
molecular movements requires development of mathe�
matical models and their parametric analysis. One may
hope that these data together with new results obtained by
methods of modern biochemistry combined with point
mutations in the main contractile proteins will help in
restoration of the pattern of biochemical and structural
changes forming the basis of mechanochemical energy
transformation by the actin–myosin motor.
This work was supported by the Russian Foundation
for Basic Research (grant 11�04�00908�a).
REFERENCES
1. Huxley, H. (1951) Disc. Faraday Soc., 11, 148.
2. Dobbie, I., Linari, M., Piazzesi, G., Reconditi, M.,
Koubassova, N., Ferenczi, M. A., Lombardi, V., and
Irving, M. (1998) Nature, 396, 383�387.
3. Piazzesi, G., Reconditi, M., Linari, M., Lucii, L., Sun, Y.
B., Narayanan, T., Boesecke, P., Lombardi, V., and Irving,
M. (2002) Nature, 415, 659�662.
4. Kuehne, W. (1859) Archiv fur Anatomie, Physiologie und
Wissenschaftliche Medicin, 748�835.
5. Schipiloff, C., and Danilewsky, A. (1881) Vertheilung in
Muscelbundel (Hoppe�Seyl. Z.), 5, 349�365.
6. Huxley, A. F. (1980) Reflections on Muscle. The Sherrington
Lectures XIV, University Press, Liverpool.
7. Engelhardt, W. A., and Lyubimova, M. N. (1939) Nature,
144, 668�669.
8. Engelhardt, W. A., and Lyubimova, M. N. (1939)
Biokhimiya, 4, 716�736.
9. Straub, F. (1943) Actin Studies from the Institute of Medical
Chemistry, University of Szeged (reprinted by S. Karger,
Basel�New York), 2, 3.
10. Szent�Györgyi, A. (1951) Nature, 167, 380�381.
11. Hanson, J., and Huxley, H. E. (1953) Nature, 172, 530�532.
12. Huxley, A. F., and Niedergerke, R. M. (1954) Nature, 173,
971�973.
13. Huxley, H. E., and Hanson, J. (1954) Nature, 173, 973�976.
14. Filatov, V. L., Katrukha, A. G., Bulargina, T. V., and Gusev,
N. B. (1999) Biochemistry (Moscow), 64, 969�985.
15. Gusev, N. B. (2000) Soros’s Edu. J., 6, 24�32.
16. Bailey, K. (1948) Biochem. J., 43, 271�279.
17. Li, X. E., Holmes, K. C., Lehman, W., Jung, H., and
Fischer, S. (2010) J. Mol. Biol., 395, 327�339.
18. Frye, J., Klenchin, V. A., and Rayment, I. (2010)
Biochemistry, 49, 4908�4920.
19. Ebashi, S. (1963) Nature, 200, 1010.
20. Ebashi, S., and Ebashi, F. J. (1964) Biochemistry, 55, 604�613.
21. Ebashi, S., and Kodama, A. (1965) J. Biochem., 58, 107�108.
22. Huxley, H. (1972) Cold Spring Harb. Symp. Quant. Biol., 37,
361�376.
23. Haselgrove, J. (1972) Cold Spring Harb. Symp. Quant. Biol.,
37, 341�352.
24. Parry, D. A., and Squire, J. M. J. (1973) Mol. Biol., 75, 33�55.
25. Ebashi, S., and Kodama, A. J. (1966) Biochemistry, 59,
425�426.
26. Solov’yova, O. E., Katsnelson, L. B., Konovalov, P. V., and
Markhasin, V. S. (2006) Modern Problems in Biomechanics
[in Russian], MGU Publishing House, Moscow, Vol. 11,
pp. 131�151.
27. Poglazov, B. F., and Levitskii, D. I. (1982) Myosin and
Biological Motility [in Russian], Nauka, Moscow.
28. Cope, M., Whisstock, J., Rayment, I., and Kendrick�
Jones, J. (1996) Structure, 4, 969�987.
29. Foth, B. J., Goedecke, M. C., and Soldati, D. (2006) Proc.
Natl. Acad. Sci. USA, 103, 3681�3686.
30. Margossian, S. S., and Lowey, S. J. (1973) Mol. Biol., 74,
301�311.
31. Margossian, S. S., and Lowey, S. J. (1973) Mol. Biol., 74,
313�330.
32. Podlubnaya, Z. A. (1987) in Structure and Functions of
Contractile System Proteins [in Russian], Leningrad, pp. 32�70.
33. Luther, P. K., Bennett, P. M., Knupp, C., Craig, R.,
Padron, R., Harris, S. P., Patel, J., and Moss, R. L. (2008)
J. Mol. Biol., 384, 60�72.
34. Huxley, H. E. (1957) J. Biophys. Biochem. Cytol., 3, 631�648.
35. Huxley, H. E. (1958) Sci. Am., 199, 67�72.
36. Reedy, M. K., Holmes, K. C., and Tregear, R. T. (1965)
Nature, 207, 1276�1280.
37. Huxley, H. E. (1969) Science, 164, 1356�1365.
38. Lymn, R. W., and Taylor, E. W. (1971) Biochemistry, 10,
4617�4624.
39. Bagshaw, C. R., and Trentham, D. R. (1974) Biochem. J.,
141, 331�349.
40. Zoghbi, M. E., Woodhead, J. L., Moss, R. L., and Craig, R.
(2008) Proc. Natl. Acad. Sci. USA, 105, 2386�2390.
41. Stewart, M. A., Franks�Skiba, K., Chen, S., and Cooke, R.
(2010) Proc. Natl. Acad. Sci. USA, 107, 430�435.
42. Cooke, R. (1986) CRC Crit. Rev. Biochem., 21, 53�118.
43. Holmes, K. C. (1997) Curr. Biol., 7, R112�118.
44. Huxley, A. F., and Simmons, R. M. (1971) Nature, 233,
533�538.
45. Rosenbaum, G., Holmes, K. C., and Witz, J. (1971)
Nature, 230, 434�437.
46. Huxley, H. E., and Holmes, K. C. (1997) J. Synchrotron
Radiat., 4, 366�379.
47. Huxley, H., Simmons, R., Faruqi, A., Kress, M., Bordas, J.,
and Koch, M. (1981) Proc. Natl. Acad. Sci. USA, 78, 2297�2301.
48. Huxley, H. E., Simmons, R. M., Faruqi, A. R., Kress, M.,
Bordas, J., and Koch, M. H. (1983) J. Mol. Biol., 169, 469�506.
49. Irving, M., Lombardi, V., Piazzesi, G., and Ferenczi, M. A.
(1992) Nature, 354, 156�158.
50. Sheetz, M. P., and Spudich, J. A. (1983) Nature, 303, 31�35.
51. Yanagida, T., Nakase, M., Nishiyama, K., and Oosawa, F.
(1984) Nature, 307, 58�60.
52. Kron, S. J., and Spudich, J. (1986) Proc. Natl. Acad. Sci.
USA, 83, 6272�6276.
53. Kress, M., Huxley, H. E., Faruqi, A. R., and Hendrix, G. J.
(1986) Mol. Biol., 188, 325�342.
54. Kabsch, W., Mannherz, H. G., Suck, D., Pai, E. F., and
Holmes, K. C. (1990) Nature, 347, 37�44.
55. Holmes, K. C., Popp, D., Gebhard, W., and Kabsch, W.
(1990) Nature, 347, 44�49.
56. Rayment, I., Holden, H. M., Whittaker, M., Yohn, C. B.,
Lorenz, M., Holmes, K. C., and Milligan, R. A. (1993)
Science, 261, 50�58.
57. Oda, T., Iwasa, M., Aihara, T., Maeda, Y., and Narita, A.
(2009) Nature, 457, 441�445.

MOLECULAR MECHANISM OF ACTIN–MYOSIN MOTOR IN MUSCLE 1505
BIOCHEMISTRY (Moscow) Vol. 76 No. 13 2011
58. Fisher, A. J., Smith, C. A., Thoden, J. B., Smith, R.,
Sutoh, K., Holden, H. M., and Rayment, I. (1995)
Biochemistry, 34, 8960�8972.
59. Smith, C. A., and Rayment, I. (1996) Biochemistry, 35,
5404�5417.
60. Dominguez, R., Freyzon, Y., Trybus, K. M., and Cohen,
C. (1998) Cell, 94, 559�571.
61. Houdusse, A., Kalabokis, V. N., Himmel, D., Szent�
Gyoörgyi, A. G., and Cohen, C. (1999) Cell, 97, 459�470.
62. Houdusse, A., Szent�Györgyi, A. G., and Cohen, C.
(2000) Proc. Natl. Acad. Sci. USA, 97, 11238�11243.
63. Bauer, C. B., Holden, H. M., Thoden, J. B., Smith, R., and
Rayment, I. (2000) J. Biol. Chem., 275, 38494�38499.
64. Coureux, P.�D., Wells, A. L., Menetrey, J., Yengo, C. M.,
Morris, C. A., Sweeney, H. L., and Houdusse, A. (2003)
Nature, 425, 419�423.
65. Sweeney, H. L., and Houdusse, A. (2004) Philos. Trans. R.
Soc. Lond. B., 359, 1829�1841.
66. Sweeney, H. L., and Houdusse, A. (2010) Cell, 141, 573�582.
67. Yang, Y., Gourinath, S., Kovacs, M., Nyitray, L., Reutzel,
R., Himmel, D. M., O’Neall�Hennessey, E., Reshetnikova,
L., Szent�Gyoörgyi, A. G., Brown, J. H., and Cohen, C.
(2007) Structure, 15, 553�564.
68. Manstein, D. J., Ruppel, K. M., and Spudich, J. A. (1989)
Science, 246, 656�658.
69. Geeves, M. A., and Holmes, K. C. (2005) Adv. Protein
Chem., 71, 161�193.
70. Uyeda, T. Q., Abramson, P. D., and Spudich, J. A. (1996)
Proc. Natl. Acad. Sci. USA, 93, 4459�4464.
71. Reubold, T. F., Eschenburg, S., Becker, A., Kull, F. J., and
Manstein, D. J. (2003) Nat. Struct. Biol., 10, 826�830.
72. Conibear, P. B., Bagshaw, C. R., Fajer, P. G., Kovacs, M.,
and Malnasi�Csizmadia, A. (2003) Nat. Struct. Biol., 10,
831�835.
73. Malnasi�Csizmadia, A., Woolley, R. J., and Bagshaw, C. R.
(2000) Biochemistry, 39, 16135�16146.
74. Malnasi�Csizmadia, A., Pearson, D. S., Kovacs, M.,
Woolley, R. J., Geeves, M. A., and Bagshaw, C. R. (2001)
Biochemistry, 40, 12727�12737.
75. Bagshaw, K. (1985) Muscle Contraction [Russian transla�
tion], Mir, Moscow.
76. Huxley, H. E. (1953) Proc. R. Soc. Lond. B, 141, 59�62.
77. Bershitsky, S. Y., Tsaturyan, A. K., Bershitskaya, O. N.,
Machanov, G. I., Brown, P., Burns, R., and Ferenczi, M.
A. (1997) Nature, 388, 186�190.
78. Ferenczi, M. A., Bershitsky, S. Y., Koubassova, N.,
Siththanandan, V., Helsby, W. I., Panine, P., Roessle, M.,
Narayanan, T., and Tsaturyan, A. K. (2005) Structure, 13,
131�141.
79. Tsaturyan, A. K., Bershitsky, S. Y., Burns, R., He, Z. H.,
and Ferenczi, M. A. (1999) J. Physiol., 520, 681�696.
80. Bershitsky, S. Y., Ferenczi, M. A., Koubassova, N. A., and
Tsaturyan, A. K. (2009) Front. Biosci., 14, 3188�3213.
81. Fortune, N. S., Geeves, M. A., and Ranatunga, K. W.
(1989) J. Muscle Res. Cell Motil., 10, 113�123.
82. Squire, J. M. (1981) The Structural Basis of Muscle
Contraction, Plenum, New York.
83. Huxley, H. E. (1968) J. Mol. Biol., 37, 507�520.
84. Haselgrove, J. C., and Huxley, H. E. (1973) J. Mol. Biol.,
77, 549�568.
85. Matsubara, I., Yagi, N., and Hashizume, H. (1975) Nature,
255, 728�729.
86. Hoskins, B. K., Ashley, C. C., Pelc, R., Rapp, G., and
Griffiths, P. J. (1999) J. Mol. Biol., 290, 77�97.
87. Colson, B. A., Locher, M. R., Bekyarova, T., Patel, J. R.,
Fitzsimons, D. P., Irving, T. C., and Moss, R. L. (2010) J.
Physiol., 588, 981�993.
88. Malinchik, S., and Yu, L. C. (1995) Biophys. J., 68, 2023�2031.
89. Wray, J. J. (1987) Muscle Res. Cell Motil., 8, 62a.
90. Rapp, G., Schrumpf, M., and Wray, J. (1991) Biophys. J., 59, 35.
91. Bennett, P. M., Tsaturyan, A., and Bershitsky, S. (2002) J.
Microsc., 206, 152�160.
92. Bershitsky, S. Y., Koubassova, N. A., Bennett, P. M.,
Ferenczi, M. A., Shestakov, D. A., and Tsaturyan, A. K.
(2010) Biophys. J., 99, 1827�1834.
93. Cecchi, G., Griffiths, P., Bagni, M., Ashley, C., and
Maeda, Y. (1991) Biophys. J., 59, 1273�1283.
94. Matsubara, I., Goldman, Y., and Simmons R. M. (1984)
Mol. Biol., 173, 15�33.
95. Fuchs, F., and Martyn, D. A. (2005) J. Muscle Res. Cell
Motil., 26, 199�212.
96. Farman, G. P., Allen, E. J., Gore, D., Irving, T. C., and de
Tombe, P. P. (2007) Biophys. J., 92, L73�75.
97. Huxley, H. E., Stewart, A., Sosa, H., and Irving, T. (1994)
Biophys. J., 67, 2411�2421.
98. Wakabayashi, K., Sugimoto, Y., Tanaka, H., Ueno, Y.,
Takezawa, Y., and Amemiya, Y. (1994) Biophys. J., 67,
2422�2435.
99. Bordas, J., Svensson, A., Rothery, M., Lowy, J., Diakun,
G. P., and Boesecke, P. (1999) Biophys. J., 77, 3197�3207.
100. Takezawa, Y., Sugimoto, Y., and Wakabayashi, K. (1998)
Adv. Exp. Med. Biol., 453, 309�316.
101. Tsaturyan, A. K., Koubassova, N., Ferenczi, M. A.,
Narayanan, T., Roessle, M., and Bershitsky, S. Y. (2005)
Biophys. J., 88, 1902�1910.
102. Linari, M., Dobbie, I., Reconditi, M., Koubassova, N.,
Irving, M., Piazzesi, G., and Lombardi, V. (1998) Biophys.
J., 74, 2459�2473.
103. Tamura, T., Wakayama, J., Inoue, K., Yagi, N., and
Iwamoto, H. (2009) Biophys. J., 96, 1045�1055.
104. Yagi, N., O’Brien, E. J., and Matsubara, I. (1981) Biophys.
J., 33, 121�138.
105. Squire, J. M., Harford, J. J., Edman, A. C., and Sjostrom,
M. J. (1982) Mol. Biol., 155, 467�494.
106. Huxley, H. E., and Brown, W. (1967) J. Mol. Biol., 30,
383�434.
107. Martin�Fernandez, M. L., Bordas, J., Diakun, G., Harries,
J., Lowy, J., Mant, G. R., Svensson, A., and Towns�
Andrews, E. J. (1994) Muscle Res. Cell Motil., 15, 319�348.
108. Bordas, J., Diakun, G. P., Diaz, F. G., Harries, J. E.,
Lewis, R. A., Lowy, J., Mant, G. R., Martin�Fernandez,
M. L., and Towns�Andrews, E. (1993) J. Muscle Res. Cell
Motil., 14, 311�324.
109. Piazzesi, G., Reconditi, M., Dobbie, I., Linari, M.,
Boesecke, P., Diat, O., Irving, M., and Lombardi, V.
(1999) J. Physiol., 514, 305�312.
110. Brunello, E., Bianco, P., Piazzesi, G., Linari, M., Reconditi,
M., Panine, P., Narayanan, T., Helsby, W. I., Irving, M., and
Lombardi, V. (2006) J. Physiol., 577, 971�984.
111. Linari, M., Piazzesi, G., Dobbie, I., Koubassova, N.,
Reconditi, M., Narayanan, T., Diat, O., Irving, M., and
Lombardi, V. (2000) Proc. Natl. Acad. Sci. USA, 97, 7226�7231.
112. Reconditi, M., Linari, M., Lucii, L., Stewart, A., Sun, Y.
B., Boesecke, P., Narayanan, T., Fischetti, R. F., Irving, T.,
1506 KOUBASSOVA, TSATURYAN
BIOCHEMISTRY (Moscow) Vol. 76 No. 13 2011
Piazzesi, G., Irving, M., and Lombardi, V. (2004) Nature,
428, 578�581.
113. Huxley, H., Reconditi, M., Stewart, A., and Irving, T.
(2006) J. Mol. Biol., 363, 743�761.
114. Huxley, H., Reconditi, M., Stewart, A., and Irving, T.
(2006) J. Mol. Biol., 363, 762�772.
115. Juanhuix, J., Bordas, J., Campmany, J., Svensson, A., Bassford,
M. L., and Narayanan, T. (2001) Biophys. J., 80, 1429�1441.
116. Oshima, K., Takezawa, Y., Sugimoto, Y., Kobayashi, T.,
Irving, T. C., and Wakabayashi, K. (2007) J. Mol. Biol.,
367, 275�301.
117. Yagi, N., Iwamoto, H., Wakayama, J., and Inoue, K.
(2005) Biophys. J., 89, 1150�1164.
118. Huxley, H. E., Faruqi, A. R., Kress, M., Bordas, J., and
Koch, M. H. J. (1982) J. Mol. Biol., 158, 637�684.
119. Linari, M., Brunello, E., Reconditi, M., Sun, Y. B.,
Panine, P., Narayanan, T., Piazzesi, G., Lombardi, V., and
Irving, M. (2005) J. Physiol., 567, 459�469.
120. Tsaturyan, A. K., Bershitsky, S. Y., Burns, R., and
Ferenczi, M. A. (1999) Biophys. J., 77, 354�372.
121. Bershitsky, S. Y., and Tsaturyan, A. K. (2002) J. Physiol.,
540, 971�988.
122. Piazzesi, G., Reconditi, M., Koubassova, N., Decostre,
V., Linari, M., Lucii, L., and Lombardi, V. (2003) J.
Physiol., 549, 93�106.
123. Irving, M., Piazzesi, G., Lucii, L., Sun, Y. B., Harford, J.
J., Dobbie, I. M., Ferenczi, M. A., Reconditi, M., and
Lombardi, V. (2000) Nat. Struct. Biol., 6, 482�485.
124. Bagni, M. A., Colombini, B., Amenitsch, H., Bernstorff,
S., Ashley, C. C., Rapp, G., and Griffiths, P. J. (2001)
Biophys. J., 80, 2809�2822.
125. Koubassova, N. A., Bershitsky, S. Y., Ferenczi, M. A., and
Tsaturyan, A. K. (2008) Biophys. J., 95, 2880�2894.
126. Rome, E. (1972) Cold Spring Harb. Symp. Quant. Biol., 37,
331�339.
127. Haselgrove, J. C. (1975) J. Mol. Biol., 92, 113�143.
128. Malinchik, S. B., and Lednev, V. V. (1986) Doklady RAN,
289, 1258�1262.
129. Malinchik, S. B., and Lednev, V. V. (1987) Doklady RAN,
293, 238�242.
130. Malinchik, S. B., and Lednev, V. V. (1992) J. Muscle Res.
Cell Motil., 13, 406�419.
131. Hudson, L., Harford, J. J., Denny, R. C., and Squire, J.
M. (1997) J. Struct. Biol., 137, 154�163.
132. Xu, S., Gu, J., Rhodes, T., Belknap, B., Rosenbaum, G., Offer,
G., White, H., and Yu, L. (1999) Biophys. J., 77, 2665�2676.
133. Malinchik, S., Xu, S., and Yu, L. C. (1997) Biophys. J., 73,
2304�2312.
134. Xu, S., Malinchik, S., Gilroy, D., Kraft, T., Brenner, B.,
and Yu, L. (1997) Biophys. J., 73, 2292�2303.
135. Xu, S., Offer, G., Gu, J., White, H., and Yu, L. (2003)
Biochemistry, 42, 390�401.
136. Woodhead, J. L., Zhao, F.�Q., Craig, R., Egelman, E. H.,
Alamo, L., and Padron, R. (2005) Nature, 436, 1195�1199.
137. Urbanke, C., and Wray, J. (2001) Biochemistry, 358, 165�173.
138. Yagi, N. (1992) J. Muscle Res. Cell Motil., 13, 457�463.
139. Ford, L. E., Huxley, A. F., and Simmons, R. M. (1977) J.
Physiol., 269, 441�515.
140. Yagi, N., Takemori, S., and Watanabe, M. (1993) J. Mol.
Biol., 231, 668�677.
141. Xu, S., Gu, J., Melvin, G., and Yu, L. (2002) Biophys. J.,
82, 2111�2122.
142. Xu, S., Gu, J., Belknap, B., White, H., and Yu, L. C.
(2006) Biophys. J., 91, 3370�3382.
143. Reisler, E., and Egelman, E. H. (2007) J. Biol. Chem., 282,
36133�36137.
144. Oda, T., Namba, K., and Maeda, Y. (2005) Biophys. J., 88,
2727�2736.
145. Yagi, N., and Matsubara, I. (1989) J. Mol. Biol., 208, 359�363.
146. Kraft, T., Mattei, T., Radocaj, A., Piep, B., Nocula, C., Furch,
M., and Brenner, B. (2002) Biophys. J., 82, 2536�2547.
147. Iwamoto, H., Oiwa, K., Kovacs, M., Sellers, J. R., Suzuki,
T., Wakayama, J., Tamura, T., Yagi, N., and Fujisawa, T.
(2007) J. Mol. Biol., 369, 249�264.
148. Brenner, B., Yu, L. C., and Podolsky, R. J. (1984) Biophys.
J., 46, 299�306.
149. Brenner, B., and Yu, L. (1993) Proc. Natl. Acad. Sci. USA,
90, 5252�5256.
150. Gu, J., Xu, S., and Yu, L. C. (2002) Biophys. J., 82, 2123�2133.
151. Huxley, H. E., and Kress, M. (1985) J. Muscle Res. Cell
Motil., 6, 153�161.
152. Yagi, N. (1991) Adv. Biophys., 27, 35�43.
153. Stehle, R., and Brenner, B. (2000) Biophys. J., 78, 1458�
1473.
154. Yagi, N. (1996) Acta Cryst. D, 52, 1169�1173.
155. Tsaturyan, A. K. (2002) Acta Crystallogr. A, 58, 292�294.
156. Cochran, W., Crick, F. H. C., and Vand, V. (1952) Acta
Crystallogr., 5, 581�586.
157. Yu, L. C. (1989) Biophys. J., 55, 433�440.
158. Weinstein, B. K. (1963) X�Ray Diffraction on Chain
Molecules [in Russian], USSR Academy of Sciences,
Moscow.
159. Squire, J., and Harford, J. (1984) Adv. Exp. Med. Biol.,
170, 221�236.
160. Harford, J., and Squire, J. (1986) Biophys. J., 50, 145�155.
161. Al�Khayat, H. A., Hudson, L., Reedy, M. K., Irving, T. C.,
and Squire, J. M. (2003) Biophys. J., 85, 1063�1079.
162. Al�Khayat, H. A., and Squire, J. M. (2006) J. Struct. Biol.,
155, 218�229.
163. Xu, S., White, H. D., Offer, G. W., and Yu, L. C. (2009)
Biophys. J., 96, 3673�3681.
164. Rayment, I., Rypniewski, W. R., Schmidt�Base, K.,
Smith, R., Tomchick, D. R., Benning, M. M.,
Winkelmann, D. A., Wesenberg, G., and Holden, H. M.
(1993) Science, 261, 58�65.
165. Landau, L. D., and Lifshits, E. M. (1987) Theoretical
Physics, Vol. VII. Theory of Elasticity [in Russian], Nauka,
Moscow.
166. Taylor, K. A., Schmitz, H., Reedy, M. C., Goldman, Y. E.,
Franzini�Armstrong, C., Sasaki, H., Tregear, R. T., Poole,
K., Lucaveche, V., Edwards, R. J., Chen, L. F., Winkler,
H., and Reedy, M. K. (1999) Cell, 99, 421�431.
167. Wu, S., Liu, J., Reedy, M. C., Tregear, R. T., Winkler, H.,
Franzini�Armstrong, C., Sasaki, H., Lucaveche, C.,
Goldman, Y. E., Reedy, M. K., and Taylor, K. A. (2010)
PLoS One, 9, e12643.2010.
168. Holmes, K. C., Tregear, R. T., and Barrington Leigh, J.
(1980) Proc. R. Soc. B., 207, 13�33.
169. Sqiure, J. M., and Harford, J. J. (1988) J. Muscle Res. Cell
Motil., 9, 344�358.
170. Holmes, K. C., Angert, I., Kull, F. J., Jahn, W., and
Schroeder, R. R. (2003) Nature, 425, 423�427.
171. Koubassova, N. A., and Tsaturyan, A. K. (2002) Biophys.
J., 83, 1082�1097.
Related Documents