Molecular Interactions Research Group (MIRG) Group (MIRG) Satya P. Yadav, Aaron P. Yamniuk, John Newitt Michael L Doyle Ed Eisenstein Newitt, Michael L. Doyle, Ed Eisenstein, Thomas A. Neubert Presented at: ABRF 2013 (RG9 i )Pl S i CA ABRF 2013 (RG9 session), Palm Springs, CA March 4, 2013

Welcome message from author
This document is posted to help you gain knowledge. Please leave a comment to let me know what you think about it! Share it to your friends and learn new things together.
Transcript

Molecular Interactions Research Group (MIRG)Group (MIRG)
Satya P. Yadav, Aaron P. Yamniuk, John Newitt Michael L Doyle Ed EisensteinNewitt, Michael L. Doyle, Ed Eisenstein, Thomas A. Neubert
Presented at:ABRF 2013 (RG9 i ) P l S i CAABRF 2013 (RG9 session), Palm Springs, CAMarch 4, 2013

Objective of the 2012 Benchmark Study
To determine the stoichiometry of protein-X binding to immobilized protein-Y
To measure the equilibrium dissociation constant (KD) value(s) for the interaction of protein-X to protein-Yprotein X to protein Y
Optional –What are the measured or estimated associationWhat are the measured or estimated associationrate (ka) and dissociation rate (kd) for protein-XBinding to protein-Y
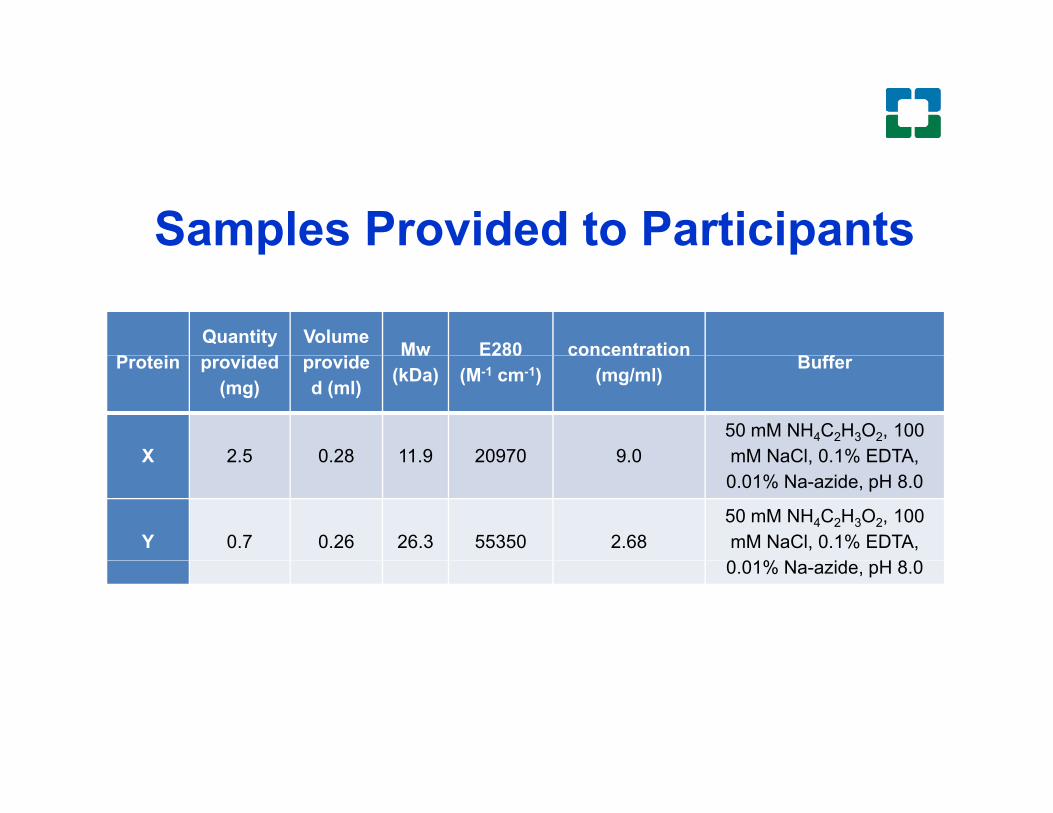
Samples Provided to Participants
P t iQuantity
id dVolume
id Mw E280 concentration B ff
p p
Protein provided (mg)
provided (ml)
Mw (kDa)
E280 (M-1 cm-1)
concentration (mg/ml) Buffer
X 2 5 0 28 11 9 20970 9 050 mM NH4C2H3O2, 100 mM NaCl 0 1% EDTAX 2.5 0.28 11.9 20970 9.0 mM NaCl, 0.1% EDTA, 0.01% Na-azide, pH 8.0
Y 0.7 0.26 26.3 55350 2.6850 mM NH4C2H3O2, 100 mM NaCl, 0.1% EDTA, 0 01% N id H 8 00.01% Na-azide, pH 8.0
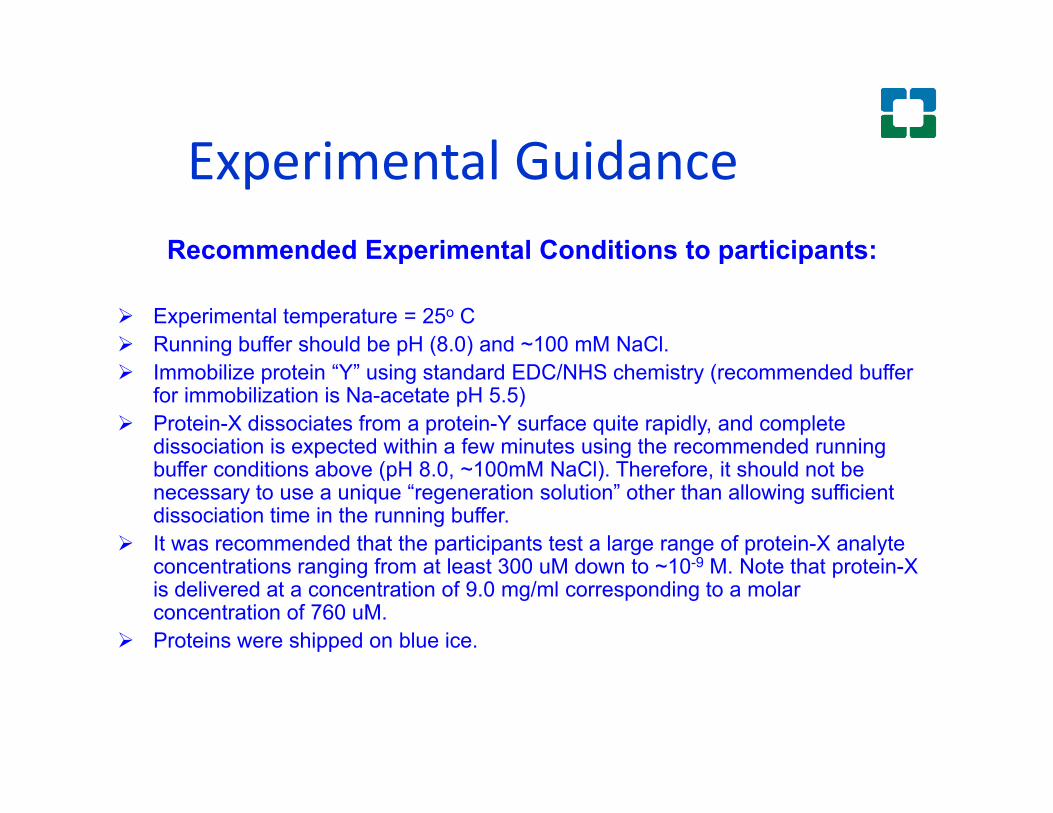
E i t l G idExperimental GuidanceRecommended Experimental Conditions to participants:Recommended Experimental Conditions to participants:
Experimental temperature = 25o C Running buffer should be pH (8.0) and ~100 mM NaCl.g p ( ) Immobilize protein “Y” using standard EDC/NHS chemistry (recommended buffer
for immobilization is Na-acetate pH 5.5) Protein-X dissociates from a protein-Y surface quite rapidly, and complete
dissociation is expected within a few minutes using the recommended running buffer conditions above (pH 8.0, ~100mM NaCl). Therefore, it should not be necessary to use a unique “regeneration solution” other than allowing sufficient dissociation time in the running buffer.
It was recommended that the participants test a large range of protein-X analytet ti i f t l t 300 M d t 10 9 M N t th t t i Xconcentrations ranging from at least 300 uM down to ~10-9 M. Note that protein-X
is delivered at a concentration of 9.0 mg/ml corresponding to a molar concentration of 760 uM.
Proteins were shipped on blue ice.

NOTE on interpretation and pcompilation of participant data
Data was received between Nov, 2012 – Feb, 2013 Report forms interpreted by MIRG, compiled and summarized
for ABRF2013 presentation no discussions with participants to clarify reported data
Post-ABRF2013 plans: Summarize Benchmark Study results for publication in JBT*discussions with participants for clarification of reported
data, and to obtain further information as necessary

Summary of DataID # Instrument
usedSensor
ChipImmob.Method
Y-ImmobilizedRU
Running Buffer
#6 Biacore 3000 CM5 EDC/NHS 57, 270, 942 1
#7 Biacore 3000 CM5 EDC/NHS >300 2
#19 Biacore 3000 CM5 EDC/NHS 425.5 HBS-EP
#3 T100 CM5 EDC/NHS 581, 983 HBS-P,
#11 T100 CM5 EDC/NHS Y-194; X-175 PBS
#14 T100 CM5 EDC/NHS 28,289,1071 3
#22 T100 CM5 EDC/NHS 100 700 2500 1xPBS-T, pH8#22 T100 CM5 EDC/NHS 100,700,2500 , p
#26 T100 CM5 EDC/NHS 402, 432 4
#12 T200 CM5 EDC/NHS 58, 113, 293 5
#17 T200 CM5 EDC/NHS 20 4#17 T200 CM5 EDC/NHS 20 4
#24 T200 CM5 EDC/NHS 100.6, 67 HBS-EP+
#4 Reichert DC7500 R13206061 EDC/NHS 250 uRIU 4
#9 Wyatt Calypso II N/A N/A N/A 4#9 Wyatt Calypso II N/A N/A N/A 4
Buffers used: 1. 50 mM Amm acetate +100 mM NaCl + 0.1% EDTA, pH 8.0: 2. 50 mM Tris-Hcl + 100 mM NaCl, pH 8.0 3. 50 mM Amm acetate +150 mM NaCl + 0.05% P-20, pH 8.0 ; 4. 50 mM Amm acetate + 100 mM NaCl +0.1% EDTA + 0.01% Sod Azide, pH 8.0; 5. HBS-EP + 1 mg/ml BSA , pH 8.0
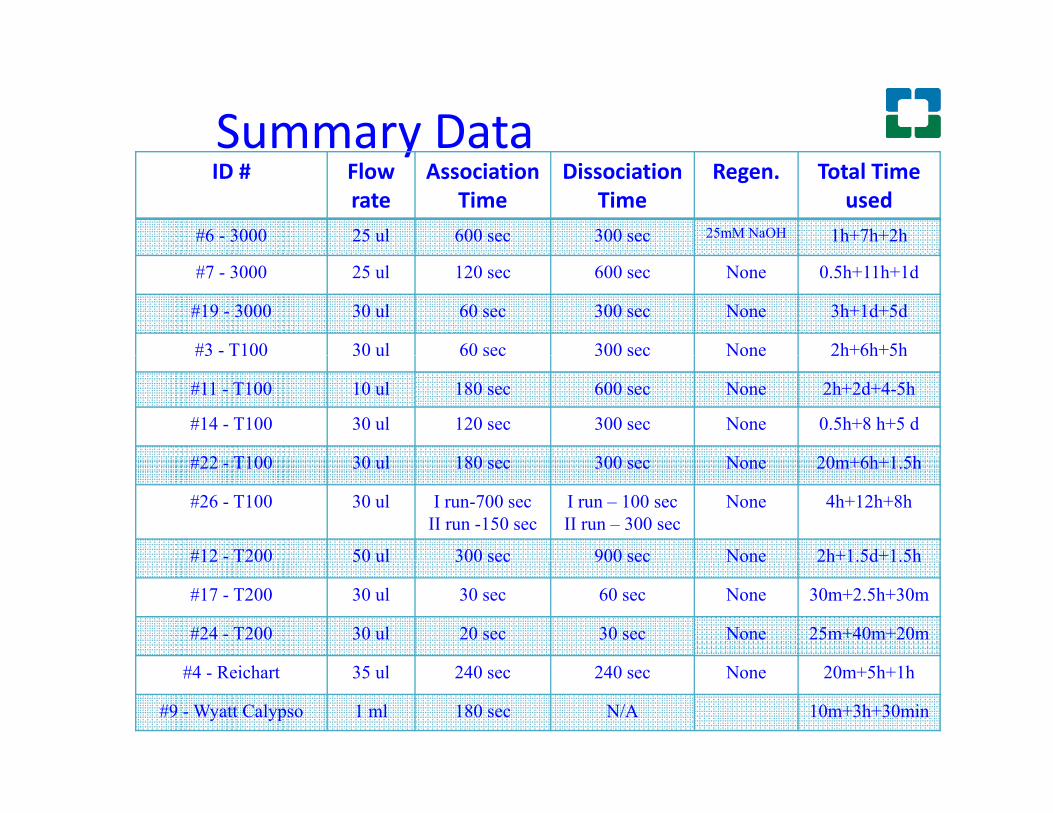
Summary DatayID # Flow
rateAssociation
TimeDissociation
TimeRegen. Total Time
used#6 - 3000 25 ul 600 sec 300 sec 25mM NaOH 1h+7h+2h
#7 - 3000 25 ul 120 sec 600 sec None 0.5h+11h+1d
#19 - 3000 30 ul 60 sec 300 sec None 3h+1d+5d
#3 - T100 30 ul 60 sec 300 sec None 2h+6h+5h#3 T100 30 ul 60 sec 300 sec None 2h 6h 5h
#11 - T100 10 ul 180 sec 600 sec None 2h+2d+4-5h
#14 - T100 30 ul 120 sec 300 sec None 0.5h+8 h+5 d
#22 T100 30 l 180 300 N 20 +6h+1 5h#22 - T100 30 ul 180 sec 300 sec None 20m+6h+1.5h
#26 - T100 30 ul I run-700 secII run -150 sec
I run – 100 secII run – 300 sec
None 4h+12h+8h
#12 - T200 50 ul 300 sec 900 sec None 2h+1.5d+1.5h#12 T200 50 ul 300 sec 900 sec None 2h 1.5d 1.5h
#17 - T200 30 ul 30 sec 60 sec None 30m+2.5h+30m
#24 - T200 30 ul 20 sec 30 sec None 25m+40m+20m
#4 - Reichart 35 ul 240 sec 240 sec None 20m+5h+1h
#9 - Wyatt Calypso 1 ml 180 sec N/A 10m+3h+30min

Summary DatayID # Analyte Conc.
TestedSoftware Model
#6 3000 0 125 M 2 M Biae al ation Stead State V3 2#6-3000 0.125 uM – 2 uM Biaevaluation Steady State V3.2
#7-3000 0.156 uM – 300 uM Biaevaluation Steady State V4.01
#19-3000 0.01 uM – 160 uM Biaevaluation R programming Biaevaluation R programming
#3-T100 0.001 uM – 100 uM Biaevaluation+Excel Biaevaluation+Excel
#11-T100 0.5 uM – 300 uM Biaevaluation Steady State
#14-T100 0.0028 uM – 500 uM Biaevaluation Steady State
#22-T100 0.0057 uM – 300 uM Biavaluation Global, Steady State(T100)#22 T100 0.0057 uM 300 uM Biavaluation Global, Steady State(T100)
#26-T200 0.001 uM – 500 uM Biaevaluation (T100 V2.0.3) T100 V2.0.3 Steady State
#12-T200 0.00038 uM – 150 uM Biaevaluation Steady State
#17-T200 0.13 uM – 300 uM Biaevaluation T200 Heterogeneous
#24-T200 0.001 uM – 300 uM Biaevaluation T200, V1.0 Steady State
#4-Reichart 0.001 uM – 87 uM Scrubber-2 Clamp 99 v3.4 Scrubber-2 Clamp 99 v3.4
#9-Wyatt 0.3 uM - 30 uM Calypso 2.1.2 Calypso 2.1.2

ID # 6 – Biacore 3000N = 2Kd1 = 15-38 nMKd2 = 454-657 nM
60
70
80
RU
250
300
350
RU
6
8
10
12
RU
Y immobilized = 942 RUY immobilized = 270 RUY immobilized = 57 RU
Kd2 = 454 657 nM
-10
0
10
20
30
40
50
0 60 120 180 240 300 360 420 480 540 600 660 720 780 840 900
Tim e s
Res
p. D
iff.
-50
0
50
100
150
200
0 60 120 180 240 300 360 420 480 540 600 660 720 780 840 900
Tim e s
Res
p. D
iff.
-10
-8
-6
-4
-2
0
2
4
0 60 120 180 240 300 360 420 480 540 600 660 720 780 840 900
Res
p. D
iff.
sTim e
20
25
30
35
40
iff.
RU
X immobilized = 31 RU
60
80
100
120
140
160
p. D
iff.
RU
X immobilized = 111 RU
-5
0
5
10
15
100 200 300 400 500 600 700 800 900 1000 1100Tim e s
Res
p. D
-20
0
20
40
60
100 200 300 400 500 600 700 800 900 1000 1100Tim e s
Res
X immobilized = 310 RU
100
200
300
400
500
Res
p. D
iff.
RU
X immobilized = 310 RU
-100
0
100 200 300 400 500 600 700 800 900 1000 1100
Tim e s

ID # 7 Biacore 3000
600
700RU Protein X binding to protein Y Sigma plot fitting using one site saturation
N = 2
100
200
300
400
500
600
Res
p. D
iff.
N = 2Kd1 = 234 nMKd2 = 84 uM
-100
0
100
0 200 400 600 800 1000 1200
sTim e Sigma plot fitting using two site saturation
Kd [M ]Std. ErrorsKd [M ] Errors
Kd1 234 nM 7.74E-08Kd2 84 uM 4.06E-05

ID # 19 Biacore 3000ID # 19 Biacore 3000
N 2N = 2Kd1 = 42.5 uMKd2 = 19.2 mM
SPR analysis of sample X binding to sample Y. Conc of X from 10nM to 160 uM
Double reciprocal plot of 1/Req vs 1/[X]. Curved double reciprocal plot suggests at least two binding Conc of X from 10nM to 160 uM phenomena of X to immobilized Y: one high affinity and one low affinity.
Stoichiometry of protein-X binding to protein-Y 2:1Kd value(s) for protein X Kd1 4 25 10 5 M Kd2Kd value(s) for protein-X binding to protein-Y
Kd1: 4.25 x 10⁻⁵ M , Kd2: 1.92x10⁻² M
association rate (ka) & dissociation rate (kd) for
Ka1: 7.76 x 10⁶ 1/MSKd1: 0.33 M-1
The concentrations of X used to fit the model were 40nM to 160 uM
d ssoc at o ate ( d) oprotein-X binding to protein-Y
Ka2: 5.41X10³ 1/MSkd2:≤0.10 M-1
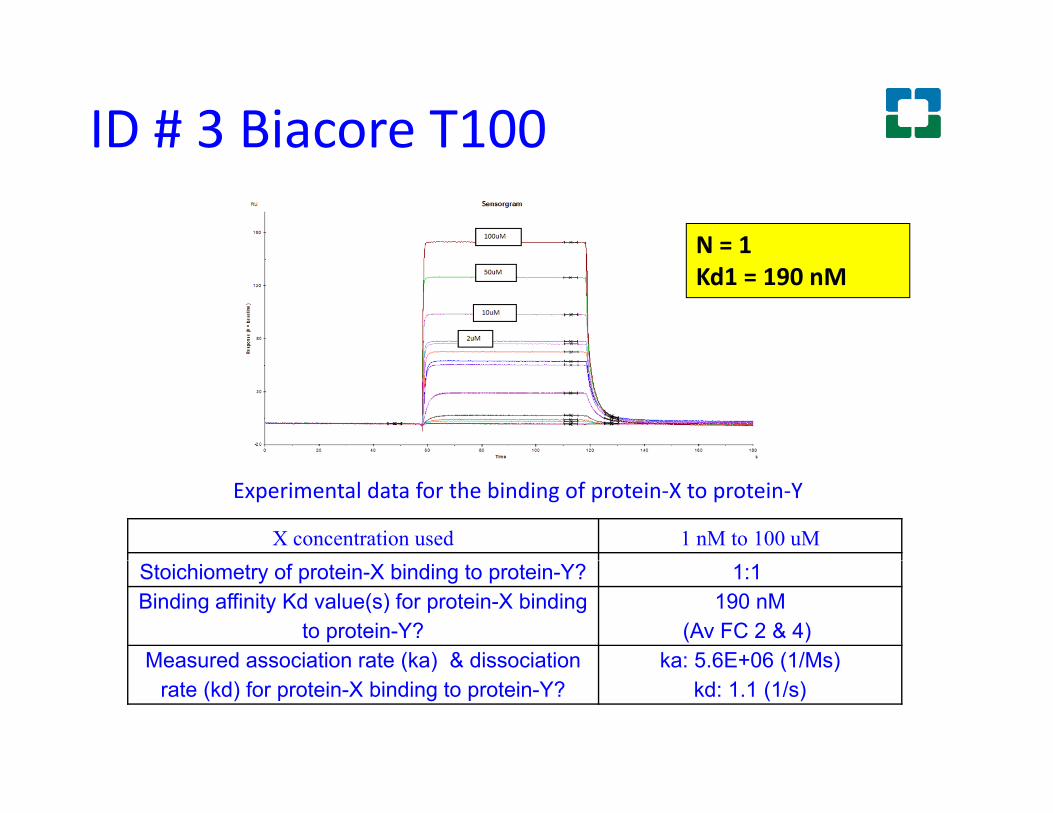
ID # 3 Biacore T100
N = 1N 1Kd1 = 190 nM
Experimental data for the binding of protein-X to protein-Y
X concentration used 1 nM to 100 uMStoichiometry of protein-X binding to protein-Y? 1:1Binding affinity Kd value(s) for protein-X binding
to protein-Y?190 nM
(Av FC 2 & 4)Measured association rate (ka) & dissociation ka: 5 6E+06 (1/Ms)Measured association rate (ka) & dissociation
rate (kd) for protein-X binding to protein-Y?ka: 5.6E+06 (1/Ms)
kd: 1.1 (1/s)

ID# 11- T100 N = 2Kd1 = 26.6 uM
Heterogenous Ligand d l
KD = 2.66x10⁻⁵ (M) Kd2 = ?
model:ka1 = 9.520x10⁶(1/Ms)kd1 = 2.866 (1/s)KD1 = 3.011x10⁻⁷ (M)ka2 = 2.942x10⁵ ( 1/RUs)a2kd2 = 0.2037 (1/s)KD2 = 0.2037x10⁻⁷ (M)
Interaction of protein X with immobilized protein Y evaluated by Biacore T-100. Sensorgrams obtained from the injections of increasing concentrations of Protein X over Protein Y (0, 1, 2.5, 5, 10, 25, 50, 100, 200 and 300 μM) in running buffer (PBS). The10, 25, 50, 100, 200 and 300 μM) in running buffer (PBS). The kinetic assays were carried out at 25°C and a flow rate of 10 μl/min. Global curve fits are shown, using a heterogeneous binding.

ID # 14 Biacore T100
N = 2Kd1 = 156 nMKd2 = 75 uM

ID # 22 Biacore T100
1:1 Global Fitting of Protein X at 1.7uM-0.006uM binding to 100RU immobilized Protein Y
Steady State Fitting of Protein X at 1.7 uM-0.006 uM binding to 100 RU immobilized Protein Y
N = 1
Steady State Fitting of Protein X at 4.7 uM-0.006 uM binding to 100 RU immobilized Protein Y
N 1Kd1 = ~400 nM
1:1 Global Fitting of Protein X at 4.7uM-0.006uM binding to 100RU immobilized Protein Y
Steady State Fitting of Protein X at 1 7 uM 0 006 uMSteady State Fitting of Protein X at 1.7 uM-0.006 uM binding to 100 RU immobilized Protein Y
Highest Concentration of Protein Rmax Chi²
1:1 Global Fitting of Protein X at 18.8 uM-0.006uM binding to 100RU immobilized Protein Y
X (uM) KD (M) (RU) (RU²)1.7 4.04E-07 31 1.094.7 4.15E-07 31 0.97
17.8 5.94E-07 35 2.85

ID # 22 continued (SEC-MALS)
/mol
)43.0x10
44.0x10
45.0x10 LS
Mol
ar M
ass
(g/
42.0x10
time (min)20.0 21.0 22.0 23.0
9000.041.0x10
SEC-MALS: 50uM Protein X (green trace), 50uM Protein Y (red trace), 50uM Protein Y + 12uM Protein X (blue trace), 50uM Protein Y + 100uM Protein X (pink trace)
Approximately 10% of Protein X by mass appeared to be dimeric at 50uM, but the combination of Protein X and Protein Y does not appear to produce a shift consistent with oligomerized Protein X binding to Protein Y
Poor resolution of peaks and possible dilution effect occurring on column also limit interpretation of the MALS results and do not provide significant insight into the behaviors seen in the Biacoreexperimentsexperiments
Did not see much evidence for complex formation by SEC-MALS, likely due to the very rapid dissociation of complex and separation of components on the SEC column

ID # 26 Biacore T1001.25
Kd1 Bmax1
Rm
ax 0.75
1.00Kd1 Bmax1223 + 46 nM 0.455 + 0.032
Kd2 Bmax257.6 + 16.4 uM 0.684 + 0.049
RU
/ R
0.25
0.50
[Prot X] mol/L1.0e-9 1.0e-8 1.0e-7 1.0e-6 1.0e-5 1.0e-4 1.0e-3
0.00
Figure(s) showing experimental data
N = 2Kd1 = 223 nMKd2 = 58 uM
Figure(s) showing experimental data for the binding of protein-X to protein-Y. Conc of X is from 1nM to
Steady-state binding data, fitto 2-site model, SigmaPlot 11.0
530 nM & 1uM to 500 uM

ID # 12 Biacore T200Immobilized Protein Y
Protein X injected from 6,000 nM-0.384 nM
Reference Subtracted Blank Subtracted
SensogramsSensograms Sensograms
N = 1Kd1 = 300 nM
Steady State Affinity Model
Kd1 300 nM

ID # 17 Biacore T200
40
50
60RU
Our original experiments on a T200 showed very rapid binding kinetics Subsequent experiments
N = 3Kd1 = 1.3uMKd2 = 100uM
0
10
20
30
Res
pons
e
kinetics. Subsequent experiments indicated this T200 was not performing correctly (a failure in the high quality injection start). The chip was moved to our second
Kd2 = 100uM
-20
-10
-20 0 20 40 60 80 100Time s
T200 and now the binding kinetics where much slower, as shown above.
There was significant non-specific binding to the reference flow cellsbinding to the reference flow cells. We assume non-specific binding as we used the same running buffer the samples were prepared in to minimize bulk shift from buffer
- Likely issue with sample mishandling (freeze/thaw)
mismatches.Stoichiometry of protein-X binding to protein-Y? 3Binding affinity Kd value(s) for protein-X binding to protein-Y?
Kd1: 1.3 uMKd2: 100 uM
Measured ka & kd for protein-X binding to protein-Y? For High affinity site
ka1: 1.08 x10³; kd1: 0.11ka2: 6.74 x10³; kd2: 8.7x10⁻³

ID # 24 Biacore T200Figure(s) showing experimental data for the binding of protein-X to protein-Y:
490
492
494SensorgramRU
Steady State Affinity
N = 1Kd1 = 278 nM
476
478
480
482
484
486
488
0 20 40 60 80 100 120 140 160
Res
pons
e
sTim e
0
0.001
0.02
0.039
0.078
0.156
0.313
0.625
1.25
2.5
6
8
10
12
14RU
Res
pons
e
1:1 Binding model fit (black line) to concentrations; Residuals generally between -0.2 and 0.2
0
2
4
0 5e-7 1e-6 1.5e-6 2e-6 2.5e-6Concentration M
Flow Cell 2-1 4-3 4-3 4-3Conc of X 0 02 – 2 5 0 02 – 2 5 0 02 – 2 5 0 001 – 300
Removing injection and post-injection spikes did
Conc. of X 0.02 2.5 µM
0.02 2.5 µM
0.02 2.5 µM
0.001 300 µM
Buffer HBS-EP+ HBS-EP+ Acetate, pH 8.0
HBS-EP+
Rmax(affinity)
19.54 RU 12.54 RU 15.47 RU 28.07 RU
Kd (affinity) 2.415×10⁻⁷ 2.782×10⁻⁷ 4.017×10⁻⁷ 7.235×10⁻⁶Removing injection and post injection spikes did not significantly change kinetic parameters.
ka (rate) 2.322×10⁶ 3.037×10⁶ 1.360×10⁶ 1.374×10⁶
kd (rate) 0.5694 0.6115 0.3625 0.7223Kd (from
rates)2.452×10⁻⁷ 2.013×10⁻⁷ 2.665×10⁻⁷ 5.257×10⁻⁷

ID# 4 Reichert DC7500
N = 2Kd1 = 142 nMKd1 = 142 nMKd2 = 71 uM
Low concentration High concentration
Stoichiometry of protein-X binding to protein-Y? 2Binding affinity Kd value(s) for protein-X binding to
protein-Y?Kd1: 42 nM
Kd2: 71 mMMeasured ka & kd for protein-X binding to protein-Y? ka: 1 7 E+06 (1/Ms)Measured ka & kd for protein X binding to protein Y?
For High affinity siteka: 1.7 E+06 (1/Ms)
kd: 0.054 (1/s)

ID # 9 (Wyatt Calypso)
N = 2N = 2Kd1 = 10 nMKd2 = 14 uM
Best fit of light scattering data during hetero-association gradients for low concentration experiment 1 (left) and high concentration experiment 2 (right). Blue circles indicate measured light scattering data. The red open circles indicate the best fit to the light scattering data, consisting of the sum of the contributions from the free monomer X (blue diamonds), free monomer Y (red squares), XY complex (green triangles), and X2Y complex (purple circles).
M l di t ib ti f i i l ti d i h t i ti di t f lMolar distribution of species in solution during hetero-association gradients for low concentration experiment 1 (left) and high concentration experiment 2 (right). In each case, the mole fraction of XY reaches a maximum at a 1:1 overall molar ratio of X:Y, and the mole fraction of X2Y reaches a maximum at a 2:1 overall molar ratio of X:Y.

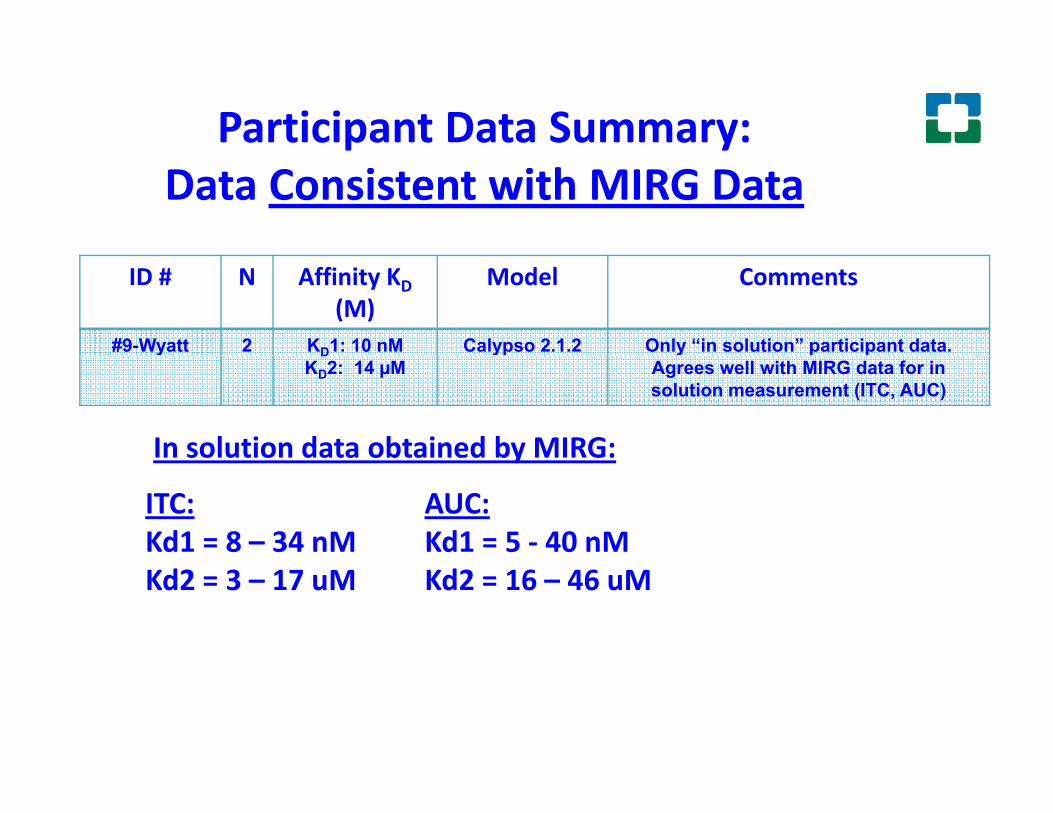
Participant Data Summary: D t C i t t ith MIRG D t
ID # N Affinity KD Model Comments
Data Consistent with MIRG Data
(M)#7-3000 2 KD1: 234 nM;
KD2: 84 uMSteady State
V4.01Expected result based on MIRG data
#14 T100 2 K 1: 156±41 nM Biaevaluation Expected result based on MIRG data#14-T100 2 KD1: 156±41 nMKD2: 75±16 µM
Biaevaluation Expected result based on MIRG data
#26-T200 2 KD1: 223±46 nM;KD2: 58±16 µM
T100 V2.0.3
Expected result based on MIRG data
#4-Reichart 2 KD1: 42 nMKD2: 71 µm
Scrubber-2Clamp 99 v3.4
Indicated non-ideal binding requiring regeneration, but close to expected result
based on MIRG data
SPR (i bili d t i Y) d t bt i d b MIRGSPR (immobilized protein Y) data obtained by MIRG:Kd1 = 350 +/- 140 nMKd2 = 79 +/- 45 uM
Participant Data Summary: p yData Consistent with MIRG Data
ID # N Affinity KD(M)
Model Comments
#9-Wyatt 2 KD1: 10 nM Calypso 2.1.2 Only “in solution” participant data. y DKD2: 14 µM
y yAgrees well with MIRG data for in solution measurement (ITC, AUC)
In solution data obtained by MIRG:
ITC:Kd1 = 8 – 34 nM
AUC:Kd1 = 5 - 40 nM
y
Kd2 = 3 – 17 uM Kd2 = 16 – 46 uM

Participant Data Summary: Fitti t i t bi di d l
ID # N Affinity KD(M)
Model Comments
Fitting to an incorrect binding model
(M)#6-3000 1 KD 302-320 nM Steady State
V3.2Poor fit to model (incorrect model)
#3-T100 1 KD 190 nM Biaevaluation+Ex Only fit low concentration data in “linear#3 T100 1 KD 190 nM Biaevaluation+Excel
Only fit low concentration data in linear range of Scatchard plot” – incorrect model
#11-T100 2 KD 26.6uM Biaevaluation Multiple values reported using different (incorrect) models. Need to clarify with
participant.p p#22-T100 ? ~ KD 400 nM T100: Global
Steady StateRecognized poor fit to 1:1 model, but
incorrectly attributed to aggregation rather than 2nd site
#12-T200 1 K 300 nM Steady State Dilution series too broad (1:5) and excluded#12-T200 1 KD 300 nM Steady State Dilution series too broad (1:5) and excluded higher [analyte] data – incorrect model
#24-T200 1 KD 278 nM T200, V1.0Steady State
Incorrect model
- Incorrectly assumed deviation from 1:1 binding due to non-specific binding, aggregation, or other non-ideality, when it should have been attributed to a second binding event
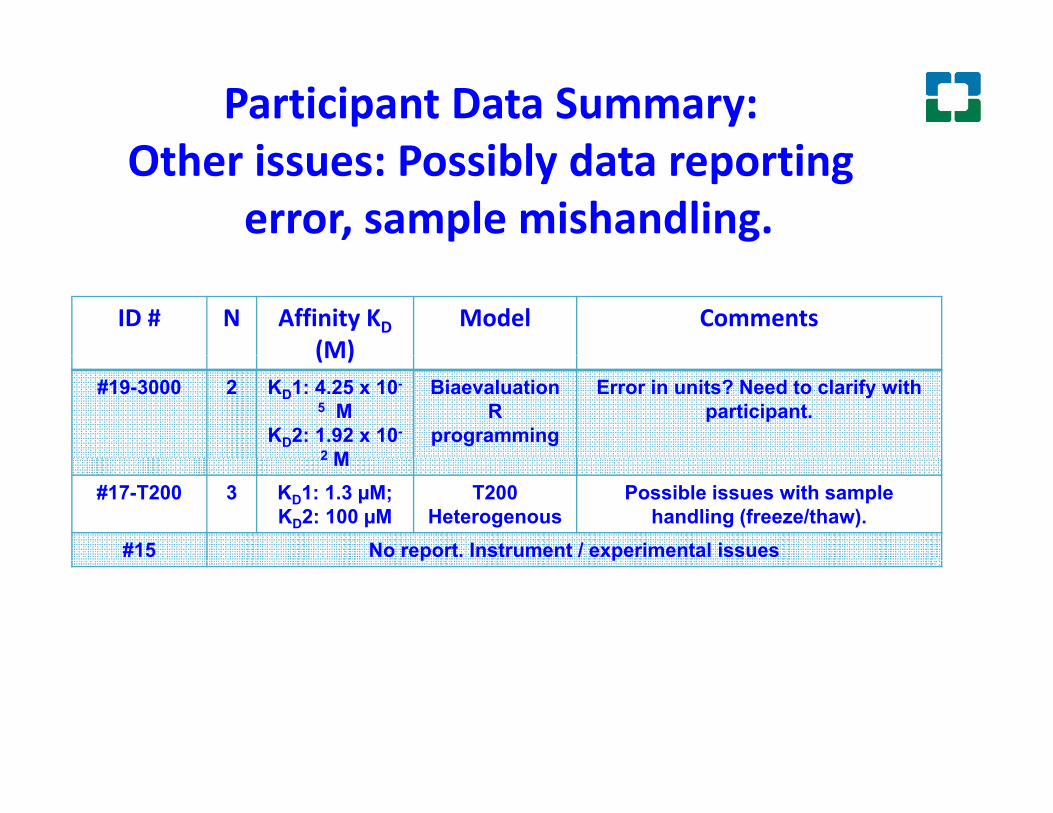
Participant Data Summary: Oth i P ibl d t tiOther issues: Possibly data reporting
error, sample mishandling.
ID # N Affinity KD(M)
Model Comments(M)
#19-3000 2 KD1: 4.25 x 10-
5 MKD2: 1.92 x 10-
2 M
BiaevaluationR
programming
Error in units? Need to clarify with participant.
2 M#17-T200 3 KD1: 1.3 µM;
KD2: 100 µMT200
HeterogenousPossible issues with sample
handling (freeze/thaw).#15 No report. Instrument / experimental issuesp p

Take Home SummaryTake Home Summary15 samples prepared, 14 participant requests, 13 reports p p p , p p q , p
received Five instruments used: Biacore 3000, T100, T200, Reichart,
Wyatt CalypsoWyatt Calypso7/13 (54%) of participants reported correct stoichiometry, i.e.
two binding site for protein-X to protein-Y / ( )5/13 (38%) of participants reported similar Kd values to those
determined by MIRGMost common issue = incorrect assumption on binding model, p g ,
and fitting only part of the data

AcknowledgementsAcknowledgements
All the MIRG membersABRFParticipants who took time to participate in
the study!
Related Documents