REVIEW Molecular imaging of tumor metabolism and apoptosis U Haberkorn 1,2 , A Markert 1,2 , W Mier 1 , V Askoxylakis 1,3 and A Altmann 1,2 1 Department of Nuclear Medicine, University of Heidelberg, Heidelberg, Germany; 2 Clinical Cooperation Unit Nuclear Medicine, DKFZ and University of Heidelberg, Heidelberg, Germany and 3 Department of Radiation Therapy, University of Heidelberg, Heidelberg, Germany Increased metabolism in a number of cellular pathways is a common feature of malignant tumors. This metabolic hallmark of neoplastic tissue led to the development of radiopharmaceuticals for the assessment of transport and enzymatic activity for tumor diagnosis and staging. The malignant transformation causes the activation of onco- genic proteins and signaling pathways that stimulate glycolysis. The resulting high-glucose metabolism of cancer cells allows PET imaging using FDG. Other molecules frequently applied in preclinical and clinical studies are 11 C-methionine, tyrosine analogs and choline-based tracers. Using quantitative procedures they enable therapy monitor- ing by assessment of changes in transport and metaboliza- tion. As apoptosis is an important mechanism of cell death in tumors responding to treatment, non-invasive assess- ment of apoptosis using tracers for detection of phospha- tidyl-serine presentation and/or caspase activation could be used as a surrogate marker for therapeutic efficacy. Oncogene advance online publication, 16 May 2011; doi:10.1038/onc.2011.169 Keywords: glucose metabolism; amino-acid transport; PET; imaging; tumor; apoptosis Principles of metabolism and apoptosis imaging For visualization and/or assessment of biochemical changes in tumors, procedures are needed that (1) result in a high contrast between malignant and non-malig- nant tissues, or between responding and non-responding lesions during therapy, and (2) deliver quantitative data about a specific disease-associated process. As there is no ‘all or nothing’ difference between tumor and normal tissue, differences in quantity or quality may be important, such as an increase in expression or activity, or a shift to different protein isoforms. Usually imaging is based on a substantially higher activity and/or expression of tumors as compared with normal tissue. The underlying processes are transport of substrates, enzymatic activity, a combination of both or binding to membrane-associated structures (Figure 1). Examples are amino acids (transport), caspase inhibitors or substrates (enzymatic activity), fluorodeoxyglucose and fluoroethyl-choline (transport and enzymatic activity), and Annexin-V (binding to membrane structures). For measurement of enzymatic activity, substrates are preferred to inhibitors because of signal amplification, which can be obtained using the former. Signal amplification means that an enzyme converts many substrate molecules producing to multiple metabolites. This is not the case for an inhibitor, where one inhibitor molecule binds irreversibly to one enzyme molecule. It has to be stressed that nuclear medicine methods measure a radioactive signal and do not discriminate different metabolites. As metabolites may occur, tracers are preferred with one or two steps of metabolization. In combination with dynamic studies allowing the generation of time–activity curves and the use of mathematical models, pharmacokinetic modeling can be applied for the assessment of kinetic constants, which describe the biochemistry of malignant tissues in more detail. Therefore, signals obtained after administration of fluorodeoxyglucose may be further analyzed for transport as well as for phosphorylation. In a similar manner, molecules binding to plasma membrane struc- tures may be described by kinetic constants for binding and internalization. Imaging glucose metabolism Malignant tumors show increased glycolytic activity, which is associated to changes in the expression of glycolysis-associated genes occurring during malignant transformation (Flier et al., 1987; Shawver et al., 1987). Especially the gene encoding the glucose transporter subtype-1 (GLUT1) is activated early after transforma- tion of cells with oncogenes such as src, ras or fps. An increase in the mRNA of GLUT1 is observed as early as 4–6 h after induction of the p21 c-H-ras oncoprotein, whereas changes in cell morphology occur after 72–76 h. Furthermore, the increase in GLUT1 mRNA after ras transfection was independent of the growth rate. In vivo overexpression of GLUT1 and GLUT3 was found in a series of different human and experimental tumors. The increase in GLUT1 transcrip- tion can be used for imaging or therapy by cloning of a reporter gene or a therapeutic gene, such as suicide genes Received 20 February 2011; revised and accepted 5 April 2011 Correspondence: Professor U Haberkorn, Department of Nuclear Medicine, University Hospital Heidelberg, and Clinical Cooperation Unit Nuclear Medicine, DKFZ, Im Neuenheimer Feld 400, Baden- Wu¨rttemberg, Heidelberg 69120, Germany. E-mail: [email protected] Oncogene (2011) 1–11 & 2011 Macmillan Publishers Limited All rights reserved 0950-9232/11 www.nature.com/onc

Welcome message from author
This document is posted to help you gain knowledge. Please leave a comment to let me know what you think about it! Share it to your friends and learn new things together.
Transcript

REVIEW
Molecular imaging of tumor metabolism and apoptosis
U Haberkorn1,2, A Markert1,2, W Mier1, V Askoxylakis1,3 and A Altmann1,2
1Department of Nuclear Medicine, University of Heidelberg, Heidelberg, Germany; 2Clinical Cooperation Unit Nuclear Medicine,DKFZ and University of Heidelberg, Heidelberg, Germany and 3Department of Radiation Therapy, University of Heidelberg,Heidelberg, Germany
Increased metabolism in a number of cellular pathways isa common feature of malignant tumors. This metabolichallmark of neoplastic tissue led to the development ofradiopharmaceuticals for the assessment of transport andenzymatic activity for tumor diagnosis and staging. Themalignant transformation causes the activation of onco-genic proteins and signaling pathways that stimulateglycolysis. The resulting high-glucose metabolism of cancercells allows PET imaging using FDG. Other moleculesfrequently applied in preclinical and clinical studies are11C-methionine, tyrosine analogs and choline-based tracers.Using quantitative procedures they enable therapy monitor-ing by assessment of changes in transport and metaboliza-tion. As apoptosis is an important mechanism of cell deathin tumors responding to treatment, non-invasive assess-ment of apoptosis using tracers for detection of phospha-tidyl-serine presentation and/or caspase activation couldbe used as a surrogate marker for therapeutic efficacy.Oncogene advance online publication, 16 May 2011;doi:10.1038/onc.2011.169
Keywords: glucose metabolism; amino-acid transport;PET; imaging; tumor; apoptosis
Principles of metabolism and apoptosis imaging
For visualization and/or assessment of biochemicalchanges in tumors, procedures are needed that (1) resultin a high contrast between malignant and non-malig-nant tissues, or between responding and non-respondinglesions during therapy, and (2) deliver quantitative dataabout a specific disease-associated process. As there isno ‘all or nothing’ difference between tumor and normaltissue, differences in quantity or quality may beimportant, such as an increase in expression or activity,or a shift to different protein isoforms. Usually imagingis based on a substantially higher activity and/orexpression of tumors as compared with normal tissue.The underlying processes are transport of substrates,enzymatic activity, a combination of both or binding to
membrane-associated structures (Figure 1). Examplesare amino acids (transport), caspase inhibitors orsubstrates (enzymatic activity), fluorodeoxyglucose andfluoroethyl-choline (transport and enzymatic activity),and Annexin-V (binding to membrane structures). Formeasurement of enzymatic activity, substrates arepreferred to inhibitors because of signal amplification,which can be obtained using the former. Signalamplification means that an enzyme converts manysubstrate molecules producing to multiple metabolites.This is not the case for an inhibitor, where one inhibitormolecule binds irreversibly to one enzyme molecule.It has to be stressed that nuclear medicine methodsmeasure a radioactive signal and do not discriminatedifferent metabolites. As metabolites may occur, tracersare preferred with one or two steps of metabolization.In combination with dynamic studies allowing thegeneration of time–activity curves and the use ofmathematical models, pharmacokinetic modeling canbe applied for the assessment of kinetic constants, whichdescribe the biochemistry of malignant tissues in moredetail. Therefore, signals obtained after administrationof fluorodeoxyglucose may be further analyzed fortransport as well as for phosphorylation. In a similarmanner, molecules binding to plasma membrane struc-tures may be described by kinetic constants for bindingand internalization.
Imaging glucose metabolism
Malignant tumors show increased glycolytic activity,which is associated to changes in the expression ofglycolysis-associated genes occurring during malignanttransformation (Flier et al., 1987; Shawver et al., 1987).Especially the gene encoding the glucose transportersubtype-1 (GLUT1) is activated early after transforma-tion of cells with oncogenes such as src, ras or fps.An increase in the mRNA of GLUT1 is observed asearly as 4–6 h after induction of the p21 c-H-rasoncoprotein, whereas changes in cell morphology occurafter 72–76 h. Furthermore, the increase in GLUT1mRNA after ras transfection was independent of thegrowth rate. In vivo overexpression of GLUT1 andGLUT3 was found in a series of different human andexperimental tumors. The increase in GLUT1 transcrip-tion can be used for imaging or therapy by cloning of areporter gene or a therapeutic gene, such as suicide genesReceived 20 February 2011; revised and accepted 5 April 2011
Correspondence: Professor U Haberkorn, Department of NuclearMedicine, University Hospital Heidelberg, and Clinical CooperationUnit Nuclear Medicine, DKFZ, Im Neuenheimer Feld 400, Baden-Wurttemberg, Heidelberg 69120, Germany.E-mail: [email protected]
Oncogene (2011) 1–11& 2011 Macmillan Publishers Limited All rights reserved 0950-9232/11
www.nature.com/onc

downstream from the GLUT1 promoter/enhancer ele-ments (Sieger et al., 2004; Haberkorn et al., 2005).Examples are the Herpes Simplex Virus thymidinekinase gene or the sodium iodide symporter gene, whereadeno-associated virus or retroviral vectors have beenused to transfect tumor cells and measure the uptake ofspecific substrates, or to treat animals with geneticallymodified tumors (Sieger et al., 2003, 2004). In thesestudies reporter gene expression (green fluorescentprotein, HSVtk or sodium iodide symporter) wasspecific for tumor cells or spontaneously immortalizedhuman keratinocytes (HaCaT) with expression of anactivated ras oncogene.
Besides increased glucose transport, the malignanttransformation goes along with changes in the activityof glycolytic enzymes. For imaging, hexokinase is themost important enzyme. Here, a change in the isoformpattern occurs as well, with a predominant expression ofhexokinase-II in all tumors, except for brain tumorswhere hexokinase-I may be overexpressed. In rapidlygrowing tumor cells, hexokinase activity is greatlyenhanced, and up to 80% of the enzyme molecules arebound to the outer mitochondrial membrane, whichensures privileged access to the mitochondrial ATPpool.
These changes in transport and phosphorylation areexploited for tumor imaging by positron emissiontomography (PET) using 18F-fluorodeoxyglucose(18F-FDG). 18F-FDG for PET studies of glucosemetabolism was introduced as a consequence of auto-radiographic and biochemical studies of glucose analogsin different tissues. Similar to glucose, 2-deoxyglucose(dGlc) and fluorodeoxyglucose (FDG) are transportedbi-directionally and are phosphorylated by the enzymehexokinase. This is possible because the C-2 positionunlike the C-1, C-3 and C-6 positions is uncritical forbinding to the enzyme hexokinase (Gallagher et al.,
1977). In contrast to glucose-6-phosphate, FDG-6-phosphate and dGlc-6-phosphate are not furthermetabolized in significant amounts during PET study.dGlc-6-phosphate is not metabolized to the fructose-6-phosphate derivative and, therefore, is not a substratefor glucose-6-phosphate dehydrogenase (Sols andCrane, 1954). dGlc-6-phosphate may be converted todGlc-1-phosphate and uridine-diphosphate-dGlc,followed by incorporation into glycogen, glycolipidsand glycoproteins. However, these reactions are veryslow in mammalian tissues. Furthermore, in the brain,the organ where the deoxyglucose method was appliedfor the first time, as well as in malignant tumors glucose-6-phosphatase activity is downregulated. In contrast toauto-inhibition of glucose phosphorylation, FDG-6-phosphate does not show inhibition of hexokinaseactivity (Machado de Domenech and Sols, 1980).Compared with 2-deoxyglucose FDG is incorporatedvery slowly into macromolecules as has been shown inyeasts as well as in chick fibroblasts. The negative chargeon FDG-6-phosphate and dGlc-6-phosphate preventspenetration of the negatively charged inner surface ofthe plasma membrane and causes their accumulation incells. A further advantage is the rapid clearance ofthe tracer: similar to glucose FDG shows glomerularfiltration. However, unlike glucose this is not followedby tubular re-absorption, because FDG is not asubstrate for the tubular sodium glucose symporter,which transports normal glucose back to he blood. Thisfact is responsible for the rapid renal clearance of thetracer.
PET studies in different animal models showed acorrelation between FDG uptake and content ofGLUT1 and hexokinase mRNA (Haberkorn et al.,1994). Differences in FDG uptake in different lungcarcinomas, with lower values for adenocarcinomas ascompared with squamous cell carcinomas, correspondedto the histologically determined expression of GLUT1,which was higher in squamous cell carcinomas than inadenocarcinomas (Brown et al., 1999). Therefore, thegenetic program in malignant tumors leads to thecorresponding FDG uptake values as measured byPET. Similar results were obtained in bronchioalveolaradenocarcinomas, with significantly lower values fornumber of GLUT1-positive cells and FDG uptake, anda correlation between histological grade and amount ofGLUT1-positive cells and FDG uptake.
Originally, clinical application of 18F-FDG predomi-nantly focused on tumor diagnosis and in the staging ofa variety of tumor entities such as lung; colon; breast;head and neck, and esophageal cancer; melanoma andlymphoma. Besides staging, the prognostic value of18F-FDG-PET has also been evaluated. The relation ofhigh pre-therapeutic FDG uptake to a decrease inprognosis was observed by different groups in patientswith lung cancer (Vansteenkiste et al., 1999).
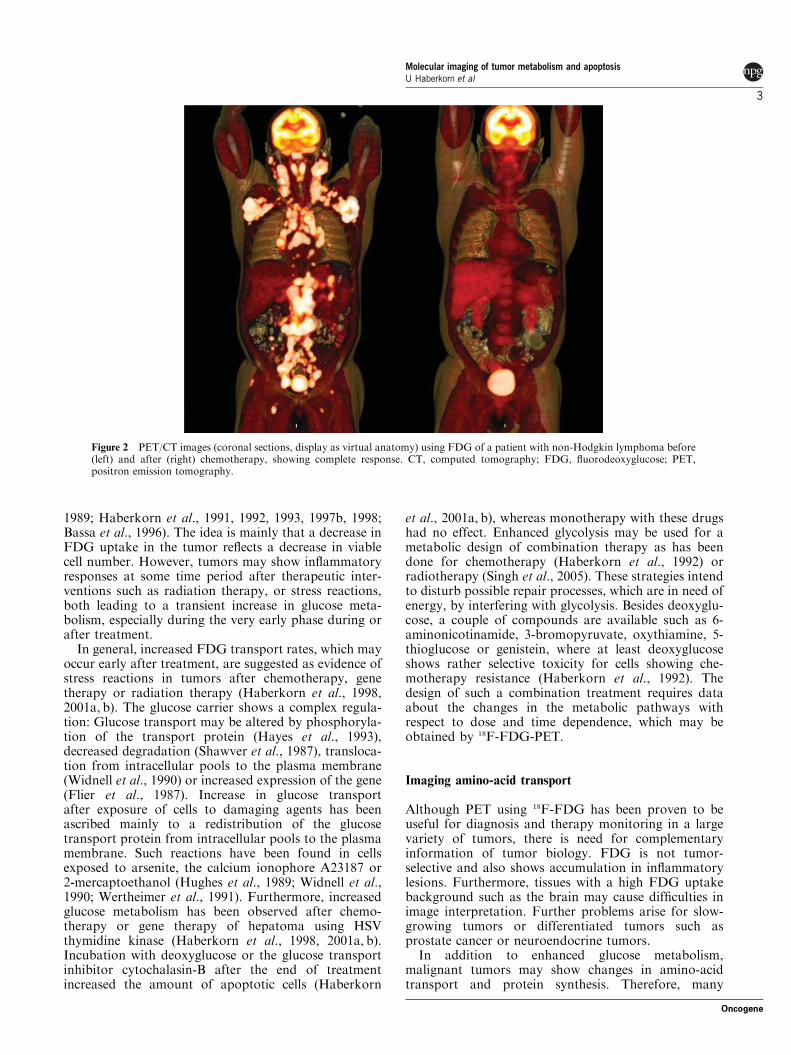
PET using 18F-FDG has been used for the evaluationof treatment response during chemotherapy (Figure 2),gene therapy and radiotherapy in a variety of tumors,indicating that FDG delivers useful parameters for theearly assessment of therapeutic efficacy (Rozental et al.,
I-
I- 2
1
O
O
trapping
COOHNH2
COOHNH2
34
Figure 1 Typical examples of radiotracers illustrating theprinciples of selective uptake. (1) 18F-FDG is taken up into cellsby glucose transporters and subsequently trapped after enzymaticphosphorylation by hexokinase; (2) radioactive isotopes of iodideare taken up by the human sodium iodide symporter on thyroidcancer tissues; (3) the amino acid 18F-O-(2-fluoroethyl)-tyrosine(FET) is taken up into cells by the L-type amino-acid trans-porter system; (4) radiolabeled antibodies such as Zevalin bind toantigens specifically expressed on the surface of tumor cells.18F-FDG, 18F-fluorodeoxyglucose.
Q1 Molecular imaging of tumor metabolism and apoptosisU Haberkorn et al
2
Oncogene
1989; Haberkorn et al., 1991, 1992, 1993, 1997b, 1998;Bassa et al., 1996). The idea is mainly that a decrease inFDG uptake in the tumor reflects a decrease in viablecell number. However, tumors may show inflammatoryresponses at some time period after therapeutic inter-ventions such as radiation therapy, or stress reactions,both leading to a transient increase in glucose meta-bolism, especially during the very early phase during orafter treatment.
In general, increased FDG transport rates, which mayoccur early after treatment, are suggested as evidence ofstress reactions in tumors after chemotherapy, genetherapy or radiation therapy (Haberkorn et al., 1998,2001a, b). The glucose carrier shows a complex regula-tion: Glucose transport may be altered by phosphoryla-tion of the transport protein (Hayes et al., 1993),decreased degradation (Shawver et al., 1987), transloca-tion from intracellular pools to the plasma membrane(Widnell et al., 1990) or increased expression of the gene(Flier et al., 1987). Increase in glucose transportafter exposure of cells to damaging agents has beenascribed mainly to a redistribution of the glucosetransport protein from intracellular pools to the plasmamembrane. Such reactions have been found in cellsexposed to arsenite, the calcium ionophore A23187 or2-mercaptoethanol (Hughes et al., 1989; Widnell et al.,1990; Wertheimer et al., 1991). Furthermore, increasedglucose metabolism has been observed after chemo-therapy or gene therapy of hepatoma using HSVthymidine kinase (Haberkorn et al., 1998, 2001a, b).Incubation with deoxyglucose or the glucose transportinhibitor cytochalasin-B after the end of treatmentincreased the amount of apoptotic cells (Haberkorn
et al., 2001a, b), whereas monotherapy with these drugshad no effect. Enhanced glycolysis may be used for ametabolic design of combination therapy as has beendone for chemotherapy (Haberkorn et al., 1992) orradiotherapy (Singh et al., 2005). These strategies intendto disturb possible repair processes, which are in need ofenergy, by interfering with glycolysis. Besides deoxyglu-cose, a couple of compounds are available such as 6-aminonicotinamide, 3-bromopyruvate, oxythiamine, 5-thioglucose or genistein, where at least deoxyglucoseshows rather selective toxicity for cells showing che-motherapy resistance (Haberkorn et al., 1992). Thedesign of such a combination treatment requires dataabout the changes in the metabolic pathways withrespect to dose and time dependence, which may beobtained by 18F-FDG-PET.
Imaging amino-acid transport
Although PET using 18F-FDG has been proven to beuseful for diagnosis and therapy monitoring in a largevariety of tumors, there is need for complementaryinformation of tumor biology. FDG is not tumor-selective and also shows accumulation in inflammatorylesions. Furthermore, tissues with a high FDG uptakebackground such as the brain may cause difficulties inimage interpretation. Further problems arise for slow-growing tumors or differentiated tumors such asprostate cancer or neuroendocrine tumors.
In addition to enhanced glucose metabolism,malignant tumors may show changes in amino-acidtransport and protein synthesis. Therefore, many
Figure 2 PET/CT images (coronal sections, display as virtual anatomy) using FDG of a patient with non-Hodgkin lymphoma before(left) and after (right) chemotherapy, showing complete response. CT, computed tomography; FDG, fluorodeoxyglucose; PET,positron emission tomography.
Molecular imaging of tumor metabolism and apoptosisU Haberkorn et al
3
Oncogene

efforts have been made to establish tracers based onamino acids.
Radiolabeled amino acids may be used to assess therate of protein synthesis and amino-acid transport.However, besides protein synthesis, amino acids are pre-cursors for many other biomolecules, such as adenine,cytosine, histamine, thyroxine, epinephrine, melanin andserotonin, and are important in other metabolic cycles,including transamination and transmethylation; methio-nine has a specific role in the initiation of proteinsynthesis and amino acids such as glutamine are used forproduction of energy. As all these pathways create adependence on amino-acid uptake, it is evident that thevalues obtained by measurement of amino-acid trans-port do not faithfully represent protein synthesis alone.Rather they provide a general measure of the cellularneed for amino acids.
Amino acids enter cells mainly through specific trans-port systems (Christensen, 1990; Ganapathy et al.,2009). These systems can be sodium-dependent or-independent. Sodium-dependent transport relies onthe sodium chemical gradient and the electric potentialacross the plasma membrane, as well as on the activityof the Naþ/Kþ -ATPase. In general, a change in affinityoccurs when a sodium ion binds to the transporterprotein. Subsequent binding of an amino acid results ina conformational change of the transporter protein,which in turn leads to an influx of the attached sodiumion and the amino acid into the cell. Sodium-indepen-dent systems depend on the amino-acid concentrationgradient across the cell membrane and are often coupledto counter-transport (that is, in the opposite direction)of Kþ .
Kinetic studies have identified several sodium-depen-dent transport systems, A, ASC and Gly that transportamino acids with short polar or linear side chains, forexample, alanine, serine and glycine. System-A is trans-inhibited by intracellular substrates (that is, the presenceof intracellular substrates slows the uptake of aminoacids), whereas system-ASC is trans-stimulated by thepresence of intracellular substrates (that is, the presenceof intracellular substrates increases activity).
The sodium-independent systems, L (ubiquitouslyfound), B0,þ (SLC6A14) and yþ , are carriers forbranched-chain and aromatic amino acids, for example,leucine, valine, tyrosine and phenylalanine. System-L(LAT1/4F2hc) shows trans-stimulation by intracellularsubstrates such as leucine, valine etc. Most amino-acidcarrier systems can also transport synthetic, non-meta-bolizable amino-acid analogs.
Regulation of amino-acid transport is complex and isinfluenced by hormones, cytokines, changes in cellvolume and the availability of nutrients (Christensen,1990). For example, the number of system-A activecarriers increases during starvation; hence imagingstudies should be performed preferentially while patientsare fasting.
Malignant cells were found to have increased amino-acid transport (Busch et al., 1959; Isselbacher, 1972;Saier et al., 1988). Strong expression of system-A hasbeen found in transformed and malignant cells as a
result of oncogene action (Saier et al., 1988), and inclinical studies a correlation between amino-acid trans-port and cellular proliferation has been described(Kuwert et al., 1997; Jager et al., 2001). The systemASCT2 (SLC1A5), which accepts neutral amino acidsand prefers glutamine as substrate, has been shown to beupregulated in several types of tumors and cell lines ofcolorectal carcinoma and prostate carcinoma. LAT1/4F2hc is upregulated in brain, colon, lung, liver and skintumors. Its expression seems to correlate with cellproliferation and cancer growth. This transporteralso mediates the influx of melphalan. Finally, thexCT transporter (SLC3A2) has been found to beincreased in gliomas and lymphoma cells.
For assessment of protein synthesis rate, relativelycomplex kinetic models are necessary. Although11C-leucine appears to be the best amino acid formeasuring the rate of protein synthesis (Vaalburg et al.,1992), most studies have used methionine because of theease of tracer synthesis. The drawbacks of methionine areits use in metabolic cycles other than protein synthesis,which results in a variety of metabolites and difficultiesin quantification (Ishiwata et al., 1996). Conflictingreports have been published about the specificity ofcarrier-mediated transport of methionine into braintumors in studies comparing D- and L-methionine usingan overload of branched amino acids. Furthermore, atleast part of the tracer uptake seems to be a result ofpassive diffusion. Cellular uptake in vitro is mainlyaccomplished through the L-system, with minor contribu-tions from systems A and ASC.
Patient studies have shown high uptake of methioninein the pituitary gland and pancreas, moderate uptake insalivary glands, lacrimal glands and bone marrow, andlow uptake in the normal brain (Jager et al., 2001).The tracer has been used mainly in brain tumors,where it shows excellent contrast between normalbrain and tumors, and has high sensitivity for tumordetection (Langen et al., 1997), but also for the diagnosisand staging of a variety of other tumor entities such ashead and neck cancer, lung cancer, breast cancer,sarcoma and lymphoma.
An alternative to 11C-methionine are tyrosine deriva-tives such as 11C-tyrosine, L-2-18F-fluoro-tyrosine,123I-a-methyl-tyrosine (123I-IMT), 124I-IMT, L-3-18F-a-methyl-tyrosine and O-(2-18F-fluoroethyl)-L-tyrosine(L-FET). These tracers have been used in experimental(Figure 3) as well as in clinical studies.
A high sensitivity for the detection of primary andmetastatic brain tumors was found using either11C-tyrosine or L-2-18F-fluoro-tyrosine (Wienhard et al.,1991; Willemsen et al., 1995). Analysis of the plasmametabolites of 11C-tyrosine showed that 11C-CO2,11C-labelled proteins and 11C-L-DOPA constituted450% of total plasma radioactivity at 40min afterinjection, making a complex pharmakokinetic model forfurther analysis necessary. Using a five-compartmentmodel, it was shown that, whereas the net proteinsynthesis rate was dependent on the recycling of aminoacids from the protein, tracer influx into the cell was not.The curve-fitting results of dynamic scans were unreli-
Molecular imaging of tumor metabolism and apoptosisU Haberkorn et al
4
Oncogene

able owing to the exchange of 11C-tyrosine betweenplasma and erythrocytes, whereas the graphical Patlak–Gjedde analysis was not influenced by this. L-2-18F-fluorotyrosine was studied in 15 patients withbrain tumors and showed rapid uptake, which wasmainly attributed to an increased transport rate. Also,improved localization of tumor tissue for biopsy hasbeen described for both methionine and tyrosine.
L-FET, which is not incorporated into proteins, hasbeen evaluated in mammary carcinoma-bearing miceand in mice transplanted with the colon carcinoma cellline SW707 (Heiss et al., 1999; Wester et al., 1999).Results of transport inhibition experiments usingspecific competitive inhibitors have shown that uptakeof L-FET into SW707 cells is caused mainly by system-L. In vivo studies showed a plasma half-life of 94min forL-FET and increasing brain uptake up to 120min with abrain:blood ratio of 0.9. Xenotransplanted tumors haveshown a higher uptake of L-FET (46% injected dose/g)than all other organs, except the pancreas. High-performance liquid chromatography analysis of brain,
pancreas and tumor homogenates, as well as plasmasamples of mice at 10, 40 or 60min after injection,showed only unchanged L-FET, indicating high stabilityand lack of metabolization of the tracer. The tracer hasmainly been applied in brain tumors for planning ofradiation therapy, detection of tumor recurrence aftertherapy (Figure 4) and differentiation between inflam-mation and tumor (Popperl et al., 2004; Pauleit et al.,2005; Salber et al., 2007; Vees et al., 2009).
A variety of synthetic amino acids, including a-amino-isobutyric acid (AIB), 1-aminocyclopentane carboxylic(ACPC) acid, 2-amino-3-fluoro-2-methylpropanoic acid(FAMP), 3-fluoro-2-methyl-2-(methylamino)propanoicacid (N-MeFAMP) and 1-amino-3-fluorocyclobutane-1-carboxylic acid (FACBC), have been synthesized andevaluated, mostly in cell culture and animal systems.AIB is thought to be actively accumulated in viable cellsprimarily by the A-type amino-acid transport systemand has shown avid uptake in a melanoma model.Additionally, ACPC and AIB imaging was found to besuperior to FDG in C6 gliomas and Walker 256 rat
Figure 3 L-FET-PET in a rat with Morris hepatoma transplanted subcutaneously on the right thigh. Coronal slice (left) with traceraccumulation in the bowel and the tumor (circle), and time–activity curves (right) showing time-dependent accumulation of the tracerin the left ventricle and the tumor. L-FET, O-(2-18F-fluoroethyl)-L-tyrosine; PET, positron emission tomography.
Figure 4 FET-PET in a patient with recurrent glioblastoma: transaxial slices (PET on the right side, fusion image of PET and CT onthe left side) demonstrating tracer accumulation in the periphery and necrosis in the center of the lesion. FET, 18F-O-(2-fluoroethyl)-tyrosine; PET, positron emission tomography.
Molecular imaging of tumor metabolism and apoptosisU Haberkorn et al
5
Oncogene
carcinosarcoma, especially for identifying tumor infil-tration of adjacent brain tissue beyond the macroscopicborder of the tumor, and in low-grade tumors with anintact blood�brain barrier. The contrast-enhancingregions of the tumors were visualized more clearly withAIB than with FDG; viable and necrotic-appearingtumor regions could be distinguished more readily withAIB than with FDG (Uehara et al., 1997). As for AIB,amino-acid transport assays using 9L gliosarcoma cellsshowed that FAMP and N-MeFAMP are substratesfor the A-type amino-acid transport system and showvery high tumor:normal brain ratios of 36:1 and 104:1,respectively (McConathy et al., 2002). In a rat braintumor model, maximum tumor uptake of 18F-FACBCwas seen at 60min, with a tumor:normal brain ratio of5.6 at 5min and 6.6 at 60min after tracer administration(Shoup et al., 1999).
Measurement of the effects of therapy on tumormetabolism may be useful in predicting therapy out-come at an early stage of treatment. This principle maybe applied not only to glucose metabolism but also toamino-acid transport and metabolism. Studies ofvarious human tumors treated with a variety oftherapies and of the rat AH109A tumor model afterradiotherapy showed a rapid post-therapeutic reductionin methionine uptake, reflecting inactivation of proteinsynthesis and damage to the membrane transport system(Bergstrom et al., 1987; Jansson et al., 1995; Schaideret al., 1996). Furthermore, uptake of L-1-11C-tyrosine inthe rhabdomyosarcoma of Wag/Rij rats was dosedependently reduced after local hyperthermia (Daemenet al., 1991). Moreover, accumulation of AIB isdecreased in rat prostate tumors after long-termtreatment with stilbestrol (Dunzendorfer et al., 1981).These changes were followed later by a reduction intumor mass.
In vitro studies have shown that methotrexate andcisplatin induce a decline in AIB and methionineaccumulation in L1210 murine leukemia cells (Scanlonet al., 1983, 1987), leading to the speculation thatinhibition of methionine uptake by methotrexate maybe because of the drug binding to a specific membranecarrier, or reduction in the sodium gradient across theplasma membrane, which is necessary for uptake ofamino acids, or effects on intracellular processes, whichsupport the uptake of amino acids. Higashi et al. (1993)showed an increase in methionine and FDG uptake inhuman ovarian carcinoma cells after radiotherapy,which was accompanied by an increase in cell volume.These phenomena were interpreted as giant cell forma-tion with enlarged cellular volume and continuedprotein synthesis, but accelerated repair was alsosuggested. Another in vitro study combined informationobtained from experiments using a transport tracer(AIB) and a tracer, which is transported and metabo-lized (methionine), and found a decrease in neutralamino-acid transport after gene therapy of hepatomacells using HSV thymidine kinase and ganciclovir,indicating treatment effects on the energy-dependenttransport systems (Haberkorn et al., 1997a). Methio-nine uptake experiments showed a decrease in tracer
accumulation in the acid-insoluble fraction (represent-ing nucleic acids and proteins), indicating impairedprotein synthesis and an increase in the acid-solublefraction. The increase of radioactivity found in theacid-soluble fraction may be caused by enhancedtransmethylation processes, which usually are observedduring oncogenic transformation and after exposure toDNA-damaging agents.
Clinical studies in brain tumors have been conductedfor early evaluation of treatment response and differ-entiation between recurrence and radiation necrosis.In 10 patients with low-grade gliomas, a dose-dependentreduction in methionine uptake was seen after bra-chytherapy (Wurker et al., 1996). Differentiationbetween radiation necrosis and tumor recurrence waspossible by methionine-PET (Ogawa et al., 1991). Afterradiotherapy of head and neck cancer, a lower post-therapeutic methionine uptake was shown to correlatewith therapy response (Lindholm et al., 1998). Similarresults were obtained in patients after radiotherapy orchemotherapy of lung, breast and rectal cancer (Daemenet al., 1991; Jansson et al., 1995). However, the pre-dictive value of methionine-PET remains questionable.
Amino acids have been suggested to be useful fordifferentiation between inflammation and malignancy.Experimental studies have shown that amino acidsaccumulate less in inflamed tissue than FDG. However,amino-acid uptake may occur in benign lesions such asischemic brain, infarction, scar, abscesses and sarcoido-sis, and also in irradiated areas. Therefore, activeinflammatory cells may need amino acids, and thespecificity of amino acids for tumor imaging is notabsolute. However, in mice with tumor-infiltrated orinflammatory lymph nodes, accumulation of L-FETshowed significant differences, with no overlap betweeninflammatory and tumorous nodes (Rau et al., 2002).
In summary, amino acids may have a potential role inthe characterization of the biological properties oftumors as increased amino-acid transport or proteinsynthesis. Advantages over FDG imaging can beexpected in the imaging of brain tumors, because thebackground of tracer accumulation is lower as com-pared with FDG. The role of amino acids for monitor-ing the treatment response of tumors as well as thedifferentiation between inflammation and tumor tissuehas to be established in further studies.
Imaging of choline phospholipid metabolism
Elevated levels of phosphocholine, phosphoethanola-mine and total choline have been detected by in vivo andin vitro 1H and 31PMR spectroscopic studies in a varietyof tumors, including breast, prostate and brain tumors(Negendank, 1992; de Certaines et al., 1993; Leach et al.,1998). Phosphocholine is a precursor as well as abreakdown product of phosphatidylcholine, the mostabundant phospholipid found in biological membranes.The molecule together with other phospholipids such asphosphatidylethanolamine is involved in the formation
Molecular imaging of tumor metabolism and apoptosisU Haberkorn et al
6
Oncogene

of the bilayer structure of the cell membrane andregulates membrane integrity (Ackerstaff et al., 2003).In addition, synthesis and hydrolysis of phosphatidyl-choline are essential for mitogenic signal transduction(Cai et al., 1993). In that respect, the products of cholinephospholipid metabolism, such as phosphocholine anddiacylglycerol, may function as second messengersfor the mitogenic activity in the activation of theras–raf-1–mitogen-activated protein kinase (MAPK)cascade and the protein kinase-C pathway (Cai et al.,1993). A couple of studies showed that activation ofcholine uptake and phosphorylation is rather a lateevent involved in a cascade of intracellular signaltransduction events that results in cellular transforma-tion. This was seen for activation of the ras-GTPase-activating protein, the phosphatidylinositol-3-kinaseand other tyrosine kinases (Molloy et al., 1989; Kyptaet al., 1990; Cuadrado et al., 1994; Galetic et al., 1999).In quiescent NIH3T3 fibroblasts, DNA synthesis wasstimulated by phosphocholine, with no effect forcholine, phosphorylserine and phosphoethanolamine.Furthermore, incubation with the choline kinaseinhibitor HC-3 blocked growth factor induced prolif-eration, an effect that could be reversed by addition ofphosphocholine. Therefore, phosphocholine is seen asan important second messenger for mitogenic activity,with choline kinase activity as a critical step for theregulation of cell proliferation (Cuadrado et al., 1993).
Besides growth factors, choline phospholipid meta-bolism is regulated through a variety of mechanisms,including stimulation by cytokines (Bogin et al., 1998),oncogenes (Aboagye and Bhujwalla, 1999; Ronen et al.,2001), hypoxia and chemical carcinogens (Kiss et al.,1993; Galons et al., 1995).
The mechanisms responsible for the increased phos-phocholine levels in malignant cells are an increase inthe expression and activity of choline kinase (Ramirezde Molina et al., 2002a, b), choline transport activity(Haeffner, 1975; Katz-Brull and Degani, 1996) andelevated levels of enzyme activity for phospholipase-D(Noh et al., 2000) and phospholipase-A2 (Guthridgeet al., 1994). Choline kinase is the first enzyme involvedin the Kennedy pathway and transforms choline intophosphocholine. Its enzyme activity is upregulated bygrowth factors, chemical carcinogens and oncogenes
(Hernandez-Alcoceba et al., 1999). Incubation ofEhrlich ascites tumor cells with 3H- or 14C-cholineshowed that choline was taken up at low concentrationsby an active transport mechanism and converted intophosphorylcholine within 1 h, followed by degradationto phosphatidylcholine (Haeffner, 1975).
The mentioned changes in choline content andmetabolism have been used for tumor diagnosis byproton magnetic resonance spectroscopy, which isusually performed in combination with anatomicalMRI. Pre- and post-therapy studies showed thatcombined MRI and magnetic resonance spectroscopicimaging was able to assess the presence and localizationof cancer, as well as the effects of treatment (Leachet al., 1998; Kurhanewicz et al., 2000). This has beendone for a variety of tumors, including prostate, brainand breast cancer (Negendank, 1992; Gribbestad et al.,1999; Kurhanewicz et al., 2000; Li et al., 2002).
Furthermore, radiolabeled choline analogs havebeen used for tumor detection by PET in many tumorentities such as brain tumors, lung cancer, esophagealcancer, colon cancer, bladder cancer and prostate cancer(Hara et al., 1998, 2002; Kobori et al., 1999; DeGradoet al., 2000, 2001; Kwee et al., 2004, 2006). Asmentioned above, choline is transported into cells.Thereafter, it is rapidly metabolized to phosphocholineor oxidized by choline dehydrogenase and betaine-aldehyde dehydrogenase to betaine. The latter occursmainly in the liver and kidneys. Phosphorylation ofcholine by choline kinase represents the first andobligatory step for the incorporation of choline intophosphatidylcholine. The resulting first metabolite,phosphocholine, is negatively charged and, therefore,trapped within the cell.
Several choline-based tracers exist that have beensynthesized and evaluated pre-clinically as well as inpatients, for example, 11C-choline, 18F-fluoro-cholineand 18F-fluoroethyl-choline (Figure 5). Comparativestudies in vitro showed that fluoro-choline uptake inPC-3 prostate cancer cells was similar to choline uptake.Furthermore, a 90% decrease of tracer uptake wasseen after pretreatment with HC-3, a specific inhibitor ofcholine uptake and phosphorylation (DeGrado et al.,2000, 2001). Experiments in tumor bearing mice showeda similar bio-distribution as with 11C-labeled choline.
Figure 5 PET/CT (transaxial slices) using 18F-fluoroethyl-choline in a patient with rising PSA levels 2 years after surgery. Rapidaccumulation (2min, left) of the tracer occurs in a lymph node metastasis (shown in the center of the crosshairs) and remains in thelesion also at later time periods (60min, right). CT, computed tomography; FDG, fluorodeoxyglucose.
Molecular imaging of tumor metabolism and apoptosisU Haberkorn et al
7
Oncogene

At 1h after administration the tumor:blood ratio was 5:1,suggesting trapping of tracer in the tumor cells, consistentwith phosphorylation by choline kinase activity.
The blood clearance of 18F-fluoro-choline was veryrapid in patients, leading to an excellent contrastbetween tumor and background in PET images at3min after tracer administration. In comparison with11C-choline, 18F-fluoro-choline and 18F-fluoroethyl-cho-line showed a higher renal clearance. It is known thatcholine is efficiently reabsorbed by the renal proximaltubular cells. Thus, the main route of clearance relies onthe oxidation of the molecule by the enzymes cholinedehydrogenase and betaine-aldehyde dehydrogenase,which convert choline into betaine. Thereafter, betaineis excreted in the urine. Therefore, it is likely that thevery rapid appearance of fluorinated choline tracersis because of incomplete tubular re-absorption ofthe intact tracer or owing to enhanced excretion ofoxidative metabolites (DeGrado et al., 2000, 2001).In benign prostate tissues, a decrease of tracer accumu-lation was observed with time, also leading to a highercontrast between tumor and normal tissue. It has beensuggested that this is because of dephosphorylation of18F-phosphorylfluoro-choline by prostatic acid phos-phatase, an enzyme specific for prostate tissues(DeGrado et al., 2000, 2001). Normal prostate tissueas well as prostate hyperplasia contain higher levels ofprostatic acid phosphatase than prostate carcinoma,which accepts phosphocholine and possibly also18F-phosphorylfluoro-choline as a substrate.
Imaging apoptosisFor in vivo detection of apoptosis mainly two targets inthe apoptotic pathway are of interest: (1) The presenta-tion of phosphatidylserine residues at the outer surfaceof the plasma membrane and (2) the appearance ofactivated caspases (Martin et al., 1995; Villa et al.,1997). Phosphatidylserine is maintained at the innersurface of the plasma membrane by the ATP-dependentenzymes floppase and translocase (Zwaal and Schroit,1997). Apoptosis induced inactivation of these enzymes,and activation of a scramblase leads to the appearance
of phosphatidylserine on the outer surface of themembrane. This effect has been used to develop animaging agent for apoptosis (Blankenberg et al., 1998,1999): Annexin-V, a 35-kDa human protein with highaffinity for cell membrane-bound phosphatidylserine,was labeled with 99mTc and investigated for its uptake inapoptotic cells. An increased accumulation was found inJurkat cells, where programmed cell death was initiatedby growth factor deprivation, anti-CD95 antibody anddoxorubicin treatment. Also anti-CD95-treated miceshowed a threefold rise in hepatic 99mTc-Annexin-Vaccumulation in response to severe liver damage, withhistological evidence of apoptosis. Finally, increaseduptake was detected in animal models using acuterejection of transplanted heterotopic cardiac allograftsor transplanted murine B-cell lymphomas treated withcyclophosphamide (Blankenberg et al., 1999). Figure 6shows a patient studied with 99mTc-Annexin-V aftertreatment.
As caspases have a key role during the early period ofthe intracellular signal cascade of cells undergoing apo-ptosis, benzyloxycarbonyl-Val-Ala-DL-Asp(O-methyl)-fluoromethyl ketone (Z-VAD-fmk), a pan-caspaseinhibitor, was evaluated as a potential apoptosis-imaging agent (Haberkorn et al., 2001c). Uptakemeasurements were performed using Morris hepatomacells (MH3924Atk8), which showed expression of theHerpes Simplex Virus thymidine kinase (HSVtk) gene.Apoptosis was induced by treating cells with ganciclovirand a twofold increase in [131I]I-Z-VAD-fmk uptake wasfound at the end of treatment with the HSVtk/suicidesystem, which constantly remained elevated for thefollowing 4 h. The slow cellular influx and lack of uptakesaturation of [131I]IZ-VAD-fmk are evidences for simplediffusion as uptake mechanism. In addition, absolutecellular uptake of [131I]IZ-VAD-fmk was found to below. Besides peptidic molecules, a couple of isatinsulfonamide analogs have been identified as potentinhibitors of executioner caspases such as caspase-3and caspase-7 and, therefore, have been radiolabeled foruse in apoptosis imaging (Zhou et al., 2009).
As inhibitors suffer from the drawback that oneinhibitor molecule binds to one enzyme molecule, the
Figure 6 Transaxial SPECT/CT images of a patient with non-small-cell lung cancer after chemotherapy: CT (left), SPECT (middle)and fusion image (right). The tumor (at the center of the crosshairs) and the central lymph node metastasis show accumulation of99mTc-Annexin-V after chemotherapy, indicating apoptosis. Unspecific accumulation is seen in the sternum and the vertebra. CT,computed tomography.
Molecular imaging of tumor metabolism and apoptosisU Haberkorn et al
8
Oncogene

signal obtained is rather weak. Instead of using aninhibitor, synthetic caspase substrates are investigated,which may accumulate in an apoptotic cell by metabolictrapping, thereby enhancing the imaging signal. In oneof these studies, 10 radiolabeled peptides containing theDEVDG sequence, selective for downstream caspasessuch as caspase-3, were synthesized and evaluated fortheir uptake kinetics using an apoptosis test system(Bauer et al., 2005).Within this series of peptides,radioiodinated Tat49–57-yDEVDG-NH2 and Tat57–49-yDEVDG-NH2, both containing an additional HIVTat sequence, were taken up by apoptotic cells to asignificant higher extent as compared with controls.This enhanced uptake was interpreted as interaction ofthe labeled peptide or fragment with activated caspases.Current efforts are focused on alternative radioisotopes,
including radiometal complexes, to further improvethese characteristics.
In summary, all these imaging procedures may beused to characterize the biological features of tumorsand their metastases with respect to metabolism,apoptosis and microenvironment. The informationobtained with these techniques can be expected toindividualize treatment, and makes radioisotope-basedmethods promising tools for tumor detection, therapyplanning and therapy monitoring.
Conflict of interest
The authors declare no conflict of interest.
References
Aboagye EO, Bhujwalla ZM. (1999). Malignant transformation altersmembrane choline phospholipid metabolism of human mammaryepithelial cells. Cancer Res 59: 80–84.
Ackerstaff E, Glunde K, Bhujwalla ZM. (2003). Choline phospholipidmetabolism: a target in cancer cells? J Cell Biochem 90: 525–533.
Bassa P, Kim EE, Inoue T, Wong FC, Korkmaz M, Yang DJ et al.(1996). Evaluation of preoperative chemotherapy using PET withfluorine-18-fluorodeoxyglucose in breast cancer. J Nucl Med 37:931–938.
Bauer C, Bauder-Wuest U, Mier W, Haberkorn U, Eisenhut M.(2005). 131I-labeled peptides as caspase substrates for apoptosisimaging. J Nucl Med 46: 1066–1074.
Bergstrom M, Muhr C, Lundberg PO, Bergstrom K, Gee AD,Fasth KJ et al. (1987). Rapid decrease in amino acid metabolism inprolactin-secreting pituitary adenomas after bromocriptine treat-ment: a PET study. J Comput Assist Tomogr 11: 815–819.
Blankenberg FG, Katsikis PD, Tait JF, Davis RE, Naumovski L,Ohtsuki K et al. (1998). In vivo detection and imaging ofphosphatidylserine expression during programmed cell death.Proc Natl Acad Sci USA 95: 6349–6354.
Blankenberg FG, Katsikis PD, Tait JF, Davis RE, Naumovski L,Ohtsuki K et al. (1999). Imaging of apoptosis (programmed celldeath) with 99mTc annexin V. J Nucl Med 40: 184–191.
Bogin L, Papa MZ, Polak-Charcon S, Degani H. (1998). TNF-inducedmodulations of phospholipid metabolism in human breast cancercells. Biochim Biophys Acta 1392: 217–232.
Brown RS, Leung JY, Kison PV, Zasadny KR, Flint A, Wahl RL.(1999). Glucose transporters and FDG uptake in untreated primaryhuman non-small cell lung cancer. J Nucl Med 40: 556–565.
Busch H, Davis JR, Honig GR, Anderson DC, Nair PV, Nyhan WLet al. (1959). The uptake of a variety of amino acids into nuclearproteins of tumors and other tissues. Cancer Res 19: 1030–1039.
Cai H, Erhardt P, Troppmair J, Diaz-Meco MT, Sithanandam G,Rapp UR et al. (1993). Hydrolysis of phosphatidylcholine couplesRas to activation of Raf protein kinase during mitogenic signaltransduction. Mol Cell Biol 13: 7645–7651.
Christensen HN. (1990). Role of amino acid transport and counter-transport in nutrition and metabolism. Physiol Rev 70: 43–76.
Cuadrado A, Carnero A, Dolfi F, Jimenez B, Lacal JC. (1993).Phosphorylcholine: a novel second messenger essential for mito-genic activity of growth factors. Oncogene 8: 2959–2968.
Cuadrado A, Issing W, Fleming TP, Molloy CJ. (1994). Unevendistribution of protein kinase C-a and -b isozymes in humansarcomas and carcinomas. J Cell Physiol 159: 434–440.
Daemen BJ, Elsinga PH, Mooibroek J, Paans AM, Wieringa AR,Konings AW et al. (1991). PET measurements of hyperthermia-
induced suppression of protein synthesis in tumors in relation toeffects on tumor growth. J Nucl Med 32: 1587–1592.
de Certaines JD, Larsen VA, Podo F, Carpinelli G, Briot O,Henriksen O. (1993). In vivo 31P MRS of experimental tumours.NMR Biomed 6: 345–365.
DeGrado TL, Coleman RE, Wang S, Baldwin SW, Orr MD,Robertson CN et al. (2000). Price synthesis and evaluation of18F-labeled choline as an oncologic tracer for positron emissiontomography: initial findings in prostate cancer. Cancer Res 61:110–117.
DeGrado TR, Coleman RE, Wang S, Baldwin SW, Orr MD,Robertson CN et al. (2001). Synthesis and evaluation of(18)F-labeled choline analogs as oncologic PET tracers. J NuclMed 42: 1805–1814.
Dunzendorfer U, Schmall B, Bigler RE, Zanzonico PB, Conti PS,Dahl JR et al. (1981). Synthesis and body distribution ofalpha-aminoisobutyric acid-L-11C in normal and prostatecancer bearing rat after chemotherapy. Eur J Nucl Med 6:535–538.
Flier JS, Mueckler MM, Usher P, Lodish HF. (1987). Elevated levelsof glucose transport and transporter messenger RNA are induced byras or src oncogenes. Science 235: 1492–1495.
Galetic I, Andjelkovic M, Meier R, Brodbeck D, Park J,Hemmings BA. (1999). Mechanism of protein kinase B activationby insulin/insulin-like growth factor-1 revealed by specific inhibitorsof phosphoinositide 3-kinase—significance for diabetes and cancer.Pharmacol Ther 82: 409–425.
Galons JP, Job C, Gillies RJ. (1995). Increase of GPC levels in culturedmammalian cells during acidosis. A 31P MR spectroscopy studyusing a continuous bioreactor system. Magn Reson Med 33:422–426.
Gallagher BM, Ansari A, Atkins H, Casella V, Christman DR et al.(1977). 18F-labeled 2-deoxy-2-fluoro-D-glucose as a radiopharma-ceutical for measuring regional myocardial glucose metabolismin vivo: tissue distribution and imaging studies in animals. J Nucl
Med 18: 990–996.Ganapathy V, Thangaraju M, Prasad PD. (2009). Nutrient transpor-
ters in cancer: relevance to Warburg hypothesis and beyond.Pharmacol Ther 121: 29–40.
Gribbestad IS, Sitter B, Lundgren S, Krane J, Axelson D. (1999).Metabolite composition in breast tumors examined by protonnuclear magnetic resonance spectroscopy. Anticancer Res 19:1737–1746.
Guthridge CJ, Stampfer MR, Clark MA, Steiner MR. (1994).Phospholipases A2 in ras-transformed and immortalized humanmammary epithelial cells. Cancer Lett 86: 11–21.
Molecular imaging of tumor metabolism and apoptosisU Haberkorn et al
9
Oncogene

Haberkorn U, Altmann A, Kamencic H, Morr I, Traut U, Henze Met al. (2001a). Glucose transport and apoptosis after gene therapywith HSV thymidine kinase. Eur J Nucl Med 28: 1690–1696.
Haberkorn U, Altmann A, Morr I, Germann C, Oberdorfer F,van Kaick G. (1997a). Multi tracer studies during gene therapy ofhepatoma cells with HSV thymidine kinase and ganciclovir. J Nucl
Med 38: 1048–1054.Haberkorn U, Bellemann ME, Altmann A, Gerlach L, Morr I,
Oberdorfer F et al. (1997b). PET 2-fluoro-2-deoxyglucose uptake inrat prostate adenocarcinoma during chemotherapy with gemcita-bine. J Nucl Med 38: 1215–1221.
Haberkorn U, Bellemann ME, Brix G, Kamencic H, Morr I, Traut Uet al. (2001b). Apoptosis and changes in glucose transport earlyafter treatment of Morris hepatoma with gemcitabine. Eur J Nucl
Med 28: 418–425.Haberkorn U, Bellemann ME, Gerlach L, Morr I, Trojan H, Brix G
et al. (1998). Uncoupling of 2-fluoro-2-deoxyglucose transport andphosphorylation in rat hepatoma during gene therapy with HSVthymidine kinase. Gene Ther 5: 880–887.
Haberkorn U, Kinscherf R, Krammer PH, Mier W, Eisenhut M.(2001c). Investigation of a potential scintigraphic marker ofapoptosis: radioiodinated Z-Val-Ala-DL-Asp(O-methyl)-fluoro-methyl ketone. Nucl Med Biol 28: 793–798.
Haberkorn U, Mier W, Eisenhut M. (2005). Scintigraphic imaging ofgene expression and gene transfer. Curr Med Chem 12: 779–794.
Haberkorn U, Reinhardt M, Strauss LG, Oberdorfer F, Berger MR,Altmann A et al. (1992). Metabolic design of combination therapy:use of enhanced fluorodeoxyglucose uptake caused by chemother-apy. J Nucl Med 33: 1981–1987.
Haberkorn U, Strauss LG, Dimitrakopoulou A, Engenhart R,Oberdorfer F, Ostertag H et al. (1991). PET studies of fluorodeoxy-glucose metabolism in patients with recurrent colorectal tumorsreceiving radiotherapy. J Nucl Med 32: 1485–1490.
Haberkorn U, Strauss LG, Dimitrakopoulou A, Seiffert E, OberdorferF, Ziegler S et al. (1993). Fluorodeoxyglucose imaging of advancedhead and neck cancer after chemotherapy. J Nucl Med 34: 12–17.
Haberkorn U, Ziegler SI, Oberdorfer F, Trojan H, Haag D, Peschke Pet al. (1994). FDG uptake, tumor proliferation and expression ofglycolysis associated genes in animal tumor models. Nucl Med Biol
21: 827–834.Haeffner EW. (1975). Studies on choline permeation through the
plasma membrane and its incorporation into phosphatidyl cholineof Ehrlich–Lettre-ascites tumor cells in vitro. Eur J Biochem 51:219–228.
Hara T, Kosaka N, Kishi H. (1998). PET imaging of prostate cancerusing carbon-11-choline. J Nucl Med 39: 990–995.
Hara T, Kosaka N, Kishi H. (2002). Development of (18)F-fluoroethylcholine for cancer imaging with PET: synthesis, bio-chemistry, and prostate cancer imaging. J Nucl Med 43: 187–199.
Hayes N, Biswas C, Strout HV, Berger J. (1993). Activation by proteinsynthesis inhibitors of glucose transport into L6 muscle cells.Biochem Biophys Res Commun 190: 881–887.
Heiss P, Mayer S, Herz M, Wester HJ, Schwaiger M, Senekowitsch-Schmidtke R. (1999). Investigation of transport mechanism anduptake kinetics of O-(2-[18F]fluoroethyl)-L-tyrosine in vitro andin vivo. J Nucl Med 40: 1367–1373.
Hernandez-Alcoceba R, Fernandez F, Lacal JC. (1999). In vivoantitumor activity of choline kinase inhibitors: a novel target foranticancer drug discovery. Cancer Res 59: 3112–3118.
Higashi K, Clavo AC, Wahl RL. (1993). In vitro assessment of2-fluoro-2-deoxy-D-glucose, L-methionine and thymidine as agentsto monitor the early response of a human adenocarcinoma cell lineto radiotherapy. J Nucl Med 34: 773–779.
Hughes CS, Shen JW, Subjeck JR. (1989). Resistance to etoposideinduced by three glucose-regulated stresses in Chinese hamsterovary cells. Cancer Res 49: 4452–4454.
Ishiwata K, Enomoto K, Sasaki T, Elsinga PH, Senda M, Okazumi Set al. (1996). A feasibility study on L-[1-carbon11]tyrosine andL-[methyl-carbon-11]methionine to assess liver protein synthesis.J Nucl Med 37: 279–285.
Isselbacher KJ. (1972). Sugar and amino acid transport by cells inculture: differences between normal and malignant cells. N Engl J
Med 286: 929–933.Jager PL, Vaalburg W, Pruim J, de Vries EG, Langen KJ, Piers DA.
(2001). Radiolabeled amino acids: basic aspects and clinicalapplications in oncology. J Nucl Med 42: 432–445.
Jansson T, Westlin JE, Ahlstrom H, Lilja A, Langstrom B, Bergh Jet al. (1995). Positron emission tomography studies in patients withlocally advanced and/or metastatic breast cancer: a method for earlytherapy evaluation. J Clin Oncol 13: 1470–1477.
Katz-Brull R, Degani H. (1996). Kinetics of choline transport andphosphorylation in human breast cancer cells; NMR application ofthe zero trans method. Anticancer Res 16: 1375–1380.
Kiss Z, Crilly KS, Anderson WH. (1993). Carcinogens stimulatephosphorylation of ethanolamine derived from increased hydrolysisof phosphatidylethanolamine in C3H/101/2 fibroblasts. FEBS Lett
336: 115–118.Kobori O, Kirihara Y, Kosaka N, Hara T. (1999). Positron emission
tomography of esophageal carcinoma using 11C-choline and18F-fluorodeoxyglucose. Cancer 86: 1638–1648.
Kurhanewicz J, Vigneron DB, Nelson SJ. (2000). Threedimensionalmagnetic resonance spectroscopic imaging of brain and prostatecancer. Neoplasia 2: 166–189.
Kuwert T, Probst-Cousin S, Woesler B, Morgenroth C, Lerch H,Matheja P et al. (1997). Iodine-123-alpha-methyl tyrosine in glioma:correlation with cellular density and proliferative activity. J Nucl
Med 38: 1551–1555.Kwee SA, Coel MN, Lim J, Ko JP. (2004). Combined use of F-18
fluorocholine positron emission tomography and magnetic reso-nance spectroscopy for brain tumor evaluation. J Neuroimaging 14:285–289.
Kwee SA, Wei H, Sesterhenn I, Yun D, Coel MN. (2006). Localizationof primary prostate cancer with dual-phase 18F-fluorocholine PET.J Nucl Med 47: 262–269.
Kypta RM, Goldberg Y, Ulug ET, Courtneidge SA. (1990).Association between the PDGF receptor and members of the srcfamily of tyrosine kinases. Cell 62: 481–492.
Langen KJ, Ziemons K, Kiwit JC, Herzog H, Kuwert T, Bock WJet al. (1997). 3-[123I]iodo-alpha-methyltyrosine and [methyl-11C]-L-methionine uptake in cerebral gliomas: a comparative study usingSPECT and PET. J Nucl Med 38: 517–522.
Leach MO, Verrill M, Glaholm J, Smith TA, Collins DJ, Payne GSet al. (1998). Measurements of human breast cancer using magneticresonance spectroscopy: a review of clinical measurements and areport of localized 31P measurements of response to treatment.NMR Biomed 11: 314–340.
Li X, Lu Y, Pirzkall A, McKnight T, Nelson SJ. (2002). Analysis of thespatial characteristics of metabolic abnormalities in newly diag-nosed glioma patients. J Magn Reson Imaging 16: 229–237.
Lindholm P, Leskinen S, Lapela M. (1998). Carbon-11-methionineuptake in squamous cell head and neck cancer. J Nucl Med 39:1393–1397.
Machado de Domenech EE, Sols A. (1980). Specificity of hexokinasestowards some uncommon substrates and inhibitors. FEBS Lett 119:174–176.
Martin SJ, Reutelingsperger CPM, McGahon AJ. (1995). Earlyredistribution of plasma membrane phosphatidylserine is a generalfeature of apoptosis regardless of the initiating stimulus: inhibitionby overexpression of Bcl-2 and Abl. J Exp Med 182: 1545–1556.
McConathy J, Martarello L, Malveaux EJ, Camp VM, Simpson NE,Simpson CP et al. (2002). Radiolabeled amino acids for tumorimaging with PET: radiosynthesis and biological evaluation of2-amino-3-[18F]fluoro-2-methylpropanoic acid and 3-[18F]fluoro-2-methyl-2-(methylamino)propanoic acid. J Med Chem 45:2240–2249.
Molloy CJ, Bottaro DP, Fleming TP, Marshall MS, Gibbs JB,Aaronson SA. (1989). PDGF induction of tyrosine phosphorylationof GTPase activating protein. Nature (Lond) 342: 711–714.
Negendank W. (1992). Studies of human tumors by MRS: a review.NMR Biomed 5: 303–324.
Molecular imaging of tumor metabolism and apoptosisU Haberkorn et al
10
Oncogene

Noh DY, Ahn SJ, Lee RA, Park IA, Kim JH, Suh PG et al. (2000).Overexpression of phospholipase D1 in human breast cancer tissues.Cancer Lett 161: 207–214.
Ogawa T, Kanno I, Shishido F, Inugami A, Higano S, Fujita H et al.(1991). Clinical value of PET with 18F-fluorodeoxyglucose andL-methyl-11C-methionine for diagnosis of recurrent brain tumor andradiation injury. Acta Radiol 32: 197–202.
Pauleit D, Floeth F, Hamacher K, Riemenschneider MJ,Reifenberger G, Muller HW et al. (2005). O-(2-[18F]fluoroethyl)-L-tyrosine PET combined with MRI improves the diagnosticassessment of cerebral gliomas. Brain 128: 678–687.
Popperl G, Gotz C, Rachinger W, Gildehaus FJ, Tonn JC, Tatsch K.(2004). Value of O-(2-[18F]fluoroethyl)-L-tyrosine PET for thediagnosis of recurrent glioma. Eur J Nucl Med Mol Imaging 31:1464–1470.
Ramirez de Molina A, Gutierrez R, Ramos MA, Silva JM, Silva J,Bonilla F et al. (2002a). Increased choline kinase activity in humanbreast carcinomas: clinical evidence for a potential novel antitumorstrategy. Oncogene 21: 4317–4322.
Ramirez de Molina A, Rodriguez-Gonzalez A, Gutierrez R, Martinez-Pineiro L, Sanchez J, Bonilla F et al. (2002b). Overexpression ofcholine kinase is a frequent feature in human tumor-derived celllines and in lung, prostate, and colorectal human cancers. Biochem
Biophys Res Commun 296: 580–583.Rau FC, Weber WA, Wester HJ, Herz M, Becker I, Kruger A et al.
(2002). O-(2-[18F]fluoroethyl)-L-tyrosine (FET): a tracer for differ-entiation of tumor from inflammation in murine lymph nodes.Eur J Nucl Med 29: 1039–1046.
Ronen SM, Jackson LE, Beloueche M, Leach MO. (2001). Magneticresonance detects changes in phosphocholine associated with Rasactivation and inhibition in NIH 3T3 cells. Br J Cancer 84: 691–696.
Rozental JM, Levine RL, Nickles RJ, Dobkin JA. (1989). Glucoseuptake by gliomas after treatment. A positron emission tomo-graphic study. Arch Neurol 46: 1302–1307.
Saier MH, Daniels JR, Boerner P, Lin J. (1988). Animal amino acidtransport systems in animal cells: potential targets of oncogeneaction and regulators of cellular growth. J Membr Biol 104: 1–20.
Salber D, Stoffels G, Pauleit D, Oros-Peusquens AM, Shah NJ,Klauth P et al. (2007). Differential uptake of O-(2-18F-fluoroethyl)-L-tyrosine, L-3H-methionine, and 3H-deoxyglucose in brain ab-scesses. J Nucl Med 48: 2056–2062.
Scanlon K, Cashmore AR, Kashani-Sabet M, Pallai M, Dreyer RN,Moroson BA et al. (1987). Inhibition of methionine uptake bymethotrexate in mouse leukemia L1210. Cancer Chemother Phar-
macol 19: 21–24.Scanlon K, Safirstein RL, Thies H, Gross RB, Waxman S, Guttenplan
JB. (1983). Inhibition of amino acid transport by cis-diaminedi-chloroplatinum (II) derivatives L1210 murine leukemia cells. Cancer
Res 43: 4211–4215.Schaider H, Haberkorn U, Berger MR, Oberdorfer F, Morr I, van
Kaick G. (1996). Application of alpha-aminoisobutyric acid, L-methionine, thymidine and 2-fluoro-2-deoxy-D-glucose to monitoreffects of chemotherapy in a human colon carcinoma cell line.Eur J Nucl Med 23: 55–60.
Shawver LK, Olson SA, White MK, Weber MJ. (1987). Degradationand biosynthesis of the glucose transporter protein in chickenembryo fibroblasts transformed by the src oncogene. Mol Cell Biol
7: 2112–2118.Shoup TM, Olson J, Hoffman JM, Votaw J, Eshima D, Eshima L et al.
(1999). Synthesis and evaluation of [18F]1-amino-3-fluorocyclobu-tane-1-carboxylic acid to image brain tumors. J Nucl Med 40:331–338.
Sieger S, Jiang S, Kleinschmidt J, Eskerski H, Schonsiegel F, AltmannA et al. (2004). Tumor-specific gene expression using regulatory
elements of the glucose transporter isoform 1 gene. Cancer Gene
Ther 11: 41–51.Sieger S, Jiang S, Schonsiegel F, Eskerski H, Kubler W, Altmann A
et al. (2003). Tumor-specific activation of the sodium/iodidesymporter gene under control of the glucose transporter gene 1promoter (GTI-1.3). Eur J Nucl Med Mol Imaging 30: 748–756.
Singh D, Banerji AK, Dwarakanath BS, Tripathi RP, Gupta JP,Mathew TL et al. (2005). Optimizing cancer radiotherapy with2-deoxy-d-glucose dose escalation studies in patients with glioblas-toma multiforme. Strahlenther Onkol 181: 507–514.
Sols A, Crane RK. (1954). Substrate specificity of brain hexokinase.J Biol Chem 210: 581–595.
Uehara H, Miyagawa T, Tjuvajev J, Joshi R, Beattie B, Oku T et al.(1997). Imaging experimental brain tumors with 1-aminocyclo-pentane carboxylic acid and alpha-aminoisobutyric acid: compar-ison to fluorodeoxyglucose and diethylenetriaminepentaacetic acidin morphologically defined tumor regions. J Cereb Blood Flow
Metab 17: 1239–1253.Vaalburg W, Coenen HH, Crouzel C, Elsinga PH, Langstrom B,
Lemaire C et al (1992). Amino acids for the measurement of proteinsynthesis in vivo by PET. Int J Rad Appl Instrum B 19: 227–237.
Vansteenkiste JF, Stroobants SG, Dupont PJ, De Leyn PR, VerbekenEK, Deneffe GJ et al. (1999). Prognostic importance of thestandardized uptake value on (18)F-fluoro-2-deoxy-glucose-posi-tron emission tomography scan in non-small-cell lung cancer: ananalysis of 125 cases. Leuven Lung Cancer Group. J Clin Oncol 17:3201–3206.
Vees H, Senthamizhchelvan S, Miralbell R, Weber DC, Ratib O, ZaidiH. (2009). Assessment of various strategies for 18F-FET PET-guideddelineation of target volumes in high-grade glioma patients.Eur J Nucl Med Mol Imaging 36: 182–193.
Villa P, Kaufmann SH, Earnshwa WC. (1997). Caspases and caspaseinhibitors. TIBS 22: 388–393.
Wertheimer E, Sasson S, Cerasi E, Ben-Neriah Y. (1991). Theubiquitous glucose transporter GLUT-1 belongs to the glucose-regulated protein family of stress-inducible proteins. Proc Natl Acad
Sci USA 88: 2525–2529.Wester HJ, Herz M, Weber W, Heiss P, Senekowitsch-Schmidtke R,
Schwaiger M et al. (1999). Synthesis and radiopharmacology ofO-(2-[18F]fluoroethyl)-L-tyrosine for tumor imaging. J Nucl Med 40:205–212.
Widnell CC, Baldwin SA, Davies A, Martin S, Pasternak CA. (1990).Cellular stress induces a redistribution of the glucose transporter.FASEB J 4: 1634–1637.
Wienhard K, Herholz K, Coenen HH, Rudolf J, Kling P, Stocklin Get al. (1991). Increased amino acid transport into brain tumorsmeasured by PET of L-(2-18F)fluorotyrosine. J Nucl Med 32:1338–1346.
Willemsen AT, vanWaarde A, Paans AM, Pruim J, Luurtsema G,Go KG et al. (1995). In vivo protein synthesis rate determination inprimary or recurrent brain tumors using L-[1-11C]-tyrosine and PET.J Nucl Med 36: 411–419.
Wurker M, Herholz K, Voges J, Pietrzyk U, Treuer H, Bauer B et al.(1996). Glucose consumption and methionine uptake in low-gradegliomas after iodine-125 brachytherapy. Eur J Nucl Med 23:583–586.
Zhou D, Chu W, Chen DL, Wang Q, Reichert DE, Rothfuss J et al.(2009). 18F and 11C-labeled N-benzyl-isatin sulfonamide analoguesas PET tracers for apoptosis: synthesis, radiolabelling mechanism,and in vivo imaging study of apoptosis in Fas-treated mice using11C-WC-98. Org BiomolChem 7: 1337–1348.
Zwaal RFA, Schroit AJ. (1997). Pathophysiologic implications ofmembrane phospholipid asymmetry in blood cells. Blood 89:1121–1132.
Molecular imaging of tumor metabolism and apoptosisU Haberkorn et al
11
Oncogene
Related Documents


