Molecular Genetics of Human Color Vision: The Genes Encoding Blue, Green, and Red Pigments Author(s): Jeremy Nathans, Darcy Thomas, David S. Hogness Source: Science, New Series, Vol. 232, No. 4747 (Apr. 11, 1986), pp. 193-202 Published by: American Association for the Advancement of Science Stable URL: http://www.jstor.org/stable/1696878 Accessed: 15/02/2010 09:39 Your use of the JSTOR archive indicates your acceptance of JSTOR's Terms and Conditions of Use, available at http://www.jstor.org/page/info/about/policies/terms.jsp. JSTOR's Terms and Conditions of Use provides, in part, that unless you have obtained prior permission, you may not download an entire issue of a journal or multiple copies of articles, and you may use content in the JSTOR archive only for your personal, non-commercial use. Please contact the publisher regarding any further use of this work. Publisher contact information may be obtained at http://www.jstor.org/action/showPublisher?publisherCode=aaas. Each copy of any part of a JSTOR transmission must contain the same copyright notice that appears on the screen or printed page of such transmission. JSTOR is a not-for-profit service that helps scholars, researchers, and students discover, use, and build upon a wide range of content in a trusted digital archive. We use information technology and tools to increase productivity and facilitate new forms of scholarship. For more information about JSTOR, please contact [email protected]. American Association for the Advancement of Science is collaborating with JSTOR to digitize, preserve and extend access to Science. http://www.jstor.org

Welcome message from author
This document is posted to help you gain knowledge. Please leave a comment to let me know what you think about it! Share it to your friends and learn new things together.
Transcript
Molecular Genetics of Human Color Vision: The Genes Encoding Blue, Green, and RedPigmentsAuthor(s): Jeremy Nathans, Darcy Thomas, David S. HognessSource: Science, New Series, Vol. 232, No. 4747 (Apr. 11, 1986), pp. 193-202Published by: American Association for the Advancement of ScienceStable URL: http://www.jstor.org/stable/1696878Accessed: 15/02/2010 09:39
Your use of the JSTOR archive indicates your acceptance of JSTOR's Terms and Conditions of Use, available athttp://www.jstor.org/page/info/about/policies/terms.jsp. JSTOR's Terms and Conditions of Use provides, in part, that unlessyou have obtained prior permission, you may not download an entire issue of a journal or multiple copies of articles, and youmay use content in the JSTOR archive only for your personal, non-commercial use.
Please contact the publisher regarding any further use of this work. Publisher contact information may be obtained athttp://www.jstor.org/action/showPublisher?publisherCode=aaas.
Each copy of any part of a JSTOR transmission must contain the same copyright notice that appears on the screen or printedpage of such transmission.
JSTOR is a not-for-profit service that helps scholars, researchers, and students discover, use, and build upon a wide range ofcontent in a trusted digital archive. We use information technology and tools to increase productivity and facilitate new formsof scholarship. For more information about JSTOR, please contact [email protected].
American Association for the Advancement of Science is collaborating with JSTOR to digitize, preserve andextend access to Science.
http://www.jstor.org
8. P. Goldreich and J. Kwan, ibid. 189, 441 (1974); N. Z. Scoville and P. M. Solomon, Astrophys. J. Lett. 187, 67 (1975).
9. A. A. Penzias, Science 208, 663 (1980). 10. J. H. Black and S. P. Willner, Astrophys. J. 279, 673 (1984). 11. G. Neugebauer et al., Astrophys. J. Lett. 278, 1 (1984). 12. T. M. Dame and P. Thaddeus,Astrophys. J. 297, 751 (1985). 13. E. E. Barnard, in PhotographicAtlas of Selected Regions of the Milky Way, E. B. Frost
and M. R. Calverd, Eds. (Carnegie Institution of Washington, Washington, DC, 1927); B. Bok and E. Reilly, Astraphys. J. 105, 255 (1947).
14. R. L. Dickman and D. P. Clemens,Astrophys.J. 271, 143 (1983); P. C. Meyers and P. J. Benson, ibid. 266, 309 (1983); P. C. Meyers, ibid. 270, 105 (1983); P. J. Benson, P. C. Meyers, E. L. Wright, Astrophys.]. Lett. 279, 27 (1984).
15. L. Blitz, L. Magnani, L. Mundy, Astrophys. J. Lett. 282, L9 (1984). 16. G. Baran, thesis, Columbia University (1981). 17. A. Moneti et al., Astrophys. J. 282, 508 (1984); F. J. Vrba, S. E. Strom, K. M.
Strom,Astron. J. 81, 958 (1976). 18. M. Cohen and L. Kuhi,Astrophys.J. Suppl. 41, 743 (1979). 19. L. Blitz and A. A. Stark, Astrophys. J., in press. 20. J. Bally and N. Z. Scoville, ibid. 239, 121 (1980); C. J. Lada, B. G. Elmegreen, L.
Blitz, in Protostars and Planets, T. Gehrels, Ed. (Univ. of Arizona Press, Tucson, 1984), pp. 341-367.
21. R. S. Cohen et al., Astrophys. J. Lett. 290, 15 (1985). 22. B. Zuckerman, Annu. Rev. Astron.Astrophys. 18,263 (1980); G. R. Knapp and M.
Morris, Astrophys. J. 292, 640 (1985). 23. R. D. Gehrz and N. J. Woolf,Astrophys. J. 165, 285 (1971). 24. D. B. Sanders, P. M. Solomon, N. Z. Scoville, ibid. 276, 182 (1985); T. M. Dame,
thesis, Columbia University (1983). 25. D. B. Sanders, N. Z. Scoville, P. M. Solomon,Astrophys.J. 289, 373 (1985); A. A.
Stark, thesis, Princeton University (1979). 26. P. G. Goldsmith and W. D. Langer, Astrophys. J. 222, 881 (1978). 27. G. M. Tielens and D. Hollenbach, ibid. 291, 722 (1985). 28. L. F. Smith, P. Biermann, P. G. Mezger, Astron. Astrophys. 66, 65 (1978); B. M.
Tinsley, Astrophys. J. 208, 797 (1976). 29. T. H. Troland and C. Heiles, Astrophys. J. Lett. 260, 23 (1982); S. S. Hansen,
Astrophys. J. 260, 104 (1982); M. Dragovan, thesis, University of Chicago (1985). 30. A. A. Stark and L. Blitz, Astrophys. J. Lett. 225, 15 (1978). 31. G. B. Field and W. C. Saslaw, Astrophys. J. 142, 568 (1965). 32. J. Kwan, ibid. 229, 567 (1979); N. Z. Scoville and K. Hersch, ibid., p. 578. 33. L. Blitz and F. Shu, ibid. 238, 148 (1980). 34. W. D. Langer, ibid. 225, 860 (1978); in Birth and Infancy of Stars, R. Lucas, A.
Omont, R. Stora, Eds. (North-Holland, Amsterdam, 1985), pp. 279-348. 35. J. Bally and C. J. Lada,Astrophys.J. 265, 154 (1983); J. Welch et al., Science 228,
1389 (1985). 36. R. Mundt and J. W. Fried, Astrophys. J. Lett. 274, 83 (1983). 37. M. J. Reid and J. M. Moran, Annu. Rev. Astron. Astrophys. 19, 231 (1981). 38. C. Norman and J. Silk, Astrophys. J. 238, 158 (1980). 39. L. Spitzer, Physical Processes in the Interstellar Medium (Wiley, New York, 1978). 40. B. G. Elmegreen and C. J. Lada, Astrophys. J. 214, 725 (1977). 41. C. J. Lada, M. Margulis, D. Dearborn, ibid. 285, 141 (1984). 42. C. J. Lada and B. A. Wilking, ibid. 287, 610 (1984). 43. R. S. Cohen et al., Astrophys. J. Lett. 239, 53 (1980). 44. J. E. Gunn, in Active Galactic Nuclei, C. Hazard and S. Mitton, Eds. (Cambridge
Univ. Press, Cambridge, 1979), p. 213; E. Bajaja etal.,Astron.Astrophys. 141, 309 (1984).
45. J. Bally et al., in preparation; G. Heiligman, thesis, Princeton University (1982); J. T. Armstrong and A. H. Barrett, Astrophys. J. Suppl. 57, 535 (1984).
46. I. Gatley et al., Mon. Not. R. Astron. Soc. 210, 565 (1985); H. S. Liszt, W. B. Burton, J. M. van der Hulst, Astron. Astrophys. 142, 237 (1985).
47. T. M. Bania,Astrophys.J. 216, 381 (1977). 48. J. Oort, Annu. Rev. Astron. Astrophys. 15, 295 (1977). 49. L. Spitzer and M. Schwarzschild, Astrophys. J. 114, 385 (1951). 50. I. F. Mirabel and R. Morras, ibid. 279, 86 (1984). 51. F. Verter, thesis, Princeton University (1983). 52. J. Young et al., Astrophys. J. Lett. 287, 65 (1984). 53. J. H. Bieging et al., Astrophys. J. 247, 443 (1981). 54. J. Young, N. Z. Scoville, E. Brady, ibid. 288, 487 (1985); A. A. Stark et al., in
preparation.
OtVB ,tIaIv OtVB ,tIaIv
Molecular Genetics of Human Color Vision:
The Genes Encoding Blue, Green, and
Red Pigments
Molecular Genetics of Human Color Vision:
The Genes Encoding Blue, Green, and
Red Pigments
JEREMY NATHANS, DARCY THOMAS, DAVID S. HOGNESS JEREMY NATHANS, DARCY THOMAS, DAVID S. HOGNESS
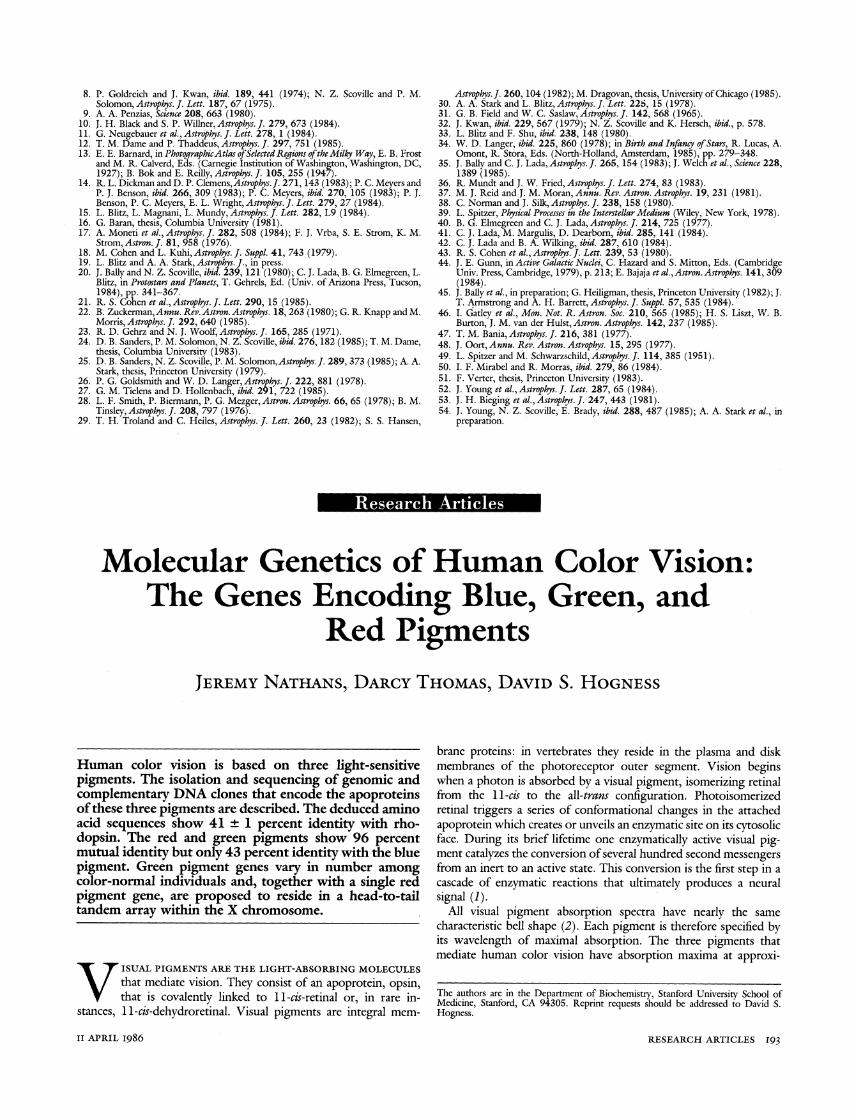
Human color vision is based on three light-sensitive pigments. The isolation and sequencing of genomic and complementary DNA clones that encode the apoproteins of these three pigments are described. The deduced amino acid sequences show 41 +? percent identity with rho- dopsin. The red and green pigments show 96 percent mutual identity but only 43 percent identity with the blue pigment. Green pigment genes vary in number among color-normal individuals and, together with a single red pigment gene, are proposed to reside in a head-to-tail tandem array within the X chromosome.
Human color vision is based on three light-sensitive pigments. The isolation and sequencing of genomic and complementary DNA clones that encode the apoproteins of these three pigments are described. The deduced amino acid sequences show 41 +? percent identity with rho- dopsin. The red and green pigments show 96 percent mutual identity but only 43 percent identity with the blue pigment. Green pigment genes vary in number among color-normal individuals and, together with a single red pigment gene, are proposed to reside in a head-to-tail tandem array within the X chromosome.
V ISUAL PIGMENTS ARE THE LIGHT-ABSORBING MOLECULES that mediate vision. They consist of an apoprotein, opsin, that is covalently linked to 11-cis-retinal or, in rare in-
stances, 11-cis-dehydroretinal. Visual pigments are integral mem-
V ISUAL PIGMENTS ARE THE LIGHT-ABSORBING MOLECULES that mediate vision. They consist of an apoprotein, opsin, that is covalently linked to 11-cis-retinal or, in rare in-
stances, 11-cis-dehydroretinal. Visual pigments are integral mem-
brane proteins: in vertebrates they reside in the plasma and disk membranes of the photoreceptor outer segment. Vision begins when a photon is absorbed by a visual pigment, isomerizing retinal from the 11-cis to the all-trans configuration. Photoisomerized retinal triggers a series of conformational changes in the attached
apoprotein which creates or unveils an enzymatic site on its cytosolic face. During its brief lifetime one enzymatically active visual pig- ment catalyzes the conversion of several hundred second messengers from an inert to an active state. This conversion is the first step in a cascade of enzymatic reactions that ultimately produces a neural signal (1).
All visual pigment absorption spectra have nearly the same characteristic bell shape (2). Each pigment is therefore specified by its wavelength of maximal absorption. The three pigments that mediate human color vision have absorption maxima at approxi-
The authors are in the Department of Biochemistry, Stanford University School of Medicine, Stanford, CA 94305. Reprint requests should be addressed to David S. Hogness.
The authors are in the Department of Biochemistry, Stanford University School of Medicine, Stanford, CA 94305. Reprint requests should be addressed to David S. Hogness.
RESEARCH ARTICLES 193 RESEARCH ARTICLES 193 II APRIL I986 II APRIL I986
mately 420 nm (the blue-sensitive pigment), 530 nm (the green- sensitive pigment), and 560 nm (the red-sensitive pigment) (3). These three pigments are referred to as cone pigments because they reside in those photoreceptor cells with cone-shaped outer seg- ments. A fourth pigment, rhodopsin, that mediates vision in dim light and absorbs maximally at 495 nm, is found in those photore- ceptors with rod-shaped outer segments.
Biochemical studies have usually been focused on rhodopsin, which in most mammals constitutes the most abundant visual pigment. Although, psychophysical and microspectrophotometric experiments have provided a wealth of data concerning the absorp- tion properties of the cone pigments (3), we know little about their structures. However, it seems reasonable to suppose that the different visual pigments are structurally homologous and have arisen from a common ancestor.
In this article we describe a test of the hypothesis that human
Table 1. Percentage sequence homology and identity in pairwise compari- sons of human visual pigments. The values below the 100 percent diagonal represent the percentage of amino acids that are identical, while those above this diagonal represent the percentage of amino acids that are identical or homologous. In this analysis and in that shown in Fig. 12, two amino acids are considered homologous and their substitution conservative, if they are found together in one of the following classes: (class 1) alanine, valine, leucine, isoleucine, proline, phenylalanine, tryptophan, methionine, glycine, cysteine; (class 2) serine, threonine, cysteine, tyrosine, asparagine, gluta- mine; (class 3) aspartic acid, glutamic acid; (class 4) lysine, arginine, histidine; (class 5) phenylalanine, tyrosine, tryptophan; (class 6) histidine, tryptophan. [see (12) and (32)].
Percentage
Rhodopsin Blue Red Green
Rhodopsin 100 75 73 73 Blue 42 100 79 79 Red 40 43 100 99 Green 41 44 96 100
A ' 4 kb?
H
I
BH B B E H HB
I \ I l// I
gJHN23
I gJHN11 B
L-1 kb- -_
'" B H B'' I-5 -[ - 3,-E
1 2 3 4 5
I 1 kb-?
Nv,, ,/ "~" "~/
'"~----~ '-' A~20 hs37
^- "~ ~ ? ^ ̂ ?
hs36
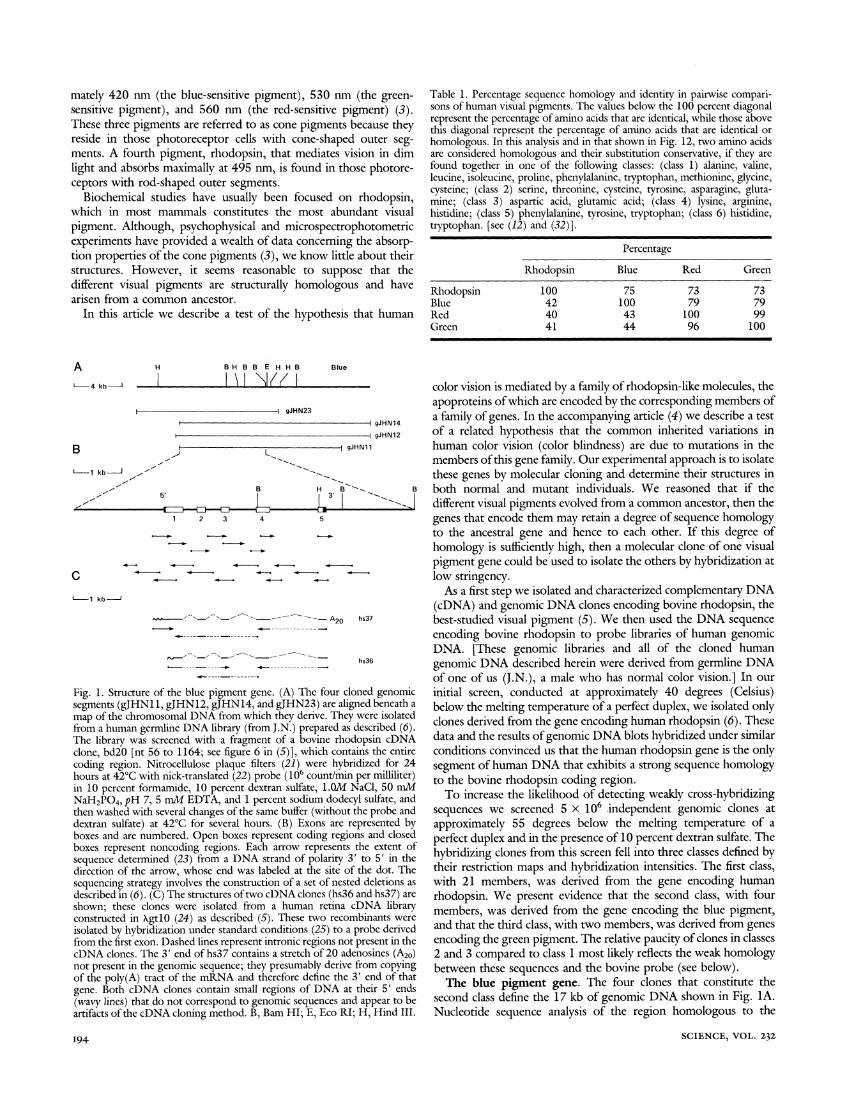
Fig. 1. Structure of the blue pigment gene. (A) The four cloned segments (gJHN11, gJHN12, gJHN14, and gJHN23) are aligned map of the chromosomal DNA from which they derive. They wer from a human germline DNA library (from J.N.) prepared as desc The library was screened with a fragment of a bovine rhodopsi clone, bd20 [nt 56 to 1164; see figure 6 in (5)], which contains 1 coding region. Nitrocellulose plaque filters (21) were hybridize hours at 42?C with nick-translated (22) probe (106 count/min per in 10 percent formamide, 10 percent dextran sulfate, 1.OM NaCI NaH2PO4, pH 7, 5 mM EDTA, and 1 percent sodium dodecyl su then washed with several changes of the same buffer (without the : dextran sulfate) at 42?C for several hours. (B) Exons are repres boxes and are numbered. Open boxes represent coding regions a boxes represent noncoding regions. Each arrow represents the sequence determined (23) from a DNA strand of polarity 3' to direction of the arrow, whose end was labeled at the site of the sequencing strategy involves the construction of a set of nested de described in (6). (C) The structures of two cDNA clones (hs36 and shown; these clones were isolated from a human retina cDN constructed in XgtlO (24) as described (5). These two recombin; isolated by hybridization under standard conditions (25) to a prob from the first exon. Dashed lines represent intronic regions not pres cDNA clones. The 3' end of hs37 contains a stretch of 20 adenosi not present in the genomic sequence; they presumably derive fron of the poly(A) tract of the mRNA and therefore define the 3' er gene. Both cDNA clones contain small regions of DNA at thei (wavy lines) that do not correspond to genomic sequences and apj artifacts of the cDNA cloning method. B, Bam HI; E, Eco RI; H,
Blue
color vision is mediated by a family of rhodopsin-like molecules, the apoproteins of which are encoded by the corresponding members of
gJHN14 a family of genes. In the accompanying article (4) we describe a test
gJHN12 of a related hypothesis that the common inherited variations in human color vision (color blindness) are due to mutations in the members of this gene family. Our experimental approach is to isolate these genes by molecular cloning and determine their structures in
B both normal and mutant individuals. We reasoned that if the ""'-,j1 different visual pigments evolved from a common ancestor, then the
genes that encode them may retain a degree of sequence homology to the ancestral gene and hence to each other. If this degree of
homology is sufficiently high, then a molecular clone of one visual pigment gene could be used to isolate the others by hybridization at low stringency.
As a first step we isolated and characterized complementary DNA (cDNA) and genomic DNA clones encoding bovine rhodopsin, the best-studied visual pigment (5). We then used the DNA sequence encoding bovine rhodopsin to probe libraries of human genomic DNA. [These genomic libraries and all of the cloned human genomic DNA described herein were derived from germline DNA of one of us (J.N.), a male who has normal color vision.] In our
genomic initial screen, conducted at approximately 40 degrees (Celsius) beneath a below the melting temperature of a perfect duplex, we isolated only e isolated clones derived from the gene encoding human rhodopsin (6). These ribed (6). in cDNA data and the results of genomic DNA blots hybridized under similar the entire conditions convinced us that the human rhodopsin gene is the only :d for 24 segment of human DNA that exhibits a strong sequence homology m"ilhter) to the bovine rhodopsin coding region. lfate, and To increase the likelihood of detecting weakly cross-hybridizing probe and sequences we screened 5 x 10⁶ independent genomic clones at sented by approximately 55 degrees below the melting temperature of a nd closed perfect duplex and in the presence of 10 percent dextran sulfate. The xteinthof hybridizing clones from this screen fell into three classes defined by
dot. The their restriction maps and hybridization intensities. The first class, :letions as with 21 members, was derived from the gene encoding human hs37) are rhodopsin. We present evidence that the second class, with four [A library members, was derived from the gene encoding the blue pigment, e derived and that the third class, with two members, was derived from genes ient in the encoding the green pigment. The relative paucity of clones in classes ines (A20) 2 and 3 compared to class 1 most likely reflects the weak homology n copying between these sequences and the bovine probe (see below). id of that ir 5' ends The blue pigment gene. The four clones that constitute the pear to be second class define the 17 kb of genomic DNA shown in Fig. IA. Hind III. Nucleotide sequence analysis of the region homologous to the
SCIENCE, VOL. 232 194

bovine rhodopsin probe reveals a structure strikingly similar to that seen in the genes that encode human and bovine rhodopsins (Fig. IB) (5, 6). When the DNA sequence is conceptually translated on both strands in all three reading frames, we observe five separate regions of amino acid sequence homology with bovine rhodopsin that correspond exactly to the five exons into which the human and bovine rhodopsin genes are divided (Fig. 2). These regions are bounded internally by consensus splice junction sites and are separated by intervening sequences that bear little or no homology to their rhodopsin gene counterparts. The amino acid sequence obtained by conceptually transcribing, splicing, and translating this DNA sequence can be easily aligned with the human (or bovine) rhodopsin sequence without recourse to insertion or deletion of any amino acids. The two amino acid sequences are identical at 42 percent of their residues, and homologous at an additional 33 percent (Table 1). As a consequence of this degree of homology, hydropathy plots of the two proteins are extremely similar and suggest that this new protein would form a structure with seven
10 20 30 40 50 60 70 GGGCAGATGA GTTGAGGAAA ACTTAACTGA TACAGTTGTG CCAGAAGCCA AAATAAGAGG CGTGCCCTTT
80 90 100 110 120 130 140 CTATAGCCCC ATTAAAAGAA CAAAAAAGTG GAAGCATCTT CAGTGAATAT GGGTCAGCAC CTCCCAGACC
150 160 170 180 190 200 210 TCAGGGAGTC CACTTCTGTT CATtCCAGCA CCCAGCATTG CATATCCAGA TTATTTGAGC CCAATCTCTT
220 230 240 250 260 270 280 ATCCTCTGAA GAACACAATC GGCTTTGGGG CCACAGAAGG TTTAGGTAGT GGTTTAGGGA TTTCTAATCC
290 300 310 320 330 340 350 CAAACTTTGT CCTTGGGAGG TTTAGGATTA GTATTGATCA TTCACAGAGC CCAAGTGTTT TTAGAGGAGG
360 370 380 390 400tart te
GGTTTTGTGG GGTGGGAGGA TCACCtATAAj GAGGACTCAG AGGAGGGTGT GGGGCATCC ATG AGA MET Arg
424 439 454 469 AAA ATG TCG GAG GAA GAG TTT TAT CTG TTC AAA AAT ATC TCT TCA GTG GGG CCG Lys MET Ser Glu Glu Glu Phe Tyr Leu Phe Lys Asn I]e Ser Ser Val Gly Pro
484 499 514 TGG GAT GGG CCT CAG TAC CAC ATT GCC CCT GTC TGG GCC TTC TAC CTC CAG GCA Trp Asp Gly Pro Gin Tyr His Ile Ala Pro Val Trp Ala Phe Tyr Leu Gin Ala
529 544 559 574 GCT TTC ATG GGC ACT GTC TTC CTT ATA GGG TTC CCA CTC AAT GCC ATG GTG CTG Ala Phe MET Gly Thr Val Phe Leu Ile Gly Phe Pro Leu Asn Ala MET Val Leu
589 604 619 GTG GCC ACA CTG CGC TAC AAA AAG TTG CGG CAG CCC CTC AAC TAC ATT CTG GTC Val Ala Thr Leu Arg Tyr Lys Lys Leu Arg Gin Pro Leu Asn Tyr Ile Leu Val
634 649 664 679 AAC GTG TCC TTC GGA GGC TTC CTC CTC TGC ATC TTC TCT GTC TTC CCT GTC TTC Asn Val Ser Phe Gly Gly Phe Leu Leu Cys Ile Phe Ser Val Phe Pro Val Phe
694 709 724 739 GTC GCC AGC TGT AAC GGA TAC TTC GTC TTC GGT CGC CAT GTT TGT GCT TTG GAG Val Ala Ser Cys Asn Gly Tyr Phe Val Phe Gly Arg His Val Cys Ala Leu Glu
GTACTGCAGG... Intron 1 ...TTCACCACAG I
754 1 769 784 GGC TTC CTG GGC ACT GTA GCA GGT CTG GTT ACA GGA TGG TCA CTG GCC TTC CTG Gly Phe Leu Gly Thr Val Ala Gly Leu Val Thr Gly Trp Ser Leu Ala Phe Leu
Fig. 2. Sequence of the blue pigment gene. The locations of the four introns are indicated above the contiguous coding sequence. The boxed nucleotides at positions 376 to 380 and 1490 to 1495 demarcate the Goldberg-Hogness (TATA) box (26) and the polyadenylation signal (27), respectively. The cDNA clone hs36 extends from nt 651 to 1490, and hs37 extends from nt 412 to 1510, with an additional 20 adenosine residues starting downstream from nt 1510. Intron lengths are: intron 1, 285 bp; intron 2, 322 bp; intron 3, 606 bp; intron 4, 987 bp. The length of the gene from its mRNA start site (nt 403) to its polyadenylation site (nt 1510) is therefore 3308 bp.
II APRIL I986
transmembrane segments, as has been predicted for human and bovine rhodopsins (Fig. 3) (5-8).
To test whether this genomic DNA segment represents a bonafide cone pigment gene we examined human retinas obtained at autopsy for messenger RNA (mRNA) products derived from it. To that end, we constructed a cDNA library synthesized from human retina mRNA and screened it for clones with sequence homology to the first of the five putative exons. The structures of two cDNA clones isolated from this library are shown in Fig. 1C. These two cDNA's confirm the intron-exon structure proposed on the basis of sequence homology with rhodopsin and demonstrate that RNA molecules derived from this gene are present in the human retina. These cDNA clones represent only one part in 30,000 in the human retina cDNA library, a frequency 150 times lower than that which we observe for cDNA clones derived from rhodopsin mRNA. This ratio corre- sponds roughly to the ratio of blue cones to rods, estimated at approximately I to 200, and is somewhat lower than the ratio of red or green cones to rods, estimated at approximately I to 30 (9). The
799 814 829 844 GCC TTT GAG CGC TAC ATT GTC ATC TGT AAG CCC TTC GGC AAC TTC CGC TTC AGC Ala Phe Glu Arg Tyr Ile Val Ile Cys Lys Pro Phe Gly Asn Phe Arg Phe Ser
859 874 889 TCC AAG CAT GCA CTG ACG GTG GTC CTG GCT ACC TGG ACC ATT GGT ATT GGC GTC Ser Lys His Ala Leu Thr Val Val Leu Ala Thr Trp Thr Ile Gly Ile Gly Val
g GTGAGAGTGC... Intron 2 ...TCCTTTGCAGI
904 919 | 934 949 TCC ATC CCA CCC TTC TTT GGC TGG AGC CGG TTC ATC CCT GAG GGC CTG CAG TGT Ser Ile Pro Pro Phe Phe Gly Trp Ser Arg Phe Ile Pro Glu Gly Leu Gin Cys
964 979 994 1009 TCC TGT GGC CCT GAC TGG TAC ACC GTG GGC ACC AAA TAC CGC AGC GAG TCC TAT Ser Cys Gly Pro Asp Trp Tyr Thr Val Gly Thr Lys Tyr Arg Ser Glu Ser Tyr
1024 1039 1054 ACG TGG TTC CTC TTC ATC TTC TGC TTC ATT GTG CCT CTC TCC CTC ATC TGC TTC Thr Trp Phe Leu Phe Ile Phe Cys Phe Ile Val Pro Leu Ser Leu Tie Cys Phe
GTGAGTGGCA... Intron 3 .. .TCCACCCCAG I
1069 1084 11099 1114 TCC TAG ACT CAG CTG CGl AGG GCC CTG AAA GCT GTT GCA GCT CAG CAG CAG GAG Ser Tyr Thr Gin Leu Leu Arg Ala Leu Lys Ala Val Ala Ala Gin Gin Gin Glu
1129 1144 1159 TCA GCT ACG ACC CAG AAG GCT GAA CGG GAG GTG AGC CGC ATG GTG GTT GTG ATG Ser Ala Thr Thr Gln Lys Ala Glu Arg Glu Val Ser Arg MET Val Val Val MET
1174 1189 1204 1219 GTA GGA TCC TTC TGT GTC TGC TAC GTG CCC TAC GCG GCC TTC GCC ATG TAC ATG Val Gly Ser Phe Cys Val Cys Tyr Val Pro Tyr Ala Ala Phe Ala MET Tyr MET
1234 1249 1264 1279 GTC AAC AAC CGT AAC CAT GGG CTG GAC TTA CGG CTT GTC ACC ATT CCT TCA TTC Val Asn Asn Arg Asn His Gly Leu Asp Leu Arg Leu Val Thr Ile Pro Ser Phe
1294 1309 1324 TTC TCC AAG AGT GCT TGC ATC TAC AAT CCC ATC ATC TAC TGC TTC ATG AAT AAG Phe Ser Lys Ser Ala Cys Ile Tyr Asn Pro Ile Ile Tyr Cys Phe MET Asn Lvs
GTAAAGCTCT... Intron 4 ...TTCTCTCCAG I
339 1354 1369 1384 CAG TTC CAA GCT TGC ATC ATG AAG ATG GTG TGT GGG AAG GCC ATG ACA GAT GAA Gln Phe Giln Ala Cys Ile MET Lys MET Val Cys Gly Lys Ala MET Thr Asp Glu
1399 1414 1429 TCC GAC ACA TGC AGC TCC CAG AAA ACA GAA GTT TCT ACT GTC TCG TCT ACC CAA Ser Asp Thr Cys Ser Ser Gln Lys Thr Glu Val Ser Thr Val Ser Ser Thr Gin
1444 1466 1476 1486 11406 1506 GTT GGC CCC AAC TGA GGACCCAATA TTGGCCTGTT TGCAACAGCT AGApTTAAA TTTACTTTTA Val Gly Pro Asn
1516 1526 1536 1546 1556 1566 1576 AGTAAGTTTC TATTGTCTCC GTCAGAAACC AAACTACTAA AAACACAAAA AAGATGGTAA AAGGAGTGAT
1586 1596 1606 1616 1626 1636 1646 GGCAGTTTGG GGAGTCAATT TTTCATTTTC TTACTATTGC CTTCTTGCCT ACAAAGCTAC TGTTTCCACT
1656 1666 1676 1686 1696 GGTCTATTTC AGACCACCCA AAGGCCATTT CAACAATCAT CAGTTTCTAC TCCT
RESEARCH ARTICLES 195

Fig. 3 (left). Kyte and Doolittle (31) hydropathy plot of the four human visual pigments. Each point on the curve represents the average hydrop- athy across a 21-amino-acid window centered at that position. The four curves have been aligned to optimize their sequence homology. Bars at the top demarcate the homologous regions of bovine rhodopsin predicted by Hargrave et al. (7) to reside within the hydrophobic part of the mem- brane. Similar predictions have been made by Ovchinnikov et al. (8) and Nathans and Hogness (5). Increasing hydropathy is downward. Fig. 4 (right). Analysis of the 5' end of the blue pigment gene. The autoradiographs of each gel contain a Maxam-Gilbert sequence ladder (23) of an Nco I-Sal I fragment derived from gJHN11 (Fig. 1) that was labeled at the 5' end with 32P at the Nco I site (nt 567 to 572) (Fig. 2). This fragment encompasses the 5' half of exon I and 2 kb of upstream sequences. (lanes I and 2) Prod- ucts of cDNA extension by reverse transcriptase of a 5' end-labeled (with 32p) synthetic 20-nt probe after hybridization to 4 ,u g of human retina polysomal poly(A)+ RNA (lane 1) or 4 p-g of yeast transfer RNA (tRNA) (lane 2). The se- quence of this 20-nt fragment corresponds to residues 552 to 571 of the noncoding strand of the blue pigment gene; that is, its 5' end is at the point of cleavage of the above-mentioned Nco I site. (lanes 3 and 4) Products of SI nuclease
AC A C GG TC 3 4
cDNA S1
3'
I ! I
I
3' 5'
I 5'
digestion after hybridization of the above 5' end- labeled Nco I-Sal I fragment to 4 ptg of human retina polysomal poly(A)+ RNA (lane 3) or 4 pug of yeast transfer RNA (lane 4). The details of the methods have been described (28). The RNA and DNA strands are represented in the diagram by wiggly and straight lines, respectively, with the
5'
asterisk indicating the position of the 32p label. The single product of cDNA extension is pre- sumed to represent the exact 5' end, whereas the microheterogeneity of the SI nuclease digestion product is presumed to represent "nibbling" near the end of the RNA-DNA hybrid.
E B B BE H B H E E
L4kbJi I I I 'N i I I GREEN2
L 1 kbJ
i I gJHN42 i I gJHN35
I i gJHN41 i I gJHN40
I II igJHN9
\ B E H
3 4 5
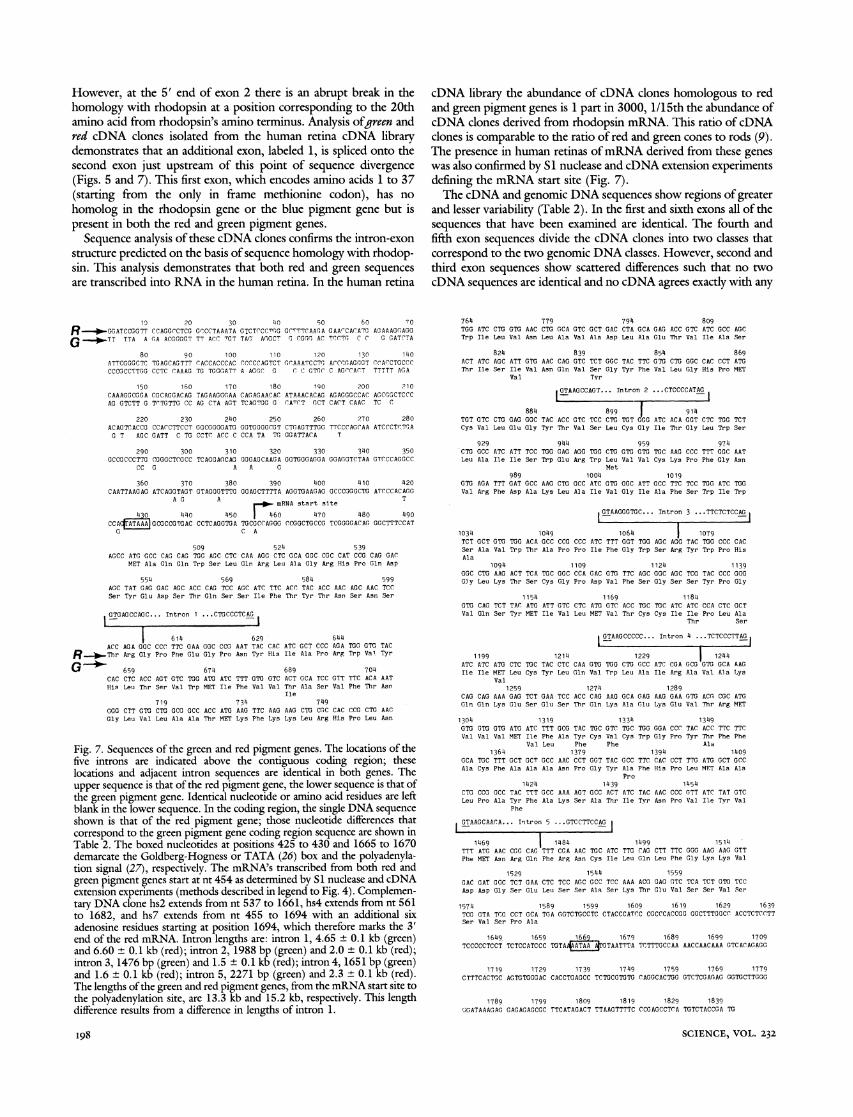
Fig. 5. Structures of the green and red pigment genes. The representations in Fig. 1 are the same as those used here (S, Sal I). (A and B) Nearly identicalgreen-1 andgreen-2 genes, respectively, defined by the recombinants shown beneath them. Ten other independent overlapping recombinants derived from these two loci are not shown. Cloned segments gJHN9 and gJHN21 were isolated in the low stringency hybridization (legend to Fig. 1). The other recombinants were isolated from the same library with parts of these first two used as probes. (C) The red gene is defined by two recombinants. (i) gJHN33 was derived from a library of gel- fractionated fragments after complete Hind III digestion of the J.N. genomic DNA cloned into X762 (29) and was identified by its hybridization with a probe from gJHN9 encompassing the second exon. (ii) gJHN53 was obtained from a library of gel-fractionated Eco RI fragments of (J.N.) DNA cloned into X607 (25) and identified by its hybridiza- tion with a cDNA clone probe from hs4 encompassing exons 3 to 6. Our inability to obtain clones derived from the red pigment gene with the vector [\ EMBL3 (30)] used to clone the green pigment genes is curious and unexplained. Only part of the sequence of the green-i gene was determined. Probes from the second exon ofgreen-2 were used to isolate cDNA clones from the human retina cDNA library (legend to Fig. 1). The nucleotide sequences of three clones were determined: hs2, derived from agreen mRNA, and hs4 and hs7, derived from red mRNA's. A small tract of six adenosine residues (A6) at the 3' end of hs7 defines the 3' end of the gene.
B L4 kbJ
E B B BE H B H E E
I 111K \1 i l GREEN1
'I ) q~~I JHN43
~~~- ,i ~~~~~gJH N 44 / ~~~~ g~ gJHN50
- ~~ ~~~~~~~~~~~I gJHN21
E - N 4/ /8BE H B 5' b V 1
2 3 4 5 6
C
B N 5' - -
HS B B B B E H B H E
L4 kbJ I(V I I i 'N I RED
L 1 kb-i
B
I
-J- I JHN33 I gJHN53
B B\\ E H-
2 3 4 5
3' B
6
SCIENCE, VOL. 232
A
5
1
..F-
...F-
I - - - A6 hs7 -- - - - - -- -- --- - - ---- - - - - --- --- -- 1-
- " -- I --- - -
hs4
i96
presence in human retinas of mRNA derived from this gene was also confirmed by SI nuclease and cDNA extension analyses defining the mRNA start site (Fig. 4).
Which of the three cone pigments does this gene encode? We show in the accompanying article (4) that it derives from human chromosome 7, whereas the rhodopsin gene derives from chromo- some 3 and all of the other human cone pigment genes (described below) derive from the human X chromosome. It is well established that the loci responsible for inherited variations in the red and green mechanisms are X-linked, whereas variations in the blue mechanism are inherited in an autosomal fashion (10). The X-linked genes encode red and green pigments because they are specifically altered in individuals deficient in the red and green mechanisms (4). By elimination, then, the gene described here should encode the blue pigment. Henceforth, we refer to this gene as the blue pigment gene.
The red and green pigment genes. We turn here to the two members of the third class of clones isolated as a result of their weak homology to the bovine rhodopsin probe. These clones were mapped to the distal portion of the q arm of the human X chromosome (4), a region known to encompass the loci responsible for inherited defects in the red and green mechanisms. We guessed, therefore, that these two clones were derived from either the red or green pigment genes. Given the close genetic linkage (less than 5 centimorgans) between the loci for red and green defects (10), these genes may have arisen from a recent duplication and hence could retain a high degree of sequence homology. Using probes derived from these two clones (gJHN9 and gJHN21), we isolated 18 more genomic clones some of which are shown in Fig. 5. All of the clones are highly homologous as judged by cross-hybridization experi- ments, and their nucleotide sequence analysis shows more than 98 percent identity. Despite this degree of homology these recombi- nants can be divided into three classes on the basis of minor
1 2 3 4
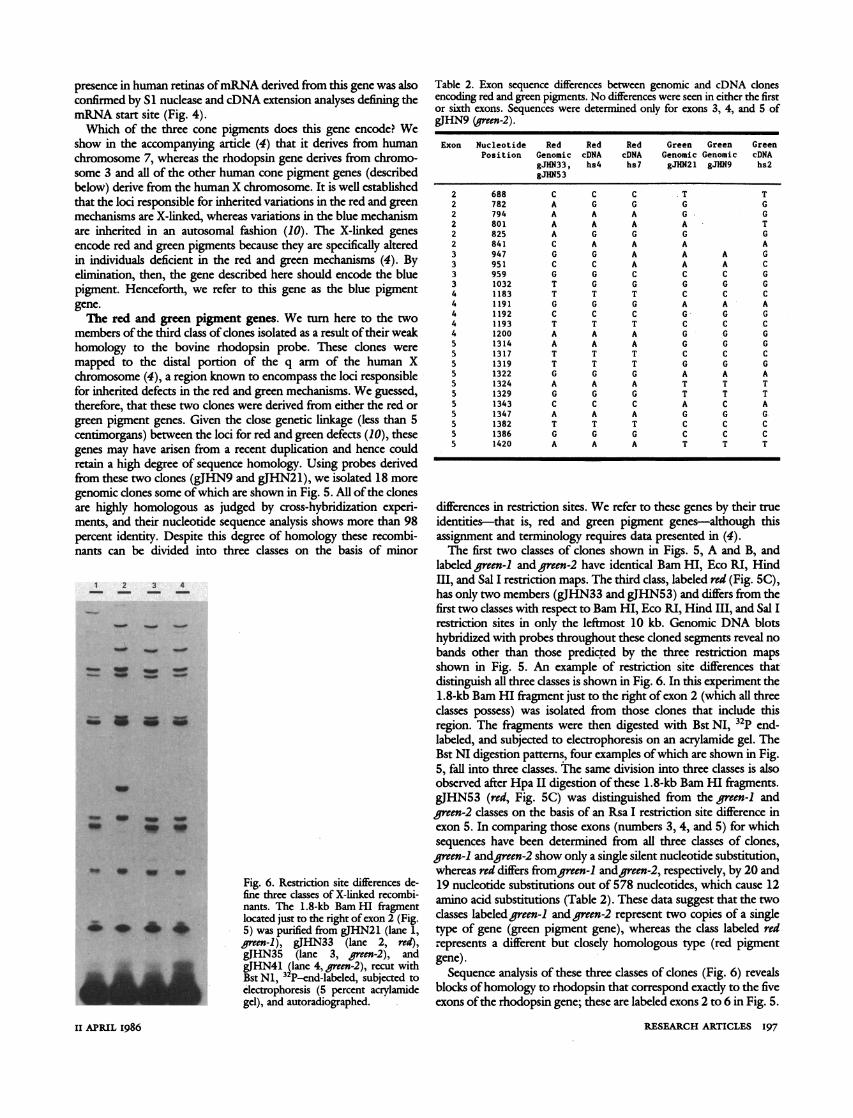
Fig. 6. Restriction site differences de- fine three classes of X-linked recombi- nants. The 1.8-kb Bam HI fragment located just to the right of exon 2 (Fig. 5) was purified from gJHN21 (lane 1, green-1), gJHN33 (lane 2, red), gJHN35 (lane 3, green-2), and gJHN41 (lane 4, green-2), recut with Bst Ni, 32P-end-labeled, subjected to electrophoresis (5 percent acrylamide gel), and autoradiographed.
Table 2. Exon sequence differences between genomic and cDNA clones encoding red and green pigments. No differences were seen in either the first or sixth exons. Sequences were determined only for exons 3, 4, and 5 of gJHN9 (green-2).
Exon Nucleotide Red Red Red Green Green Green Position Genomic cDNA cDNA Genomic Genomic cDNA
gJHN33, hs4 hs7 gJHN21 gJHN9 hs2 gJ-HN53
2 688 c c C T T 2 782 A G. G G G 2 794 A A A G G 2 801 A A A A T 2 825 A G G G G 2 841 C A A A A 3 947 G G A A A G 3 951 C C A A A C 3 959 G G c c C G 3 1032 T G G G G G 4 1183 T T T C C C 4 1191 G G G A A A 4 1192 C C C G G G 4 1193 T T T C C C 4 1200 A A A G G G 5 1314 A A A G G G 5 1317 T T T C C C 5 1319 T T T G G G 5 1322 G G G A A A 5 1324 A A A T T T 5 1329 G G G T T T 5 1343 C C C A C A 5 1347 A A A G G G 5 1382 T T T C C C 5 1386 G G G C C C 5 1420 A A A T T T
differences in restriction sites. We refer to these genes by their true identities-that is, red and green pigment genes-although this assignment and terminology requires data presented in (4).
The first two classes of clones shown in Figs. 5, A and B, and labeled green-i and green-2 have identical Bam HI, Eco RI, Hind III, and Sal I restriction maps. The third class, labeled red (Fig. 5C), has only two members (gJHN33 and gJHN53) and differs from the first two classes with respect to Barn HI, Eco RI, Hind III, and Sal I restriction sites in only the leftmost 10 kb. Genomic DNA blots hybridized with probes throughout these cloned segments reveal no bands other than those predicted by the three restriction maps shown in Fig. 5. An example of restriction site differences that distinguish all three classes is shown in Fig. 6. In this experiment the 1.8-kb Bam HI fragment just to the right of exon 2 (which all three classes possess) was isolated from those clones that include this region. The fragments were then digested with Bst NI, 32P end- labeled, and subjected to electrophoresis on an acrylamide gel. The Bst NI digestion patterns, four examples of which are shown in Fig. 5, fall into three classes. The same division into three classes is also observed after Hpa II digestion of these 1.8-kb Bam HI fragments. gJHN53 (red, Fig. 5C) was distinguished from the green-I and green-2 classes on the basis of an Rsa I restriction site difference in exon 5. In comparing those exons (numbers 3, 4, and 5) for which sequences have been determined from all three classes of clones, green-I andgreen-2 show only a single silent nucleotide substitution, whereas red differs fromgreen-I andgreen-2, respectively, by 20 and 19 nucleotide substitutions out of 578 nucleotides, which cause 12 amino acid substitutions (Table 2). These data suggest that the two classes labeled green-i and green-2 represent two copies of a single type of gene (green pigment gene), whereas the class labeled red represents a different but closely homologous type (red pigment gene).
Sequence analysis of these three classes of clones (Fig. 6) reveals blocks of homology to rhodopsin that correspond exactly to the five exons of the rhodopsin gene; these are labeled exons 2 to 6 in Fig. 5.
RESEARCH ARTICLES 197 II APRIL I986
However, at the 5' end of exon 2 there is an abrupt break in the homology with rhodopsin at a position corresponding to the 20th amino acid from rhodopsin's amino terminus. Analysis ofgreen and red cDNA clones isolated from the human retina cDNA library demonstrates that an additional exon, labeled 1, is spliced onto the second exon just upstream of this point of sequence divergence (Figs. 5 and 7). This first exon, which encodes amino acids I to 37 (starting from the only in frame methionine codon), has no homolog in the rhodopsin gene or the blue pigment gene but is present in both the red and green pigment genes.
Sequence analysis of these cDNA clones confirms the intron-exon structure predicted on the basis of sequence homology with rhodop- sin. This analysis demonstrates that both red and green sequences are transcribed into RNA in the human retina. In the human retina
10 20 30 40 50 60 70
R ? - GGATCCGGTT CCAGGCCTCG GCCCTAAATA GTCTCCr,G GGCTTCAAGA GAA8CACATG AGAAAGGAGG
G TT TTA A GA ACGGGGT TT ACC TGT TAG AGGCT G CGGO AC TCCTG C C G GATCTA
80 90 100 110 120 130 140 ATTCGGGCTC TGAGCAGTTT CACCACCCAC CCCCCAGTCT GCAAATCCTG ACCCOAGGGT CCACCTGCCC C CC CTC CAAAG TG TGGGCCTTGG CC TC C AAAG TG TGGGATT AGGC G C C GTGC C AGrCACT TTTTT AGA
150 160 170 180 190 200 210 CAAAGGCGGA CGCAGGACAG TAGAAGGGAA CAGAGAACAC ATAAACACAG AGAGGGCCAC AGCGGCTCCC AG GTCTT G TCTGTTG CC AG CTA AGT TCAGTGG G CATCT GCT CACT CAAC TC C
220 230 240 250 260 270 280 ACAGTCACCG CCACCTTCCT GGCGGGGATG GGTGGGGCGT CTGAGTTTGG TTCCCAGCAA ATCCCTCTGA
G T AGC GATT C TG CCTC ACC C CCA TA TG GGATTACA T
290 300 310 320 330 340 350 GCCGCCCTTG CGGGCTCGCC TCAGGACAG GGGAGCAAGA GGGGAGG GGTGAGA GGAGGTCTAA GTCCCAGGCC
CC G A A G
360 370 380 390 400 410 420 CAATTAAGAG ATCAGGTAGT GTAGGGTTTG GGAGCTTTTA AGGTGAAGAG GCCCGGGCTG ATCCCACAGG
8A A
-"o- mRNA start site
430 440 450 f 460 470 480 490 CCAG 0ATAAA GCGCCGTGAC CCTCAGGTGA TGCGCCAGGG CCGGCTGCCG TCGGGGACAG GGCTTTCCAT
G C A
509 524 539 AGCC ATG GCC CAG CAG TGG AGC CTC CAA AGG CTC GCA GGC CGC CAT CCG CAG GAC
MET Ala Gln Gln Trp Ser Leu Gln Arg Leu Ala Gly Arg His Pro Gln Asp
554 569 584 599 AGC TAT GAG GAC AGC ACC CAG TCC AGC ATC TTC ACC TAC ACC AAC AGC AAC TCC Ser Tyr Glu Asp Ser Thr Gln Ser Ser Ile Phe Thr Tyr Thr Asn Ser Asn Ser
GTGAGCCAGC... Intron 1 ...CTGCCCTCAG
1 614 629 644 ACC AGA GGC CCC TTC GAA GGC CCG AAT TAC CAC ATC GCT CCC AGA TOG GTG TAC
R . Thr Arg Gly Pro Phe Glu Gly Pro Asn Tyr His Ile Ala Pro Arg Trp Val Tyr
G "~I~'
659 674 689 704 CAC CTC ACC AGT GTC TOG ATC ATC TTT GTG GTC ACT GCA TCC GTT TTC ACA AAT His Leu Thr Ser Val Trp MET Ile Phe Val Val Thr Ala Ser Val Phe Thr Asn
Ile 719 734 749
GGG CTT GTG CTG GCG GCC ACC ATG AAG TTC AAG AAG CTO CGC CAC CCG CTG AAC
Gly Leu Val Leu Ala Ala Thr MET Lys Phe Lys Lys Leu Arg His Pro Leu Asn
Fig. 7. Sequences of the green and red pigment genes. The locations of the five introns are indicated above the contiguous coding region; these locations and adjacent intron sequences are identical in both genes. The upper sequence is that of the red pigment gene, the lower sequence is that of the green pigment gene. Identical nucleotide or amino acid residues are left blank in the lower sequence. In the coding region, the single DNA sequence shown is that of the red pigment gene; those nucleotide differences that correspond to the green pigment gene coding region sequence are shown in Table 2. The boxed nucleotides at positions 425 to 430 and 1665 to 1670 demarcate the Goldberg-Hogness or TATA (26) box and the polyadenyla- tion signal (27), respectively. The mRNA's transcribed from both red and green pigment genes start at nt 454 as determined by S1 nuclease and cDNA extension experiments (methods described in legend to Fig. 4). Complemen- tary DNA clone hs2 extends from nt 537 to 1661, hs4 extends from nt 561 to 1682, and hs7 extends from nt 455 to 1694 with an additional six adenosine residues starting at position 1694, which therefore marks the 3' end of the red mRNA. Intron lengths are: intron 1, 4.65 ? 0.1 kb (green) and 6.60 ? 0.1 kb (red); intron 2, 1988 bp (green) and 2.0 ? 0.1 kb (red); intron 3, 1476 bp (green) and 1.5 ? 0.1 kb (red); intron 4, 1651 bp (green) and 1.6 ? 0.1 kb (red); intron 5, 2271 bp (green) and 2.3 ? 0.1 kb (red). The lengths of the green and red pigment genes, from the mRNA start site to the polyadenylation site, are 13.3 kb and 15.2 kb, respectively. This length difference results from a difference in lengths of intron 1.
cDNA library the abundance of cDNA clones homologous to red and green pigment genes is I part in 3000, 1/15th the abundance of cDNA clones derived from rhodopsin mRNA. This ratio of cDNA clones is comparable to the ratio of red and green cones to rods (9). The presence in human retinas of mRNA derived from these genes was also confirmed by SI nuclease and cDNA extension experiments defining the mRNA start site (Fig. 7).
The cDNA and genomic DNA sequences show regions of greater and lesser variability (Table 2). In the first and sixth exons all of the sequences that have been examined are identical. The fourth and fifth exon sequences divide the cDNA clones into two classes that correspond to the two genomic DNA classes. However, second and third exon sequences show scattered differences such that no two cDNA sequences are identical and no cDNA agrees exactly with any
764 779 794 809 TGG ATC CTG GTG AAC CTG GCA GTC GCT GAC CTA GCA GAG ACC GTC ATC GCC AGC Trp Ile Leu Val Asn Leu Ala Val Ala Asp Leu Ala Glu Thr Val Ile Ala Ser
824 839 854 869 ACT ATC AGC ATT GTG AAC CAG GTC TCT GGC TAC TTC GTG CTG GGC CAC CCT ATG Thr Ile Ser Ile Val Asn Gin Val Ser Gly Tyr Phe Val Leu Gly His Pro MET
Val Tyr
IGTAAGCCAGT... Intron 2 ...CTCCCCATAG
884 899 1 914 TGT GTC CTG GAG GGC TAC ACC GTC TCC CTG TGT GGG ATC ACA GGT CTC TGG TCT Cys Val Leu Glu Gly Tyr Thr Val Ser Leu Cys Gly Ile Thr Gly Leu Trp Ser
929 944 959 974 CTG GCC ATC ATT TCC TGG GAG AGG TGG CTG GTG GTG TGC AAG CCC TTT GGC AAT Leu Ala Ile Ile Ser Trp Glu Arg Trp Leu Val Val Cys Lys Pro Phe Gly Asn
Met 989 1004 1019
GTG AGA TTT GAT GCC AAG CTG GCC ATC GTG GGC ATT GCC TTC TCC TGG ATC TGG Val Arg Phe Asp Ala Lys Leu Ala Ile Val Gly Ile Ala Phe Ser Trp Ile Trp
GTAAGGGTGC... Intron 3 ...TTCTCTCCAG
1034 1049 1064 1 1079 TCT GCT GTC TGG ACA GCC CCG CCC ATC TTT GGT TGG AGC AGG TAC TOG CCC CAC Ser Ala Val Trp Thr Ala Pro Pro Ile Phe Gly Trp Ser Arg Tyr Trp Pro His Ala
1094 1109 1124 1139 GGC CTG AAG ACT TCA TGC GGC CCA GAC GTG TTC AGC GGC AGC TCG TAC CCC GGG G] y Leu Lys Thr Ser Cys Gly Pro Asp Val Phe Ser Gly Ser Ser Tyr Pro Gly
1154 1169 1184 GTG CAG TCT TAC ATG ATT GTC CTC ATG GTC ACC TGC TGC ATC ATC CCA CTC GCT Val Giln Ser Tyr MET Ile Val Leu MET Val Thr Cys Cys Ile Ile Pro Leu Ala
Thr Ser
GTAAGCCCCC... Intron 4 ... TCTCCCTTAG
1199 1214 1229 1 1244 ATC ATC ATG CTC TGC TAC CTC CAA GTG TGG CTG GCC ATC CGA GCG GTG GCA AAG Ile Ile MET Leu Cys Tyr Leu Giln Val Trp Leu Ala Ile Arg Ala Val Ala Lys
Val 1259 1274 1289
CAG CAG AAA GAG TCT GAA TCC ACC CAG AAG GCA GAG AAG GAA GTG ACG CGC ATG Gin Gin Lys Glu Ser Glu Ser Thr Gln Lys Ala Glu Lys Glu Val Thr Arg MET
1304 1319 1334 1349 GTG GTG GTG ATG ATC TTT GCG TAC TGC GTC TGC TGG GGA CCC TAC ACC TTC TTC Val Val Val MET Ile Phe Ala Tyr Cys Val Cys Trp Gly Pro Tyr Thr Phe Phe
Val Leu Phe Phe Ala 1364 1379 1394 1409
GCA TGC TTT GCT GCT GCC AAC CCT GGT TAC GCC TTC CAC CCT TTG ATG GCT GCC Ala Cys Phe Ala Ala Ala Asn Pro Gly Tyr Ala Phe His Pro Leu MET Ala Ala
Pro 1424 1439 1454
CTG CCG GCC TAC TTT GCC AAA AGT GCC ACT ATC TAC AAC CCC GTT ATC TAT GTC Leu Pro Ala Tyr Phe Ala Lys Ser Ala Thr Ile Tyr Asn Pro Val lie Tyr Val
Phe
GTAAGCAACA... Intron 5 ...GTCCTTCCAG I
1469 1 1484 1499 1514 TTT ATG AAC CGG CAG TTT CGA AAC TGC ATC TTG CAG CTT TTC GGG AAG AAG GTT Phe MET Asn Arg Gln Phe Arg Asn Cys Ile Leu Gln Leu Phe Gly Lys Lys Val
1529 1544 1559 GAC GAT GGC TCT GAA CTC TCC AGC GCC TCC AAA ACG GAG GTC TCA TCT GTC TCC
Asp Asp Gly Ser Glu Leu Ser Ser Ala Ser Lys Thr Glu Val Ser Ser Val Ser
1574 1589 1599 1609 1619 1629 1639 TCG GTA TCG CCT GCA TGA GGTCTGCCTC CTACCCATCC CGCCCACCGG GGCTTTGGCC ACCTCTCCTT Ser Val Ser Pro Ala
1649, 1659 1669 1679 1689 1699 1709 TCCCCCTCCT TCTCCATCCC TGTA AATTAA TTTA TCTTTGCCAA AACCAACAAA GTCACAGAGG
1719 1729 1739 1749 1759 1769 1779 CTTTCACTGC AGTGTCGGAC CACCTGAGCC TCTGCGTGTO CAGGCACTGG GTCTCGA(AG GGTGCTTGGG
1789 1799 1809 1819 1829 1839 GGATAAAGAG GAGAGAGCGC TTCATAGACT TTAAGTTTTC CCGAGCCTCA TGTCTACCGA TG
SCIENCE, VOL. 232 198
genomic DNA sequence. Because the cDNA clones were produced from an mRNA population prepared from several dozen retinas, we ascribe these differences to polymorphism.
We have grouped together gJHN33 and gJHN53 as two parts of a single gene even though they overlap for only 43 bp (Fig. 5C). This assignment rests not only on the finding of differences that distinguish them from green-1 and green-2 clones, but also on the observation that different color normal individuals always have a constant stoichiometry of fragments corresponding to gJHN33 and gJHN53. As discussed below, green pigment genes vary in number from one individual to the next and in each case the variation is limited to those fragments corresponding to thegreen-I andgreen-2 restriction maps. Furthermore, as we have shown in (4), six different G-R+ dichromats (G-, absent green sensitivity; R+, normal red sensitivity) are missing all of the material corresponding to the green-l andgreen-2 restriction maps but retain that corresponding to the red restriction map with the normal fragment stoichiometry.
Like the blue pigment, the red and green pigments can be aligned with rhodopsin without any insertions or deletions. They also share about the same degree of homology with rhodopsin as does the blue pigment (Table 1) and their hydropathy plots define the same set of maxima and minima (Fig. 3).
Variations in gene number. All of the genomic clones studied derive from the DNA of a phenotypically normal male (J.N.). Therefore, the three classes of clones defining the green-1, green-2, and red genes must derive from a single X chromosome. A priori we would have expected only two X-linked visual pigment genes-one encoding the red pigment and one the green pigment. The surpris- ing finding of three genes led us to ask whether other X chromo- somes had the same or different numbers of genes. A set of three genomic DNA blots in which various restriction enzymes and
E B B BEH B
I?A L_A I 0?I0 D ? Green 1 2 3 4 5 6
Ag BeI
C H-AI
Dg H
1 kb-I
EHS B B B BEH B
1 2 3 4 5 6
Arl I
Br DrH
Cr - -
B 1 2 4 3 5 6 7 8 9 1011121314
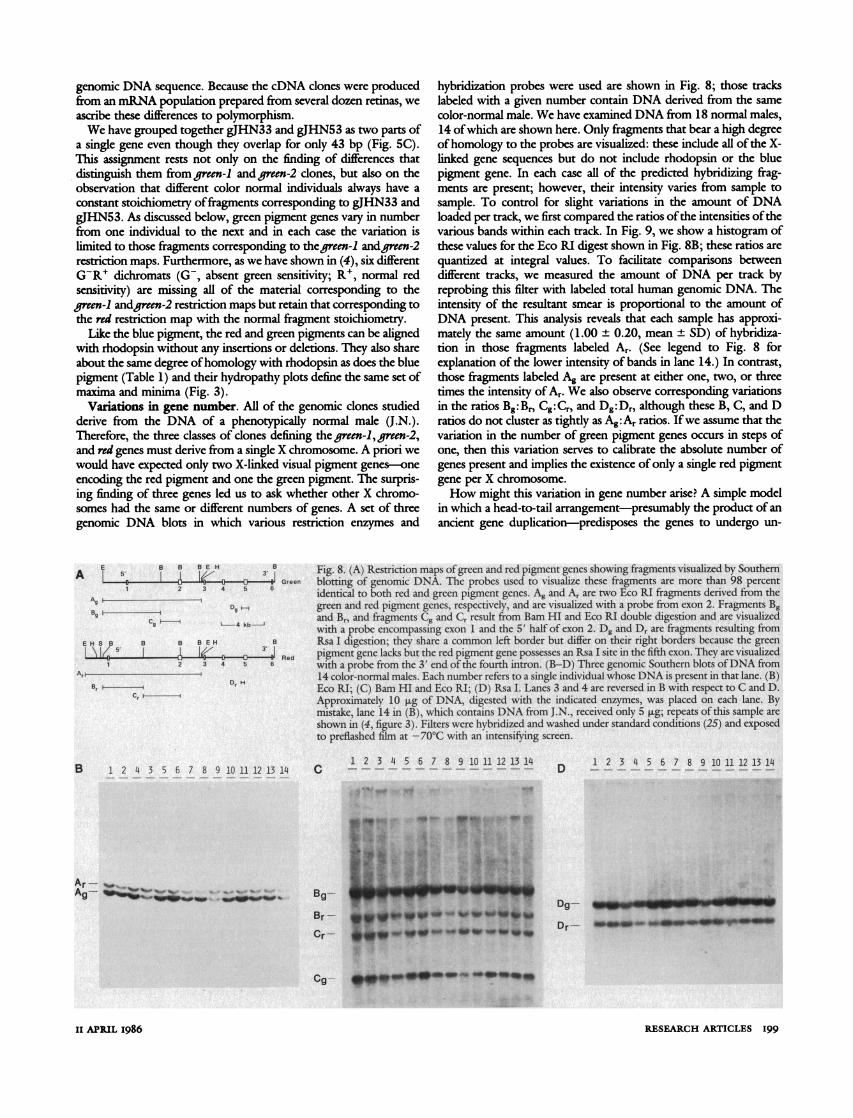
hybridization probes were used are shown in Fig. 8; those tracks labeled with a given number contain DNA derived from the same color-normal male. We have examined DNA from 18 normal males, 14 of which are shown here. Only fragments that bear a high degree of homology to the probes are visualized: these include all of the X- linked gene sequences but do not include rhodopsin or the blue pigment gene. In each case all of the predicted hybridizing frag- ments are present; however, their intensity varies from sample to sample. To control for slight variations in the amount of DNA loaded per track, we first compared the ratios of the intensities of the various bands within each track. In Fig. 9, we show a histogram of these values for the Eco RI digest shown in Fig. 8B; these ratios are quantized at integral values. To facilitate comparisons between different tracks, we measured the amount of DNA per track by reprobing this filter with labeled total human genomic DNA. The intensity of the resultant smear is proportional to the amount of DNA present. This analysis reveals that each sample has approxi- mately the same amount (1.00 + 0.20, mean + SD) of hybridiza- tion in those fragments labeled Ar. (See legend to Fig. 8 for explanation of the lower intensity of bands in lane 14.) In contrast, those fragments labeled Ag are present at either one, two, or three times the intensity of Ar. We also observe corresponding variations in the ratios Bg:Br, Cg:Cr, and Dg:Dr, although these B, C, and D ratios do not cluster as tightly as Ag: Ar ratios. If we assume that the variation in the number of green pigment genes occurs in steps of one, then this variation serves to calibrate the absolute number of genes present and implies the existence of only a single red pigment gene per X chromosome.
How might this variation in gene number arise? A simple model in which a head-to-tail arrangement-presumably the product of an ancient gene duplication-predisposes the genes. to undergo un-
Fig. 8. (A) Restriction maps of green and red pigment genes showing fragments visualized by Southern blotting of genomic DNA. The probes used to visualize these fragments are more than 98 percent identical to both red and green pigment genes. Ag and Ar are two Eco RI fragments derived from the green and red pigment genes, respectively, and are visualized with a probe from exon 2. Fragments Bg and Br, and fragments Cg and Cr result from Bam HI and Eco RI double digestion and are visualized with a probe encompassing exon I and the 5' half of exon 2. Dg and Dr are fragments resulting from Rsa I digestion; they share a common left border but differ on their right borders because the green pigment gene lacks but the red pigment gene possesses an Rsa I site in the fifth exon. They are visualized with a probe from the 3' end of the fourth intron. (B-D) Three genomic Southern blots of DNA from 14 color-normal males. Each number refers to a single individual whose DNA is present in that lane. (B) Eco RI; (C) Bam HI and Eco RI; (D) Rsa I. Lanes 3 and 4 are reversed in B with respect to C and D. Approximately 10 pg of DNA, digested with the indicated enzymes, was placed on each lane. By mistake, lane 14 in (B), which contains DNA from J.N., received only 5 ,ug; repeats of this sample are shown in (4, figure 3). Filters were hybridized and washed under standard conditions (25) and exposed to preflashed film at -70?C with an intensifying screen.
1 2 3 4 5 6 7 8 9 10 11 12 13 14 1 2 3 4 5 6 7 8 9 1011 12 13 14
Bg- ? ? ? ?
Cg-- i ':::*
RESEARCH ARTICLES 199 II APRIL i986
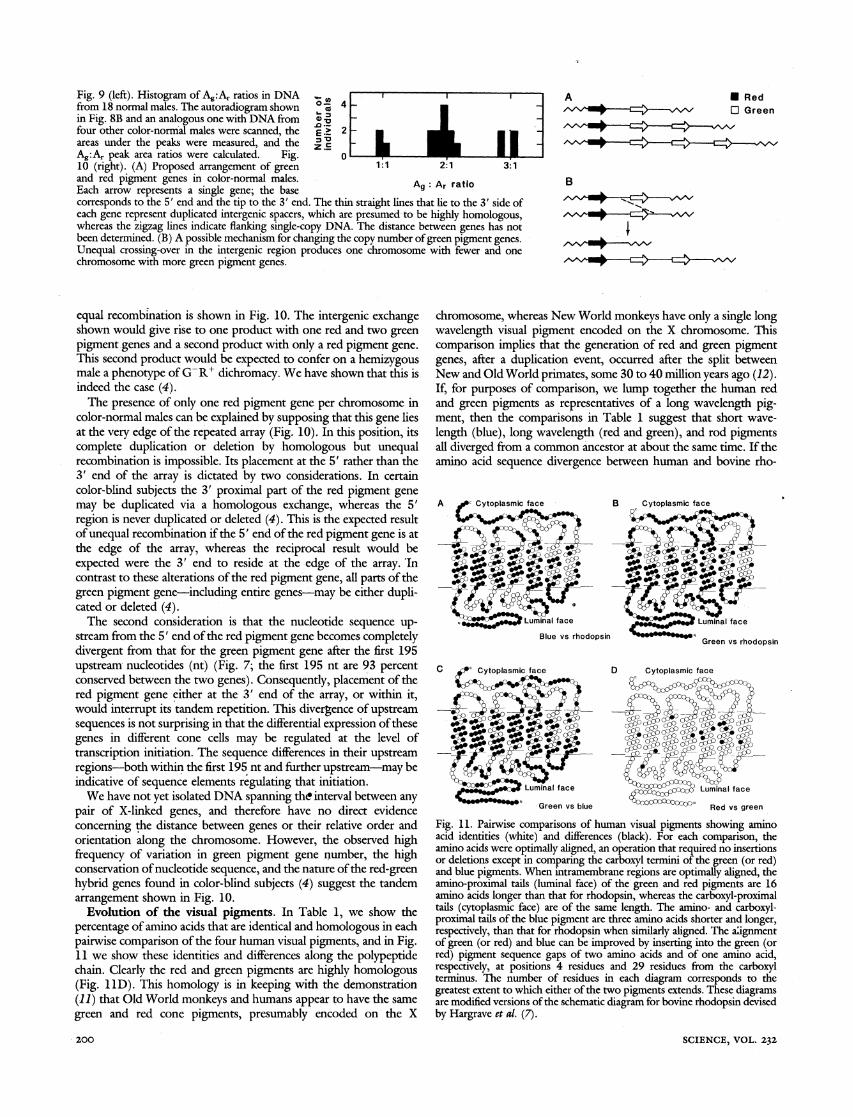
Fig. 9 (left). Histogram of Ag:Ar ratios in DNA 4 i , from 18 normal males. The autoradiogram shown 0 X 4 -
in Fig. 8B and an analogous one with DNA from x i four other color-normal males were scanned, the g > 2 - areas under the peaks were measured, and the - Ag:Ar peak area ratios were calculated. Fig. o 0 10 (right). (A) Proposed arrangement of green 1:1 2:1 3:1 and red pigment genes in color-normal males.Ar ratio Each arrow represents a single gene; the base corresponds to the 5' end and the tip to the 3' end. The thin straight lines that lie to the 3' side of each gene represent duplicated intergenic spacers, which are presumed to be highly homologous, whereas the zigzag lines indicate flanking single-copy DNA. The distance between genes has not been determined. (B) A possible mechanism for changing the copy number of green pigment genes. Unequal crossing-over in the intergenic region produces one chromosome with fewer and one chromosome with more green pigment genes.
equal recombination is shown in Fig. 10. The intergenic exchange shown would give rise to one product with one red and two green pigment genes and a second product with only a red pigment gene. This second product would be expected to confer on a hemizygous male a phenotype of G-R+ dichromacy. We have shown that this is indeed the case (4).
The presence of only one red pigment gene per chromosome in color-normal males can be explained by supposing that this gene lies at the very edge of the repeated array (Fig. 10). In this position, its complete duplication or deletion by homologous but unequal recombination is impossible. Its placement at the 5' rather than the 3' end of the array is dictated by two considerations. In certain color-blind subjects the 3' proximal part of the red pigment gene may be duplicated via a homologous exchange, whereas the 5' region is never duplicated or deleted (4). This is the expected result of unequal recombination if the 5' end of the red pigment gene is at the edge of the array, whereas the reciprocal result would be expected were the 3' end to reside at the edge of the array. In contrast to these alterations of the red pigment gene, all parts of the green pigment gene-including entire genes-may be either dupli- cated or deleted (4).
The second consideration is that the nucleotide sequence up- stream from the 5' end of the red pigment gene becomes completely divergent from that for the green pigment gene after the first 195 upstream nucleotides (nt) (Fig. 7; the first 195 nt are 93 percent conserved between the two genes). Consequently, placement of the red pigment gene either at the 3' end of the array, or within it, would interrupt its tandem repetition. This divergence of upstream sequences is not surprising in that the differential expression of these genes in different cone cells may be regulated at the level of transcription initiation. The sequence differences in their upstream regions-both within the first 195 nt and further upstream-may be indicative of sequence elements regulating that initiation.
We have not yet isolated DNA spanning the interval between any pair of X-linked genes, and therefore have no direct evidence concerning the distance between genes or their relative order and orientation along the chromosome. However, the observed high frequency of variation in green pigment gene number, the high conservation of nucleotide sequence, and the nature of the red-green hybrid genes found in color-blind subjects (4) suggest the tandem arrangement shown in Fig. 10.
Evolution of the visual pigments. In Table 1, we show the percentage of amino acids that are identical and homologous in each pairwise comparison of the four human visual pigments, and in Fig. 11 we show these identities and differences along the polypeptide chain. Clearly the red and green pigments are highly homologous (Fig. 11D). This homology is in keeping with the demonstration (11) that Old World monkeys and humans appear to have the same green and red cone pigments, presumably encoded on the X
chromosome, whereas New World monkeys have only a single long wavelength visual pigment encoded on the X chromosome. This comparison implies that the generation of red and green pigment genes, after a duplication event, occurred after the split between New and Old World primates, some 30 to 40 million years ago (12). If, for purposes of comparison, we lump together the human red and green pigments as representatives of a long wavelength pig- ment, then the comparisons in Table 1 suggest that short wave- length (blue), long wavelength (red and green), and rod pigments all diverged from a common ancestor at about the same time. If the amino acid sequence divergence between human and bovine rho-
A pPc Cytoplasmic face B Cytoplasmic face
{.ee ^ ^Luminal face Luminal face
Blue vs rhodopsin Green vs rhodopsin Green vs rhodopsin
C o jc Cytoplasmic face
Luminal face
_ _ -Green vs blue
_^- (^0^ ~l S_o_o _
' *** ~~Green vs blue
D Cytoplasmic face
Luminal face
Red vs green
Fig. 11. Pairwise comparisons of human visual pigments showing amino acid identities (white) and differences (black). For each comparison, the amino acids were optimally aligned, an operation that required no insertions or deletions except in comparing the carboxyl termini of the green (or red) and blue pigments. When intramembrane regions are optimally aligned, the amino-proximal tails (luminal face) of the green and red pigments are 16 amino acids longer than that for rhodopsin, whereas the carboxyl-proximal tails (cytoplasmic face) are of the same length. The amino- and carboxyl- proximal tails of the blue pigment are three amino acids shorter and longer, respectively, than that for rhodopsin when similarly aligned. The alignment of green (or red) and blue can be improved by inserting into the green (or red) pigment sequence gaps of two amino acids and of one amino acid, respectively, at positions 4 residues and 29 residues from the carboxyl terminus. The number of residues in each diagram corresponds to the greatest extent to which either of the two pigments extends. These diagrams are modified versions of the schematic diagram for bovine rhodopsin devised by Hargrave et al. (7).
SCIENCE, VOL. 232
A * Red O Green
B
200
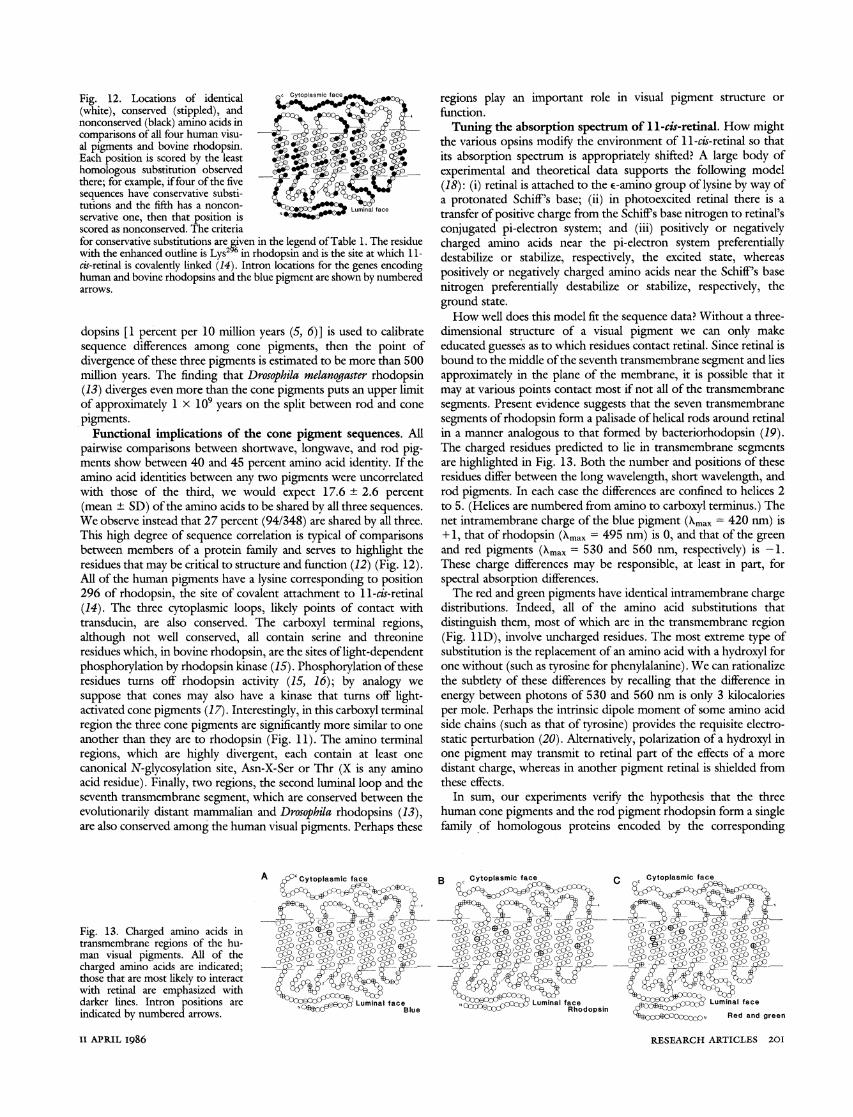
Fig. 12. Locations of identical Cytoplasmic fac
(white), conserved (stippled), and nonconserved (black) amino acids in comparisons of all four human visu- al pigments and bovine rhodopsin. v ':0
Each position is scored by the least homologous substitution observed _ P there; for example, if four of the five sequences have conservative substi- tutions and the fifth has a noncon- Lumal face
servative one, then that position is scored as nonconserved. The criteria for conservative substitutions are given in the legend of Table 1. The residue with the enhanced outline is Lys2 in rhodopsin and is the site at which 11- cis-retinal is covalently linked (14). Intron locations for the genes encoding human and bovine rhodopsins and the blue pigment are shown by numbered arrows.
dopsins [1 percent per 10 million years (5, 6)] is used to calibrate sequence differences among cone pigments, then the point of divergence of these three pigments is estimated to be more than 500 million years. The finding that Drosophila melanogaster rhodopsin (13) diverges even more than the cone pigments puts an upper limit of approximately 1 x 10⁹ years on the split between rod and cone pigments.
Functional implications of the cone pigment sequences. All pairwise comparisons between shortwave, longwave, and rod pig- ments show between 40 and 45 percent amino acid identity. If the amino acid identities between any two pigments were uncorrelated with those of the third, we would expect 17.6 ? 2.6 percent (mean ? SD) of the amino acids to be shared by all three sequences. We observe instead that 27 percent (94/348) are shared by all three. This high degree of sequence correlation is typical of comparisons between members of a protein family and serves to highlight the residues that may be critical to structure and function (12) (Fig. 12). All of the human pigments have a lysine corresponding to position 296 of rhodopsin, the site of covalent attachment to 11-cis-retinal (14). The three cytoplasmic loops, likely points of contact with transducin, are also conserved. The carboxyl terminal regions, although not well conserved, all contain serine and threonine residues which, in bovine rhodopsin, are the sites of light-dependent phosphorylation by rhodopsin kinase (15). Phosphorylation of these residues turns off rhodopsin activity (15, 16); by analogy we suppose that cones may also have a kinase that turns off light- activated cone pigments (17). Interestingly, in this carboxyl terminal region the three cone pigments are significantly more similar to one another than they are to rhodopsin (Fig. 11). The amino terminal regions, which are highly divergent, each contain at least one canonical N-glycosylation site, Asn-X-Ser or Thr (X is any amino acid residue). Finally, two regions, the second luminal loop and the seventh transmembrane segment, which are conserved between the evolutionarily distant mammalian and Drosophila rhodopsins (13), are also conserved among the human visual pigments. Perhaps these
regions play an important role in visual pigment structure or fimction.
Tuning the absorption spectrum of 11-cis-retinal. How might the various opsins modify the environment of 11-c/s-retinal so that its absorption spectrum is appropriately shifted? A large body of experimental and theoretical data supports the following model (18): (i) retinal is attached to the e-amino group of lysine by way of a protonated Schiff's base; (ii) in photoexcited retinal there is a transfer of positive charge from the Schiffs base nitrogen to retinal's conjugated pi-electron system; and (iii) positively or negatively charged amino acids near the pi-electron system preferentially destabilize or stabilize, respectively, the excited state, whereas positively or negatively charged amino acids near the Schiff's base nitrogen preferentially destabilize or stabilize, respectively, the ground state.
How well does this model fit the sequence data? Without a three- dimensional structure of a visual pigment we can only make educated guesses as to which residues contact retinal. Since retinal is bound to the middle of the seventh transmembrane segment and lies approximately in the plane of the membrane, it is possible that it may at various points contact most if not all of the transmembrane segments. Present evidence suggests that the seven transmembrane segments of rhodopsin form a palisade of helical rods around retinal in a manner analogous to that formed by bacteriorhodopsin (19). The charged residues predicted to lie in transmembrane segments are highlighted in Fig. 13. Both the number and positions of these residues differ between the long wavelength, short wavelength, and rod pigments. In each case the differences are confined to helices 2 to 5. (Helices are numbered from amino to carboxyl terminus.) The net intramembrane charge of the blue pigment (\max = 420 nm) is + 1, that of rhodopsin (Xmax = 495 nm) is 0, and that of the green and red pigments (Xmax = 530 and 560 nm, respectively) is -1. These charge differences may be responsible, at least in part, for spectral absorption differences.
The red and green pigments have identical intramembrane charge distributions. Indeed, all of the amino acid substitutions that distinguish them, most of which are in the transmembrane region (Fig. 11D), involve uncharged residues. The most extreme type of substitution is the replacement of an amino acid with a hydroxyl for one without (such as tyrosine for phenylalanine). We can rationalize the subtlety of these differences by recalling that the difference in energy between photons of 530 and 560 nm is only 3 kilocalories per mole. Perhaps the intrinsic dipole moment of some amino acid side chains (such as that of tyrosine) provides the requisite electro- static perturbation (20). Alternatively, polarization of a hydroxyl in one pigment may transmit to retinal part of the effects of a more distant charge, whereas in another pigment retinal is shielded from these effects.
In sum, our experiments verify the hypothesis that the three human cone pigments and the rod pigment rhodopsin form a single family of homologous proteins encoded by the corresponding
Fig. 13. Charged amino acids in transmembrane regions of the hu- man visual pigments. All of the charged amino acids are indicated; those that are most likely to interact with retinal are emphasized with darker lines. Intron positions are indicated by numbered arrows.
A cCytoplasmic face
N^^^^ Luminal face
Blue
B Cytoplasmic face
N .rv SS Luminal face ^^^ - -uu v Rhodopsin
RESEARCH ARTICLES 201 II APRIL I986
members of a family of genes. The data reveal a high degree of 8. Yu. A. Ovchinnikov et al., Bioorg. Khim. 8, 1424 (1982). homology between green and red pigment genes, each of which 9. R. E. Marc and H. G. Sperling, Science 196, 454 (1977); H. J. A. Darmall, J. K.
Bowmaker, J. D. Mollon, in Colour Vision, J. D. Mollon and L. T. Sharpe, Eds. shares a lower degree of homology with the blue pigment gene (Academic Press, New York, 1983), p. 69; G. Osterberg, Acta Ophthalmol. 6
comparable to the lower homology that each of the cone pigment (suppl.), 1 (1935); E. P. McCrane, F. M. de Monasterio, S. J. Schein, R. C. comparabie to e lowernoolog mateacnormeconepigmen Caruso, Invest. Ophthalmol. Visual Sci. 24, 1449 (1983).
genes shares with the rhodopsin gene. These results indicate that the 10. J. Francois, Heredity in Ophthalmology (Mosby, St. Louis, MO, 1961); H. Kalmus, evolution of the human visual pigment genes proceeded by the early D Diagnosis and Genetics of Defective Colour Vision (Pergamon, New York, 1965).
11G. H. Jacobs, Vision Res. 23, 239 (1983); J. K. Bowmaker, J. D. Mollon, G. H. divergence from a common ancester of three genes, two of which Jacobs, in Colour Vision, J. D. Mollon and L. T. Sharpe, Eds. (Academic Press, New generated the rhodopsin and blue pigment genes, while the third York, 1983), p. 57.
12. M. 0. Dayhoff, Atlas of Protein Sequence and Structure (National Biomedical was duplicated in a much more recent evolutionary event to yield the Research Foundation, Washington, DC, 1972), vol. 5. green and red pigment genes. The number of green pigment genes 13. J. E. O'Tousa et al., Cell 40, 839 (1985); C. S. Zuker, A. F. Cowan, G. M. Rubin,
ibid., p. 851. per X chromosome is highly variable among different color normal 14. D. Bownds, Nature (London) 216, 1178 (1967); E. Mullen and M. Akhtar, FEBS individuals, whereas the red pigment gene number is constant and Let. 132, 261 (1981); J. K. Wang, J. H. McDowell, P. A. Hargrave, Biochemistry
19, 5111 (1980). probably one. Such a variable-constant relation between the green 15. H. Kuhn and W. J. Dreyer, FEBS Lett. 20, 1 (1972); D. Bownds, J. Dawes, J. and red pigment gene numbers is consistent with a model in which Miller, M. Stahlman, Nature (London) NewBiol. 237, 125 (1972); P. A. Hargrave, these genes are arranged in a head-to-tail?tandem array with the 1. . Progress in Retinal Research (Pergamon Press, New York, 1982), vol. 1.
these genes are arranged in a head-to-tail tandem array with the 16. H. Kuhn, S. W. Hall, U. Wilden, FEBS Lett. 176, 473 (1984); P. A. Liebman and single red pigment gene occupying the 5' terminal position. Further E. N. Pugh, Nature (London) 287, 734 (1980). evidence favoring this model is presented in (4). 17. A. E. Walter, T. A. Shuster, D. B. Farber, Invest. Ophthalmol. Visual Sci. 26
(suppl.), 291 (1985). The deduced amino acid sequences of the cone pigments and of 18. A. Kropf and R. Hubbard, Ann. N.Y. Acad. Sci. 74, 266 (1958); R. Mathies and
rhodopsin are consistent with a model of retinal tuning by interac- L. Stryer, Proc. Natl. Atead. Sci. U.S.A. 73, 2169 (1976); B. Honig, A. D. Greenberg, U. Dinur, T. G. Ebrey, Biochemistry 15, 4593 (1976); B. Honig et al., tions with neighboring charged amino acids. A variety of experi- J. Am. Chem. Soc. 101, 7084 (1979); M. Sheves, K. Nakanishi, B. Honig, ibid., p. ments, including tests of this tuning model, will be possible if 7086.
19. R. Henderson and P. N. T. Unwin, Nature (London) 257, 28 (1975); Yu. A. functional visual pigments can be expressed from these cloned Ovchinnikov, FEBS Lett. 148, 179 (1982). DNA's and derivatives of them. Isolation of rod (5, 6) and cone 20. T. R. Hays, S. H. Lin, H. Eyring, Proc. Nat. Acad. Sci. U.S.A. 77, 6314 (1980).
21. W. D. Benton and R. W. Davis, Science 196, 180 (1977). pigment genes is also a first step in addressing the fascinating 22. P. W. J. Rigby, M. Dieckmann, C. Rhodes, P. Berg,J. Mol. Biol. 113,237 (1977). question of how during development a photoreceptor cell chooses 23. A. Maxam and W. Gilbert, Proc. Natl. Acad. Sci. U.S.A. 74, 560 (1977).
of the four visual pigments. 24. T. V. Huynh, R. Young, R. W. Davis, in DNA Cloning, A Practical Approach, D. to produce one ot the tour visual pigments. M. Glover, Ed. (IRL Press, London, 1985), vol. 1, p. 49.
25. R. W. Davis, D. Botstein, J. R. Roth, Eds., Advanced Bacterial Genetics (Cold Spring Harbor Laboratory, Cold Spring Harbor, NY, 1980).
26. M. L. Goldberg, thesis, Stanford University (1979); R. Breathnach and P. Chambon, Annu. Rev. Biochem. 50, 349 (1981).
REFERENCES AND NOTES 27. J. R. Nivens,Annu. Rev. Biochem. 52, 441 (1983). 1. B. K. Fung and L. Stryer, Proc. Natl. Acad. Sci. U.S.A. 77, 2500 (1980); B. K 28. M. A. T. Muskavitch and D. S. ogness, Cell 29, 1041 (1982).
Fung, J. B. Hurley, L. Stryer, ibid. 78, 152 (1981); R. Yee and P. A. Liebman,J 29. N. Murray, W J Brammer, K. Murray, Mo. Gen. Gene. 150, 53(1977). Biol. Chem. 253, 8902 (1978); E. E. Fesenko, S. S. Kolesnikov, A. L. Lyubarsky, 30 A98 rishau H hrah A Poustka, N Mrray, . Mo. Biol. 170, 827
NatureA (Lo l,n e. M. Bal 9, 24 (31953). 3 31. J. Kvte and R. F. Doolittle, ibid., Biol. 157, 105 (1982). 2. H. J. A. Dartnag, Brit. Med. Bull 9, 24 (1953).
3. R. Boynton, Human Color Vision (Holt, Rinehart, & Winston, New York, 1979) 32. A. L. Lehninger, Biochemisty (Worth New Yrk, 1975) J. D. Molon Hand L. T. Sharpe, Eds., Colour Vision (Acadernic Press New York
33. We thank our colleagues who served as subjects in these experiments; Willie J9D3'Mollon
and L.T. Sharpe, Eds., Colur Vision (Academic Press, New York, Brown, Kris Johnson, and Dr. Jeffrey Sklar for assistance in obtaining autopsy 1 9. 8. 3) -J?T-JrTO o ? > specimens of human eyes; and Dr. Lubert Stryer for his insight and enthusiasm 4. J. Nathans, T. P. Piantanida, R. L. Eddy, T. B. Shows, D. S. Hogness, Science 232, throughout the course of this work. .N. is trainee of th Medical Scientist
203 '1986' throughout the course of this work. J.N. is a trainee of the Medical Scientist 5. J. Nathans and D. S. Hogness, Ce!! 34, 807 (1983). Training Program of the National Institutes of Health. Supported by a grant from 6. , Proc. Natl. Acad. Sci. U.S.A. 81, 4851 (1984). the National Eye Institute (D.S.H.). 7. P. A. Hargrave et al., Biophys. Struct. Mech. 9, 235 (1983). 14 January 1986; accepted 21 Febnruary 1986
AAAS-Newcomb Cleveland Prize
To Be Awarded for an Article or a Report Published in Science
The AAAS-Newcomb Cleveland Prize is awarded to the nominate papers appearing in the Reports or Articles sections. author of an outstanding paper published in Science. The value of Nominations must be typed, and the following information the prize is $5000; the winner also receives a bronze medal. The provided: the title of the paper, issue in which it was published, current competition period begins with the 3 January 1986 issue author's name, and a brief statement of justification for nomina- and ends with the issue of 29 May 1987. tion. Nominations should be submitted to the AAAS-Newcomb
Reports and Articles that include original research data, theo- Cleveland Prize, AAAS, 1333 H Street, NW, Washington, DC ries, or syntheses and are fundamental contributions to basic 20005, and must be received on or before 30 June 1987. Final knowledge or technical achievements of far-reaching conse- selection will rest with a panel of distinguished scientists appoint- quence are eligible for consideration for the prize. The paper ed by the editor of Science. must be a first-time publication of the author's own work. The award will be presented at a ceremony preceding the Reference to pertinent earlier work by the author may be President's Public Lecture at the 1988 AAAS annual meeting to
202 SCIENCE, VOL.232~~-= ??I-
included to give perspective. be held in Boston. In cases of multiple authorship, the prize will Throughout the competition period, readers are invited to be divided equally between or among the authors.
SCIENCE, VOL. 232 202
Related Documents