Metabolic consequences of mitochondrial coenzyme A deficiency in patients with PANK2 mutations Valerio Leoni a, 1 , Laura Strittmatter b, c, 1 , Giovanna Zorzi d , Federica Zibordi d , Sabrina Dusi e , Barbara Garavaglia e , Paola Venco e , Claudio Caccia a , Amanda L. Souza c , Amy Deik c , Clary B. Clish c , Marco Rimoldi a , Emilio Ciusani a , Enrico Bertini f , Nardo Nardocci d , Vamsi K. Mootha b, c , Valeria Tiranti e, ⁎ a Laboratory of Clinical Pathology and Medical Genetics IRCCS Foundation Neurological Institute “C.Besta”, Milan, Italy b Departments of Systems Biology and Medicine, Harvard Medical School and Massachusetts General Hospital, Boston, Massachusetts 02114, USA c Broad Institute, Cambridge, Massachusetts 02142, USA d Unit of Child Neurology IRCCS Foundation Neurological Institute “C.Besta”, Milan, Italy e Unit of Molecular Neurogenetics, Pierfranco and Luisa Mariani Center for the study of Mitochondrial Disorders in Children, IRCCS Foundation Neurological Institute “C.Besta”, Milan, Italy f Unit of Molecular Medicine, Department of Neurosciences, Bambino Gesù Pediatric Research Hospital, Rome, Italy abstract article info Article history: Received 31 October 2011 Received in revised form 6 December 2011 Accepted 6 December 2011 Available online xxxx Keywords: PKAN Coenzyme A Mitochondria Metabolomics Cholesterol Pantothenate kinase-associated neurodegeneration (PKAN) is a rare, inborn error of metabolism characterized by iron accumulation in the basal ganglia and by the presence of dystonia, dysarthria, and retinal degeneration. Mutations in pantothenate kinase 2 (PANK2), the rate-limiting enzyme in mitochondrial coenzyme A biosynthesis, represent the most common genetic cause of this disorder. How mutations in this core metabolic enzyme give rise to such a broad clinical spectrum of pathology remains a mystery. To systematically explore its pathogenesis, we performed global metabolic profiling on plasma from a cohort of 14 genetically defined patients and 18 controls. Notably, lactate is elevated in PKAN patients, suggesting dysfunctional mitochondrial metabolism. As predicted, but never previously reported, pantothenate levels are higher in patients with premature stop mutations in PANK2. Global metabolic profiling and follow-up studies in patient-derived fibroblasts also reveal defects in bile acid conjugation and lipid metabolism, pathways that require coenzyme A. These findings raise a novel therapeutic hypothesis, namely, that dietary fats and bile acid supplements may hold potential as disease-modifying interventions. Our study illustrates the value of metabolic profiling as a tool for systematically exploring the biochemical basis of inherited metabolic diseases. © 2011 Elsevier Inc. All rights reserved. 1. Introduction Neurodegeneration with Brain Iron Accumulation (NBIA) is a severe class of neurodegenerative disorders with clinical presentations ranging from early-onset neurodegeneration with premature fatality to adult- onset parkinsonism–dystonia [1]. These disorders follow an autosomal recessive pattern of inheritance, and distinct subclasses of disease are defined by mutations in specific genes: mutations in PANK2 (MIM*606157) are associated with Pantothenate Kinase-Associated Neurodegeneration (PKAN), PLA2G6 (MIM*256600) with PLA2G6- Associated Neurodegeneration (PLAN, also known as INAD), and FA2H (MIM*611026) with Fatty Acid Hydroxylase Neurodegeneration (FAHN). PKAN is the most prevalent form of NBIA, and two distinct manifestations of this disease are observed. Classic PKAN patients present in the first decade of life with dystonia, dysarthria, rigidity, and pigmentary retinal degeneration. Eventually patients develop dysphagia, gastro-esophageal reflux, and constipation. Periods of stability are interspersed with periods of rapid decline: patients typically do not survive past age 20 due to complications including malnutrition and pneumonia. Atypical PKAN does not present until the second or third decade of life and progresses more slowly than classic PKAN. Early signs include gait abnormality, speech defects, and some psychiatric manifestations. The main diagnostic criterion for both phenotypes is the presence of the “eye of the tiger” pattern in the medial globus pallidus on MRI. Many patients with NBIA show hypointensity in the globus pallidus, but PKAN patients exhibit additional hyperintensity in the antero medial region [2]. PKAN is an inborn error of Vitamin B 5 metabolism [3]. Vitamin B 5 , otherwise known as pantothenate, is a micronutrient required for production of coenzyme A in cells. The vitamin is present in a variety of dietary sources including whole grains and meat as coenzyme A and is processed to pantothenate in the intestine. Pantothenate is Molecular Genetics and Metabolism xxx (2012) xxx–xxx ⁎ Corresponding author at: Unit of Molecular Neurogenetics, IRCCS Foundation Neurological Institute “C. Besta”, Via Temolo, 4, 20126 Milan, Italy. Fax: +39 0223942619. E-mail address: [email protected] (V. Tiranti). 1 These authors contributed equally to the work. YMGME-05186; No. of pages: 9; 4C: 1096-7192/$ – see front matter © 2011 Elsevier Inc. All rights reserved. doi:10.1016/j.ymgme.2011.12.005 Contents lists available at SciVerse ScienceDirect Molecular Genetics and Metabolism journal homepage: www.elsevier.com/locate/ymgme Please cite this article as: V. Leoni, et al., Metabolic consequences of mitochondrial coenzyme A deficiency in patients with PANK2 mutations, Mol. Genet. Metab. (2012), doi:10.1016/j.ymgme.2011.12.005

Welcome message from author
This document is posted to help you gain knowledge. Please leave a comment to let me know what you think about it! Share it to your friends and learn new things together.
Transcript
Metabolic consequences of mitochondrial coenzyme A deficiency in patients withPANK2 mutations
Valerio Leoni a,1, Laura Strittmatter b,c,1, Giovanna Zorzi d, Federica Zibordi d, Sabrina Dusi e,Barbara Garavaglia e, Paola Venco e, Claudio Caccia a, Amanda L. Souza c, Amy Deik c, Clary B. Clish c,Marco Rimoldi a, Emilio Ciusani a, Enrico Bertini f, Nardo Nardocci d, Vamsi K. Mootha b,c, Valeria Tiranti e,⁎a Laboratory of Clinical Pathology and Medical Genetics IRCCS Foundation Neurological Institute “C.Besta”, Milan, Italyb Departments of Systems Biology and Medicine, Harvard Medical School and Massachusetts General Hospital, Boston, Massachusetts 02114, USAc Broad Institute, Cambridge, Massachusetts 02142, USAd Unit of Child Neurology IRCCS Foundation Neurological Institute “C.Besta”, Milan, Italye Unit of Molecular Neurogenetics, Pierfranco and Luisa Mariani Center for the study of Mitochondrial Disorders in Children, IRCCS Foundation Neurological Institute “C.Besta”, Milan, Italyf Unit of Molecular Medicine, Department of Neurosciences, Bambino Gesù Pediatric Research Hospital, Rome, Italy
a b s t r a c ta r t i c l e i n f o
Article history:Received 31 October 2011Received in revised form 6 December 2011Accepted 6 December 2011Available online xxxx
Keywords:PKANCoenzyme AMitochondriaMetabolomicsCholesterol
Pantothenate kinase-associated neurodegeneration (PKAN) is a rare, inborn error of metabolism characterizedby iron accumulation in the basal ganglia and by the presence of dystonia, dysarthria, and retinal degeneration.Mutations in pantothenate kinase 2 (PANK2), the rate-limiting enzyme in mitochondrial coenzyme Abiosynthesis, represent the most common genetic cause of this disorder. How mutations in this core metabolicenzyme give rise to such a broad clinical spectrum of pathology remains a mystery. To systematically exploreits pathogenesis, we performed global metabolic profiling on plasma from a cohort of 14 genetically definedpatients and 18 controls. Notably, lactate is elevated in PKAN patients, suggesting dysfunctional mitochondrialmetabolism. As predicted, but never previously reported, pantothenate levels are higher in patients withpremature stop mutations in PANK2. Global metabolic profiling and follow-up studies in patient-derivedfibroblasts also reveal defects in bile acid conjugation and lipid metabolism, pathways that require coenzymeA. These findings raise a novel therapeutic hypothesis, namely, that dietary fats and bile acid supplements mayhold potential as disease-modifying interventions. Our study illustrates the value of metabolic profiling as atool for systematically exploring the biochemical basis of inherited metabolic diseases.
© 2011 Elsevier Inc. All rights reserved.
1. Introduction
Neurodegeneration with Brain Iron Accumulation (NBIA) is a severeclass of neurodegenerative disorderswith clinical presentations rangingfrom early-onset neurodegeneration with premature fatality to adult-onset parkinsonism–dystonia [1]. These disorders follow an autosomalrecessive pattern of inheritance, and distinct subclasses of disease aredefined by mutations in specific genes: mutations in PANK2(MIM*606157) are associated with Pantothenate Kinase-AssociatedNeurodegeneration (PKAN), PLA2G6 (MIM*256600) with PLA2G6-Associated Neurodegeneration (PLAN, also known as INAD), and FA2H(MIM*611026) with Fatty Acid Hydroxylase Neurodegeneration(FAHN).
PKAN is the most prevalent form of NBIA, and two distinctmanifestations of this disease are observed. Classic PKAN patientspresent in the first decade of life with dystonia, dysarthria, rigidity,and pigmentary retinal degeneration. Eventually patients developdysphagia, gastro-esophageal reflux, and constipation. Periods ofstability are interspersed with periods of rapid decline: patientstypically do not survive past age 20 due to complications includingmalnutrition and pneumonia. Atypical PKAN does not present untilthe second or third decade of life and progresses more slowly thanclassic PKAN. Early signs include gait abnormality, speech defects,and some psychiatric manifestations. The main diagnostic criterionfor both phenotypes is the presence of the “eye of the tiger” patternin the medial globus pallidus on MRI. Many patients with NBIAshow hypointensity in the globus pallidus, but PKAN patientsexhibit additional hyperintensity in the antero medial region [2].
PKAN is an inborn error of Vitamin B5 metabolism [3]. Vitamin B5,otherwise known as pantothenate, is a micronutrient required forproduction of coenzyme A in cells. The vitamin is present in a varietyof dietary sources including whole grains and meat as coenzyme Aand is processed to pantothenate in the intestine. Pantothenate is
Molecular Genetics and Metabolism xxx (2012) xxx–xxx
⁎ Corresponding author at: Unit of Molecular Neurogenetics, IRCCS FoundationNeurological Institute “C. Besta”, Via Temolo, 4, 20126 Milan, Italy. Fax: +390223942619.
E-mail address: [email protected] (V. Tiranti).1 These authors contributed equally to the work.
YMGME-05186; No. of pages: 9; 4C:
1096-7192/$ – see front matter © 2011 Elsevier Inc. All rights reserved.doi:10.1016/j.ymgme.2011.12.005
Contents lists available at SciVerse ScienceDirect
Molecular Genetics and Metabolism
j ourna l homepage: www.e lsev ie r .com/ locate /ymgme
Please cite this article as: V. Leoni, et al., Metabolic consequences of mitochondrial coenzyme A deficiency in patients with PANK2mutations,Mol. Genet. Metab. (2012), doi:10.1016/j.ymgme.2011.12.005
absorbed by endothelial cells via a sodium-dependent multivitamintransporter and then passes to the blood for delivery to the rest ofthe body [4]. At the cellular level, it is phosphorylated by pantothenatekinase, conjugated to cysteine, decarboxylated, conjugated to anadenosyl group and phosphorylated again to coenzyme A. All of theseenzymatic activities have been detected in the cytosol and many inthe mitochondrion; although the cysteine ligase and decarboxylationactivities have not been detected explicitly in the mitochondrion, ithas been proposed that an exclusively mitochondrial coenzyme Asynthetic pathway exists [5–7]. The key rate-limiting step in thispathway is the phosphorylation of pantothenate by pantothenatekinase. Four isoforms of this enzyme are known: PANK1, PANK2,PANK3 and PANK4. It is unclear whether PANK4 is functional, butPANK1 and PANK3 are active in the cytosol, while PANK2 is localizedto and active in the mitochondrion [6].
Coenzyme A is involved in a number of metabolic pathways,including the citric acid cycle, sterol and steroid biosynthesis, hemebiosynthesis, amino acid synthesis, and β-oxidation. Mutations inPANK2, which encodes the key enzyme in this biosynthetic pathway,are expected to result in defective CoA biosynthesis, which could leadto a variety of metabolic defects. Recently it has been hypothesizedthat diminished CoA pools have a detrimental effect on histone andtubulin acetylation, contributing to the neurological phenotype ofPKAN [8]. However, it is not known how mutations in PANK2 causethe spectrum of clinical symptoms exhibited by PKAN patients.Previous attempts to understand the mechanism of PKAN usinganimal models have met with limited success. A mouse model ofPKAN exhibits retinal degeneration but lacks any neurological pheno-type [9]. A Drosophila model of PKAN does have a brain phenotype,but this involves the formation of vacuoles, not iron accumulation,and Drosophila do not have as many pantothenate kinase isoforms ashumans [10]. Given that the downstream product of PANK2, coenzymeA, is involved in a number of metabolic pathways, we considered globalmetabolic profiling as a useful approach to systematically characterizethe biochemical abnormalities in this population.
2. Materials and methods
2.1. Human subjects
Patients were recruited based on clinical presentation, MRIfindings and presence of PANK2 mutations, at the Unit of ChildNeurology, IRCCS Foundation Neurological Institute “C.Besta” and atthe Unit of Molecular Medicine, Bambino Gesù Pediatric Hospital;healthy controls were recruited at the “C. Besta” Institute. Subjects'consent was obtained according to the Declaration of Helsinki: BMJ1991; 302, 1194. In addition, we obtained institutional reviewboard–approved informed consent from parents of all probands andcontrols before collecting blood for DNA extraction or performingskin biopsies. Our cohort includes 14 patients, one of whom(GHBE70) had blood drawn on three separate occasions, and twoothers (PAVA83 and PERO96) who had blood drawn on two separateoccasions. Patient and control plasma samples were well-matchedbased on sex (22% male patients, 28% male controls), age (23+/!11 for patients, 27+/!4 for controls, P>0.05) and BMI (20.9+/!6.9 for patients, 22.6+/!3.8 for controls, P>0.05).
2.2. Cell culture
Fibroblasts derived from patients and controls were cultured at37 °C in a humidified 5% CO2 atmosphere, and were trypsinizedonce or twice a week. The culture medium, replaced twice perweek, was Dulbecco's modified Eagle's medium (DMEM) containing4.5 g/L glucose, 10% (V/V) fetal calf serum, 1 mM sodium pyruvate,200 U/mL Penicillin G, 200 mg/mL streptomycin, and 4 mM gluta-mine. Control and patient fibroblasts were cultured for 6–8 passages,
trypsinized and collected by centrifugation. The dry cell pellets werestored at !80 °C until analysis.
2.3. Metabolic profiling
Sample collection for metabolic profiling was performed on “non-fasted” patients and controls after 3 h fasting, as previously described[11–14]. For each sample, 4 mL of blood was drawn and collected in K2
EDTA tubes, which were immediately centrifuged for 10 min at 2000 gand 6 °C. Plasma was divided into five 400 μL aliquots and stored at!80 °C within 10 min. Plasma samples were coded and de-identifiedprior to metabolic profiling. Three separate LC–MS methods wereused on each plasma sample: (1) a hydrophilic interaction liquidchromatography (HILIC) method for analysis of polar metabolites inthe positive ionmode, (2) an ion pairing chromatography (IPC)methodto measure polar metabolites in the negative ion mode, and (3) areversed phase (RP) method to profile lipids. All LC–MS analyses wereperformed using a 4000 QTRAP triple quadrupole mass spectrometer(AB SCIEX; Foster City, CA) coupled to either a 1100 series pump or a1200 Series pump (Agilent Technologies; Santa Clara, CA) and an HTSPAL autosampler (Leap Technologies; Carrboro, NC). A total of 36plasma samples were analyzed in a blinded, random order.
For HILIC analyses, plasma samples (10 μL) were prepared viaprotein precipitation with the addition of nine volumes of74.9:24.9:0.2 v/v/v acetonitrile/methanol/formic acid containing stableisotope-labeled internal standards (valine-d8, Isotec, Miamisburg, OH;and phenylalanine-d8, Cambridge Isotope Laboratories; Andover, MA).The samples were centrifuged (10 min, 10,000 rpm, 4 °C), and thesupernatants were injected directly onto a 150!2.1 mm Atlantis HILICcolumn (Waters; Milford, MA). The column was eluted isocratically ata flow rate of 250 μL/min with 5% mobile phase A (10 mM ammoniumformate and 0.1% formic acid in water) for 1 min followed by a lineargradient to 40% mobile phase B (acetonitrile with 0.1% formic acid)over 10 min. MS analyses were carried out using electrospray ionizationand selectivemultiple reactionmonitoring scans in the positive ionmode.De-clustering potentials and collision energies were optimized for eachmetabolite by infusion of reference standards before sample analyses.The ion spray voltagewas 4.5 kV and the source temperaturewas 425 °C.
For IPC analyses, plasma (130 μL) was extracted with 400 μL of80:20 v/v methanol/water containing thymine-d4 and glutamate-13C5,15N (Cambridge Isotope Laboratories, Andover, MA) internalstandards. After centrifugation, 430 μL of supernatant was transferredto a fresh tube and evaporated under nitrogen gas in a Turbovap LV(Caliper, Hopkinton, MA) at 37 °C. Dried samples were resuspendedin 80 μL of water containing glycocholate-d4 and inosine-15N4 inter-nal standards (Sigma-Aldrich, St. Louis, MO) and injected onto a100!3 mm Atlantis T3 column (Waters, Milford, MA). The columnwas eluted isocratically at a flow rate of 350 μL/min with 100%mobile-phase A (10 mM tributylamine and 15 mM acetic acid inwater) for 2 min followed by a linear gradient to 98% mobile phaseB (methanol) over 20 min. MS analyses were carried out as above,except in the negative ion mode, with ion spray voltage at !4.5 kVand a source temperature of 550 °C.
Plasma samples (10 μL) were extracted for lipid analyses with190 μL of isopropanol containing 1-dodecanoyl-2-tridecanoyl-sn-glycero-3-phosphocholine (Avanti Polar Lipids; Alabaster, AL). Aftercentrifugation, supernatants were injected directly onto a150!3.0 mm Prosphere HP C4 column (Grace, Columbia, MD). Thecolumn was eluted isocratically with 80% mobile phase A (95:5:0.1vol/vol/vol 10 mM ammonium acetate/methanol/acetic acid) for2 min followed by a linear gradient to 80% mobile-phase B (99.9:0.1vol/vol methanol/acetic acid) over 1 min, a linear gradient to 100%mobile phase B over 12 min, then 10 min at 100% mobile-phase B.MS analyses were carried out using electrospray ionization and Q1scans in the positive ion mode. Ion spray voltage was 5.0 kV andsource temperature was 400 °C. For each lipid analyte, the first
2 V. Leoni et al. / Molecular Genetics and Metabolism xxx (2012) xxx–xxx
Please cite this article as: V. Leoni, et al., Metabolic consequences of mitochondrial coenzyme A deficiency in patients with PANK2mutations,Mol. Genet. Metab. (2012), doi:10.1016/j.ymgme.2011.12.005

number denotes the total number of carbons in the lipid acyl chain(s)and the second number (after the colon) denotes the total number ofdouble bonds in the lipid acyl chain(s).
For each method, internal standard peak areas were monitored forquality control and individual samples with peak areas differing fromthe group by more than two standard deviations were re-analyzed.MultiQuant software (Version 1.1; AB SCIEX; Foster City, CA) wasused for automated peak integration and metabolite peaks weremanually reviewed for quality of integration and compared againsta known standard to confirm identity.
2.4. Fasting lactate, pyruvate and alanine measurements
A second blood drawwas performed on a subset of available patientsand controls (n=10 individuals in each group), after an overnight fastand without using a tourniquet (a large rubber strap) secured above thevein. Lactic and pyruvic acids were assayed spectrophotometricallyusing lactate dehydrogenase [15]. Plasma alanine with correspondingstable-isotope standard was extracted by acetonitrile deproteinization[16]. Butylated derivatives were analyzed and quantified in MRM modeon an API 2000 LC/MS/MS system (PE SCIEX — Applied Biosystems)according to standard procedures.
2.5. Isotope dilution mass spectrometry analysis for sterols and oxysterols
Sterol and oxysterol measurements were performed on plasmacollected from both fasting and non-fasting PKAN patients and controls.To a screw-capped vial sealed with a Teflon septum, 250 μL of plasmaare added together with 200 ng D4-lathosterol, 500 ng D7-sitosteroland D7-campesterol, 100 ng D7-7α-hydroxycholesterol, D7-7β-hydroxycholesterol, D7-7ketocholesterol, D3-24S-hydroxycholesteroland D6-27-hydroxycholesterol as internal standards. To prevent autooxidation, we added 50 μl butylated hydroxytoluene (5 g/L) and 50 μlEDTA (10 g/L) to each vial and flushed with nitrogen to remove air.
For sterol and oxysterol determinations in cultured cells, the drycell pellet was suspended in 1 mL of NaCl. 750 μL were used for sterolanalysis and 250 μL for determination of protein with the Lowrymethod. Together with 50 μL butylated hydroxytoluene (5 g/L) and50 μL EDTA (10 g/L) to screw capped glass vials were added also5 μg D6-cholesterol, 100 ng of D4-lathosterol, and 20 ng of D7-24S-hydroxycholesterol.
Alkaline hydrolysis was allowed to proceed at room temperature(22 °C) with magnetic stirring for 1 h in the presence of ethanolic1 M potassium hydroxide solution. After hydrolysis, the sterols wereextracted twice with 5 mL cyclohexane. The organic solvents wereevaporated under a gentle stream of argon and converted intotrimethylsilyl ethers (pyridine:hexamethyldisilazane:trimethylchlor-osilane 3:2:1 v/v/v).
Gas chromatography mass spectrometry (GC–MS) analysis was per-formed on a GC equipped with an Elite column (30 m!0.32 mmid!0.25 mm film; Perkin Elmer, USA) and injection was performed insplitlessmode using helium (1 mL/min) as a carrier gas. The temperatureprogramwas as follows: initial temperature of 180 °Cwas held for 1 min,followed by a linear ramp of 20 °C/min to 270 °C, and then a linear rampof 5 °C/min to of 290 °C, which was held for 10 min.
The mass spectrometer operates in the selected ion-monitoringmode. Peak integration is performed manually, and sterols arequantified from selected-ion monitoring analyses against internalstandards using standard curves for the listed sterols. Additionalqualifier (characteristic fragment ions) ions were used for structuralidentification [17,18].
2.6. Fatty acid analysis in fibroblasts
For fatty acid determination in cultured cells, the dry cell pelletwas suspended in 1 mL of NaCl. 750 μL was used for sterol analysis
and 250 μL for determination of protein with the Lowry method.Together with 50 μL butylated hydroxytoluene (5 g/L) and 50 μlEDTA (10 g/L) to screw capped glass vials was added 20 μg ofheptadecanoic acid (C17:0). Alkaline hydrolysis was allowed toproceed at room temperature (22 °C) with magnetic stirring for 1 h inthe presence of ethanolic 1 M potassium hydroxide solution. Afterhydrolysis, the sterols were extracted twice with 5 mL cyclohexaneand twice with 5 mL of ethyl acetate. The organic solvents wereevaporated under a gentle stream of argon and converted intotrimethylsilyl ethers (pyridine:hexamethyldisilazane:trimethylchloro-silane 3:2:1 v/v/v).
Gas chromatography mass spectrometry (GC–MS) analysis wasperformed on a Perkin Elmer Clarus 600 GC-Mass Spectrometersystem. The GC is equipped with an Elite column (30 m!0.32 mmid!0.25 mm film; Perkin Elmer, USA) and injection was performedin the split 1:10 mode and using helium (1 mL/min) as a carrier gas.For fatty acid determination the temperature programwas as follows:initial temperature of 100 °C was held for 1 min, followed by a linearramp of 10 °C/min to 300 °C, and then was held for 10 min at 300 °C.The mass spectrometer operates in scan (50–600 mz) mode. Peakintegration is performed manually and fatty acids were quantifiedfrom total area of each compound against internal standard areausing standard curves for the listed fatty acids. Each molecule wasidentified on the basis of the fragmentation pattern and retentiontime. The FA quantification was linear up to 100 μg and the meanwithin run variation was less than 5% (n=10).
2.7. Univariate analysis
For globalmetabolic profiling, the statistical significance ofmetabolicvariation between patient and control plasma samples was calculatedusing theWilcoxon Rank Sum test, ignoring NaN values for metabolitesnot robustly measured in a given sample. A significance threshold of0.05 would be expected to yield approximately 11.5 false positivesover the 230 metabolites (hypotheses) tested [19]. The significance ofdemographic differences between patients and controls was calculatedusing an unpaired, two-sided Student's T Test assuming unequalvariance. For single metabolite measurements, continuous data wereinspected and tested to determine whether distributions were normalby Kolmogorov–Smirnov normality test, and compared using a two-sided Student's T Test assuming unequal variance or parametricStudent's T Test, as appropriate. Values for statistical significance wereset at Pb0.05. All analyses were performed with Matlab (TheMathWorks Inc.) or Sigmastat 3.01 (SigmaAldrich, St Louis, MO, USA).
3. Results
We performed global metabolic profiling on plasma samplesobtained from a cohort of 14 genetically-verified PKAN patients and18 healthy age- and gender-matched controls, taking advantage ofplasma samples from multiple blood draws available for a subset ofpatients. We used a validated [11–14] analytical system that combinestandem mass spectrometry with high-performance liquid chromatogra-phy (HPLC–MS/MS) to measure the levels of 245 polar and nonpolarmetabolites. Table 1 summarizes the clinical and genetic features of the14 patients analyzed in this study, as well as a list of current medicationsat the time of sampling. We acknowledge the confounding effects oflifestyle factors, which we are unable to control in such small studies ofpatients with rare genetic disease. We determined the relative levels of245 metabolites spanning the breadth of metabolism from amino acidsand their derivatives to a variety of lipid species. Of the 245 metabolitestargeted, 230 were detected and well measured in at least 80% ofhuman plasma samples. The abundance of these 230 metabolites inpatients versus controls is summarized in Fig. 1 (full data inSupplementary Table 1).
3V. Leoni et al. / Molecular Genetics and Metabolism xxx (2012) xxx–xxx
Please cite this article as: V. Leoni, et al., Metabolic consequences of mitochondrial coenzyme A deficiency in patients with PANK2mutations,Mol. Genet. Metab. (2012), doi:10.1016/j.ymgme.2011.12.005

3.1. Markers of mitochondrial dysfunction
Given that PANK2 is a mitochondrial enzyme, we looked forbiochemical evidence of mitochondrial dysfunction. Classic markersfor mitochondrial dysfunction include elevations in lactate, alanine,and the lactate/pyruvate ratio [20]. Of these metabolites, we found
that lactate was significantly elevated in patients compared to controls,with a patient:control ratio of 1.27 (P=0.041) in our metabolicprofiling analysis of non-fasted subjects (Fig. 2). To confirm thisobservation, we performed a second blood draw on a subset of patientsand controls after an overnight fast and analyzed lactate biochemically.We observed a patient:control ratio of 1.54 (P=0.01) (Fig. 2),
Table 1Demographic, clinical, and genetic characteristics of patient cohort. Abbreviations: M/F, male/female.
PatientID
Gender Age(years)
Height(cm)
Weight(kg)
BMI PKANpresentation
Mutation (cDNA) Mutation(protein)
Medications
ARFR80 F 28 133 32 18.1 Classical 569insA homozygousex1
Y190X Trihexiphenidyl, Baclofen, Pimozide, Gabapentin, ValproicAcid, Diazepam, Omeprazole
ARRO78 F 31 154 51 21.5 Classical 569insA homozygousex1
Y190X Trihexiphenidyl, Baclofen, Gabapentin
BOOLR2 F 27 150 48 21.3 Atypical IVS1+5g>c ex1+635G>A ex.2
?+.E212G Baclofen, CoEq
COVI02 M 5 107 17 14.8 Classical A1499T ex.5 et.+ivs2-1G>A et.
N500I+? Trihexiphenidyl
DALA87 F 21 155 34 14.2 Classical 683 T>C ex. 2+1648 T>C ex.6
F228S+F550L Trihexiphenidyl, Pimozide, Baclofen IT, Ranitidine/Domperidone, Levetiracetam
DICA86 F 23 160 45 17.6 Atypical 856C>T homozygous ex.2 R286C –
GHBE70 F 38 180 111 34.3 Atypical G1561A ete ex.6+G775A et. ex.2
G521R+G259R –
MAAM02 M 7 115 20 15.1 Classical 1259 del Ghomozygous ex.4
F419fsX472 –
MAMO99 M 10 128 23 14.0 Classical 1259 del G homozygousex.4
F419fsX472 –
PAVA83 F 26 162 62 23.6 Classical C1069T homozygousex.3
R357W Diazepam, Paroxetine, Trihexiphenidyl, Gabapentin, coEq
PERO96 F 12 158 40 16.0 Classical 790C>T homozygousex3
R264W Trihexiphenidyl, CoEq
ROST73 M 35 180 60 18.5 Classical 790C>T homozygousex2
R264W Trihexiphenidyl, Baclofen, Tetrabenazine, Diazepam
SASA82 F 26 165 58 21.3 Atypical 790C>T ex2+ 856C>Tex.2
R264W+R286C Vitamin B5, Baclofen
SCFR94 F 12 120 25 17.4 Classical 821-822delCT/ del ex1–4
L273fsX290/nottranslated
Trihexiphenidyl, Baclofen IT
Fig. 1. Plasma metabolites in patients versus healthy controls. The figure depicts the 230 metabolites detected in >80% of plasma samples. For each metabolite, the significance offold change (Wilcoxon Rank Sum test) is plotted as a function of fold change in patients versus controls. For each lipid analyte (triacylgylcerols abbreviated as TAG, sphingomyelinsas SM, and lysophosphatidylcholines as LPC), the number of carbons and double bonds in the acyl chain(s) is denoted.
4 V. Leoni et al. / Molecular Genetics and Metabolism xxx (2012) xxx–xxx
Please cite this article as: V. Leoni, et al., Metabolic consequences of mitochondrial coenzyme A deficiency in patients with PANK2mutations,Mol. Genet. Metab. (2012), doi:10.1016/j.ymgme.2011.12.005
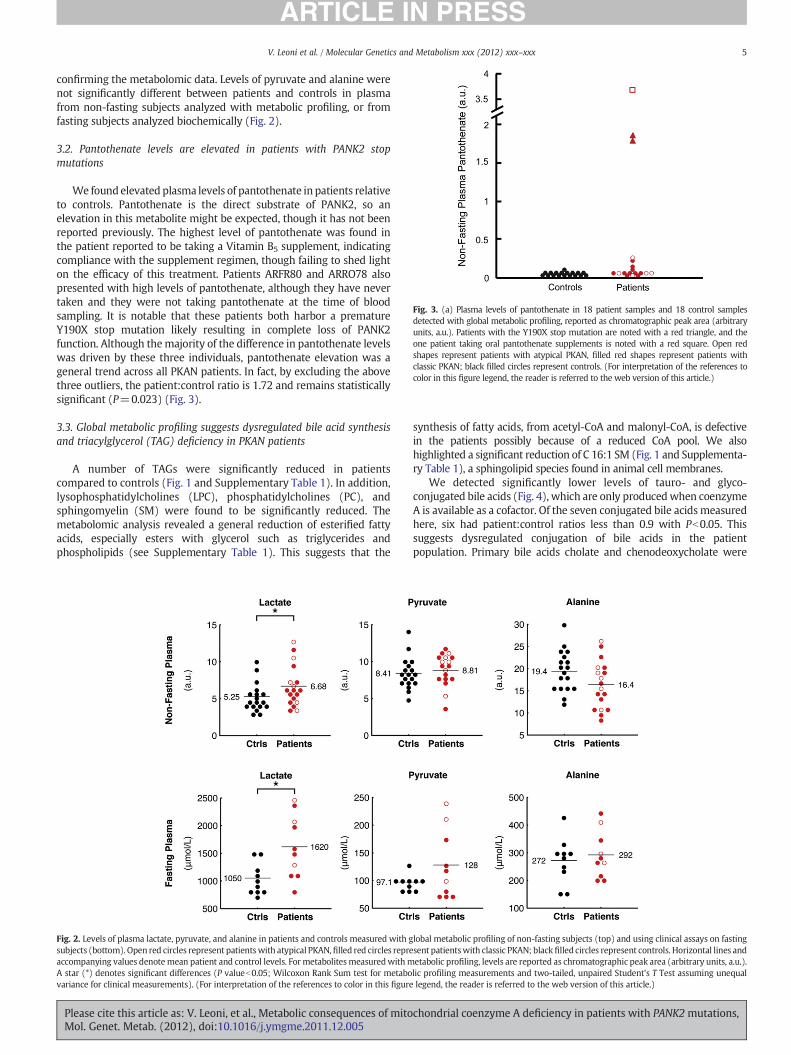
confirming the metabolomic data. Levels of pyruvate and alanine werenot significantly different between patients and controls in plasmafrom non-fasting subjects analyzed with metabolic profiling, or fromfasting subjects analyzed biochemically (Fig. 2).
3.2. Pantothenate levels are elevated in patients with PANK2 stopmutations
We found elevated plasma levels of pantothenate in patients relativeto controls. Pantothenate is the direct substrate of PANK2, so anelevation in this metabolite might be expected, though it has not beenreported previously. The highest level of pantothenate was found inthe patient reported to be taking a Vitamin B5 supplement, indicatingcompliance with the supplement regimen, though failing to shed lighton the efficacy of this treatment. Patients ARFR80 and ARRO78 alsopresented with high levels of pantothenate, although they have nevertaken and they were not taking pantothenate at the time of bloodsampling. It is notable that these patients both harbor a prematureY190X stop mutation likely resulting in complete loss of PANK2function. Although themajority of the difference in pantothenate levelswas driven by these three individuals, pantothenate elevation was ageneral trend across all PKAN patients. In fact, by excluding the abovethree outliers, the patient:control ratio is 1.72 and remains statisticallysignificant (P=0.023) (Fig. 3).
3.3. Global metabolic profiling suggests dysregulated bile acid synthesisand triacylglycerol (TAG) deficiency in PKAN patients
A number of TAGs were significantly reduced in patientscompared to controls (Fig. 1 and Supplementary Table 1). In addition,lysophosphatidylcholines (LPC), phosphatidylcholines (PC), andsphingomyelin (SM) were found to be significantly reduced. Themetabolomic analysis revealed a general reduction of esterified fattyacids, especially esters with glycerol such as triglycerides andphospholipids (see Supplementary Table 1). This suggests that the
synthesis of fatty acids, from acetyl-CoA and malonyl-CoA, is defectivein the patients possibly because of a reduced CoA pool. We alsohighlighted a significant reduction of C 16:1 SM (Fig. 1 and Supplementa-ry Table 1), a sphingolipid species found in animal cell membranes.
We detected significantly lower levels of tauro- and glyco-conjugated bile acids (Fig. 4), which are only producedwhen coenzymeA is available as a cofactor. Of the seven conjugated bile acids measuredhere, six had patient:control ratios less than 0.9 with Pb0.05. Thissuggests dysregulated conjugation of bile acids in the patientpopulation. Primary bile acids cholate and chenodeoxycholate were
Fig. 2. Levels of plasma lactate, pyruvate, and alanine in patients and controls measured with global metabolic profiling of non-fasting subjects (top) and using clinical assays on fastingsubjects (bottom). Open red circles represent patientswith atypical PKAN,filled red circles represent patientswith classic PKAN; black filled circles represent controls. Horizontal lines andaccompanying values denotemean patient and control levels. For metabolitesmeasuredwithmetabolic profiling, levels are reported as chromatographic peak area (arbitrary units, a.u.).A star (*) denotes significant differences (P valueb0.05; Wilcoxon Rank Sum test for metabolic profiling measurements and two-tailed, unpaired Student's T Test assuming unequalvariance for clinical measurements). (For interpretation of the references to color in this figure legend, the reader is referred to the web version of this article.)
Fig. 3. (a) Plasma levels of pantothenate in 18 patient samples and 18 control samplesdetected with global metabolic profiling, reported as chromatographic peak area (arbitraryunits, a.u.). Patients with the Y190X stop mutation are noted with a red triangle, and theone patient taking oral pantothenate supplements is noted with a red square. Open redshapes represent patients with atypical PKAN, filled red shapes represent patients withclassic PKAN; black filled circles represent controls. (For interpretation of the references tocolor in this figure legend, the reader is referred to the web version of this article.)
5V. Leoni et al. / Molecular Genetics and Metabolism xxx (2012) xxx–xxx
Please cite this article as: V. Leoni, et al., Metabolic consequences of mitochondrial coenzyme A deficiency in patients with PANK2mutations,Mol. Genet. Metab. (2012), doi:10.1016/j.ymgme.2011.12.005

slightly but not significantly higher in PKAN patients compared tocontrols (Fig. 4 and Supplementary Table 1).
3.4. Biochemical analysis of cholesterol and fatty acid biosynthesis
Coenzyme A is also required for cholesterol and fatty acidbiosynthesis. Since themetabolic profiles suggested bile acid dysregula-tion, we used an alternative technology to measure markers ofcholesterol biosynthesis both in non-fasted patients and controls, aswell as in plasma from the fasting subset. We found that the cholesterolprecursors lanosterol and lathosterol, considered markers of whole-body cholesterol biosynthesis [21] were significantly reduced in PKANpatients compared to controls, irrespective of fasting status (Fig. 5).
We also measured the plasma oxysterols 7α-hydroxycholesteorol(7a-OHC), formed in the first step of the neutral bile acid biosyntheticpathway, and 27-hydroxycholesterol (27OHC), formed mainly in theacidic pathway. In the non-fasted group, 27OHC was significantlylower in PKAN patients, while a mild but still significant reduction
was found in the levels of 7a-OHC (Fig. 5). No statistically significantdifferences were found in fasted subjects.
To complement the plasma analysis, we also measured markers ofcholesterol synthesis and fatty acid levels in primary fibroblast celllines from three controls and six PKAN patients, including four fromour metabolomic analysis (ARFR80, MAAM02, ROST73, GHBE70.Table 1). The two additional cell lines derived from one patient withthe compound heterozygous mutations R264W and S471N, and onepatient homozygous for R286C. At the cellular level, we detected areduction of lanosterol and lathosterol (Fig. 6a), as well as a reductionof palmitic acid, the primary fatty acid synthesized by fatty acidsynthase (FAS), and of myristic, oleic and stearic acids (Fig. 6b).Taken together, these data support the hypothesis of reducedcholesterol and fatty acid synthesis as a result of mutations in PANK2.
Finally, we measured the plant sterols campesterol and sitosterol(Fig. 7), used as markers for nutrient absorption [22], and we foundthat campesterol was reduced in patient plasma compared to controls(P=0.032). Sitosterol was also lower in patient plasma, though this
Fig. 4. (a) A simplified schematic of the bile acid biosynthetic pathway. Cofactors are enclosed in rounded rectangles. Arrows (!!) denote metabolites detected with metabolicprofiling to be significantly lower in patients relative to controls (Wilcoxon Rank Sum Pb0.05). Select enzymes in this pathway, bile acid CoA ligase (BAL) and bile acid-CoA:amino acid N-acyltransferase (BAAT), are shown in italics. (b) A summary of bile acids measured in this study.
Fig. 5. Plasmamarkers of sterol biosynthesis and absorption. Lathosterol and lanosterol (left) in patient and control plasma under non-fasting (top) and fasting conditions (bottom).7a-hydroxycholesterol and 27-hydroxycholesterol (right) in patient and control plasma under non-fasting (top) and fasting conditions (bottom). Two stars (**) denote significantdifferences (P valuesb0.005); other symbols as in Fig. 2.
6 V. Leoni et al. / Molecular Genetics and Metabolism xxx (2012) xxx–xxx
Please cite this article as: V. Leoni, et al., Metabolic consequences of mitochondrial coenzyme A deficiency in patients with PANK2mutations,Mol. Genet. Metab. (2012), doi:10.1016/j.ymgme.2011.12.005

did not reach statistical significance (P=0.267. Under fastingconditions, these differences in sterol levels disappeared (Fig. 7).
4. Discussion
Here we present a preliminary metabolic analysis of plasma fromPKAN patients. The severity and rarity of this disorder posed a challengefor patient enrollment and sample collection, butwe consider our cohort
of genetically and clinically defined patients large enough to supportsuch an approach, and here report the results of our study and theirimplications for better understanding this devastating disease. Ourcohort of patients includes classical and atypical cases but no obviousdifferences between these groups have emerged from our analyses.Although PKAN patients have not been previously reported to havemitochondrial respiratory chain deficiency, the elevation of lactatesuggests possible mitochondrial dysfunction. We also report reducedlipid and cholesterol biosynthesis and impaired bile acid metabolism,two findingswith potential therapeutic relevance. Although the patientswere on heterogeneous drug regimens at the time of sampling, we arenot aware of interactions between these medications and lipid and/orbile acid metabolism, though the precise mechanism of action of theanti-dystonic drug Baclofen remains unknown.
As highlighted in Fig. 1, additional metabolites such as inosine,proline, sorbitol, maleate and cotinine show strong or significantdifferences between patients and controls. Cotinine, a tobaccometabolite [23], likely reflects a lifestyle difference. The relevance ofthe remaining metabolites is unclear at present; the implications ofthese metabolic differences may become apparent in future studies.Given the brain iron accumulation that characterizes PKAN, we hadhoped to observe differences in iron-related metabolites. Ourmetabolic profiling method is not all-inclusive, which could explainthe lack of iron-related metabolic differences observed. In addition,PKAN iron accumulation occurs in the brain, and our study wasperformed on plasma samples; sampling cerebrospinal fluid insteadof plasma may have revealed differences in additional iron-relatedmetabolites but was beyond the scope of this study.
Pantothenate kinase 2 catalyzes the key, rate-limiting step incoenzyme A biosynthesis, so mutations in the gene encoding thisenzyme have the potential to disrupt a number of metabolicprocesses by disrupting cellular CoA pools. Elevations in lactatesuggest that mutations in this mitochondrial enzyme could causegeneral mitochondrial dysfunction (Fig. 2). Our study suggests thatthe imbalance in coenzyme A pools created by PANK2 mutations mayinterfere with a number of metabolic pathways previously unstudiedin the context of PKAN (Fig. 1), including cholesterol, fatty acid, andbile acid biosynthesis.
Based on genetic analysis (Table 1), we would predict thosepatients with early stop codon mutations in PANK2 to have the mostsevere enzymatic defects, and perhaps to exhibit a metabolicblockade at this step in CoA biosynthesis. Indeed, patients ARFR80and ARRO78 have the highest plasma pantothenate levels amongpatients not taking pantothenate supplements (Fig. 3). Patients withnon-stop codon loss-of-function mutations do not have suchdrastically elevated pantothenate levels, though their levels are stillhigh compared to controls. This data indicates a biochemical andmetabolic heterogeneity among PKAN patients and suggests thepresence of compensatory, but still unknown, mechanisms possiblyexerted by other PANK proteins.
Cholesterol synthesis is a cytosolic pathwaywith a number of acetylCoA-dependent steps. Acetyl-CoA enters the cytoplasm in the form ofcitrate via the tricarboxylate transport system. It is possible thatreduced acetyl CoA synthesis in mitochondria might limit cholesterolbiosynthesis by reducing the basic structural element for earlycholesterol precursors, thereby limiting production of metabolitesdownstream of cholesterol, such as lanosterol and lathosterol. Wedetected significant reductions of these sterols, which are consideredhuman plasma markers for whole body cholesterol synthesis[21,24,25], in both plasma and fibroblasts derived from PKAN patients(Figs. 5 and 6).
Our global metabolic approach also highlighted a dysregulation ofbile acid metabolism in PKAN patients. Bile acid synthesis fromcholesterol proceeds via the intermediates 7a-OHC and 27OHC[26,27], which we found to be reduced in patient plasma (Fig. 5).Once the primary bile acids cholate and chenodeoxycholate are
Fig. 6. Cholesterol precursors and fatty acids in fibroblasts. (a) Lathosterol and lanos-terol in fibroblasts derived from patients and healthy controls. (b) Palmitic, oleic, myr-istic and stearic acid levels in fibroblasts derived from patients and healthy controls.Symbols as in Fig. 2.
Fig. 7. Markers of nutrient absorption. Plant sterols campesterol and sitosterol weremeasured in plasma derived from patients and controls under non-fasting (top) orfasting conditions (bottom). Symbols as in Fig. 2.
7V. Leoni et al. / Molecular Genetics and Metabolism xxx (2012) xxx–xxx
Please cite this article as: V. Leoni, et al., Metabolic consequences of mitochondrial coenzyme A deficiency in patients with PANK2mutations,Mol. Genet. Metab. (2012), doi:10.1016/j.ymgme.2011.12.005

synthesized, they are conjugated to either taurine or glycine [28,29].This conjugation requires activation of the primary bile acids by bileacid CoA ligase (BAL) using ATP and CoA, prior to coupling withtaurine or glycine (Fig. 4a). Reduced levels of these tauro- andglyco-conjugated bile acids were observed in patient plasma(Fig. 4). The reduced levels of tauro- and glyco-conjugated bile acidsreported here could be due either to a reduction of available CoA orto reduced cholesterol synthesis. Along with eliminating cholesterolfrom the body, bile acids facilitate emulsion and uptake of lipids andfat-soluble vitamins in the intestine, as well as reduction of thebacterial flora found in the small intestine and biliary tract [30].Moreover, bile acids have recently been identified as potentialsignaling molecules [31].
A low abundance of conjugated bile acids could be responsible formalabsorption of cholesterol and fat-soluble vitamins from the intestine,possibly explaining the lower levels of some lipids detected in patientscompared to controls (Fig. 1). We also observed low patients plasmalevels of plantosterols (campesterol and sitosterol), considered markersof cholesterol absorption [22], suggesting that absorption of nutrientsfrom the intestine is indeed impaired in these patients. This is furthercorroborated by the observation that plantosterol levels were notdifferent between patients and controls under fasting conditions. It isformally possible that some of the clinical features of PKAN are due tonutritional and vitamin deficiencies related to this malabsorption.Based on the current results, we hypothesize that food supplementationwith fat-soluble vitamins may ameliorate some of the pathologyobserved in these patients.
The newly identified alterations in cholesterol and bile acidmetabolism are interesting in the context of similar findings inother neurological disorders. Over 25% of total body cholesterol islocalized to the brain, where it is necessary for maturation of thecentral nervous system and participates in several key neurologicalprocesses including membrane trafficking, neurite overgrowth,synaptic transmission and synaptogenesis [32–34]. Reduced levelsof the cholesterol precursors lathosterol and lanosterol have alsobeen described in fibroblasts [35] and plasma [36,37] from humanswith Huntington's Disease (HD), as well as in the brains of rodentHD models [38,39]. Reduced levels of plasma lanosterol and lathos-terol have also been reported in patients with cognitive impairmentand Alzheimer's disease [18]. Disturbances of cholesterol metabolismwere found to affect the cleavage of Amyloid Precursor Protein in cel-lular models of Alzheimer's disease, favoring the formation and depo-sition of the amyloidogenic fragment Aβ1-42 [40]. Finally, one of thetypical clinical features of PKAN is the presence of axonal spheroids inthe central nervous system. These spheroids represent swollen ordistended axons, which could be generated by defects in axonaltransport or membrane integrity, integrity that would be disruptedin the context of defective cholesterol biosynthesis [41].
Furthermore, several fatty acids were significantly or nearlysignificantly reduced in fibroblasts derived from PKAN patients(Fig. 6b). These fatty acids, including myristic, palmitic, and oleicacids, constitute the majority of phospholipids in cellular membranes.Stearic acid, an important and abundant FA in cerebroside, was alsoslightly reduced in PKAN patient fibroblasts. Fatty acid biosynthesisis a cytosolic pathway and, similar to cholesterol synthesis, it requiresboth acetyl CoA and malonyl CoA to form stearic acid, the fatty acidthat is further modified in the biogenesis of several classes of lipids.This acetyl CoA also comes from the mitochondrion in the form ofcitrate. In combination with the reduced plasma levels of severalTAGs and phospholipids in PKAN patients, this data suggests animpairment of fatty acid synthesis that might cause deficiencies inseveral classes of lipids.
Finally, we found reduced levels of certain sphingomyelin speciesin plasma. Sphingomyelins are the principal component of the myelinsheath wrapping the axons of neuronal cells. It is now recognized thatsphingomyelin and cholesterol have a high affinity for each other and
are usually located together in membranes, in specific sub-domainscalled “lipid rafts.” In addition, recent evidence suggests that sphingo-myelin and cholesterol metabolism are closely integrated [42]. Ourresults are in agreement with a 2005 report by Kotzbauer et al. [43]and suggest that alterations of mitochondrial and lipid metabolismmay play a crucial role in the pathogenesis of PKAN, and possibly inother forms of NBIA. Consistent with the idea that low CoA disruptslipid homeostasis, lipid dysregulation was also observed in DrosophilaCoA mutants, including dPANK/fbl [44].
In conclusion,we have used globalmetabolic profiling to explore themetabolic consequences of mutations in pantothenate kinase 2 that areresponsible for Pantothenate Kinase-Associated Neurodegeneration, arare inborn error of metabolism with devastating consequences foraffected individuals. This report highlights novel findings about PKANpatients with potential therapeutic relevance, and more generallyillustrates the utility of global metabolic profiling as a tool forsystematically exploring the biochemical basis of rare genetic syndromes.
Funding
The financial support of Mariani Foundation of Milan [grant no. R-10-84 to V.T.] is gratefully acknowledged. S.D. is supported by theItalian Foundation AISNAF (Associazione Italiana Sindromi Neurode-generative Accumulo di Ferro). This work was supported by the Ital-ian Minister of Health, Fondi per giovani Ricercatori 2008, to V. L.We thank the Cell line and DNA bank of paediatric movementdisorders of the Telethon Genetic Biobank Network [project no.GTB07001] and the Bank for the Diagnosis and Research of MovementDisorders (MDB) of the EuroBiobank. L.S. was supported by agraduate student research fellowship from the National ScienceFoundation [Grant DGE — 0644491]. This work was supported by agrant from the Broad Institute Scientific Planning and Allocation ofResources Committee, by a gift from the Nestle Research Center tothe Broad Institute, and by a grant [R01DK081457] from the NationalInstitutes of Health to V.K.M.
Supplementary materials related to this article can be foundonline at doi:10.1016/j.ymgme.2011.12.005
Conflict of interest statementAll Authors disclose no conflict of interest.
Acknowledgments
We would like to thank Mohit Jain and Oded Shaham for helpfuldiscussions.
References
[1] M.A. Kurian, A.McNeill, J.P. Lin, E.R.Maher, Childhood disorders of neurodegenerationwith brain iron accumulation (NBIA), Dev. Med. Child Neurol. 53 (2011) 394–404.
[2] A. McNeill, D. Birchall, S.J. Hayflick, A. Gregory, J.F. Schenk, E.A. Zimmerman, H.Shang, H. Miyajima, P.F. Chinnery, T2* and FSE MRI distinguishes four subtypesof neurodegeneration with brain iron accumulation, Neurology 70 (2008)1614–1619.
[3] A. Gregory, B.J. Polster, S.J. Hayflick, Clinical and genetic delineation of neurode-generation with brain iron accumulation, J. Med. Genet. 46 (2009) 73–80.
[4] R. Spector, C.E. Johanson, Vitamin transport and homeostasis in mammalianbrain: focus on Vitamins B and E, J. Neurochem. 103 (2007) 425–438.
[5] M. Daugherty, B. Polanuyer, M. Farrell, M. Scholle, A. Lykidis, V. De Crécy-Lagard,A. Osterman, Complete reconstitution of the human coenzyme A biosyntheticpathway via comparative genomics, J. Biol. Chem. 77 (2002) 21431–21439.
[6] K. Hörtnagel, H. Prokisch, T. Meitinger, An isoform of hPANK2, deficient inpantothenate kinase-associated neurodegeneration, localizes to mitochondria,Hum. Mol. Genet. 12 (2003) 321–327.
[7] S. Skrede, O. Halvorsen, Mitochondrial biosynthesis of coenzyme A, Biochem.Biophys. Res. Commun. 91 (1979) 1536–1542.
[8] K. Siudeja, B. Srinivasan, L. Xu, A. Rana, J. De Jong, E.A.A. Nollen, S. Jackowski, L.Sanford, S. Hayflick, O.C.M. Sibon, Impaired Coenzyme Ametabolism affects histoneand tubulin acetylation inDrosophila and human cell models of pantothenate kinaseassociated neurodegeneration, EMBO Mol. Med. 3 (2011) 1–12.
8 V. Leoni et al. / Molecular Genetics and Metabolism xxx (2012) xxx–xxx
Please cite this article as: V. Leoni, et al., Metabolic consequences of mitochondrial coenzyme A deficiency in patients with PANK2mutations,Mol. Genet. Metab. (2012), doi:10.1016/j.ymgme.2011.12.005
[9] Y.M. Kuo, J.L. Duncan, S.K. Westaway, H. Yang, G. Nune, E.Y. Xu, S.J. Hayflick, J.Gitschier, Deficiency of pantothenate kinase 2 (Pank2) in mice leads to retinaldegeneration and azoospermia, Hum. Mol. Genet. 14 (2005) 49–57.
[10] Y. Yang, Z. Wu, Y.M. Kuo, B. Zhou, Dietary rescue of fumble—a Drosophila modelfor pantothenate-kinase-associated neurodegeneration, J. Inherit. Metab. Dis. 28(2005) 1055–1064.
[11] O. Shaham, N.G. Slate, O. Goldberger, Q. Xu, A. Ramanathan, A.L. Souza, C.B. Clish,K.B. Sims, V.K. Mootha, A plasma signature of human mitochondrial diseaserevealed through metabolic profiling of spent media from cultured muscle cells,Proc. Natl. Acad. Sci. U. S. A. 107 (2010) 1571–1575.
[12] G.D. Lewis, L. Farrell, M.J. Wood, M. Martinovic, Z. Arany, G.C. Rowe, A. Souza, S.Cheng, E.L. McCabe, E. Yang, X. Shi, R. Deo, F.P. Roth, A. Asnani, E.P. Rhee, D.M.Systrom, M.J. Semigran, R.S. Vasan, S.A. Carr, T.J. Wang, M.S. Sabatine, C.B. Clish,R.E. Gerszten, Metabolic signatures of exercise in human plasma, Sci. Transl.Med. 2 (2010) 33–37.
[13] T.J. Wang, M.G. Larson, R.S. Vasan, S. Cheng, E.P. Rhee, E. McCabe, G.D. Lewis, C.S.Fox, P.F. Jacques, C. Fernandez, C.J. O'Donnell, S.A. Carr, V.K. Mootha, J.C. Florez, A.Souza, O. Melander, C.B. Clish, R.E. Gerszten, Metabolite profiles and the risk ofdeveloping diabetes, Nat. Med. 17 (2011) 448–453.
[14] E.P. Rhee, S. Cheng, M.G. Larson, G.A. Walford, G.D. Lewis, E. McCabe, E. Yang, L.Farrell, C.S. Fox, C.J. O'Donnell, S.A. Carr, R.S. Vasan, J.C. Florez, C.B. Clish, T.J.Wang, R.E. Gerszten, Lipid profiling identifies a triacylglycerol signature of insulinresistance and improves diabetes prediction in humans, J. Clin. Invest. 121 (2011)1402–1411.
[15] F. Noll, in: H.U. Bergmeyer (Ed.), Methods of Enzymatic Analysis, vol. III, VerlagChemie, Weinheim/Academic Press, Inc., New York, 1974, pp. 1475–1479.
[16] R. Mineri, M. Rimoldi, A.B. Burlina, S. Koskull, C. Perletti, B. Heese, U. Von Döbeln,P. Mereghetti, I. Di Meo, F. Invernizzi, M. Zeviani, G. Uziel, V. Tiranti, Identificationof new mutations in the ETHE1 gene in a cohort of 14 patients presenting withethylmalonic encephalopathy, J. Med. Genet. 45 (2008) 473–478.
[17] V. Leoni, C. Mariotti, S.J. Tabrizi, M. Valenza, E.J. Wild, S.M. Henley, N.Z. Hobbs,M.L. Mandelli, M. Grisoli, I. Björkhem, E. Cattaneo, S. Di Donato, Plasma 24S-hydroxycholesterol and caudate MRI in pre-manifest and early Huntington'sdisease, Brain 131 (2008) 2851–2859.
[18] A. Solomon, V. Leoni, M. Kivipelto, A. Besga, A.R. Oksengård, P. Julin, L. Svensson,L.O. Wahlund, N. Andreasen, B. Winblad, H. Soininen, I. Björkhem, Plasma levelsof 24S-hydroxycholesterol reflect brain volumes in patients without objectivecognitive impairment but not in those with Alzheimer's disease, Neurosci. Lett.462 (2009) 89–93.
[19] Y. Benjamini, D. Yekutieli, Quantitative trait Loci analysis using the false discoveryrate, Genetics 171 (2005) 783–790.
[20] E. Morava, L. Van Den Heuvel, F. Hol, M.C. De Vries, M. Hogeveen, R.J. Rodenburg,J.A. Smeitink, Mitochondrial disease criteria: diagnostic applications in children,Neurology 67 (2006) 1823–1826.
[21] H.J. Kempen, J.F. Glatz, J.A. Gevers Leuven, H.A. Van Der Voort, M.B. Katan, Serumlathosterol concentration is an indicator of whole-body cholesterol synthesis inhumans, J. Lipid Res. 29 (1988) 1149–1155.
[22] S. Baumgartner, R.P. Mensink, J. Plat, Plant sterols and stanols in the treatment ofdyslipidemia: new insights into targets and mechanisms related to cardiovascularrisk, Curr. Pharm. Des. 17 (2011) 922–932.
[23] D. Yildiz, Nicotine, its metabolism and an overview of its biological effects, Toxicon43 (2004) 619–632.
[24] K. Bloch, R.B. Clayton, P.B. Schneider, Synthesis of lanosterol in vivo, J. Biol. Chem.224 (1957) 175–183.
[25] N.R. Matthan, M. Raeini-Sarjaz, A.H. Lichtenstein, L.M. Ausman, P.J. Jones, Deuteriumuptake and plasma cholesterol precursor levels correspond asmethods formeasure-
ment of endogenous cholesterol synthesis in hypercholesterolemic women, Lipids35 (2000) 1037–1044.
[26] N.B. Javitt, Bile acid synthesis from cholesterol: regulatory and auxiliarypathways, FASEB J. 8 (1994) 1308–1311.
[27] N.B. Javitt, Cholesterol, hydroxycholesterols, and bile acids, Biochem. Biophys.Res. Commun. 292 (2002) 1147–1153.
[28] M.J. Monte, J.J. Marin, A. Antelo, J. Vazquez-Tato, Bile acids: chemistry, physiology,and pathophysiology, World J. Gastroenterol. 15 (2009) 804–816.
[29] J.Y. Chiang, Bile acids: regulation of synthesis, J. Lipid Res. 50 (2009) 1955–1966.[30] B. Philipp, Bacterial degradation of bile salts, Appl. Microbiol. Biotechnol. 89
(2011) 903–915.[31] C. Thomas, R. Pellicciari, M. Pruzanski, J. Auwerx, K. Schoonjans, Targeting bile-acid
signalling for metabolic diseases, Nat. Rev. Drug Discov. 7 (2008) 678–693.[32] J.M. Dietschy, S.D. Turley, Thematic review series: brain lipids. Cholesterol metabolism
in the central nervous system during early development and in the mature animal, J.Lipid Res. 45 (2004) 1375–1397.
[33] I. Björkhem, S. Meaney, Brain cholesterol: long secret life behind a barrier, Arterioscler.Thromb. Vasc. Biol. 24 (2004) 806–815.
[34] J.P. Liu, Y. Tang, S. Zhou, B.H. Toh, C. McLean, H. Li, Cholesterol involvement in thepathogenesis of neurodegenerative diseases, Mol. Cell. Neurosci. 43 (2010) 33–42.
[35] M. Valenza, D. Rigamonti, D. Goffredo, C. Zuccato, S. Fenu, L. Jamot, A. Strand, A.Tarditi, B. Woodman, M. Racchi, C. Mariotti, S. Di Donato, A. Corsini, G. Bates, R.Pruss, J.M. Olson, S. Sipione, M. Tartari, E. Cattaneo, Dysfunction of the cholesterolbiosynthetic pathway in Huntington's disease, J. Neurosci. 25 (2005) 9932–9939.
[36] V. Leoni, C. Mariotti, L. Nanetti, E. Salvatore, F. Squitieri, A.R. Bentivoglio, M.Bandettini Del Poggio, S. Piacentini, D. Monza, M. Valenza, E. Cattaneo, S. DiDonato, Whole body cholesterol metabolism is impaired in Huntington's disease,Neurosci. Lett. 494 (2011) 245–249.
[37] V. Leoni, C. Caccia, Oxysterols as biomarkers in neurodegenerative diseases,Chem. Phys. Lipids 164 (2011) 515–524.
[38] M. Valenza, V. Leoni, A. Tarditi, C. Mariotti, I. Björkhem, S. Di Donato, E. Cattaneo,Progressive dysfunction of the cholesterol biosynthesis pathway in the R6/2mouse model of Huntington's disease, Neurobiol. Dis. 28 (2007) 133–142.
[39] M. Valenza, V. Leoni, J.M. Karasinska, L. Petricca, J. Fan, J. Carroll, M.A. Pouladi, E.Fossale, H.P. Nguyen, O. Riess, M. MacDonald, C. Wellington, S. Di Donato, M.Hayden, E. Cattaneo, Cholesterol defect is marked across multiple rodent modelsof Huntington's disease and is manifest in astrocytes, J. Neurosci. 30 (2010)10844–10850.
[40] J.R. Prasanthi, A. Huls, S. Thomasson, A. Thompson, E. Schommer, O. Ghribi, Differentialeffects of 24-hydroxycholesterol and 27-hydroxycholesterol on beta-amyloidprecursor protein levels and processing in human neuroblastoma SH-SY5Y cells, Mol.Neurodegener. 6 (2009) 4 1.
[41] J.K. Schweitzer, J.P. Krivda, C. D'Souza-Schorey, Neurodegeneration inNiemann–PickType C disease and Huntington's disease: impact of defects inmembrane trafficking,Curr. Drug Targets 10 (2009) 653–665.
[42] D. Milhas, C.J. Clarke, Y.A. Hannun, Sphingomyelin metabolism at the plasmamembrane: implications for bioactive sphingolipids, FEBS Lett. 584 (2010)1887–1894.
[43] P.T. Kotzbauer, A.C. Truax, J.Q. Trojanowski, V.M. Lee, Altered neuronalmitochondrialcoenzyme A synthesis in neurodegenerationwith brain iron accumulation caused byabnormal processing, stability, and catalytic activity ofmutant pantothenate kinase 2,J. Neurosci. 25 (2005) 689–698.
[44] F. Bosveld, A. Rana, P.E. Van DerWouden, W. Lemstra, M. Ritsema, H.H. Kampinga,O.C. Sibon, De novo CoA biosynthesis is required to maintain DNA integrityduring development of the Drosophila nervous system, Hum. Mol. Genet. 17(2008) 2058–2069.
9V. Leoni et al. / Molecular Genetics and Metabolism xxx (2012) xxx–xxx
Please cite this article as: V. Leoni, et al., Metabolic consequences of mitochondrial coenzyme A deficiency in patients with PANK2mutations,Mol. Genet. Metab. (2012), doi:10.1016/j.ymgme.2011.12.005
Related Documents