A&A 519, A2 (2010) DOI: 10.1051/0004-6361/201014539 c ESO 2010 Astronomy & Astrophysics Molecular gas chemistry in AGN II. High-resolution imaging of SiO emission in NGC 1068: shocks or XDR? S. García-Burillo 1 , A. Usero 1 , A. Fuente 1 , J. Martín-Pintado 2 , F. Boone 3 , S. Aalto 4 , M. Krips 5 , R. Neri 5 , E. Schinnerer 6 , and L. J. Tacconi 7 1 Observatorio Astronómico Nacional (OAN)-Observatorio de Madrid, Alfonso XII 3, 28014-Madrid, Spain e-mail: [s.gburillo;a.usero;a.fuente]@oan.es 2 Centro de Astrobiología (CSIC-INTA), Ctra de Torrejón a Ajalvir, km 4, 28850 Torrejón de Ardoz, Madrid, Spain e-mail: [email protected] 3 Observatoire de Paris, LERMA, 61 Av. de l’Observatoire, 75014 Paris, France e-mail: [email protected] 4 Department of Radio and Space Science with Onsala Observatory, Chalmers University of Technology, 439 94 Onsala, Sweden e-mail: [email protected] 5 Institut de Radio Astronomie Millimétrique (IRAM), 300 rue de la Piscine, Domaine Universitaire de Grenoble, 38406 St. Martin d’Hères, France e-mail: [email protected] 6 Max-Planck-Institut für Astronomie, Königstuhl 17, 69117 Heidelberg, Germany e-mail: [email protected] 7 Max-Planck-Institut für extraterrestrische Physik, Postfach 1312, 85741 Garching, Germany e-mail: [email protected] Received 30 March 2010 / Accepted 7 May 2010 ABSTRACT Context. This paper is part of a multi-species survey of line emission from the molecular gas in the circum-nuclear disk (CND) of the Seyfert 2 galaxy NGC 1068. Unlike in other active galaxies, the intensely star-forming regions in NGC 1068 and the CND can be resolved with current instrumentation. This makes this galaxy an optimal test-bed to probe the effects of AGN on the molecular medium at ∼100 pc scales. Aims. Single-dish observations have provided evidence that the abundance of silicon monoxide (SiO) in the CND of NGC 1068 is enhanced by 3–4 orders of magnitude with respect to the values typically measured in quiescent molecular gas in the Galaxy. We aim at unveiling the mechanism(s) underlying the SiO enhancement. Methods. We have imaged the emission of the SiO(2−1) (86.8 GHz) and CN(2−1) (226.8 GHz) lines in NGC 1068 at ∼150 pc and 60 pc spatial resolution with the IRAM Plateau de Bure interferometer (PdBI). We have also obtained complementary IRAM 30 m observations of HNCO and methanol (CH 3 OH) lines. These species are known as tracers of shocks in the Galaxy. Results. SiO is detected in a disk of ∼400 pc size around the AGN. SiO abundances in the CND of ∼(1−5) × 10 −9 are about 1−2 orders of magnitude above those measured in the starburst ring. The overall abundance of CN in the CND is high: ∼(0.2−1) × 10 −7 . The abundances of SiO and CN are enhanced at the extreme velocities of gas associated with non-circular motions close to the AGN (r < 70 pc). On average, HNCO/SiO and CH 3 OH/SiO line ratios in the CND are similar to those measured in prototypical shocked regions in our Galaxy. Yet the strength and abundance of CN in NGC 1068 can be explained neither by shocks nor by photon- dominated region (PDR) chemistry. Abundances measured for CN and SiO and the correlation of CN/CO and SiO/CO ratios with hard X-ray irradiation suggest that the CND of NGC 1068 has become a giant X-ray-dominated region (XDR). Conclusions. The extreme properties of molecular gas in the circum-nuclear molecular disk of NGC 1068 result from the interplay between different processes directly linked to nuclear activity. The results presented here highlight in particular the footprint of shocks and X-ray irradiation on the properties of molecular gas in this Seyfert. Whereas XDR chemistry offers a simple explanation for CN and SiO in NGC 1068, the relevance of shocks deserves further scrutiny. The inclusion of dust grain chemistry would help solve the controversy regarding the abundances of other molecular species, like HCN, which are under-predicted by XDR models. Key words. galaxies: individual: NGC 1068 – galaxies: ISM – galaxies: kinematics and dynamics – galaxies: nuclei – galaxies: active – radio lines: ISM 1. Introduction Nuclear activity and intense star formation can shape the excita- tion and chemistry of molecular gas in the circum-nuclear disks (CND) of galaxies. The effect of strong radiation fields (UV and X-rays) and the injection of mechanical energy (by gas outflows Based on observations carried out with the IRAM Plateau de Bure Interferometer. IRAM is supported by INSU/CNRS (France), MPG (Germany) and IGN (Spain). or jet-ISM interactions) on molecular gas properties are key in- gredients in the feedback of activity. Molecular line observations can be used to study the nature of the dominant source of energy in galaxies hosting both active galactic nuclei (AGN) and in- tense star formation. Furthermore, nearby galaxies can serve as local templates of distant galaxies, where these phenomena can be deeply embedded. Some of the tracers of the dense molecular gas phase, which are commonly used in extragalactic research, can be heavily Article published by EDP Sciences Page 1 of 17

Welcome message from author
This document is posted to help you gain knowledge. Please leave a comment to let me know what you think about it! Share it to your friends and learn new things together.
Transcript
A&A 519, A2 (2010)DOI: 10.1051/0004-6361/201014539c© ESO 2010
Astronomy&
Astrophysics
Molecular gas chemistry in AGN
II. High-resolution imaging of SiO emission in NGC 1068: shocks or XDR?�
S. García-Burillo1, A. Usero1, A. Fuente1, J. Martín-Pintado2, F. Boone3, S. Aalto4, M. Krips5, R. Neri5,E. Schinnerer6, and L. J. Tacconi7
1 Observatorio Astronómico Nacional (OAN)-Observatorio de Madrid, Alfonso XII 3, 28014-Madrid, Spaine-mail: [s.gburillo;a.usero;a.fuente]@oan.es
2 Centro de Astrobiología (CSIC-INTA), Ctra de Torrejón a Ajalvir, km 4, 28850 Torrejón de Ardoz, Madrid, Spaine-mail: [email protected]
3 Observatoire de Paris, LERMA, 61 Av. de l’Observatoire, 75014 Paris, Francee-mail: [email protected]
4 Department of Radio and Space Science with Onsala Observatory, Chalmers University of Technology, 439 94 Onsala, Swedene-mail: [email protected]
5 Institut de Radio Astronomie Millimétrique (IRAM), 300 rue de la Piscine, Domaine Universitaire de Grenoble,38406 St. Martin d’Hères, Francee-mail: [email protected]
6 Max-Planck-Institut für Astronomie, Königstuhl 17, 69117 Heidelberg, Germanye-mail: [email protected]
7 Max-Planck-Institut für extraterrestrische Physik, Postfach 1312, 85741 Garching, Germanye-mail: [email protected]
Received 30 March 2010 / Accepted 7 May 2010
ABSTRACT
Context. This paper is part of a multi-species survey of line emission from the molecular gas in the circum-nuclear disk (CND) ofthe Seyfert 2 galaxy NGC 1068. Unlike in other active galaxies, the intensely star-forming regions in NGC 1068 and the CND canbe resolved with current instrumentation. This makes this galaxy an optimal test-bed to probe the effects of AGN on the molecularmedium at ∼100 pc scales.Aims. Single-dish observations have provided evidence that the abundance of silicon monoxide (SiO) in the CND of NGC 1068 isenhanced by 3–4 orders of magnitude with respect to the values typically measured in quiescent molecular gas in the Galaxy. We aimat unveiling the mechanism(s) underlying the SiO enhancement.Methods. We have imaged the emission of the SiO(2−1) (86.8 GHz) and CN(2−1) (226.8 GHz) lines in NGC 1068 at ∼150 pc and60 pc spatial resolution with the IRAM Plateau de Bure interferometer (PdBI). We have also obtained complementary IRAM 30 mobservations of HNCO and methanol (CH3OH) lines. These species are known as tracers of shocks in the Galaxy.Results. SiO is detected in a disk of ∼400 pc size around the AGN. SiO abundances in the CND of ∼(1−5)×10−9 are about 1−2 ordersof magnitude above those measured in the starburst ring. The overall abundance of CN in the CND is high: ∼(0.2−1) × 10−7. Theabundances of SiO and CN are enhanced at the extreme velocities of gas associated with non-circular motions close to the AGN(r < 70 pc). On average, HNCO/SiO and CH3OH/SiO line ratios in the CND are similar to those measured in prototypical shockedregions in our Galaxy. Yet the strength and abundance of CN in NGC 1068 can be explained neither by shocks nor by photon-dominated region (PDR) chemistry. Abundances measured for CN and SiO and the correlation of CN/CO and SiO/CO ratios withhard X-ray irradiation suggest that the CND of NGC 1068 has become a giant X-ray-dominated region (XDR).Conclusions. The extreme properties of molecular gas in the circum-nuclear molecular disk of NGC 1068 result from the interplaybetween different processes directly linked to nuclear activity. The results presented here highlight in particular the footprint of shocksand X-ray irradiation on the properties of molecular gas in this Seyfert. Whereas XDR chemistry offers a simple explanation for CNand SiO in NGC 1068, the relevance of shocks deserves further scrutiny. The inclusion of dust grain chemistry would help solve thecontroversy regarding the abundances of other molecular species, like HCN, which are under-predicted by XDR models.
Key words. galaxies: individual: NGC 1068 – galaxies: ISM – galaxies: kinematics and dynamics – galaxies: nuclei –galaxies: active – radio lines: ISM
1. Introduction
Nuclear activity and intense star formation can shape the excita-tion and chemistry of molecular gas in the circum-nuclear disks(CND) of galaxies. The effect of strong radiation fields (UV andX-rays) and the injection of mechanical energy (by gas outflows
� Based on observations carried out with the IRAM Plateau de BureInterferometer. IRAM is supported by INSU/CNRS (France), MPG(Germany) and IGN (Spain).
or jet-ISM interactions) on molecular gas properties are key in-gredients in the feedback of activity. Molecular line observationscan be used to study the nature of the dominant source of energyin galaxies hosting both active galactic nuclei (AGN) and in-tense star formation. Furthermore, nearby galaxies can serve aslocal templates of distant galaxies, where these phenomena canbe deeply embedded.
Some of the tracers of the dense molecular gas phase, whichare commonly used in extragalactic research, can be heavily
Article published by EDP Sciences Page 1 of 17
A&A 519, A2 (2010)
affected by the feedback of AGN activity. In particular the linesof HCN (the most widely observed tracer of the dense molecularmedium) appear as over-luminous in the CND of many Seyfertgalaxies with respect to other tracers of the dense molecular gas(Tacconi et al. 1994; Kohno et al. 2001; Usero et al. 2004, here-after U04; Krips et al. 2008). Doubts have thus been cast onthe universality of the conversion factor between the luminosityof the HCN(1−0) line, LHCN(1−0), and the mass of dense molec-ular gas in active galaxies (Graciá-Carpio et al. 2006, 2008;García-Burillo et al. 2006; Krips et al. 2008). X-rays can effi-ciently process large column densities of molecular gas aroundAGNs, producing X-ray dominated regions (XDR). It has beenproposed that the abundances of certain ions, radicals and molec-ular species, like HCN, can be enhanced in XDR (Lepp &Dalgarno 1996; Maloney et al. 1996; Meijerink & Spaans 2005;Meijerink et al. 2007). However, it is still controversial whetherpure gas-phase XDR models are able to enhance HCN abun-dances in AGN to the level imposed by observations.
The inclusion of dust grain chemistry, not taken into accountby gas-phase XDR schemes, could solve the HCN controversyin AGN by enhancing the abundance of this molecule. BesidesHCN, other molecular species can also undergo significantchanges in their abundances due to dust grain processing. X-rayscan evaporate small (∼10 Å) silicate grains (Voit 1991). Thiscan increase the Si fraction in the gas phase and then consider-ably enhance the abundance of SiO in X-ray irradiated moleculargas (Martín-Pintado et al. 2000; U04; García-Burillo et al. 2008;Amo-Baladrón et al. 2009). Furthermore, mechanical sputteringof dust grains in molecular shocks is an additional source ofdust grain chemistry. Large SiO abundances have been found inthe nuclei of a number of non-AGN galaxies where interferom-eter maps have been the key to identifying large-scale molecularshocks (García-Burillo et al. 2000, 2001; Usero et al. 2006).
To address the role of X-rays and shocks in shaping thechemistry of molecular gas in AGN requires a multi-speciesapproach. Unlike SiO, other tracers of the dense molecu-lar gas, like CN, are not expected to be highly abundant inshocks (Mitchell 1984; Fuente et al. 2005; Rodríguez-Fernándezet al. 2010). However, there is a consensus supported byobservations and theoretical models that the CN radical is aprivileged tracer of highly ionized molecular gas, typical ofphoton or X-ray-dominated regions (PDR or XDR) (Boger &Sternberg 2005; Fuente et al. 1993, 2008; Janssen et al. 1995;Lepp & Dalgarno 1996; Meijerink & Spaans 2005; Meijerinket al. 2007). Observations of tracers like SiO and CN can thenbe used to quantify the relevance of shocks and XDR chemistryin AGN. Furthermore the high-spatial resolution provided by in-terferometers is paramount to spatially distinguish between thedifferent chemical environments (star formation vs AGN activ-ity) that can coexist in a single galaxy.
NGC 1068 is the strongest nearby Seyfert 2 galaxy, andas such is a prime candidate for studying the feeding andthe feedback of activity using molecular line observations.Tacconi et al. (1994) and Schinnerer et al. (2000, hereafterS00) used the Plateau de Bure Interferometer (PdBI) to mapthe emission of molecular gas in the central r ∼ 1.5−2 kpcdisk at high-resolution (1−4′′) using HCN and CO lines. TheCO maps spatially resolve the distribution of molecular gas inthe disk, showing a prominent starburst ring (hereafter SB ring)of ∼1−1.5 kpc-radius, which significantly contributes to the to-tal CO luminosity of NGC 1068 (see also Planesas et al. 1991;and Baker 2000, hereafter B00). Furthermore, CO emission isdetected in a central r ∼ 200 pc CND surrounding the AGN. Incontrast to CO, emission from the HCN(1−0) line, which is also
spatially resolved in Tacconi et al.’s maps, arises mainly from theCND. Tacconi et al. (1994) derived a high HCN/CO intensity ra-tio (∼1) in the CND. This is about a factor of 5−10 higher thanthe average ratio measured in the SB ring (Usero et al., in prep.).Radiative transfer calculations based on multi-line observationsof HCN and CO showed that the abundance of HCN relativeto CO was significantly enhanced in the CND: HCN/CO∼ 10−3
(Sternberg et al. 1994).Usero et al. (2004) used the IRAM 30 m telescope to ob-
serve with low to moderate spatial resolutions (∼10−30′′) theemission of eight molecular species in the CND of NGC 1068.The global analysis of the survey, which includes several lines ofSiO, CN, HCO, H13CO+, H12CO+, HOC+, HCN, CS, and CO,indicated that the bulk of the molecular gas emission in the CNDof NGC 1068 could be interpreted as coming from a giant XDR.More recently, Pérez-Beaupuits et al. (2007, 2009) analyzed newsingle-dish data obtained for several rotational lines of HCO+,HNC, CN and HCN, and arrived at similar conclusions as U04.However, the low spatial resolution of these single-dish observa-tions are not optimal to precisely distinguish the contributions ofthe starburst and the CND in NGC 1068.
We here use the high-spatial resolution (∼1−3′′) afforded byPdBI to map the emission of the (v = 0, J = 2−1) line of SiO andthe N = 2−1 transition of CN in the central r ∼ 1.5−2 kpc diskof NGC 1068. The spatial resolution of the new observations,one order of magnitude higher than that of the 30 m survey ofU04, allows us to neatly separate the emission of the SB ringfrom that of the CND. Furthermore, the SiO and CN PdBI mapsare used together with complementary single-dish data obtainedin CH3OH and HNCO lines to study the chemical differentia-tion inside the CND through an analysis of line ratio maps. Lineratios are interpreted with the help of one-phase large velocitygradient (LVG) models. While the emission of the different linesand species analyzed here likely comes from regions character-ized by different physical conditions, the adopted one-phase ap-proach allows us to explore the existence of overall trends inthe chemical abundances of these species with a minimum setof free parameters in the fit. We explore the dependence of lineratios with the illumination of molecular gas by the X-ray AGNsource. We also explore the link between shock chemistry andgas kinematics in the CND.
We describe in Sect. 2 the observations, including high-resolution SiO, CN and CO maps obtained with the PdBI, single-dish data obtained with the 30 m telescope as well as X-rayimages taken by Chandra of NGC 1068. Section 3 presents thecontinuum maps derived at 86.8 GHz and 226.8 GHz. The dis-tribution and kinematics of molecular gas derived from SiO andCN are described in Sects. 4 and 5. SiO and CN abundancesare discussed in Sect. 6. In Sect. 7 we interpret the line ra-tio maps in terms of two different chemical scenarios (shocksand XDR). The main conclusions of this work are summa-rized in Sect. 8. We assume a distance to NGC 1068 of D ∼14 Mpc (Bland-Hawthorn et al. 1997); this implies a spatial scaleof ∼70 pc/′′.
2. Observations
2.1. Interferometric maps
Observations of NGC 1068 were carried out with the PdBIarray (Guilloteau et al. 1992) between 2004 December and2005 February. We used the BC configurations and six antennaein dual frequency mode. We simultaneously observed the (v = 0,J = 2−1) line of SiO (at 86.847 GHz) and the N = 2−1 transition
Page 2 of 17

S. García-Burillo et al.: Molecular gas chemistry in AGN. II.
Table 1. Observational parameters of the SiO and CN PdBI data.
SiO CNLine v = 0, J = 2–1 N = 2–1 (J = 5/2–3/2 (HF), J = 3/2–1/2 (LF))Frequency 86.8 GHz 226.9 GHz (HF), 226.7 GHz (LF)Beam 3.5′′ × 2.1′′, PA = 29◦ 1.5′′ × 0.8′′, PA = 19◦1-σ (rms) 1.5 mJy beam−1 (Δν = 2.5 MHz) 7.6 mJy beam−1 (Δν = 6.25 MHz)Field of view 56′′ 21′′
Tmb/S 22 K Jy−1 beam 21 K Jy−1 beam
of CN. The CN(2−1) transition is split up into 18 hyperfine linesblended around three groups (J = 5/2−3/2, J = 3/2−1/2 andJ = 3/2−3/2). We observed the two strongest groups of lines at226.9 GHz (J = 5/2−3/2) and 226.7 GHz (J = 3/2−1/2), here-after referred to as high-frequency (HF) and low-frequency (LF)CN lines, respectively. During the observations the spectral cor-relator was split into two halves centered at 86.800 GHz and226.767 GHz. This choice allowed us to cover the SiO line at3 mm and the CN lines at 1 mm. The J = 1−0 line of H13CO+
(at 86.754 GHz) is simultaneously covered by the 3 mm setup.Rest frequencies were corrected for the recession velocity ini-tially assumed to be v0(HEL) = 1137 km s−1. The correlatorconfiguration covers a bandwidth of 580 MHz for each setup, us-ing four 160 MHz-wide units with an overlap of 20 MHz; this isequivalent to 2000 km s−1(770 km s−1) at 86.8 GHz (226.8 GHz).Observations were conducted in single pointings of sizes 56′′and 21′′ at 3 mm and 1 mm, respectively, centered at α2000 =02h42m40.71s and δ2000 = −00◦00′47.94′′. The latter corre-sponds to the nominal position of the AGN core, as determinedfrom different VLA and VLBI radio continuum images of thegalaxy (e.g., Gallimore et al. 1996). Visibilities were obtainedthrough on-source integration times of 20 min framed by short(∼2 min) phase and amplitude calibrations on the nearby quasars0235+164 and 0336-019. The absolute flux scale in our mapswas derived to a 10% accuracy based on the observations of pri-mary calibrators whose fluxes were determined from a combinedset of measurements obtained at the 30 m telescope and the PdBIarray. The bandpass calibration was carried out using NRAO150and 1749+096 and is accurate to better than 5%.
The image reconstruction was done with the standardIRAM/GILDAS software (Guilloteau & Lucas 2000). We usednatural weighting and no taper to generate the SiO line mapwith a size of 64′′ and 0.25′′/pixel sampling; the correspond-ing synthesized beam is 3.5′′ × 2.1′′, PA = 29◦. We also usednatural weighting to generate the CN map with a size of 32′′and 0.12′′/pixel sampling; this enabled us to achieve a spa-tial resolution of ∼1′′ (1.5′′ × 0.8′′, PA = 19◦). The conver-sion factors between Jy beam−1 and K are 22 K Jy−1 beam at86.8 GHz, and 21 K Jy−1 beam at 226.8 GHz. The point sourcesensitivities were derived from emission-free channels. Theyare 1.5 mJy beam−1 in 2.5 MHz-wide channels at 3 mm, and7.6 mJy beam−1 in 6.25 MHz-wide channels at 1 mm. Images ofthe continuum emission of the galaxy were obtained by averag-ing those channels free of line emission at both frequency ranges.The corresponding point source sensitivities for continuum im-ages are 0.3 mJy beam−1 at 86.8 GHz and 0.7 mJy beam−1
at 226.8 GHz.
We use the 1.8′′ resolution CO(1−0) interferometer maps ofNGC 1068 obtained with the PdBI by S00. We list in Table 1the relevant parameters for the SiO and CN PdBI observationspresented here.
2.2. Single-dish spectra
New CH3OH and HNCO observations of the nucleus ofNGC 1068 were carried out in 2006 July with the IRAM30 m telescope at Pico de Veleta (Spain). We observed the2k−1k group of transitions of CH3OH. This group is a blendedset of four lines. Hereafter we consider the frequency of the20−10A+ line (96.741 GHz) as velocity reference. We observedthe higher frequency group of transitions of methanol at 2 mm(denoted as 3k−2k), a blended set of eight lines. The frequencyof the 30−20A+ line (145.103 GHz) is taken as velocity ref-erence. We also observed the 404−303 rotational transition ofHNCO (hereafter designated as 4−3) at 87.925 GHz. The cor-responding beam sizes of the telescope are ∼28′′ at 3 mm and17′′ at 2 mm. The 3 mm and 2 mm SIS receivers of the 30 mtelescope were tuned to the redshifted frequencies of the linesaround v0(HEL) = 1137 km s−1. The velocity range coveredwas 1600 km s−1 for the 3 mm lines and 900 km s−1 for the 2 mmlines. The wobbler switching mode was used to obtain flat base-lines with a maximum beam throw of 4′.
Typical system temperatures during the observations were∼200 K at 3 mm and ∼300 K at 2 mm. All receivers were usedin single side-band mode (SSB), with a high rejection of the im-age band. The calibration accuracy is better than 20%. Pointingof the 30 m telescope was regularly checked every 1.5 h by ob-serving a nearby continuum source; we found an average rmspointing error of 2−3′′ during the observations.
Throughout the paper line intensities are given in antennatemperature scale, T ∗a . The T ∗a scale relates to the main beamtemperature scale, Tmb, by the equation Tmb = (Feff/Beff)T ∗a ,where Feff and Beff are, respectively, the forward and beam ef-ficiencies of the telescope at a given frequency. For the IRAM30 m telescope Feff/Beff = 1.26 (1.48) at 86 GHz (145 GHz).
3. Continuum maps
Figure 1 shows the continuum maps derived at 86.8 GHz and226.8 GHz in the nucleus of NGC 1068. The morphology ofthe maps is similar to that described by Krips et al. (2006),who observed the continuum emission at the nearby frequen-cies 110 GHz and 230.5 GHz. The emission consists of a centralcomponent (AGN core), a NE elongation (jet), and a SW elonga-tion (counter-jet). The counter-jet and the jet are only detectedat 3 mm.
We used the GILDAS task UV-FIT to fit the continuum vis-ibilities at both frequencies with a set of three point sources.Most of the flux comes from the compact source located at theposition of the VLBI radio core at (Δα, Δδ) ∼ (0′′, 0′′). TheAGN core has a flux of 39.8 ± 0.3 mJy and 16.0 ± 0.7 mJy at86.8 GHz and 226.8 GHz, respectively. The NE jet component isfitted by a point source of 23.8 ± 0.3 mJy at 86.8 GHz, locatedat (Δα, Δδ) = (2.6′′, 3.4′′). The 3 mm counter-jet point source
Page 3 of 17
A&A 519, A2 (2010)
Fig. 1. Continuum maps obtained with the PdBI towards the nucleus ofNGC 1068 at 3 mm (grey scale contours: 3%, 5%, 10%, 15%, 25%to 85% in steps of 15% of the maximum = 39.8 mJy beam−1) and1 mm (white contours: 20% to 95% in steps of 15% of the maximum= 14.2 mJy beam−1). The lowest contours correspond to ∼4σ levelsat both frequencies. (Δα, Δδ) – offsets are relative to the phase track-ing center (α2000 = 02h42m40.71s, δ2000 = −00◦00′47.94′′), which co-incides with the position of the AGN (filled square). Black-filled andwhite-filled ellipses show the beams at 3 mm (3.5′′ × 2.1′′ at PA = 29◦)and 1 mm (1.5′′ × 0.8′′ at PA = 19◦), respectively.
at (Δα, Δδ) = (−1.6′′, −4.0′′) has a flux of 4.7 ± 0.3 mJy. Thereare nevertheless hints of extended emission, mostly at 3 mm,which are not fully accounted for by the point source fitting(Krips et al. 2006). Taking into account the differences in fre-quency, spatial resolution and fitting functions used, the solutiondescribed above agrees with that found by Krips et al. (2006, seetheir Table 1 for a detailed description).
4. Molecular gas distribution
4.1. SiO distribution
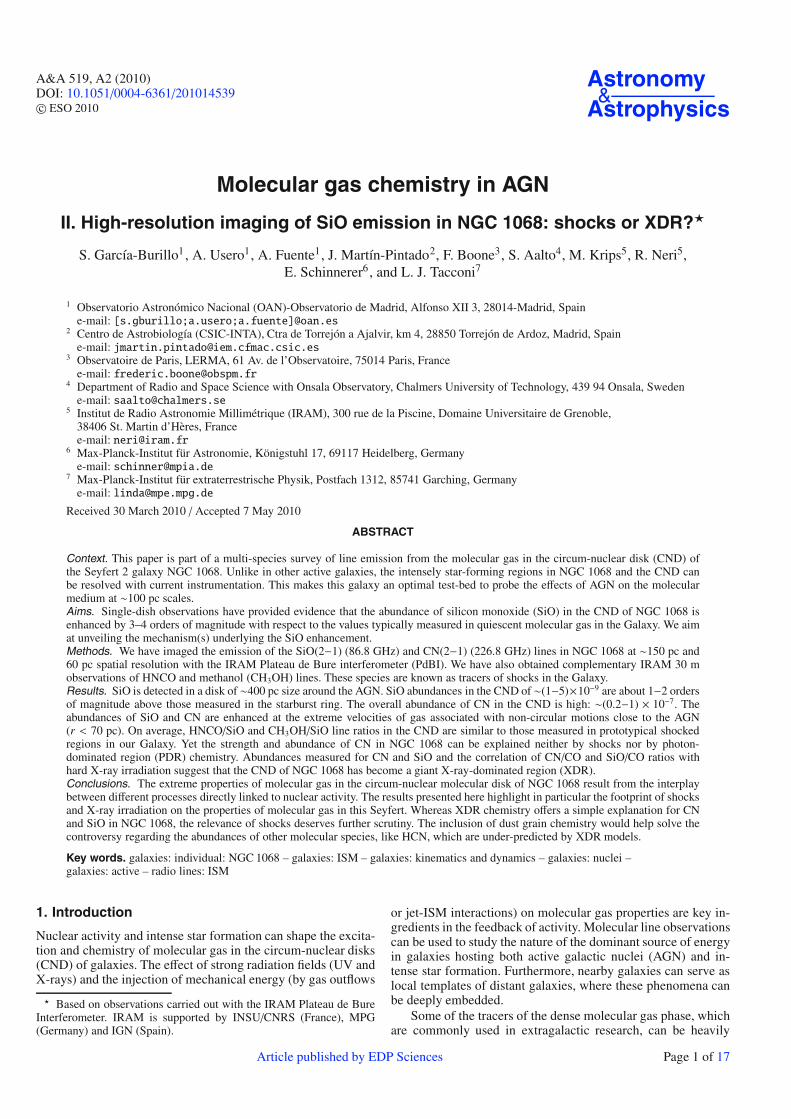
Figure 2 shows the SiO(2−1) intensity map obtained by in-tegrating the emission in velocity channels from v = 967 to1307 km s−1. In this velocity range the line emission is detectedat significant ≥3σ levels on scales larger than the beam insidethe PdBI field of view. We overlay the SiO(2−1) map on theCO(1−0) map of S00. The CO map fairly represents the overallmolecular gas distribution in NGC 1068. Schinnerer et al. (2000)estimated that the CO PdBI map recovers �80% of the totalflux, based on the comparison between the CO flux measuredby the PdBI and the flux derived from the CO maps obtainedthrough the combination of the BIMA array and NRAO single-dish data of Helfer & Blitz (1995). For the sake of comparison,the spatial resolution of the CO(1−0) map shown in Fig. 2, orig-inally ∼1.8′′, was degraded to that of the SiO data. In Fig. 2 wealso compare the SiO map to the morphology of the jet derivedfrom the 3 mm continuum data.
Unlike CO, most of the total SiO emission detected insidethe PdBI primary beam comes from a circum-nuclear moleculardisk located around the AGN, referred to as CND. The integratedflux of SiO in the CND is ∼2 Jy km s−1. This is ∼74% of the to-tal flux detected by U04 at 28′′ spatial resolution with the 30 mtelescope towards the AGN. U04 estimate that �75% of the SiO
Fig. 2. a) (Upper panel) SiO integrated intensity map (contour levelsare 3σ to 12σ in steps of 1σ = 0.082 Jy km s−1 beam−1) is overlaidon the CO(1−0) integrated intensity map of S00 (color scale as shownin units of Jy km s−1 beam−1). b) (Middle panel) The same as a), butwith a zoomed view on the inner 12′′ around the AGN (identified bythe cross). c) (Lower panel) The SiO map contours are overlaid on the3 mm continuum map (color scale) of Fig. 1. The SiO beam is shownin all the panels by an ellipse.
Page 4 of 17

S. García-Burillo et al.: Molecular gas chemistry in AGN. II.
Fig. 3. CN integrated intensity map. Contour levels are 3σ, 4σ, 6σ, 9σ,13σ to 25σ in steps of 6σ, with 1σ = 0.40 Jy km s−1 beam−1. The AGNis identified by the cross and the CN beam is shown by an ellipse.
emission of their AGN spectrum comes from the CND itself,with a residual �25% contribution from the SB ring. Taken to-gether, these estimates indicate that the PdBI recovers practicallyall of the SiO flux in the CND. Little SiO emission is detectedfrom the SB ring in the PdBI map. A few SiO clumps with sizes∼beam and intensities at the 3−4σ level are distributed along theSB ring.
The overall distribution of SiO in the CND, spatially re-solved by the PdBI beam, shows an east-west elongation. Thedeconvolved full size of the emission at a 4σ level is ∼400 pcalong the east-west axis. The CND is marginally resolved alongthe north-south axis; the corresponding deconvolved size is≤150 pc. These sizes are comparable with those derived from thehigher resolution 1−0 and 2−1 CO maps of the CND publishedby S00, as well as with those derived from the CN(2−1) mapdescribed in Sect. 4.2. The SiO emission is slightly asymmetricaround the AGN: the SiO emission peak is at (Δα, Δδ) ∼ (0.5′′,0′′). Instead, the CO map shows a maximum at (Δα, Δδ) ∼ (1.2′′,0′′) (see Fig. 1 of S00). The latter corresponds to the E CO knot,in the notation of S00. The E CO knot is thus shifted ∼50 pc eastrelative to the E SiO knot.
4.2. CN distribution
Both lines of CN (LF and HF, as defined in Sect. 2) are detectedin the CND of NGC 1068. As expected, none of the CN linesare detected towards the SB ring, as this region is located wellbeyond the edge of the primary beam of the PdBI at 226.8 GHz.The HF/LF intensity ratio shows no significant spatial variationinside the CND. The average ratio, ∼1.7, closely agrees with thevalue expected in the limit of optically thin emission (HF/LF ∼1.64 ± 0.14). For the remainder of this paper we will use thehigher S/N ratio maps of the HF line.
Figure 3 shows the intensity map of the HF line of CN(2−1)obtained towards the CND of NGC 1068. We integrated theemission in velocity channels from v = 955 to 1277 km s−1, i.e.,similar to the velocity range used to derive the SiO map. Withthis choice we encompass all significant line emission and atthe same time avoid blending with the LF CN(2−1) line. At this
spatial resolution (∼1′′) the overall morphology of the CNDtraced by CN roughly resembles that seen in CO lines. Atclose sight there are noticeable differences between these trac-ers, though. The two CN knots, connected by a bridge of emis-sion on the northern side of the CND, lie at (Δα, Δδ) ∼ (0.9′′,0′′) and (Δα, Δδ) ∼ (−1.7′′, −0.5′′). As for SiO, the CN knotlocated east is significantly closer to the AGN compared to thecorresponding CO knot.
5. Molecular gas kinematics
5.1. Background from previous work
The overall kinematics of molecular gas in the disk of NGC 1068were modeled by S00 and B00. One of the scenarios advancedby S00 invokes two embedded bars: an outer oval and a nuclearbar of ∼17 kpc and 2.5 kpc deprojected diameters, respectively.The two bars are coupled through resonance overlapping, so thatthe corotation of the nuclear bar coincides with the outer innerLindblad resonance (ILR) of the oval. The gas response insider ∼ 5′′ (350 pc), a region that encompasses the whole CNDdetected in SiO and CN, would lie between the ILRs of the nu-clear bar.
Schinnerer et al. (2000) and B00 also proposed a nuclearwarp model to alternatively account for the anomalous kinemat-ics of molecular gas in the CND. The non-coplanar gas responsein the nuclear region could have been caused by the interactionof the molecular disk with the jet or with the associated ioniza-tion cone. Baker’s model proposes a warped molecular disk thatevolves from a low inclination (i ∼ 30◦) at r ∼ 2.5′′ to a highly-inclined disk (i ∼ 77◦) at r ∼ 0.5′′. This configuration naturallyexplains the steep velocity gradient (high velocities) measuredin the major axis position-velocity (p-v) diagram of CO at smallradii (r ≤ 2′′). In particular, S00 favor a hybrid model wherethe gas response to the bar is combined with a nuclear warp.Besides being able to reasonably fit the gas kinematics, the mainadvantage of the hybrid solution over the pure bar model is thatthe first explains the asymmetric excitation of molecular gas ev-idenced by the remarkably different R = 2−1/1−0 line ratiosmeasured in the east and the west CO lobes. Baker (2000) ar-gues that the east lobe with the higher R corresponds to the di-rectly X-ray illuminated surface of a warped disk, whereas thewest lobe corresponds to the back of the warped disk, character-ized by a lower R. The illumination of the CND gas by X-raysmay also explain the particular chemistry of molecular cloudsanalyzed in Sect. 6.2.
The kinematics of molecular gas in the inner r ∼ 50 pcregion are also complex, as recently revealed by the 2.12 μmH2 1−0 S(1) map of Müller-Sánchez et al. (2009). These data,mostly sensitive to hot (TK � 103 K) and moderately dense(n(H2) � 103 cm−3) molecular gas, show a structure thatbridges the CND and the central engine. This connection is madethrough highly elliptical streamers detected in H2 lines. Davieset al. (2008) used these data to study the large-scale kinematicsof molecular gas in the CND itself and concluded that the wholeCND is a lopsided ring in expansion (Krips et al., in prep.).The scenario of an expanding ring, first advanced by Galliano& Alloin (2002), could be linked to the onset of a nuclear warpinstability.
5.2. SiO kinematics
Figure 4a shows the isovelocity contour map of the CND ofNGC 1068 derived from SiO. Isovelocities were obtained using
Page 5 of 17
A&A 519, A2 (2010)
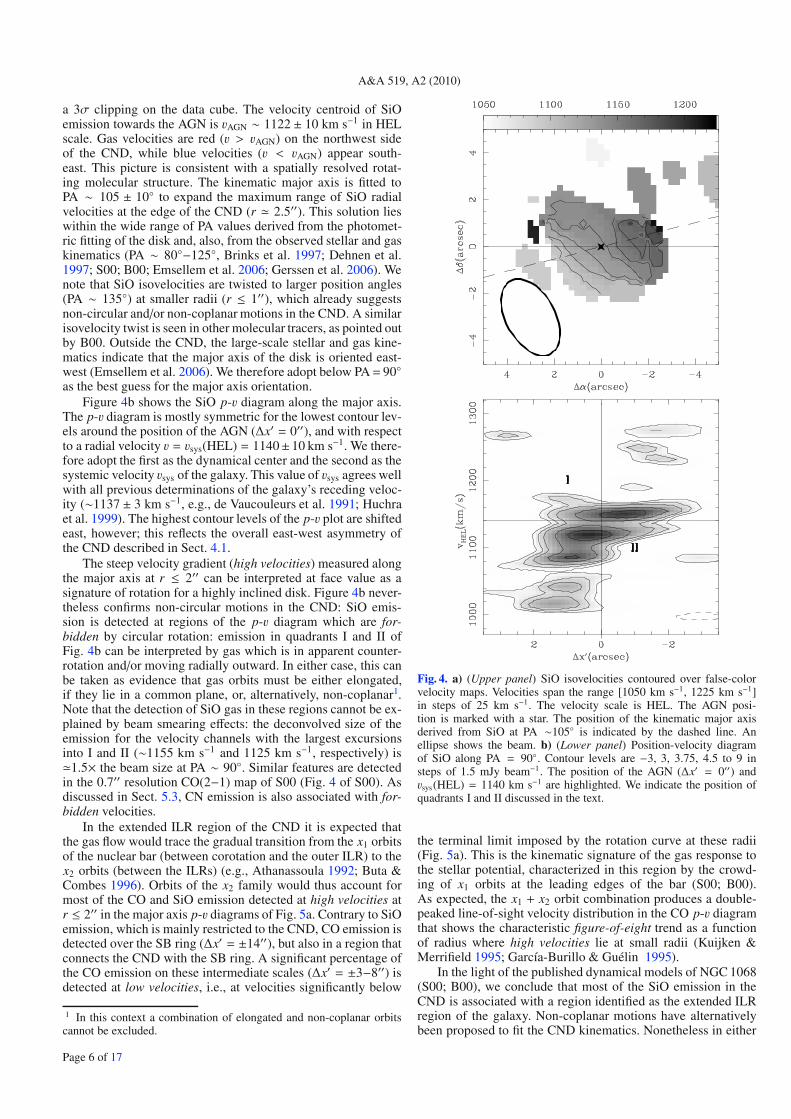
a 3σ clipping on the data cube. The velocity centroid of SiOemission towards the AGN is vAGN ∼ 1122 ± 10 km s−1 in HELscale. Gas velocities are red (v > vAGN) on the northwest sideof the CND, while blue velocities (v < vAGN) appear south-east. This picture is consistent with a spatially resolved rotat-ing molecular structure. The kinematic major axis is fitted toPA ∼ 105 ± 10◦ to expand the maximum range of SiO radialvelocities at the edge of the CND (r � 2.5′′). This solution lieswithin the wide range of PA values derived from the photomet-ric fitting of the disk and, also, from the observed stellar and gaskinematics (PA ∼ 80◦−125◦, Brinks et al. 1997; Dehnen et al.1997; S00; B00; Emsellem et al. 2006; Gerssen et al. 2006). Wenote that SiO isovelocities are twisted to larger position angles(PA ∼ 135◦) at smaller radii (r ≤ 1′′), which already suggestsnon-circular and/or non-coplanar motions in the CND. A similarisovelocity twist is seen in other molecular tracers, as pointed outby B00. Outside the CND, the large-scale stellar and gas kine-matics indicate that the major axis of the disk is oriented east-west (Emsellem et al. 2006). We therefore adopt below PA= 90◦as the best guess for the major axis orientation.
Figure 4b shows the SiO p-v diagram along the major axis.The p-v diagram is mostly symmetric for the lowest contour lev-els around the position of the AGN (Δx′ = 0′′), and with respectto a radial velocity v = vsys(HEL) = 1140±10 km s−1. We there-fore adopt the first as the dynamical center and the second as thesystemic velocity vsys of the galaxy. This value of vsys agrees wellwith all previous determinations of the galaxy’s receding veloc-ity (∼1137 ± 3 km s−1, e.g., de Vaucouleurs et al. 1991; Huchraet al. 1999). The highest contour levels of the p-v plot are shiftedeast, however; this reflects the overall east-west asymmetry ofthe CND described in Sect. 4.1.
The steep velocity gradient (high velocities) measured alongthe major axis at r ≤ 2′′ can be interpreted at face value as asignature of rotation for a highly inclined disk. Figure 4b never-theless confirms non-circular motions in the CND: SiO emis-sion is detected at regions of the p-v diagram which are for-bidden by circular rotation: emission in quadrants I and II ofFig. 4b can be interpreted by gas which is in apparent counter-rotation and/or moving radially outward. In either case, this canbe taken as evidence that gas orbits must be either elongated,if they lie in a common plane, or, alternatively, non-coplanar1.Note that the detection of SiO gas in these regions cannot be ex-plained by beam smearing effects: the deconvolved size of theemission for the velocity channels with the largest excursionsinto I and II (∼1155 km s−1 and 1125 km s−1, respectively) is�1.5× the beam size at PA ∼ 90◦. Similar features are detectedin the 0.7′′ resolution CO(2−1) map of S00 (Fig. 4 of S00). Asdiscussed in Sect. 5.3, CN emission is also associated with for-bidden velocities.
In the extended ILR region of the CND it is expected thatthe gas flow would trace the gradual transition from the x1 orbitsof the nuclear bar (between corotation and the outer ILR) to thex2 orbits (between the ILRs) (e.g., Athanassoula 1992; Buta &Combes 1996). Orbits of the x2 family would thus account formost of the CO and SiO emission detected at high velocities atr ≤ 2′′ in the major axis p-v diagrams of Fig. 5a. Contrary to SiOemission, which is mainly restricted to the CND, CO emission isdetected over the SB ring (Δx′ = ±14′′), but also in a region thatconnects the CND with the SB ring. A significant percentage ofthe CO emission on these intermediate scales (Δx′ = ±3−8′′) isdetected at low velocities, i.e., at velocities significantly below
1 In this context a combination of elongated and non-coplanar orbitscannot be excluded.
Fig. 4. a) (Upper panel) SiO isovelocities contoured over false-colorvelocity maps. Velocities span the range [1050 km s−1, 1225 km s−1]in steps of 25 km s−1. The velocity scale is HEL. The AGN posi-tion is marked with a star. The position of the kinematic major axisderived from SiO at PA ∼105◦ is indicated by the dashed line. Anellipse shows the beam. b) (Lower panel) Position-velocity diagramof SiO along PA = 90◦. Contour levels are −3, 3, 3.75, 4.5 to 9 insteps of 1.5 mJy beam−1. The position of the AGN (Δx′ = 0′′) andvsys(HEL) = 1140 km s−1 are highlighted. We indicate the position ofquadrants I and II discussed in the text.
the terminal limit imposed by the rotation curve at these radii(Fig. 5a). This is the kinematic signature of the gas response tothe stellar potential, characterized in this region by the crowd-ing of x1 orbits at the leading edges of the bar (S00; B00).As expected, the x1 + x2 orbit combination produces a double-peaked line-of-sight velocity distribution in the CO p-v diagramthat shows the characteristic figure-of-eight trend as a functionof radius where high velocities lie at small radii (Kuijken &Merrifield 1995; García-Burillo & Guélin 1995).
In the light of the published dynamical models of NGC 1068(S00; B00), we conclude that most of the SiO emission in theCND is associated with a region identified as the extended ILRregion of the galaxy. Non-coplanar motions have alternativelybeen proposed to fit the CND kinematics. Nonetheless in either
Page 6 of 17
S. García-Burillo et al.: Molecular gas chemistry in AGN. II.
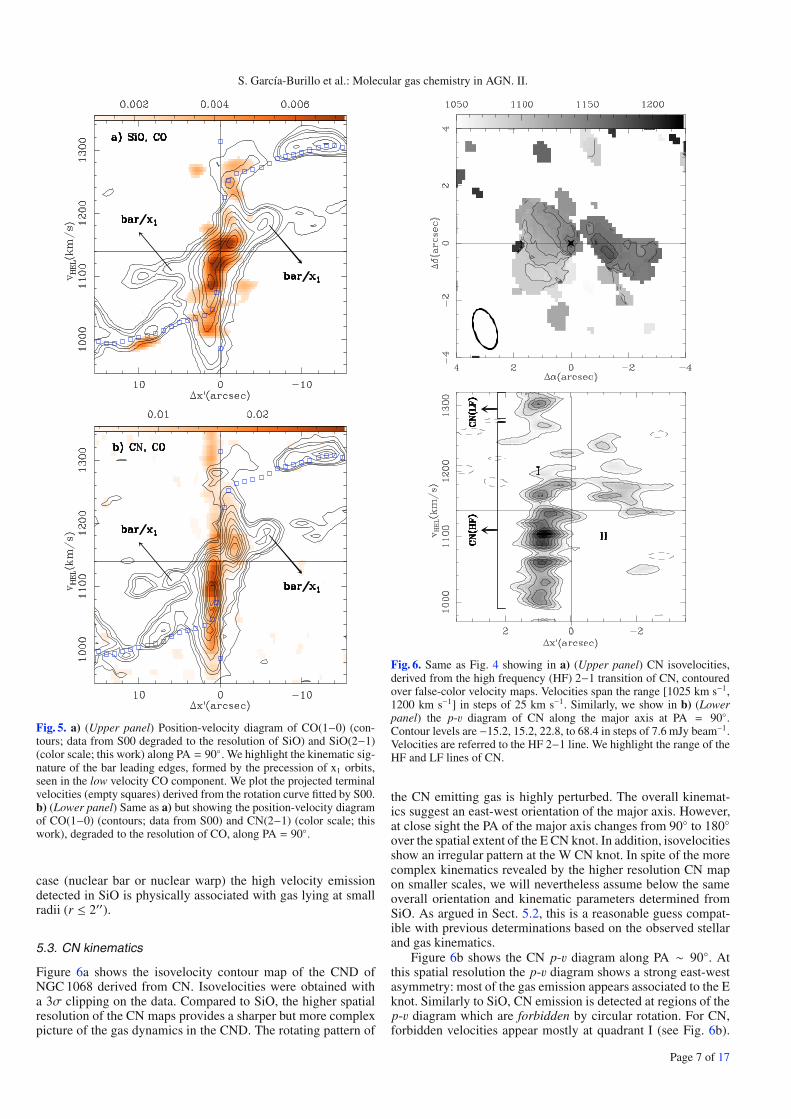
Fig. 5. a) (Upper panel) Position-velocity diagram of CO(1−0) (con-tours; data from S00 degraded to the resolution of SiO) and SiO(2−1)(color scale; this work) along PA = 90◦. We highlight the kinematic sig-nature of the bar leading edges, formed by the precession of x1 orbits,seen in the low velocity CO component. We plot the projected terminalvelocities (empty squares) derived from the rotation curve fitted by S00.b) (Lower panel) Same as a) but showing the position-velocity diagramof CO(1−0) (contours; data from S00) and CN(2−1) (color scale; thiswork), degraded to the resolution of CO, along PA = 90◦.
case (nuclear bar or nuclear warp) the high velocity emissiondetected in SiO is physically associated with gas lying at smallradii (r ≤ 2′′).
5.3. CN kinematics
Figure 6a shows the isovelocity contour map of the CND ofNGC 1068 derived from CN. Isovelocities were obtained witha 3σ clipping on the data. Compared to SiO, the higher spatialresolution of the CN maps provides a sharper but more complexpicture of the gas dynamics in the CND. The rotating pattern of
Fig. 6. Same as Fig. 4 showing in a) (Upper panel) CN isovelocities,derived from the high frequency (HF) 2−1 transition of CN, contouredover false-color velocity maps. Velocities span the range [1025 km s−1,1200 km s−1] in steps of 25 km s−1. Similarly, we show in b) (Lowerpanel) the p-v diagram of CN along the major axis at PA = 90◦.Contour levels are −15.2, 15.2, 22.8, to 68.4 in steps of 7.6 mJy beam−1.Velocities are referred to the HF 2−1 line. We highlight the range of theHF and LF lines of CN.
the CN emitting gas is highly perturbed. The overall kinemat-ics suggest an east-west orientation of the major axis. However,at close sight the PA of the major axis changes from 90◦ to 180◦over the spatial extent of the E CN knot. In addition, isovelocitiesshow an irregular pattern at the W CN knot. In spite of the morecomplex kinematics revealed by the higher resolution CN mapon smaller scales, we will nevertheless assume below the sameoverall orientation and kinematic parameters determined fromSiO. As argued in Sect. 5.2, this is a reasonable guess compat-ible with previous determinations based on the observed stellarand gas kinematics.
Figure 6b shows the CN p-v diagram along PA ∼ 90◦. Atthis spatial resolution the p-v diagram shows a strong east-westasymmetry: most of the gas emission appears associated to the Eknot. Similarly to SiO, CN emission is detected at regions of thep-v diagram which are forbidden by circular rotation. For CN,forbidden velocities appear mostly at quadrant I (see Fig. 6b).
Page 7 of 17
A&A 519, A2 (2010)
Due to the higher spatial resolution, the velocity gradient mea-sured along the major axis is ∼a factor of two steeper in CNthan in SiO. Otherwise the two molecular tracers of the CNDshare the same kinematic features, such as the existence of highvelocity emission at small radii (for CN r ≤ 1′′; see Fig. 6b),likely connected to x2 orbits. Like SiO, CN shows no detectableemission at low velocities on intermediate scales (r ≥ 3′′; seeFig. 5b).
6. Molecular abundances
In Sect. 6.1 we use the average SiO/CO and SiO/H13CO+ in-tensity ratios measured in the CND and the SB ring to derivethe global abundance of SiO in the two regions with a one-phaseLVG radiative transfer model. We further analyze in Sect. 6.2 theSiO/CO and CN/CO intensity ratio patterns inside the CND, asderived from the high-resolution PdBI maps. We discuss howthese patterns can be interpreted in terms of different physi-cal/chemical properties of molecular gas in the CND.
6.1. SiO abundances in the CND and the SB ring
We estimated the average SiO/CO velocity-integrated intensityratios (〈RSiO/CO〉) measured in the CND and the SB ring re-gions defined as follows. Based on the CO distribution shownin Fig. 2a, we delimit the SB ring as the region between r ∼ 10′′and r ∼ 20′′ with SiO intensities >2.5σ levels to derive inte-grated values. Similarly, the CND region is defined by a 2.5σclipping on the integrated intensities of the SiO map of Fig. 2b.Intensity units used to derive line ratios are K km s−1 with K inTmb scale. The 〈RSiO/CO〉 ratios are thus equivalent to brightnesstemperature ratios, because the line widths for SiO and CO arecomparable at this spatial resolution.
The maximum ratio in the SB ring corrected by the differentprimary beam attenuation factors is ∼0.004± 0.001, a ratio esti-mated from the average spectrum of the clumps detected in SiO.This is a factor of ∼20 lower than the corresponding ratio aver-aged over the CND, estimated as ∼0.08 ± 0.01. The dichotomybetween the CND and the SB ring is apparent from the remark-ably different 〈RSiO/CO〉 ratios measured in the two regions. Theorigin of this dichotomy could be found in the different physicalconditions or, alternatively, in the different chemical propertiesof molecular gas in these two regions. Below we use a radiativetransfer code to fit the set of available line ratios to distinguishthe contribution of different factors.
6.1.1. LVG model results
To estimate the SiO abundances both in the CND and in the SBring, we adopted a one-phase LVG approach to model the ra-diative transfer of the SiO emission. We used an LVG code totranslate the SiO brightness temperatures into the SiO columndensity per velocity width (NSiO/Δ�) and the volume density ofits collisional partner, H2 (n(H2)), in each cloud. We fed into theLVG code the average SiO(2−1) brightness temperature (fromour PdBI observations) and the average SiO(3−2)/SiO(2−1)velocity-integrated line ratio (from U04), hereafter 〈R32/21〉,measured in each target region. Provided that the 3−2 and2−1 SiO emissions arise from the same clouds in each region,〈R32/21〉 remains independent of the unknown filling factor ηf .To further constrain the model, the gas kinetic temperature wasfixed at 50 K, as obtained by Tacconi et al. (1994) from multi-transition CO observations of the CND. This assumption is not
critical, because the results barely depend on the gas temper-ature below, e.g., 100 K. Quite likely, 100 K is a comfortableupper limit to the average temperature of the SiO-emitting gasin a PdBI beam.
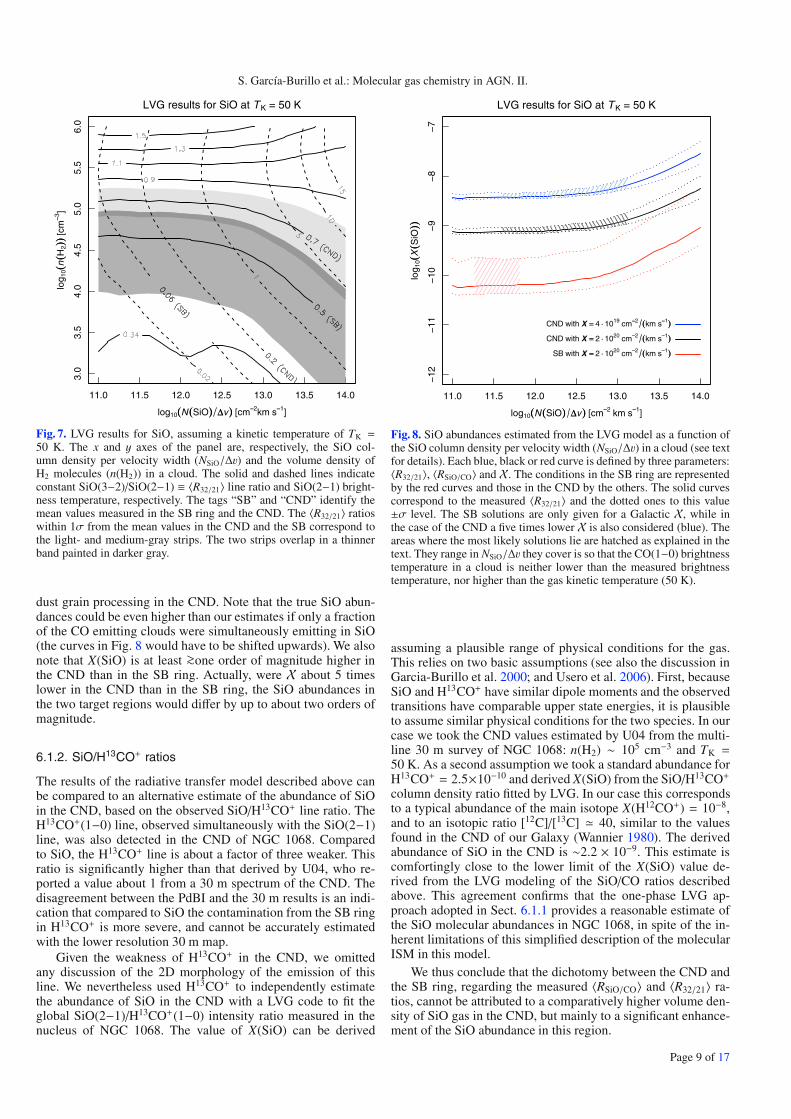
The output of the LVG code is summarized in Fig. 7.Because the filling factors are unknown the possible solutionsfor the CND (SB ring) clouds would lie over the corresponding〈R32/21〉 isocontour, anywhere to the right of the intersect withthe CND (SB ring) SiO(2−1) isocontour (i.e., the lower ηf , thehigher NSiO/Δ� in a cloud). The loci of possible solutions be-come two-dimensional bands once we also consider the uncer-tainties in 〈R32/21〉. The measured 〈R32/21〉 ratios correspond totypical gas densities of ∼105 cm−3 in the CND, while they areabout five times lower in the SB ring.
We searched for a reasonable estimate of the SiO abun-dance with respect to H2 (X(SiO) ≡ NSiO/NH2 ) in the SB ringand the CND. For this we used ancillary CO observations ofNGC 1068 to infer the H2 column density. A full radiativetransfer approach (e.g., LVG) is impossible though in the SBring, because multi-transition CO observations are not avail-able in this region. Alternatively, we used the standard conver-sion between the CO(1−0) integrated intensities and the H2 col-umn densities (NH2 ) given by the so called X factor in thetwo target regions. The X conversion factor is on the order of∼2 × 1020 cm−2/(km s−1) in the Milky Way (Strong et al. 1988),a value which roughly holds true for most nearby galaxies. Weadopted the Galactic X value for the SB ring. It is known thoughthat a lowerX has been found in galaxy centers, where molecularclouds are subject to abnormal conditions (e.g., they are unlikelyto be virialized). In particular,X in the CND of NGC 1068, couldbe ∼5 times lower than the standard value, according to the es-timates of U04, a result which agrees with the findings obtainedin the nuclear disks of other spiral galaxies (e.g., García-Burilloet al. 1993).
Under these assumptions, we proceeded as follows to esti-mate X(SiO) in the SB ring and the CND:
– each target region is characterized by fixed 〈R32/21〉 and〈RSiO/CO〉 values 2, assumed to be independent of the fillingfactor, and by a certain X;
– The measured 〈R32/21〉 allows us to calculate the SiO(2−1)brightness temperature as a function of NSiO/Δ� from the di-agram in Fig. 7;
– NH2/Δ� is proportional to the product of 〈RSiO/CO〉 and theSiO(2−1) brightness temperature. Thus, ultimately, X(SiO)can be expressed in terms of a certain function of NSiO/Δ�parameterized by 〈R32/21〉, 〈RSiO/CO〉 ratios and X;
– the range of values for NSiO/Δ� can be constrained. Thelower limit to NSiO/Δ� corresponds to ηf = 1. On the otherhand, for ηf arbitrarily low, the CO(1−0) brightness temper-atures in a cloud would rise above the assumed kinetic tem-perature (50 K), which cannot occur if CO is collisionallyexcited. This sets an upper limit to NSiO/Δ�.
The end product of this analysis is the plot in Fig. 8. Therewe represent X(SiO) as a function of NSiO/Δ� for the clouds inthe SB ring and the CND. We explored two solutions with Xequal to the standard factor and to a five times lower value inthe CND. In either case, we note that the values of X(SiO) inthe CND, ∼(1−5) × 10−9, are significantly boosted with respectto those typically found in Galactic dark clouds (<∼10−12, e.g.,Ziurys et al. 1989); this result calls for a mechanism of efficient
2 As for 〈R32/21〉, we adopt for 〈RSiO/CO〉 the average values measuredin the SB and the CND.
Page 8 of 17
S. García-Burillo et al.: Molecular gas chemistry in AGN. II.
11.0 11.5 12.0 12.5 13.0 13.5 14.0
3.0
3.5
4.0
4.5
5.0
5.5
6.0
log10((N((SiO)) ΔΔv)) [cm−−2km s−−1]
log 1
0((n((H
2)))) [c
m−−3
]
LVG results for SiO at TK = 50 K
Fig. 7. LVG results for SiO, assuming a kinetic temperature of TK =50 K. The x and y axes of the panel are, respectively, the SiO col-umn density per velocity width (NSiO/Δ�) and the volume density ofH2 molecules (n(H2)) in a cloud. The solid and dashed lines indicateconstant SiO(3−2)/SiO(2−1) ≡ 〈R32/21〉 line ratio and SiO(2−1) bright-ness temperature, respectively. The tags “SB” and “CND” identify themean values measured in the SB ring and the CND. The 〈R32/21〉 ratioswithin 1σ from the mean values in the CND and the SB correspond tothe light- and medium-gray strips. The two strips overlap in a thinnerband painted in darker gray.
dust grain processing in the CND. Note that the true SiO abun-dances could be even higher than our estimates if only a fractionof the CO emitting clouds were simultaneously emitting in SiO(the curves in Fig. 8 would have to be shifted upwards). We alsonote that X(SiO) is at least >∼one order of magnitude higher inthe CND than in the SB ring. Actually, were X about 5 timeslower in the CND than in the SB ring, the SiO abundances inthe two target regions would differ by up to about two orders ofmagnitude.
6.1.2. SiO/H13CO+ ratios
The results of the radiative transfer model described above canbe compared to an alternative estimate of the abundance of SiOin the CND, based on the observed SiO/H13CO+ line ratio. TheH13CO+(1−0) line, observed simultaneously with the SiO(2−1)line, was also detected in the CND of NGC 1068. Comparedto SiO, the H13CO+ line is about a factor of three weaker. Thisratio is significantly higher than that derived by U04, who re-ported a value about 1 from a 30 m spectrum of the CND. Thedisagreement between the PdBI and the 30 m results is an indi-cation that compared to SiO the contamination from the SB ringin H13CO+ is more severe, and cannot be accurately estimatedwith the lower resolution 30 m map.
Given the weakness of H13CO+ in the CND, we omittedany discussion of the 2D morphology of the emission of thisline. We nevertheless used H13CO+ to independently estimatethe abundance of SiO in the CND with a LVG code to fit theglobal SiO(2−1)/H13CO+(1−0) intensity ratio measured in thenucleus of NGC 1068. The value of X(SiO) can be derived
11.0 11.5 12.0 12.5 13.0 13.5 14.0
−12
−11
−10
−9
−8
−7
log10((N((SiO)) ΔΔv)) [cm−−2 km s−−1]lo
g 10((X
((SiO
))))
CND with X == 2 ⋅⋅ 1020 cm−−2 ((km s−−1))CND with X == 4 ⋅⋅ 1019 cm−−2 ((km s−−1))
SB with X == 2 ⋅⋅ 1020 cm−−2 ((km s−−1))
LVG results for SiO at TK = 50 K
Fig. 8. SiO abundances estimated from the LVG model as a function ofthe SiO column density per velocity width (NSiO/Δ�) in a cloud (see textfor details). Each blue, black or red curve is defined by three parameters:〈R32/21〉, 〈RSiO/CO〉 and X. The conditions in the SB ring are representedby the red curves and those in the CND by the others. The solid curvescorrespond to the measured 〈R32/21〉 and the dotted ones to this value±σ level. The SB solutions are only given for a Galactic X, while inthe case of the CND a five times lower X is also considered (blue). Theareas where the most likely solutions lie are hatched as explained in thetext. They range in NSiO/Δ� they cover is so that the CO(1−0) brightnesstemperature in a cloud is neither lower than the measured brightnesstemperature, nor higher than the gas kinetic temperature (50 K).
assuming a plausible range of physical conditions for the gas.This relies on two basic assumptions (see also the discussion inGarcia-Burillo et al. 2000; and Usero et al. 2006). First, becauseSiO and H13CO+ have similar dipole moments and the observedtransitions have comparable upper state energies, it is plausibleto assume similar physical conditions for the two species. In ourcase we took the CND values estimated by U04 from the multi-line 30 m survey of NGC 1068: n(H2) ∼ 105 cm−3 and TK =50 K. As a second assumption we took a standard abundance forH13CO+ = 2.5×10⁻¹⁰ and derived X(SiO) from the SiO/H13CO+
column density ratio fitted by LVG. In our case this correspondsto a typical abundance of the main isotope X(H12CO+) = 10−8,and to an isotopic ratio [12C]/[13C] � 40, similar to the valuesfound in the CND of our Galaxy (Wannier 1980). The derivedabundance of SiO in the CND is ∼2.2 × 10⁻⁹. This estimate iscomfortingly close to the lower limit of the X(SiO) value de-rived from the LVG modeling of the SiO/CO ratios describedabove. This agreement confirms that the one-phase LVG ap-proach adopted in Sect. 6.1.1 provides a reasonable estimate ofthe SiO molecular abundances in NGC 1068, in spite of the in-herent limitations of this simplified description of the molecularISM in this model.
We thus conclude that the dichotomy between the CND andthe SB ring, regarding the measured 〈RSiO/CO〉 and 〈R32/21〉 ra-tios, cannot be attributed to a comparatively higher volume den-sity of SiO gas in the CND, but mainly to a significant enhance-ment of the SiO abundance in this region.
Page 9 of 17
A&A 519, A2 (2010)
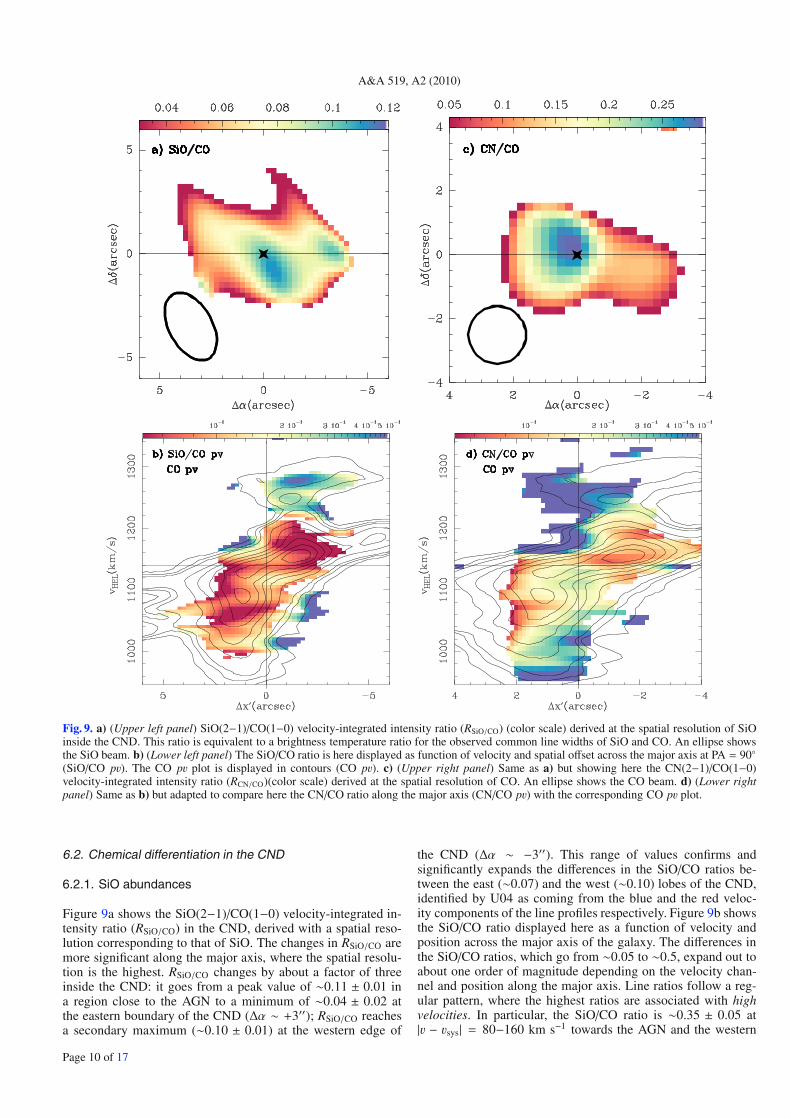
Fig. 9. a) (Upper left panel) SiO(2−1)/CO(1−0) velocity-integrated intensity ratio (RSiO/CO) (color scale) derived at the spatial resolution of SiOinside the CND. This ratio is equivalent to a brightness temperature ratio for the observed common line widths of SiO and CO. An ellipse showsthe SiO beam. b) (Lower left panel) The SiO/CO ratio is here displayed as function of velocity and spatial offset across the major axis at PA = 90◦(SiO/CO pv). The CO pv plot is displayed in contours (CO pv). c) (Upper right panel) Same as a) but showing here the CN(2−1)/CO(1−0)velocity-integrated intensity ratio (RCN/CO)(color scale) derived at the spatial resolution of CO. An ellipse shows the CO beam. d) (Lower rightpanel) Same as b) but adapted to compare here the CN/CO ratio along the major axis (CN/CO pv) with the corresponding CO pv plot.
6.2. Chemical differentiation in the CND
6.2.1. SiO abundances
Figure 9a shows the SiO(2−1)/CO(1−0) velocity-integrated in-tensity ratio (RSiO/CO) in the CND, derived with a spatial reso-lution corresponding to that of SiO. The changes in RSiO/CO aremore significant along the major axis, where the spatial resolu-tion is the highest. RSiO/CO changes by about a factor of threeinside the CND: it goes from a peak value of ∼0.11 ± 0.01 ina region close to the AGN to a minimum of ∼0.04 ± 0.02 atthe eastern boundary of the CND (Δα ∼ +3′′); RSiO/CO reachesa secondary maximum (∼0.10 ± 0.01) at the western edge of
the CND (Δα ∼ −3′′). This range of values confirms andsignificantly expands the differences in the SiO/CO ratios be-tween the east (∼0.07) and the west (∼0.10) lobes of the CND,identified by U04 as coming from the blue and the red veloc-ity components of the line profiles respectively. Figure 9b showsthe SiO/CO ratio displayed here as a function of velocity andposition across the major axis of the galaxy. The differences inthe SiO/CO ratios, which go from ∼0.05 to ∼0.5, expand out toabout one order of magnitude depending on the velocity chan-nel and position along the major axis. Line ratios follow a reg-ular pattern, where the highest ratios are associated with highvelocities. In particular, the SiO/CO ratio is ∼0.35 ± 0.05 at|v − vsys| = 80−160 km s−1 towards the AGN and the western
Page 10 of 17
S. García-Burillo et al.: Molecular gas chemistry in AGN. II.
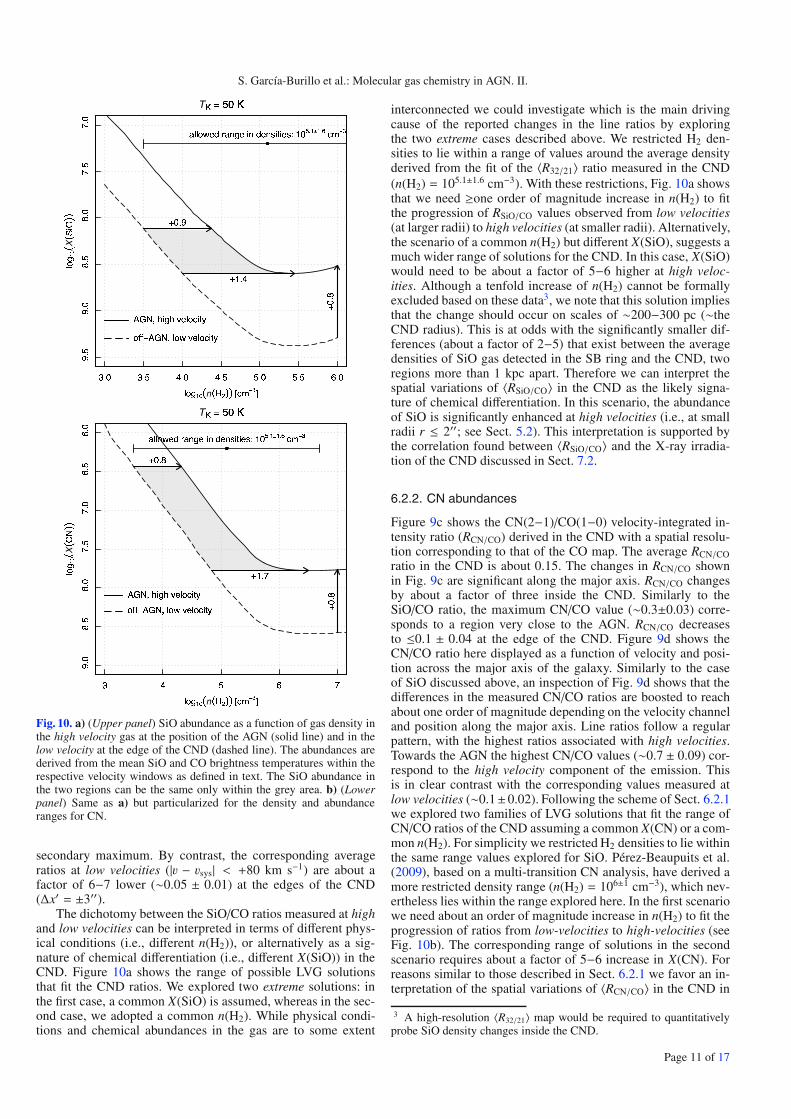
Fig. 10. a) (Upper panel) SiO abundance as a function of gas density inthe high velocity gas at the position of the AGN (solid line) and in thelow velocity at the edge of the CND (dashed line). The abundances arederived from the mean SiO and CO brightness temperatures within therespective velocity windows as defined in text. The SiO abundance inthe two regions can be the same only within the grey area. b) (Lowerpanel) Same as a) but particularized for the density and abundanceranges for CN.
secondary maximum. By contrast, the corresponding averageratios at low velocities (|v − vsys| < +80 km s−1) are about afactor of 6−7 lower (∼0.05 ± 0.01) at the edges of the CND(Δx′ = ±3′′).
The dichotomy between the SiO/CO ratios measured at highand low velocities can be interpreted in terms of different phys-ical conditions (i.e., different n(H2)), or alternatively as a sig-nature of chemical differentiation (i.e., different X(SiO)) in theCND. Figure 10a shows the range of possible LVG solutionsthat fit the CND ratios. We explored two extreme solutions: inthe first case, a common X(SiO) is assumed, whereas in the sec-ond case, we adopted a common n(H2). While physical condi-tions and chemical abundances in the gas are to some extent
interconnected we could investigate which is the main drivingcause of the reported changes in the line ratios by exploringthe two extreme cases described above. We restricted H2 den-sities to lie within a range of values around the average densityderived from the fit of the 〈R32/21〉 ratio measured in the CND(n(H2) = 105.1±1.6 cm−3). With these restrictions, Fig. 10a showsthat we need ≥one order of magnitude increase in n(H2) to fitthe progression of RSiO/CO values observed from low velocities(at larger radii) to high velocities (at smaller radii). Alternatively,the scenario of a common n(H2) but different X(SiO), suggests amuch wider range of solutions for the CND. In this case, X(SiO)would need to be about a factor of 5−6 higher at high veloc-ities. Although a tenfold increase of n(H2) cannot be formallyexcluded based on these data3, we note that this solution impliesthat the change should occur on scales of ∼200−300 pc (∼theCND radius). This is at odds with the significantly smaller dif-ferences (about a factor of 2−5) that exist between the averagedensities of SiO gas detected in the SB ring and the CND, tworegions more than 1 kpc apart. Therefore we can interpret thespatial variations of 〈RSiO/CO〉 in the CND as the likely signa-ture of chemical differentiation. In this scenario, the abundanceof SiO is significantly enhanced at high velocities (i.e., at smallradii r ≤ 2′′; see Sect. 5.2). This interpretation is supported bythe correlation found between 〈RSiO/CO〉 and the X-ray irradia-tion of the CND discussed in Sect. 7.2.
6.2.2. CN abundances
Figure 9c shows the CN(2−1)/CO(1−0) velocity-integrated in-tensity ratio (RCN/CO) derived in the CND with a spatial resolu-tion corresponding to that of the CO map. The average RCN/COratio in the CND is about 0.15. The changes in RCN/CO shownin Fig. 9c are significant along the major axis. RCN/CO changesby about a factor of three inside the CND. Similarly to theSiO/CO ratio, the maximum CN/CO value (∼0.3±0.03) corre-sponds to a region very close to the AGN. RCN/CO decreasesto ≤0.1 ± 0.04 at the edge of the CND. Figure 9d shows theCN/CO ratio here displayed as a function of velocity and posi-tion across the major axis of the galaxy. Similarly to the caseof SiO discussed above, an inspection of Fig. 9d shows that thedifferences in the measured CN/CO ratios are boosted to reachabout one order of magnitude depending on the velocity channeland position along the major axis. Line ratios follow a regularpattern, with the highest ratios associated with high velocities.Towards the AGN the highest CN/CO values (∼0.7 ± 0.09) cor-respond to the high velocity component of the emission. Thisis in clear contrast with the corresponding values measured atlow velocities (∼0.1±0.02). Following the scheme of Sect. 6.2.1we explored two families of LVG solutions that fit the range ofCN/CO ratios of the CND assuming a common X(CN) or a com-mon n(H2). For simplicity we restricted H2 densities to lie withinthe same range values explored for SiO. Pérez-Beaupuits et al.(2009), based on a multi-transition CN analysis, have derived amore restricted density range (n(H2) = 106±1 cm−3), which nev-ertheless lies within the range explored here. In the first scenariowe need about an order of magnitude increase in n(H2) to fit theprogression of ratios from low-velocities to high-velocities (seeFig. 10b). The corresponding range of solutions in the secondscenario requires about a factor of 5−6 increase in X(CN). Forreasons similar to those described in Sect. 6.2.1 we favor an in-terpretation of the spatial variations of 〈RCN/CO〉 in the CND in
3 A high-resolution 〈R32/21〉 map would be required to quantitativelyprobe SiO density changes inside the CND.
Page 11 of 17
A&A 519, A2 (2010)
terms of chemical differentiation. The abundance of CN wouldbe significantly enhanced at high velocities (i.e., at small radiir ≤ 1′′; see Sect. 5.3). This interpretation is also supported bythe correlation found between 〈RCN/CO〉 and the X-ray irradiationof the CND discussed in Sect. 7.2.
7. Molecular gas chemistry in the CND of NGC 1068
Below we consider the pros and cons of two different scenar-ios, shocks and XDR chemistry, regarding their ability to explainthe molecular abundances measured in the CND of NGC 1068for SiO and CN. Complementary information provided by othermolecular tracers is a key for this discussion. Furthermore, weuse the information extracted from the observed kinematics ofthe gas and the relation of the derived molecular abundanceswith the X ray irradiation in the CND.
7.1. Shock chemistry
To explore the prevalence of shock chemistry in the CND ofNGC 1068 we used the IRAM 30 m telescope to observe a setof lines of two molecular tracers of shocks: CH3OH and HNCO.We discuss below the line ratios derived for CH3OH, HNCO,SiO and CN in NGC 1068, and compare these with the ratios de-rived in galactic and extragalactic templates of shock chemistry.We also analyze the potential drivers of shocks in the CND.
7.1.1. Tracers of shocks: CH3OH and HNCO
On theoretical grounds, high abundances of methanol can onlybe produced in gas-phase via evaporation and/or disruption oficy mantles. Fast shocks (vshock > 15−20 km s−1) can destroythe grain cores, liberating refractory elements like Si to the gasphase (Caselli et al. 1997; Schilke et al. 1997). By contrast,slow shocks (vshock < 10−15 km s−1) are able to process theicy grain mantles, but not the grain cores (Millar et al. 1991;Charnley et al. 1995). The different location of Si-bearing ma-terial (cores) and solid-phase CH3OH (mantles) in dust grainsimplies that SiO and CH3OH are good tracers of fast and slowshocks, respectively. It is expected that the disruption of dustgrains by slow shocks can inject grain mantle material intothe molecular ISM without destroying the molecules (Berginet al. 1998; Martín-Pintado et al. 2001). In particular, the abun-dance of methanol is seen to be enhanced in shocks associatedwith molecular outflows by more than two orders of magnitudeover the values typically derived in cold molecular clouds (e.g.,Bachiller & Pérez-Gutiérrez 1997; Pérez-Gutiérrez 1999). In ex-ternal galaxies Meier & Turner (2005) associate over-luminousmethanol lines to shocks in IC 342. The close association be-tween SiO and CH3OH emission in IC 342 discussed by Useroet al. (2006) corroborates this picture.
Although it is still debated which is the main productionmechanism of HNCO, models involving dust grain chemistryseem to be the most successful at increasing the abundancesof HNCO in the gas phase. There is also supporting obser-vational evidence that HNCO is related to shocks. In particu-lar, Zinchenko et al. (2000) finds a good correlation betweenHNCO and SiO lines in dense cores of our Galaxy. Martínet al. (2008) have presented evidence of enhanced HNCO inmolecular clouds suspected to suffer shocks in the GalacticCenter. On larger scales, Meier & Turner (2005) interpret thelarge abundance of HNCO measured in the nuclear spiral struc-ture of IC 342 as due to molecular shocks. In a later study
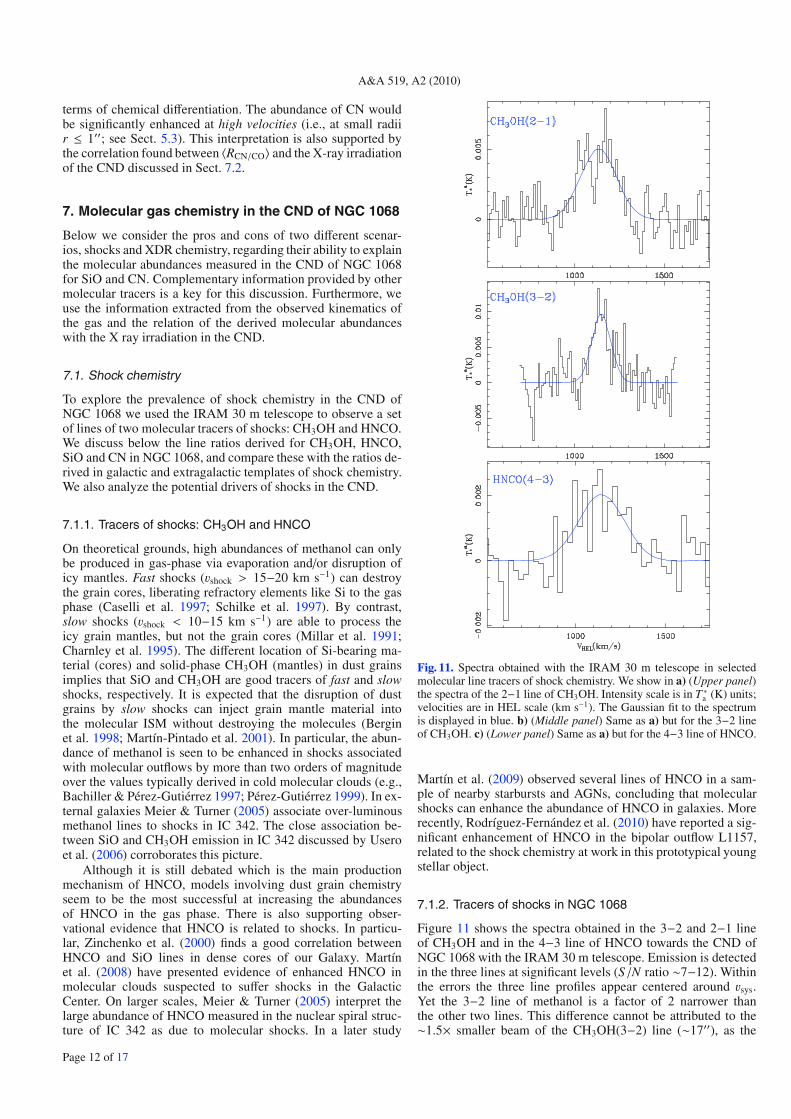
Fig. 11. Spectra obtained with the IRAM 30 m telescope in selectedmolecular line tracers of shock chemistry. We show in a) (Upper panel)the spectra of the 2−1 line of CH3OH. Intensity scale is in T ∗a (K) units;velocities are in HEL scale (km s−1). The Gaussian fit to the spectrumis displayed in blue. b) (Middle panel) Same as a) but for the 3−2 lineof CH3OH. c) (Lower panel) Same as a) but for the 4−3 line of HNCO.
Martín et al. (2009) observed several lines of HNCO in a sam-ple of nearby starbursts and AGNs, concluding that molecularshocks can enhance the abundance of HNCO in galaxies. Morerecently, Rodríguez-Fernández et al. (2010) have reported a sig-nificant enhancement of HNCO in the bipolar outflow L1157,related to the shock chemistry at work in this prototypical youngstellar object.
7.1.2. Tracers of shocks in NGC 1068
Figure 11 shows the spectra obtained in the 3−2 and 2−1 lineof CH3OH and in the 4−3 line of HNCO towards the CND ofNGC 1068 with the IRAM 30 m telescope. Emission is detectedin the three lines at significant levels (S/N ratio ∼7−12). Withinthe errors the three line profiles appear centered around vsys.Yet the 3−2 line of methanol is a factor of 2 narrower thanthe other two lines. This difference cannot be attributed to the∼1.5× smaller beam of the CH3OH(3−2) line (∼17′′), as the
Page 12 of 17
S. García-Burillo et al.: Molecular gas chemistry in AGN. II.
Table 2. Line ratios measured in prototypical regions.
Source CH3OH(2−1)SiO(2−1)
CH3OH(3−2)SiO(3−2)
HNCO(4−3)SiO(2−1)
SiO(2−1)CN(2−1)
CN(2−1)HCN(1−0) References
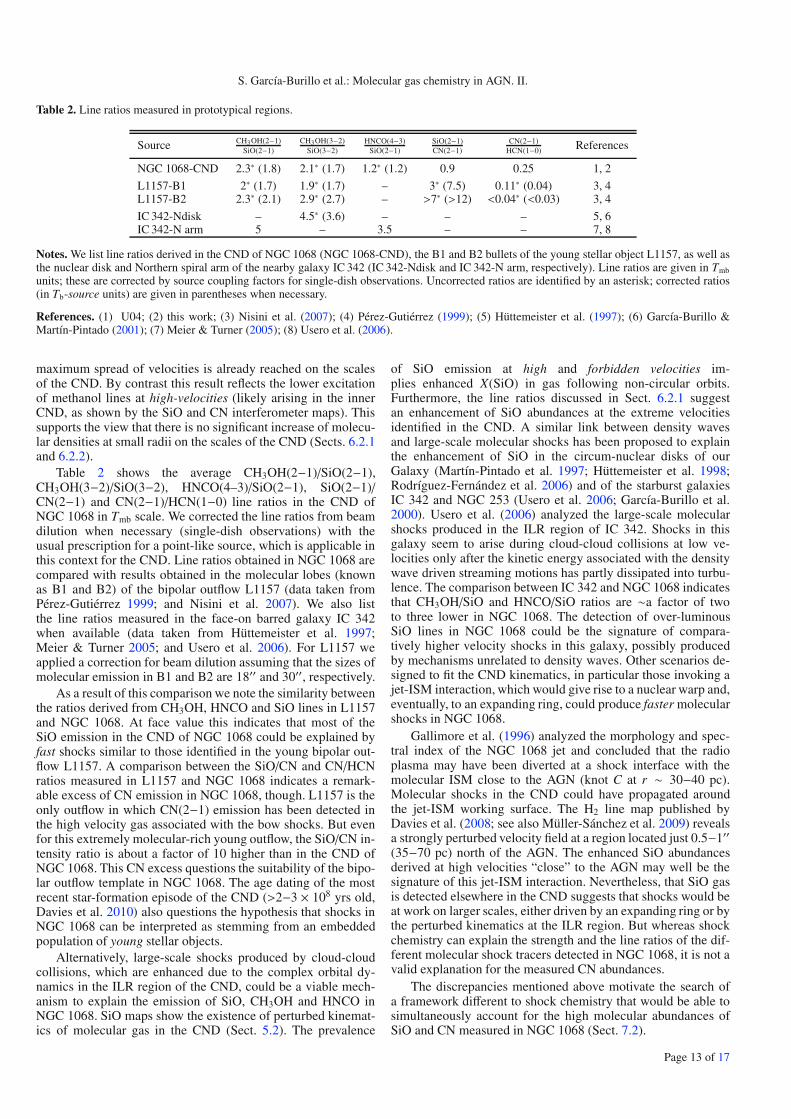
NGC 1068-CND 2.3∗ (1.8) 2.1∗ (1.7) 1.2∗ (1.2) 0.9 0.25 1, 2
L1157-B1 2∗ (1.7) 1.9∗ (1.7) – 3∗ (7.5) 0.11∗ (0.04) 3, 4L1157-B2 2.3∗ (2.1) 2.9∗ (2.7) – >7∗ (>12) <0.04∗ (<0.03) 3, 4
IC 342-Ndisk – 4.5∗ (3.6) – – – 5, 6IC 342-N arm 5 – 3.5 – – 7, 8
Notes. We list line ratios derived in the CND of NGC 1068 (NGC 1068-CND), the B1 and B2 bullets of the young stellar object L1157, as well asthe nuclear disk and Northern spiral arm of the nearby galaxy IC 342 (IC 342-Ndisk and IC 342-N arm, respectively). Line ratios are given in Tmb
units; these are corrected by source coupling factors for single-dish observations. Uncorrected ratios are identified by an asterisk; corrected ratios(in Tb-source units) are given in parentheses when necessary.
References. (1) U04; (2) this work; (3) Nisini et al. (2007); (4) Pérez-Gutiérrez (1999); (5) Hüttemeister et al. (1997); (6) García-Burillo &Martín-Pintado (2001); (7) Meier & Turner (2005); (8) Usero et al. (2006).
maximum spread of velocities is already reached on the scalesof the CND. By contrast this result reflects the lower excitationof methanol lines at high-velocities (likely arising in the innerCND, as shown by the SiO and CN interferometer maps). Thissupports the view that there is no significant increase of molecu-lar densities at small radii on the scales of the CND (Sects. 6.2.1and 6.2.2).
Table 2 shows the average CH3OH(2−1)/SiO(2−1),CH3OH(3−2)/SiO(3−2), HNCO(4–3)/SiO(2−1), SiO(2−1)/CN(2−1) and CN(2−1)/HCN(1−0) line ratios in the CND ofNGC 1068 in Tmb scale. We corrected the line ratios from beamdilution when necessary (single-dish observations) with theusual prescription for a point-like source, which is applicable inthis context for the CND. Line ratios obtained in NGC 1068 arecompared with results obtained in the molecular lobes (knownas B1 and B2) of the bipolar outflow L1157 (data taken fromPérez-Gutiérrez 1999; and Nisini et al. 2007). We also listthe line ratios measured in the face-on barred galaxy IC 342when available (data taken from Hüttemeister et al. 1997;Meier & Turner 2005; and Usero et al. 2006). For L1157 weapplied a correction for beam dilution assuming that the sizes ofmolecular emission in B1 and B2 are 18′′ and 30′′, respectively.
As a result of this comparison we note the similarity betweenthe ratios derived from CH3OH, HNCO and SiO lines in L1157and NGC 1068. At face value this indicates that most of theSiO emission in the CND of NGC 1068 could be explained byfast shocks similar to those identified in the young bipolar out-flow L1157. A comparison between the SiO/CN and CN/HCNratios measured in L1157 and NGC 1068 indicates a remark-able excess of CN emission in NGC 1068, though. L1157 is theonly outflow in which CN(2−1) emission has been detected inthe high velocity gas associated with the bow shocks. But evenfor this extremely molecular-rich young outflow, the SiO/CN in-tensity ratio is about a factor of 10 higher than in the CND ofNGC 1068. This CN excess questions the suitability of the bipo-lar outflow template in NGC 1068. The age dating of the mostrecent star-formation episode of the CND (>2−3 × 10⁸ yrs old,Davies et al. 2010) also questions the hypothesis that shocks inNGC 1068 can be interpreted as stemming from an embeddedpopulation of young stellar objects.
Alternatively, large-scale shocks produced by cloud-cloudcollisions, which are enhanced due to the complex orbital dy-namics in the ILR region of the CND, could be a viable mech-anism to explain the emission of SiO, CH3OH and HNCO inNGC 1068. SiO maps show the existence of perturbed kinemat-ics of molecular gas in the CND (Sect. 5.2). The prevalence
of SiO emission at high and forbidden velocities im-plies enhanced X(SiO) in gas following non-circular orbits.Furthermore, the line ratios discussed in Sect. 6.2.1 suggestan enhancement of SiO abundances at the extreme velocitiesidentified in the CND. A similar link between density wavesand large-scale molecular shocks has been proposed to explainthe enhancement of SiO in the circum-nuclear disks of ourGalaxy (Martín-Pintado et al. 1997; Hüttemeister et al. 1998;Rodríguez-Fernández et al. 2006) and of the starburst galaxiesIC 342 and NGC 253 (Usero et al. 2006; García-Burillo et al.2000). Usero et al. (2006) analyzed the large-scale molecularshocks produced in the ILR region of IC 342. Shocks in thisgalaxy seem to arise during cloud-cloud collisions at low ve-locities only after the kinetic energy associated with the densitywave driven streaming motions has partly dissipated into turbu-lence. The comparison between IC 342 and NGC 1068 indicatesthat CH3OH/SiO and HNCO/SiO ratios are ∼a factor of twoto three lower in NGC 1068. The detection of over-luminousSiO lines in NGC 1068 could be the signature of compara-tively higher velocity shocks in this galaxy, possibly producedby mechanisms unrelated to density waves. Other scenarios de-signed to fit the CND kinematics, in particular those invoking ajet-ISM interaction, which would give rise to a nuclear warp and,eventually, to an expanding ring, could produce faster molecularshocks in NGC 1068.
Gallimore et al. (1996) analyzed the morphology and spec-tral index of the NGC 1068 jet and concluded that the radioplasma may have been diverted at a shock interface with themolecular ISM close to the AGN (knot C at r ∼ 30−40 pc).Molecular shocks in the CND could have propagated aroundthe jet-ISM working surface. The H2 line map published byDavies et al. (2008; see also Müller-Sánchez et al. 2009) revealsa strongly perturbed velocity field at a region located just 0.5−1′′(35−70 pc) north of the AGN. The enhanced SiO abundancesderived at high velocities “close” to the AGN may well be thesignature of this jet-ISM interaction. Nevertheless, that SiO gasis detected elsewhere in the CND suggests that shocks would beat work on larger scales, either driven by an expanding ring or bythe perturbed kinematics at the ILR region. But whereas shockchemistry can explain the strength and the line ratios of the dif-ferent molecular shock tracers detected in NGC 1068, it is not avalid explanation for the measured CN abundances.
The discrepancies mentioned above motivate the search ofa framework different to shock chemistry that would be able tosimultaneously account for the high molecular abundances ofSiO and CN measured in NGC 1068 (Sect. 7.2).
Page 13 of 17

A&A 519, A2 (2010)
Fig. 12. a) (Left panel) Chandra X-ray image of NGC 1068 (contours: 15, 30, 50, 100, 200, 400, 600, 1000, 2000 and 3000 counts) obtained inthe 0.25−7.5 keV band by Young et al. (2001) is overlaid on the PdBI SiO map (color scale in units of Jy km s−1 beam−1). b) (Middle panel) TheX-ray image obtained in the 6−8 keV band by Ogle et al. (2003) (contours: 0.2, 0.5, 1, 2, 4, 8, 15, 25, 40, 80 and 100 counts) is overlaid on theSiO(2−1)/CO(1−0) brightness temperature ratio (color scale) at the SiO spatial resolution. c) (Right panel) Same as b) but with the X-ray imageobtained in the 6−8 keV band overlaid on the CN(2−1)/CO(1−0) ratio (color scale) at the CO spatial resolution. Ellipses show beams of SiO andCO as in Fig. 9.
7.2. X-ray chemistry
We describe below the main properties of X-ray emission inNGC 1068, with a particular emphasis on the morphology,energetics and origin of hard X-ray emission in the CND(Sect. 7.2.1). We further discuss the observational evidence forX-ray chemistry in the nucleus of NGC 1068, and how the SiOand CN data specifically fit into this picture (Sect. 7.2.2).
7.2.1. X-ray emission in NGC 1068
We superpose in Fig. 12a the subarcsec resolution X-ray imageof NGC 1068 obtained in the 0.25−7.50 keV band with Chandra(contours) on the SiO map (color scale). The X-ray image hasbeen taken from the 3.2 s frame time data published by Younget al. (2001). The 0.25−7.50 keV band image incorporates thecontribution from soft to hard X-rays and includes both contin-uum and line emission. The morphology of the X-ray image re-veals spatially resolved emission distributed in a compact yetspatially resolved component located on the AGN, and an elon-gated source that extends to the northeast, similarly to the in-ner radio jet of the galaxy. The northeast elongation of X-rayemission contrasts with the overall east-west elongation seen inthe CND molecular material detected in SiO and CN. Lowerlevel X-ray emission is detected outside the inner 12′′ × 12′′field of view (FOV) displayed in Fig. 12a. This outer emissiontakes the shape of a complex spiral-like structure that extendsout to r ∼ 30−40′′ (see Young et al. 2001 for a detailed de-scription). The brightest region in X-ray emission correspondswith the compact AGN source. The X-ray peak coincides withthe highest SiO/CO and CN/CO intensity ratios measured in theCND (panels c and d). The contributions to the X-ray luminos-ity in the 0.25–7.50 keV band are known to be multiple (line andcontinuum emission, as well as emission from neutral and ion-ized material), and therefore the link between the molecular lineratios and the “bolometric” X-ray flux, if any, is not easily in-terpretable. As argued below, by restricting the study to the hardX-ray band the interpretation is facilitated.
Figure 12 (panels b and c) shows the superposition of thehard X-ray image obtained in the 6−8 keV band by Chandra (in
contours) on the SiO/CO and CN/CO ratio maps (color scale).The X-ray map was obtained by applying an adaptive smooth-ing4 on the Chandra archive NGC 1068 data available in thiswave-band. This image is virtually identical to the hard X-raymap originally published and discussed by Ogle et al. (2003;see also Young et al. 2001). Emission in this band is dominatedby the Fe I Kα line, with a non-negligible contribution fromFe XXV and scattered neutral and ionized continuum reflection(Ogle et al. 2003). An analysis of the 4−10 keV continuum ob-served with ASCA in NGC 1068 led Iwasawa et al. (1997) toconclude that most of the hard X-ray flux comes from reflectionby cold neutral gas. The strong emission detected in the Fe I Kαline in NGC 1068, a line generated by fluorescence in neutralcold molecular clouds, corroborates this picture. Therefore the6−8 keV band image allows us to directly probe to what ex-tent molecular gas in the CND of NGC 1068 is pervaded andprocessed by X-rays, without a significant contamination fromother sources to the X-ray emission.
The hard X-ray emission in the inner 12′′ × 12′′ FOV shownin Fig. 12b,c is spatially resolved. Young et al. (2001) confirmedthe reality of this extended component and concluded that thelatter cannot be attributed to scattering by the telescope PSF. Thecompact source, located on the AGN, is surrounded by lower-level emission that pervades the molecular material of the CNDout to r ∼ 2−3′′. This low-level emission shows a northeast pro-trusion beyond the CND extent, which aligns with the radio jet.The hard X-ray peak coincides within the errors with the highestSiO/CO and CN/CO intensity ratios measured in the CND, inter-preted in Sect. 6.2 in terms of a chemical enhancement (higherabundances) of SiO and CN. The picture of a correlation be-tween X(SiO), X(CN) and the degree of X-ray irradiation ofmolecular gas is further illustrated in Fig. 13. There we plot-ted the SiO/CO and CN/CO ratios derived in Sect. 6.2 versusthe X-ray flux measured with a 0.5′′ grid over the CND and acommon spatial resolution dictated in each case by the largestbeam. Within an admittedly large scatter, Fig. 13 provides ten-tative evidence of a correlation. The correlation is tighter in thecase of CN: the corresponding coefficients of determination of
4 Using version 4.1 of CIAO package.
Page 14 of 17
S. García-Burillo et al.: Molecular gas chemistry in AGN. II.
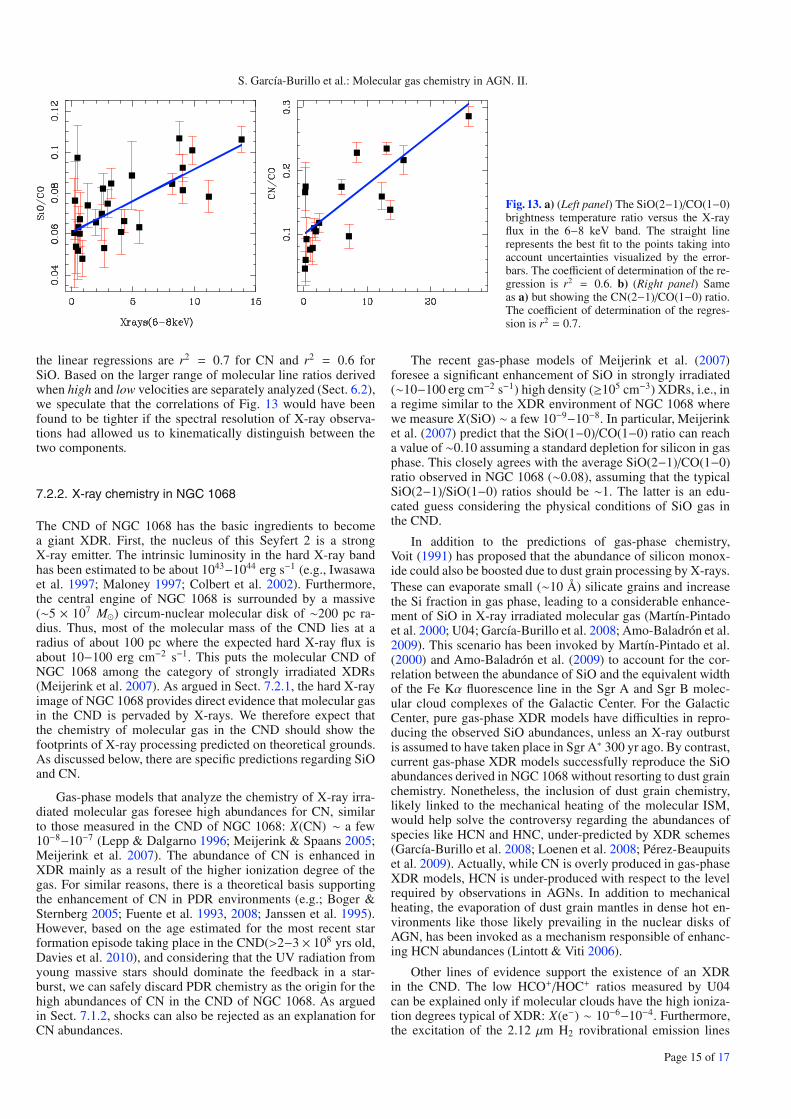
Fig. 13. a) (Left panel) The SiO(2−1)/CO(1−0)brightness temperature ratio versus the X-rayflux in the 6−8 keV band. The straight linerepresents the best fit to the points taking intoaccount uncertainties visualized by the error-bars. The coefficient of determination of the re-gression is r2 = 0.6. b) (Right panel) Sameas a) but showing the CN(2−1)/CO(1−0) ratio.The coefficient of determination of the regres-sion is r2 = 0.7.
the linear regressions are r2 = 0.7 for CN and r2 = 0.6 forSiO. Based on the larger range of molecular line ratios derivedwhen high and low velocities are separately analyzed (Sect. 6.2),we speculate that the correlations of Fig. 13 would have beenfound to be tighter if the spectral resolution of X-ray observa-tions had allowed us to kinematically distinguish between thetwo components.
7.2.2. X-ray chemistry in NGC 1068
The CND of NGC 1068 has the basic ingredients to becomea giant XDR. First, the nucleus of this Seyfert 2 is a strongX-ray emitter. The intrinsic luminosity in the hard X-ray bandhas been estimated to be about 1043−1044 erg s−1 (e.g., Iwasawaet al. 1997; Maloney 1997; Colbert et al. 2002). Furthermore,the central engine of NGC 1068 is surrounded by a massive(∼5 × 10⁷ M ) circum-nuclear molecular disk of ∼200 pc ra-dius. Thus, most of the molecular mass of the CND lies at aradius of about 100 pc where the expected hard X-ray flux isabout 10−100 erg cm−2 s−1. This puts the molecular CND ofNGC 1068 among the category of strongly irradiated XDRs(Meijerink et al. 2007). As argued in Sect. 7.2.1, the hard X-rayimage of NGC 1068 provides direct evidence that molecular gasin the CND is pervaded by X-rays. We therefore expect thatthe chemistry of molecular gas in the CND should show thefootprints of X-ray processing predicted on theoretical grounds.As discussed below, there are specific predictions regarding SiOand CN.
Gas-phase models that analyze the chemistry of X-ray irra-diated molecular gas foresee high abundances for CN, similarto those measured in the CND of NGC 1068: X(CN) ∼ a few10−8−10−7 (Lepp & Dalgarno 1996; Meijerink & Spaans 2005;Meijerink et al. 2007). The abundance of CN is enhanced inXDR mainly as a result of the higher ionization degree of thegas. For similar reasons, there is a theoretical basis supportingthe enhancement of CN in PDR environments (e.g.; Boger &Sternberg 2005; Fuente et al. 1993, 2008; Janssen et al. 1995).However, based on the age estimated for the most recent starformation episode taking place in the CND(>2−3 × 10⁸ yrs old,Davies et al. 2010), and considering that the UV radiation fromyoung massive stars should dominate the feedback in a star-burst, we can safely discard PDR chemistry as the origin for thehigh abundances of CN in the CND of NGC 1068. As arguedin Sect. 7.1.2, shocks can also be rejected as an explanation forCN abundances.
The recent gas-phase models of Meijerink et al. (2007)foresee a significant enhancement of SiO in strongly irradiated(∼10−100 erg cm−2 s−1) high density (≥105 cm−3) XDRs, i.e., ina regime similar to the XDR environment of NGC 1068 wherewe measure X(SiO) ∼ a few 10−9−10−8. In particular, Meijerinket al. (2007) predict that the SiO(1−0)/CO(1−0) ratio can reacha value of ∼0.10 assuming a standard depletion for silicon in gasphase. This closely agrees with the average SiO(2−1)/CO(1−0)ratio observed in NGC 1068 (∼0.08), assuming that the typicalSiO(2−1)/SiO(1−0) ratios should be ∼1. The latter is an edu-cated guess considering the physical conditions of SiO gas inthe CND.
In addition to the predictions of gas-phase chemistry,Voit (1991) has proposed that the abundance of silicon monox-ide could also be boosted due to dust grain processing by X-rays.These can evaporate small (∼10 Å) silicate grains and increasethe Si fraction in gas phase, leading to a considerable enhance-ment of SiO in X-ray irradiated molecular gas (Martín-Pintadoet al. 2000; U04; García-Burillo et al. 2008; Amo-Baladrón et al.2009). This scenario has been invoked by Martín-Pintado et al.(2000) and Amo-Baladrón et al. (2009) to account for the cor-relation between the abundance of SiO and the equivalent widthof the Fe Kα fluorescence line in the Sgr A and Sgr B molec-ular cloud complexes of the Galactic Center. For the GalacticCenter, pure gas-phase XDR models have difficulties in repro-ducing the observed SiO abundances, unless an X-ray outburstis assumed to have taken place in Sgr A∗ 300 yr ago. By contrast,current gas-phase XDR models successfully reproduce the SiOabundances derived in NGC 1068 without resorting to dust grainchemistry. Nonetheless, the inclusion of dust grain chemistry,likely linked to the mechanical heating of the molecular ISM,would help solve the controversy regarding the abundances ofspecies like HCN and HNC, under-predicted by XDR schemes(García-Burillo et al. 2008; Loenen et al. 2008; Pérez-Beaupuitset al. 2009). Actually, while CN is overly produced in gas-phaseXDR models, HCN is under-produced with respect to the levelrequired by observations in AGNs. In addition to mechanicalheating, the evaporation of dust grain mantles in dense hot en-vironments like those likely prevailing in the nuclear disks ofAGN, has been invoked as a mechanism responsible of enhanc-ing HCN abundances (Lintott & Viti 2006).
Other lines of evidence support the existence of an XDRin the CND. The low HCO+/HOC+ ratios measured by U04can be explained only if molecular clouds have the high ioniza-tion degrees typical of XDR: X(e−) ∼ 10−6−10−4. Furthermore,the excitation of the 2.12 μm H2 rovibrational emission lines
Page 15 of 17
A&A 519, A2 (2010)
detected in the CND (Rotaciuc et al. 1991; Blietz et al. 1994;Galliano & Alloin 2002; Müller-Sánchez et al. 2009) has beeninterpreted to be dominated by X-ray emission (e.g., see discus-sion in Maloney 1997; and Galliano & Alloin 2002)
8. Summary and conclusions
We used the high spatial resolution and sensitivity capabilitiesof the PdBI to map the emission of the (v = 0, J = 2−1) lineof SiO and the N = 2−1 transition of CN in the disk of theSeyfert 2 galaxy NGC 1068. The spatial resolution of these ob-servations (∼1−3′′) allowed us to separate the emission of the SBring from that of the CND. The PdBI SiO and CN data togetherwith available PdBI CO maps of the galaxy were complementedby single-dish data obtained with the IRAM 30 m telescope inSiO, CH3OH and HNCO lines to probe the physical and chemi-cal properties of molecular gas in the CND through an analysisof line ratios.
We summarize below the main results obtained in this work:
– Unlike the CO lines, which show strong emission in the SBring, most of the SiO emission detected inside the PdBI pri-mary beam comes from a circum-nuclear molecular disk(CND) located around the AGN. The dichotomy betweenthe CND and the SB ring is reflected in the remarkably dif-ferent 〈RSiO/CO〉 ratios measured in the two regions. Largevelocity gradient models implemented to fit line ratios in-dicate that the average abundance of SiO in the CND,〈X(SiO)〉[CND] ∼ (1−5) × 10−9, is about one to two ordersof magnitude higher than that measured in the SB ring.
– Similarly to CO, the SiO CND, of about 400 pc deconvolvedsize, shows an asymmetric double peak structure orientedeast-west. The eastern knot corresponds to the SiO emissionpeak. However, CO and SiO emissions show differences atthe scales of the CND. The SiO/CO velocity-integrated in-tensity ratio changes by about a factor of three inside theCND, reaching a peak ratio of ∼0.10−0.12 towards the AGNand the western knot.
– The overall SiO kinematics in the CND are consistent with arotating structure. But there is evidence that the CND rotat-ing pattern is distorted by non-circular and/or non-coplanarmotions. Compared to CO, SiO emission at small radii (r ≤2′′ = 140 pc) stands out at extreme velocities that are not ac-counted for by circular rotation. The highest SiO/CO bright-ness temperature ratios in the CND are associated with thehigh velocities seen towards the AGN and the western knot.We interpret the spatial variations of the SiO/CO ratio in theCND as the likely signature of chemical differentiation. Inthis scenario the abundance of SiO is significantly enhancedat high velocities out to X(SiO) ∼ (0.3−1.5) × 10−8.
– CN emission is also detected in a CND around the AGN.The size and morphology of the CND seen in CN are sim-ilar to those found in SiO. The overall abundance of CNin the CND is high: 〈X(CN)〉[CND] ∼ (0.2−1) × 10−7.The CN/CO velocity-integrated intensity ratio changes byabout a factor of three inside the CND and reaches a peakvalue of ∼0.30 towards the AGN. CN maps also show dis-torted kinematics that cannot be explained by circular ro-tation. The abundance of CN is significantly enhanced athigh velocities, detected towards the AGN, out to X(CN) ∼(0.8−4) × 10−7. The emission detected in CN at extreme ve-locities is physically associated with gas lying at small radii(r ≤ 1′′ = 70 pc).
– Different models have been proposed to account for the kine-matics of molecular gas in the CND. Large-scale shocks pro-duced by cloud-cloud collisions in the ILR region of theNGC 1068 nuclear bar can explain the distorted kinematicsand enhanced SiO abundances in the CND. The hypothesisof a jet-ISM interaction, driving the large-scale expansion ofthe molecular ring, can also explain shocks. Independent ev-idence of shocks is provided by the detection of CH3OH andHNCO. Line ratios involving these tracers and SiO in theCND are similar to those measured in prototypical shockedregions in our Galaxy. Yet the strength and abundance ofCN in NGC 1068 can be explained neither by shocks norby PDR chemistry. Alternatively, the high global abundancesmeasured for CN and SiO, which agree with the theoreticalpredictions of XDR models, and the conspicuous correlationof CN/CO and SiO/CO ratios with the irradiation of hardX-rays, suggest that the CND of NGC 1068 has become agiant X-ray-dominated region.
The extreme properties of molecular gas in the circum-nucleardisk of NGC 1068 result from the interplay between severalprocesses directly linked to nuclear activity. The results pre-sented in this paper highlight in particular the footprint of shocksand X-ray irradiation on the properties of molecular gas in thisSeyfert. Whereas XDR chemistry offers a simple explanation forCN and SiO in NGC 1068, the relevance of shocks deserves fur-ther scrutiny, however. In particular, sub-arcsecond spatial res-olution observations, to be done at higher frequencies and inclear-cut molecular tracers, will be paramount to locate the oc-currence of shocks in the CND and determine the gas mass andenergies involved in the process. Increasing the spatial resolu-tion at millimeter and sub-millimeter wavelengths will also be akey to explore in detail the correlation between molecular abun-dances and X-ray irradiation, tentatively identified in this work.Furthermore, increasing the number of molecular line transitionsobserved with high-spatial resolution will allow us to fit the dif-ferent line ratios with multi-phase radiative transfer schemes.These are a better description of the multi-phase nature of themolecular ISM in galaxies. In particular, these models will prop-erly take into account that the emission of different lines canarise from regions characterized by very different densities andkinetic temperatures.
Acknowledgements. We acknowledge the IRAM staff from the Plateau de Bureand from Grenoble for carrying out the observations and help provided dur-ing the data reduction. We heartily thank Andrew Baker for making avail-able his PhD thesis work and for the helpful discussions and comments onour paper. S.G.B. and A.F. acknowledge support from MICIN within programCONSOLIDER INGENIO 2010, under grant “Molecular Astrophysics: TheHerschel and ALMA Era – ASTROMOL” (Ref. CSD2009-00038).
References
Amo-Baladrón, M. A., Martín-Pintado, J., Morris, M. R., Muno, M. P., &Rodríguez-Fernández, N. J. 2009, ApJ, 694, 943
Athanassoula, E. 1992, MNRAS, 259, 345Bachiller, R., & Pérez-Gutiérrez, M. 1997, ApJ, 487, L93Baker, A. J. 2000, Ph.D. ThesisBergin, E. A., Neufeld, D. A., & Melnick, G. J. 1998, ApJ, 499, 777Bland-Hawthorn, J., Gallimore, J. F., Tacconi, L. J., et al. 1997, Ap&SS, 248, 9Blietz, M., Cameron, M., Drapatz, S., et al. 1994, ApJ, 421, 92Boger, G. I., & Sternberg, A. 2005, ApJ, 632, 302Brinks, E., Skillman, E. D., Terlevich, R. J., & Terlevich, E. 1997, Ap&SS, 248,
23Buta, R., & Combes, F. 1996, Fund. Cosmic Phys., 17, 95Caselli, P., Hartquist, T. W., & Havnes, O. 1997, A&A, 322, 296Charnley, S. B., Kress, M. E., Tielens, A. G. G. M., & Millar, T. J. 1995, ApJ,
448, 232
Page 16 of 17
S. García-Burillo et al.: Molecular gas chemistry in AGN. II.
Colbert, E. J. M., Weaver, K. A., Krolik, J. H., Mulchaey, J. S., & Mushotzky,R. F. 2002, ApJ, 581, 182
Davies, R., Genzel, R., Tacconi, L., Sánchez, F. M., & Sternberg, A. 2008,Mapping the Galaxy and Nearby Galaxies, 144
Davies, R. I., Hicks, E., Schartmann, M., et al. 2010, IAU Symp., 267, 283Dehnen, W., Bland-Hawthorn, J., Quirrenbach, A., & Cecil, G. N. 1997, Ap&SS,
248, 33de Vaucouleurs, G., de Vaucouleurs, A., Corwin, H. G., Jr., et al. 1991, Third
Reference Catalogue of Bright GalaxiesEmsellem, E., Fathi, K., Wozniak, H., et al. 2006, MNRAS, 365, 367Fuente, A., Martin-Pintado, J., Cernicharo, J., & Bachiller, R. 1993, A&A, 276,
473Fuente, A., Rizzo, J. R., Caselli, P., Bachiller, R., & Henkel, C. 2005, A&A, 433,
535Fuente, A., García-Burillo, S., Usero, A., et al. 2008, A&A, 492, 675Galliano, E., & Alloin, D. 2002, A&A, 393, 43Gallimore, J. F., Baum, S. A., O’Dea, C. P., & Pedlar, A. 1996, ApJ, 458, 136García-Burillo, S., & Guélin, M. 1995, A&A, 299, 657García-Burillo, S., & Martín-Pintado, J. 2001, The Promise of the Herschel
Space Observatory, 460, 163García-Burillo, S., Guélin, M., & Cernicharo, J. 1993, A&A, 274, 123García-Burillo, S., Martín-Pintado, J., Fuente, A., & Neri, R. 2000, A&A, 355,
499García-Burillo, S., Martín-Pintado, J., Fuente, A., & Neri, R. 2001, ApJ, 563,
L27García-Burillo, S., Graciá-Carpio, J., Guélin, M., et al. 2006, ApJ, 645, L17García-Burillo, S., Combes, F., Usero, A., & Graciá-Carpio, J. 2008, J. Phys.
Conf. Ser., 131, 012031Gerssen, J., Allington-Smith, J., Miller, B. W., Turner, J. E. H., & Walker, A.
2006, MNRAS, 365, 29Graciá-Carpio, J., García-Burillo, S., Planesas, P., & Colina, L. 2006, ApJ, 640,
L135Graciá-Carpio, J., García-Burillo, S., Planesas, P., Fuente, A., & Usero, A. 2008,
A&A, 479, 703Guilloteau, S., & Lucas, R. 2000, in Imaging at Radio through Submillimeter
Wavelengths, ed. J. G. Mangum, & S. J. E. Radford, ASP Conf. Ser., 299Guilloteau, S., Delannoy, J., Downes, D., et al. 1992, A&A, 262, 624Helfer, T. T., & Blitz, L. 1995, ApJ, 450, 90Huchra, J. P., Vogeley, M. S., & Geller, M. J. 1999, ApJS, 121, 287Hüttemeister, S., Mauersberger, R., & Henkel, C. 1997, A&A, 326, 59Hüttemeister, S., Dahmen, G., Mauersberger, R., et al. 1998, A&A, 334, 646Iwasawa, K., Fabian, A. C., & Matt, G. 1997, MNRAS, 289, 443Jansen, D. J., van Dishoeck, E. F., Black, J. H., Spaans, M., & Sosin, C. 1995,
A&A, 302, 223Kohno, K., Matsushita, S., Vila-Vilaró, B., et al. 2001, The Central Kiloparsec
of Starbursts and AGN: The La Palma Connection, 249, 672Krips, M., Eckart, A., Neri, R., et al. 2006, A&A, 446, 113Krips, M., Neri, R., García-Burillo, S., et al. 2008, ApJ, 677, 262Kuijken, K., & Merrifield, M. R. 1995, ApJ, 443, L13Lepp, S., & Dalgarno, A. 1996, A&A, 306, L21
Lintott, C., & Viti, S. 2006, ApJ, 646, L37Loenen, A. F., Spaans, M., Baan, W. A., & Meijerink, R. 2008, A&A, 488, L5Maloney, P. R. 1997, Ap&SS, 248, 105Maloney, P. R., Hollenbach, D. J., & Tielens, A. G. G. M. 1996, ApJ, 466, 561Martín, S., Requena-Torres, M. A., Martín-Pintado, J., & Mauersberger, R. 2008,
ApJ, 678, 245Martín, S., Martín-Pintado, J., & Mauersberger, R. 2009, ApJ, 694, 610Martín-Pintado, J., de Vicente, P., Fuente, A., & Planesas, P. 1997, ApJ, 482, L45Martín-Pintado, J., de Vicente, P., Rodríguez-Fernández, N. J., et al. 2000, A&A,
356, L5Martín-Pintado, J., Rizzo, J. R., de Vicente, P., Rodríguez-Fernández, N. J., &
Fuente, A. 2001, ApJ, 548, L65Meier, D. S., & Turner, J. L. 2005, ApJ, 618, 259Meijerink, R., & Spaans, M. 2005, A&A, 436, 397Meijerink, R., Spaans, M., & Israel, F. P. 2007, A&A, 461, 793Millar, T. J., Herbst, E., & Charnley, S. B. 1991, ApJ, 369, 147Mitchell, G. F. 1984, ApJS, 54, 81Müller-Sánchez, F., Davies, R. I., Genzel, R., et al. 2009, ApJ, 691, 749Nisini, B., Codella, C., Giannini, T., et al. 2007, A&A, 462, 163Ogle, P. M., Brookings, T., Canizares, C. R., Lee, J. C., & Marshall, H. L. 2003,
A&A, 402, 849Pérez-Beaupuits, J. P., Aalto, S., & Gerebro, H. 2007, A&A, 476, 177Pérez-Beaupuits, J. P., Spaans, M., van der Tak, F. F. S., et al. 2009, A&A, 503,
459Pérez-Gutiérrez, M. J. P. 1999, Ph.D. Thesis, Universidad Complutense de
Madrid (UCM)Planesas, P., Scoville, N., & Myers, S. T. 1991, ApJ, 369, 364Rodríguez-Fernández, N. J., Combes, F., Martín-Pintado, J., Wilson, T. L., &
Apponi, A. 2006, A&A, 455, 963Rodríguez-Fernández, N., Tafalla, M., Gueth, F., & Bachiller, R. 2010, A&A,
516, A98Rotaciuc, V., Krabbe, A., Cameron, M., et al. 1991, ApJ, 370, L23Schilke, P., Walmsley, C. M., Pineau des Forets, G., & Flower, D. R. 1997, A&A,
321, 293Schinnerer, E., Eckart, A., Tacconi, L. J., Genzel, R., & Downes, D. 2000, ApJ,
533, 850Sternberg, A., & Dalgarno, A. 1995, ApJS, 99, 565Sternberg, A., Genzel, R., & Tacconi, L. 1994, ApJ, 436, L131Strong, A. W., Bloemen, J. B. G. M., Dame, T. M., et al. 1988, A&A, 207, 1Tacconi, L. J., Genzel, R., Blietz, M., et al. 1994, ApJ, 426, L77Usero, A., García-Burillo, S., Fuente, A., Martín-Pintado, J., &
Rodríguez-Fernández, N. J. 2004, A&A, 419, 897Usero, A., García-Burillo, S., Martín-Pintado, J., Fuente, A., & Neri, R. 2006,
A&A, 448, 457Voit, G. M. 1991, ApJ, 379, 122Wannier, P. G. 1980, ARA&A, 18, 399Young, A. J., Wilson, A. S., & Shopbell, P. L. 2001, ApJ, 556, 6Zinchenko, I., Henkel, C., & Mao, R. Q. 2000, A&A, 361, 1079Ziurys, L. M., Friberg, P., & Irvine, W. M. 1989, ApJ, 343, 201
Page 17 of 17
Related Documents