The Rockefeller University Press $30.00 J. Gen. Physiol. Vol. 142 No. 4 465–475 www.jgp.org/cgi/doi/10.1085/jgp.201311014 465 Methods and Approaches INTRODUCTION The cell membrane presents a barrier between the cyto- plasm and the surrounding environment that is critical to preserving the integrity of the cell. By virtue of this barrier, the differences in ion concentrations across the membrane that are established under the action of various membrane transport proteins can give rise to a difference in electric potential. Although it is relatively straightforward to control both the concentration gra- dients and membrane potential in experimental bio- physical studies, reproducing this set of conditions in computer simulations is nontrivial. To allow for the simulation of ion channels with a realistic implementation of asymmetric ion concentra- tion and transmembrane potential boundary conditions, a grand canonical Monte Carlo (GCMC)/Brownian dynamics (BD) was implemented previously (Im et al., 2000). In GCMC/BD, asymmetric boundary conditions were imposed on a finite nonperiodic simulated system surrounded by concentration buffer regions (Im et al., 2000). Although this method provided important in- sight into the factors governing the permeation of wide aqueous pores (Im and Roux, 2002a; Noskov et al., 2004; Egwolf et al., 2010; Lee et al., 2011, 2012), it remained based on fairly crude approximations. For instance, the Correspondence to Benoît Roux: [email protected] Abbreviations used in this paper: BD, Brownian dynamics; GCMG, grand canonical Monte Carlo; MD, molecular dynamics; PBC, periodic boundary condition; PNP, Poisson–Nernst–Planck; POPC, palmitoyl oleoyl phosphatidylcholine. solvent was represented as a continuum dielectric to en- able the GCMC insertion and annihilation of ions on both sides of the membrane. However, imposing asym- metric concentrations in explicit solvent molecular dy- namics (MD) simulations introduces special difficulties. Such explicit solvent MD simulations are normally per- formed with conventional periodic boundary conditions (PBCs), which are critical to reduce finite-size effects. Unavoidably, the PBCs also eliminate the distinction be- tween the two sides of a membrane. Because there is a single continuous bulk solution where ions are free to diffuse and equilibrate, concentration gradients across the membrane cannot be simulated. One possible avenue for simulating asymmetric ion concentrations in MD simulations with explicit solvent is to use a dual-membranes–dual-volumes strategy (Sachs et al., 2004) in which two spatially separated membranes are included to create two disconnected bulk phases between them (one of the two membranes is replaced by an artificial vacuum separator in the most recent implementation to reduce the computational burden; Delemotte et al., 2008). Manually adjusting the number of cations and anions in the two bulk regions makes it possible to set the effective membrane potential near some pre-chosen value V m (Delemotte et al., 2011). Molecular dynamics simulations of membrane proteins under asymmetric ionic concentrations Fatemeh Khalili-Araghi, 1 Brigitte Ziervogel, 1 James C. Gumbart, 2 and Benoît Roux 1 1 Department of Biochemistry and Molecular Biology, Gordon Center for Integrative Science, The University of Chicago, Chicago, IL 60637 2 School of Physics, Georgia Institute of Technology, Atlanta, GA 30332 A computational method is developed to allow molecular dynamics simulations of biomembrane systems under realistic ionic gradients and asymmetric salt concentrations while maintaining the conventional periodic boundary conditions required to minimize finite-size effects in an all-atom explicit solvent representation. The method, which consists of introducing a nonperiodic energy step acting on the ionic species at the edge of the simulation cell, is first tested with illustrative applications to a simple membrane slab model and a phospholipid membrane bilayer. The nonperiodic energy-step method is then used to calculate the reversal potential of the bacterial porin OmpF, a large cation-specific -barrel channel, by simulating the I-V curve under an asymmetric 10:1 KCl concen- tration gradient. The calculated reversal potential of 28.6 mV is found to be in excellent agreement with the values of 26–27 mV measured from lipid bilayer experiments, thereby demonstrating that the method allows realistic simulations of nonequilibrium membrane transport with quantitative accuracy. As a final example, the pore do- main of Kv1.2, a highly selective voltage-activated K + channel, is simulated in a lipid bilayer under conditions that recreate, for the first time, the physiological K + and Na + concentration gradients and the electrostatic potential difference of living cells. © 2013 Khalili-Araghi et al. This article is distributed under the terms of an Attribution– Noncommercial–Share Alike–No Mirror Sites license for the first six months after the publi- cation date (see http://www.rupress.org/terms). After six months it is available under a Creative Commons License (Attribution–Noncommercial–Share Alike 3.0 Unported license, as described at http://creativecommons.org/licenses/by-nc-sa/3.0/). The Journal of General Physiology

Welcome message from author
This document is posted to help you gain knowledge. Please leave a comment to let me know what you think about it! Share it to your friends and learn new things together.
Transcript
The Rockefeller University Press $30.00J. Gen. Physiol. Vol. 142 No. 4 465–475www.jgp.org/cgi/doi/10.1085/jgp.201311014 465
Methods and Approaches
I N T R O D U C T I O N
The cell membrane presents a barrier between the cyto-plasm and the surrounding environment that is critical to preserving the integrity of the cell. By virtue of this barrier, the differences in ion concentrations across the membrane that are established under the action of various membrane transport proteins can give rise to a difference in electric potential. Although it is relatively straightforward to control both the concentration gra-dients and membrane potential in experimental bio-physical studies, reproducing this set of conditions in computer simulations is nontrivial.
To allow for the simulation of ion channels with a realistic implementation of asymmetric ion concentra-tion and transmembrane potential boundary conditions, a grand canonical Monte Carlo (GCMC)/Brownian dynamics (BD) was implemented previously (Im et al., 2000). In GCMC/BD, asymmetric boundary conditions were imposed on a finite nonperiodic simulated system surrounded by concentration buffer regions (Im et al., 2000). Although this method provided important in-sight into the factors governing the permeation of wide aqueous pores (Im and Roux, 2002a; Noskov et al., 2004; Egwolf et al., 2010; Lee et al., 2011, 2012), it remained based on fairly crude approximations. For instance, the
Correspondence to Benoît Roux: r o u x @ u c h i c a g o . e d u Abbreviations used in this paper: BD, Brownian dynamics; GCMG,
grand canonical Monte Carlo; MD, molecular dynamics; PBC, periodic boundary condition; PNP, Poisson–Nernst–Planck; POPC, palmitoyl oleoyl phosphatidylcholine.
solvent was represented as a continuum dielectric to en-able the GCMC insertion and annihilation of ions on both sides of the membrane. However, imposing asym-metric concentrations in explicit solvent molecular dy-namics (MD) simulations introduces special difficulties. Such explicit solvent MD simulations are normally per-formed with conventional periodic boundary conditions (PBCs), which are critical to reduce finite-size effects. Unavoidably, the PBCs also eliminate the distinction be-tween the two sides of a membrane. Because there is a single continuous bulk solution where ions are free to diffuse and equilibrate, concentration gradients across the membrane cannot be simulated.
One possible avenue for simulating asymmetric ion concentrations in MD simulations with explicit solvent is to use a dual-membranes–dual-volumes strategy (Sachs et al., 2004) in which two spatially separated membranes are included to create two disconnected bulk phases between them (one of the two membranes is replaced by an artificial vacuum separator in the most recent implementation to reduce the computational burden; Delemotte et al., 2008). Manually adjusting the number of cations and anions in the two bulk regions makes it possible to set the effective membrane potential near some pre-chosen value Vm (Delemotte et al., 2011).
Molecular dynamics simulations of membrane proteins under asymmetric ionic concentrations
Fatemeh Khalili-Araghi,1 Brigitte Ziervogel,1 James C. Gumbart,2 and Benoît Roux1
1Department of Biochemistry and Molecular Biology, Gordon Center for Integrative Science, The University of Chicago, Chicago, IL 60637
2School of Physics, Georgia Institute of Technology, Atlanta, GA 30332
A computational method is developed to allow molecular dynamics simulations of biomembrane systems under realistic ionic gradients and asymmetric salt concentrations while maintaining the conventional periodic boundary conditions required to minimize finite-size effects in an all-atom explicit solvent representation. The method, which consists of introducing a nonperiodic energy step acting on the ionic species at the edge of the simulation cell, is first tested with illustrative applications to a simple membrane slab model and a phospholipid membrane bilayer. The nonperiodic energy-step method is then used to calculate the reversal potential of the bacterial porin OmpF, a large cation-specific -barrel channel, by simulating the I-V curve under an asymmetric 10:1 KCl concen-tration gradient. The calculated reversal potential of 28.6 mV is found to be in excellent agreement with the values of 26–27 mV measured from lipid bilayer experiments, thereby demonstrating that the method allows realistic simulations of nonequilibrium membrane transport with quantitative accuracy. As a final example, the pore do-main of Kv1.2, a highly selective voltage-activated K+ channel, is simulated in a lipid bilayer under conditions that recreate, for the first time, the physiological K+ and Na+ concentration gradients and the electrostatic potential difference of living cells.
© 2013 Khalili-Araghi et al. This article is distributed under the terms of an Attribution–Noncommercial–Share Alike–No Mirror Sites license for the first six months after the publi-cation date (see http://www.rupress.org/terms). After six months it is available under a Creative Commons License (Attribution–Noncommercial–Share Alike 3.0 Unported license, as described at http://creativecommons.org/licenses/by-nc-sa/3.0/).
The
Jour
nal o
f G
ener
al P
hysi
olo
gy

466 Simulation of asymmetric concentration
T H E O R Y A N D M E T H O D S
Theoretical frameworkLet us consider a closed system in which the accessible volume is divided into two regions, V1 and V2, along the z axis. The system is described by the potential energy U0(R), where R represents all the atomic coordinates. The equilibrium Boltzmann distribution is
ρβ
β0
0
0R
R
R
R( ) =− ( )
− ( )∫e
d e
U
U , (1)
where = 1/kBT. We focus our attention on one given type of particle in the system and assume that, without any additional en-ergy term, the potential energy U0(R) yields a uniform concentra-tion of the particles. For any configuration R, the instantaneous number of those particles in volume V1 is equal to
N zii1 R( ) = ( )∑ Θ ,
where (z) is a step function equal to 1 only when z lies within the volume V1. We wish to enforce that the average of N1(R) will be equal to chosen value n1, i.e.,
N d N1 1 0R R R R( ) = ( ) ( )∫ ρ . (2)
If there are N particles of this type in the system, it should be possible to enforce this condition, as long as n N1 ≤ . In practice, a wide range of perturbations could be introduced to impose this condition on the system. However, arbitrary modifications are likely to introduce undesirable and spurious biases. Ideally, one would like to modify the statistical distribution to impose the con-dition N n1 1R( ) = in the least intrusive manner. This goal can be achieved through Jaynes’ maximum entropy method (Jaynes, 1957), whereby one seeks to maximize the excess cross-entropy functional ,
η ρ ρρρ
R R RR
R( ) = − ( ) ( )
( )
∫d ln ,
0
(3)
under the constraints that the modified probability distribution (R) is normalized,
dR Rρ ( ) =∫ 1, (4)
and that the average of N1 is known:
d N nR R R1 1( ) ( ) =∫ ρ . (5)
The quantity is a functional of the probability distribution (R), and the constrained optimization problem can be solved using the method of Lagrange multipliers, leading to the form:
ρβ ε
β εR
R
R R
R R( ) =
− ( )− ( )
− ( )− ( ) ∫e
d e
U k T N
U k T N
B
B
0 1
0 1 , (6)
where the normalization was implicitly incorporated in the prob-ability distribution, and is an unknown coefficient that must be adjusted to match the condition in Eq. 5. The form of (R) in Eq. 6 is consistent with the introduction of a simple energy step, k T zB ii
ε Θ( )∑ , that acts on all the affected particles crossing into the volume V1 along the z axis, with a magnitude of E = kBT. In principle, determining the magnitude of the energy step may require iterative adjustments until the condition in Eq. 5 is satis-fied. In practice, the average number of particles in V1 can be
The latter is related to the charge imbalance across the membrane,
∆Q q qii side ii side= −( )∈{ } ∈{ }∑ ∑1
2 1 2,
through the linear relation Vm = Q/C, where C is the system’s capacitance. However, frequent manual adjust-ments are necessary, as the effective membrane poten-tial can shift dramatically by hundreds of millivolts when a single discrete ion is transferred across the membrane because of the small value of C in finite sys-tems (Treptow et al., 2009; Delemotte et al., 2011; Roux, 2011). For example, in previous dual-volume simu-lations of the voltage-dependent K+ channel, it was nec-essary to readjust the ion distribution periodically to compensate for the conformational changes of the pro-tein. To avoid the need for these cumbersome manual adjustments, which would preclude simulations under steady-state ion-flux conditions, the dual-volume method was recently extended to allow the ions of the two bulk phases to exchange with water molecules according to a GCMC scheme (Kutzner et al., 2011).
Despite its appeal, a dual-volume strategy remains com-putationally burdensome, as it doubles the size of the simulated system and the computational cost of carry-ing out such simulations. Furthermore, the annihilation and reinsertion processes of the particles implemented in the GCMC constitute non-Newtonian stochastic events that interrupt the course of the MD trajectory and add to the overall computational cost. Ideally, it would be desirable to maintain solute concentrations on both sides around chosen values while simulating a single-mem-brane–single-volume system with conventional PBCs.
In this paper, we show that realistic asymmetric ion concentrations can be realized by introducing a non-periodic “energy step” at the edge of the simulation cell to maintain a chemical potential difference across the bulk phase. The height of the step can be adjusted dy-namically during the simulation to converge to a de-sired concentration difference between the two phases on either side of the membrane. In addition to the con-centration asymmetry, a membrane potential can also be established by applying a constant electric field act-ing on all charged particles in a direction orthogonal to the membrane (Roux, 2008; Gumbart et al., 2012). The nonperiodic energy-step method is first illustrated by considering a simple system with a fixed nonpolar slab membrane as well as a realistic phospholipid membrane bilayer. The method is then validated by calculating the reversal potential and the conductance of the bacterial porin OmpF under asymmetric conditions. Finally, the method is used to simulate the physiological conditions experienced by the pore domain of the K+ channel Kv1.2, including the negative membrane potential and the asymmetric Na+ and K+ concentrations on either side of the membrane.
Khalili-Araghi et al. 467
region. Fig. 2 provides a schematic representation for a typical solvated membrane system. PBCs replicate the system in the three dimensions and, thus, connect the two aqueous solutions on the two sides of the membrane along the z direction, defined as the membrane normal. A small transition region of thickness d/2 is defined at each of the edges of the periodic box, over which an external constant force f directed along the z axis acts on all ions. The constant force f over the periodic transition region of thickness d results in a nonperiodic energy step = fd, which alters the chemical potential difference between the ions in the two com-partments, generating a concentration ratio of r = (C1/C2) = e.
It is of interest to point out that the present method is analo-gous to a previous treatment used to impose hydrostatic pressure differences across a membrane (Zhu et al., 2004), a thermody-namic property that also suffers from the lack of distinct bulk water phases on either side of a membrane in periodic systems. This problem was solved through the application of a small force to water molecules in a region far from the membrane. The re-sulting chemical potential difference for water between the two sides of the membrane was µ = fd, where f was the applied force and d was the size of the region of application in the direction normal to the membrane (Zhu et al., 2004). The method was ap-plied to the study of water transport in aquaporin, permitting cal-culation of the osmotic permeability, which was found to be in agreement with experimental determinations (Zhu et al., 2004).
Iterative dynamic energy-step adjustmentAlthough the value of the energy step needed to set a given con-centration ratio r can be determined directly as = ln(r) in the ideal case, ion–ion interactions may affect the expected concen-tration ratio in practice. This deviation from the ideal value deter-mined above requires further adjustment of the energy step as the ionic concentrations change during the simulation. The external force, initially set to f = kBTln(r)/d, is then adjusted dynamically to reach the proper concentration ratio. Two param-eters, and , control the response of the system to the force ad-justment. The external force acting on different ionic species is updated according to the following protocol:
f t t f t f t t+( ) = ( ) + ( ) ( )∆ ∆ ∆ / ατ (15)
and
∆f tk Td
CC
r( ) = −
− ( )
B ln ln ,1
2
(16)
approximated by assuming that the affected particles are nearly independent. In this case, the probability of finding the particles in each volume p1 and p2 and its respective averages can then be written as a function of ,
pV e
V e V11
1 2
=+
−
−
ε
ε (7)
and
pV
V e V22
1 2
=+−ε , (8)
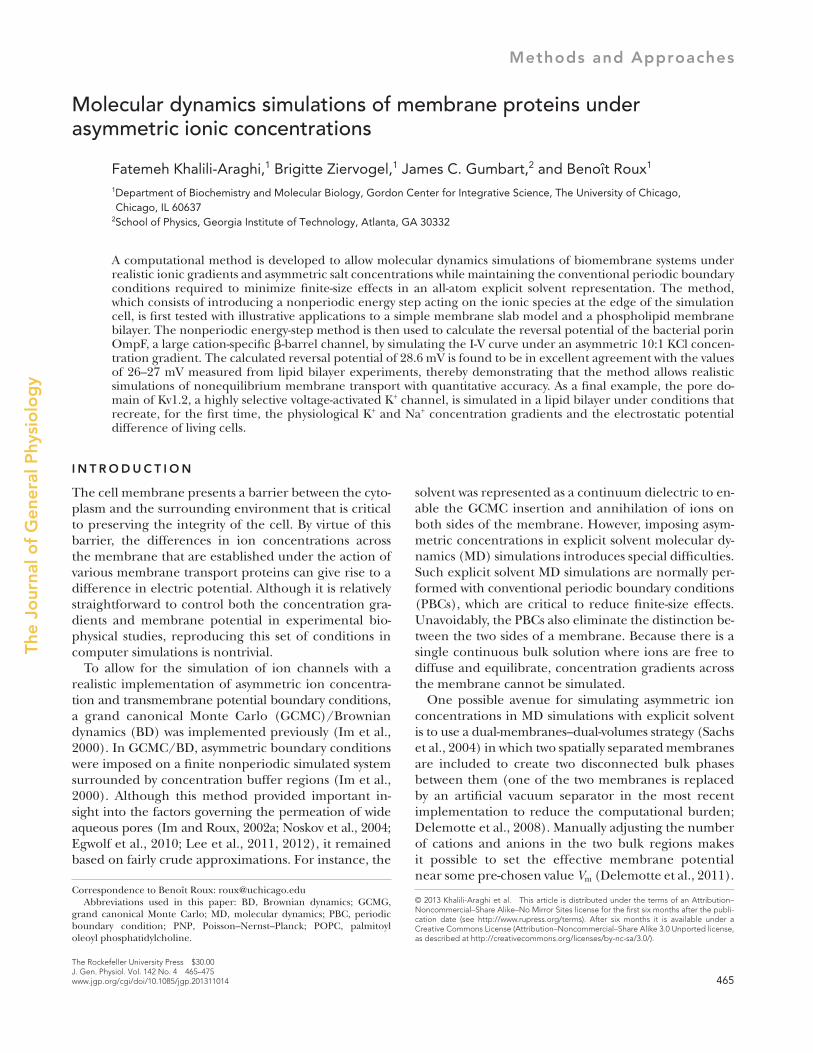
where p1 + p2 = 1 and V1 + V2 = V is the total volume. For a binomial distribution, the mean number of particles in V1 is Np1, and the variance is Np1(1 p1). So, to a first approximation, the magnitude of the energy step must be chosen such that Np n1 1= . The normal-ized relative root-mean-square (RMS) fluctuations of the number of particles is p Np2 1 and p Np1 2 for V1 and V2, respectively. It follows that the average concentrations of particles in volumes V1 and V2 are (we drop the brackets for the sake of simplicity)
CNe
V e V11 2
=+
−
−
ε
ε (9)
and
CN
V e V21 2
=+−ε , (10)
respectively. The concentration ratio is (C1/C2) = e. The relative RMS fluctuation of the concentration in V1 is
σ ε12
1
= −
VNV e
, (11)
and the relative RMS fluctuation of the concentration in V2 is equal to
σε
21
2
=−V e
NV. (12)
For the sake of simplicity, let us assume that the two volumes are identical here, i.e., V1 = V2 = V/2. The average concentrations are then
C Cee1 2
1=
+
−
−
ε
ε (13)
and
C Ce2 2
11
=+−ε , (14)
where C = N/V is the overall concentration of the particles in the entire system. Note that the maximum achievable concentration (here 2N/V) occurs when all the particles are forced into one of the two volumes (as shown in Fig. 1). The maximum achievable concentration could be manipulated by either introducing more particles into the system or by choosing a smaller volume for one of the two regions. The range of the concentration ratio achiev-able is controlled solely by the energy step (in units of kBT), i.e., (C1/C2) = e. However, to achieve a certain concentration C1 in V1, the starting number of solutes should be chosen to build the system such that C1V1 + C2V2 = N, where N is the total number of solute particles in the system.
In a practical implementation for MD simulation, it is simpler to avoid the discontinuous energy step by defining a small transition
Figure 1. Solute concentrations C1 (solid line) and C2 (dashed line) in volumes V1 and V2 as a function of the energy gap .

468 Simulation of asymmetric concentration
where Lz is the length of the system in the z direction. It is worth emphasizing that, although a constant electric field was applied to the system (Roux, 2008), it should be understood that the average electrostatic potential is expected to vary nonlinearly be-cause of the irregular shape of the membrane and of the pore. For illustrative examples, refer to the recent review by Gumbart et al. (2012).
Protein residues E296, D312, and D127 were protonated (Im and Roux, 2002a,b; Varma et al., 2006), and harmonic restraints (with a force constant of 1.0 kcal1 Å1) were applied to the C atoms at their crystallographic positions to prevent channel clo-sure by the repositioning of L3 under the applied voltage. The Langevin friction was removed for the ions. Pressure control was removed to prevent distortion of the system by the electric field; the virial used in the constant pressure algorithm is no longer well defined in the system when applying an external constant electric field. Simulations were therefore performed at constant volume and temperature (300 K) with a time step of 2 fs. The asymmetric concentration gradient was initially defined with 1 M KCl above the membrane and 0.1 M KCl below, and it was maintained throughout the simulation by imposing an energy step at the edges of the periodic box. Total ionic current was determined by calculating the displacement of all charges across the membrane using (Crozier et al., 2001a,b; Aksimentiev and Schulten, 2005; Pezeshki et al., 2009)
I tL
qz t t z t
tzi
i i
i
N
( ) = +( ) − ( )=∑1
1
∆∆
, (18)
where zi and qi are the z coordinate and charge of ion i, respec-tively, N is the total number of particles in the system, and t is the time step of 100 ps (the results are independent of t). Current calculations for individual ions IK and ICl were determined by counting the number of K+ or Cl that cross the pore over the trajectory. This also allowed the error i to be calculated for the total ionic currents by assuming a Poisson process (Sotomayor et al., 2007), such that
σ i N i= ( )1/ , (19)
where C1 and C2 are the estimated ion concentrations in each compartment, and ... represents a time average over a period of immediately preceding the current time step; determines the response time of the system. Temporal averaging of the concen-tration ratio over is necessary to overcome instantaneous (ther-mal) fluctuations in the number of ions as they jump between the boundaries of the energy step. The force adjustment follows the initial equilibration of the system and continues for a period of time comparable to the relaxation time of the system, i.e., a few nanoseconds for a system including a single-membrane protein. Ionic concentrations are monitored during the simulation, and the external force is gradually adjusted to reach the ideal concen-tration over a period of . Convergence of the force is a function of fluctuations in number of ions and, thus, longer simulations might be necessary for smaller systems. To obtain better estimates of ionic concentrations and avoid fluctuations near boundaries, the time-dependent concentrations are calculated for a region of length L, smaller than the length of the entire simulation system L, but large enough to include a finite number of ions at each time. This region should also be located far from the protein/membrane or any discontinuity in the system.
Simulation detailsAll simulations were performed using the MD program NAMD (Phillips et al., 2005) together with the CHARMM27 or CHARMM36 force field for proteins (MacKerell et al., 1998) and lipids (Feller et al., 1997; Klauda et al., 2010), and TIP3P (Jorgensen et al., 1983) for water. PBCs were used in all simulations, and electro-static interactions were calculated using the particle-mesh Ewald method (Darden et al., 1993) with a grid spacing of at least 1 per Å. Simulations were performed at constant volume and constant temperature (300 K) with a time step of 1 fs (2 fs for the OmpF simulations). The algorithm described above was implemented in the Tcl interface of NAMD, where external forces were defined and adjusted throughout the simulation.
The membrane slab was constructed of individual carbon atoms arranged in a body-centered cubic lattice with a spacing of 4 Å, similar to the systems simulated in Gumbart et al. (2012). The membrane has six vertical layers and, thus, a thickness of 20 Å, not accounting for the radius of the atoms themselves. In each simulated system, the membrane is fully solvated above and below and ionized with Na+, K+, and Cl ions at a concentration of either 1 M or 500 mM. The system size for the membrane slab was 44 Å × 44 Å in the membrane plane and 75 Å perpendicular to the membrane. The system consists of 11,000 atoms.
The palmitoyl oleoyl phosphatidylcholine (POPC) lipid bilayer system was generated using visual MD (Humphrey et al., 1996). The hydrated system, consisting of 131 lipid and 10,000 water mol-ecules, was ionized with an initial concentration of 55 mM K+, 55 mM Na+, and 110 mM Cl ions, such that the low concentra-tion and high concentration sides could be maintained at 10 and 100 mM when a concentration ratio of 10:1 was imposed.
The OmpF simulation model consisted of the OmpF trimer embedded in a POPC lipid bilayer, which was constructed using the CHARMM-GUI (Varma et al., 2006; Jo et al., 2008). The struc-ture of the protein was taken from Protein Data Bank accession number 2OMF (Cowan et al., 1995). The protein–membrane system was solvated with explicit waters, and ions were added in visual MD for a total system size of 200,000 atoms. Tetragonal PBCs were applied with a distance of 123.5 Å in the xy direction and 127.5 Å in the z direction. A constant electric field Ez corresponding to a transmembrane potential, V, of +150, 0, and 150 mV was applied along the z direction perpendicular to the membrane to all the atoms in the simulation box (Roux, 2008):
E V Lz z= m / , (17)
Figure 2. Schematic representation of a typical solvated mem-brane system. To impose a concentration gradient across the mem-brane, a constant force is applied to the ions near the boundaries of the periodic box (z > L/2 d/2 or z < L/2 + d/2).

Khalili-Araghi et al. 469
The error bars show the standard error in the calcula-tions resulting from the finite number of ions in the system and the finite length of the trajectories.
As shown in Fig. 3 (B and C), the concentration ratio increases exponentially with the applied force. The initial concentrations vary between 0.5 and 1 M for each system. Small deviation of the data points obtained from simula-tion trajectories and the theoretical values (shown as a straight line) indicate the ability of this method to main-tain a concentration gradient even at concentrations as high as 2 M. The relative fluctuation in the number of ions increases as the magnitude of the applied force is increased. Imposing a concentration ratio of 10:1 be-tween the two ionic solutions results in a system where only a few ions are left in one solution, assuming a volume of 10 nm. Thus, realistic simulations of mem-brane proteins require a larger volume on each side to allow physiologically relevant concentrations of 100 mM to result in a finite number of ions in the system.
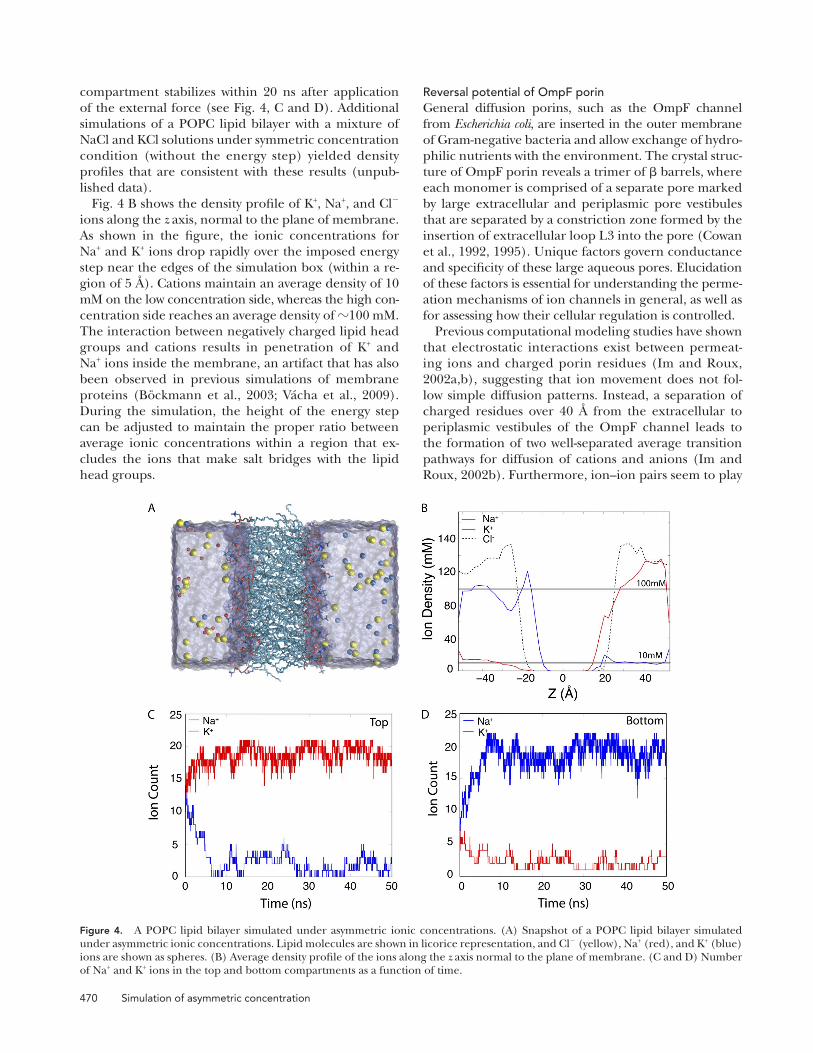
Under physiological conditions, cellular membranes are separated by two ionic solutions. Although the ex-tracellular solution is maintained at concentrations of 100 mM NaCl and 10 mM KCl, the intracellular solu-tion has 10 mM NCl and 100 mM KaCl. Using the method presented in this paper, we have been able to simulate a POPC lipid bilayer in a mixture of NaCl and KCl solutions with an asymmetric distribution around the membrane. The concentration of each ionic species is controlled separately. Two different nonperiodic en-ergy steps are introduced at the edges of the periodic box normal to the plane of membrane, where they act on either Na+ or K+ ions (see Fig. 4 A). The nonperiodic energy steps concentrate K+ ions in the top compart-ment (z > 0) and Na+ ions in the bottom compartment (z < 0), as shown in Fig. 4 (A and B). The steps are defined such that K+ concentrations are maintained at a ratio of 10:1 (100:10 mM), whereas Na+ concentra-tions have a ratio of 1:10 (10:100 mM) between the top and bottom compartments. The number of ions in each
where N(i) is the number of ion crossing events at the membrane potential Vm(i). Ion conductance G and the reversal potential Vrev were calculated by a least-square fitting of the I-V curves (Fig. 6 B) that minimized
χσ
22
21= ( ) − ( ) −( ) ∑
ii
I i G V i Vm rev . (20)
The initial setup of the Kv1.2 system was taken from Khalili-Araghi et al. (2006), in which the pore domain of the voltage-gated potassium channel Kv1.2 has been equilibrated in a patch of POPE lipid bilayer. The structure of the protein was taken from Protein Data Bank accession number 2A79 (Long et al., 2005). The number of ions in the aqueous solution surrounding the membrane–protein system has been adjusted to reach 55-mM concentrations of KCl and NaCl over the entire system. The new configuration was then equilibrated for 10 ns, after which concen-tration ratios of 10:1 and 1:10 were imposed between Na+ and K+ ions, respectively, on the two sides of the membrane. In addition, a membrane potential of 100 mV was applied via an external electric field Ez = V/Lz (Roux, 2008).
R E S U L T S A N D D I S C U S S I O N
Illustrative examplesTo illustrate the effectiveness of the nonperiodic en-ergy-step method, we first simulated a system with a sim-plified membrane slab surrounded by aqueous KCl or NaCl salt solutions, as shown in Fig. 3 A. The simula-tions start from a uniform distribution of ions on both sides of the membrane with concentrations C1 and C2 (C1 = C2). External forces are applied to the ions, K+, Na+, and Cl, as they enter a region 2.5-Å wide at the edges of the periodic box to separate the ions on either side of the membrane. The forces are applied for 20 ns after the initial equilibration, or until the ion concen-tration on each side of the membrane is stabilized. Fig. 3 (B and C) shows the ratio between the ion con-centrations, C1 and C2, on the two sides of the membrane averaged over the last 10 ns of the simulation trajecto-ries as a function of the applied energy step ( = fd.
Figure 3. A membrane slab separated by two ionic solutions with concentrations C1 and C2. (A) Snapshot of the simulation system after application of the energy step. (B and C) The ratio of ionic concentration as a function of the applied force for simulations consisting of (B) KCl or (C) NaCl solutions.
470 Simulation of asymmetric concentration
Reversal potential of OmpF porinGeneral diffusion porins, such as the OmpF channel from Escherichia coli, are inserted in the outer membrane of Gram-negative bacteria and allow exchange of hydro-philic nutrients with the environment. The crystal struc-ture of OmpF porin reveals a trimer of barrels, where each monomer is comprised of a separate pore marked by large extracellular and periplasmic pore vestibules that are separated by a constriction zone formed by the insertion of extracellular loop L3 into the pore (Cowan et al., 1992, 1995). Unique factors govern conductance and specificity of these large aqueous pores. Elucidation of these factors is essential for understanding the perme-ation mechanisms of ion channels in general, as well as for assessing how their cellular regulation is controlled.
Previous computational modeling studies have shown that electrostatic interactions exist between permeat-ing ions and charged porin residues (Im and Roux, 2002a,b), suggesting that ion movement does not fol-low simple diffusion patterns. Instead, a separation of charged residues over 40 Å from the extracellular to periplasmic vestibules of the OmpF channel leads to the formation of two well-separated average transition pathways for diffusion of cations and anions (Im and Roux, 2002b). Furthermore, ion–ion pairs seem to play
compartment stabilizes within 20 ns after application of the external force (see Fig. 4, C and D). Additional simulations of a POPC lipid bilayer with a mixture of NaCl and KCl solutions under symmetric concentration condition (without the energy step) yielded density profiles that are consistent with these results (unpub-lished data).
Fig. 4 B shows the density profile of K+, Na+, and Cl ions along the z axis, normal to the plane of membrane. As shown in the figure, the ionic concentrations for Na+ and K+ ions drop rapidly over the imposed energy step near the edges of the simulation box (within a re-gion of 5 Å). Cations maintain an average density of 10 mM on the low concentration side, whereas the high con-centration side reaches an average density of 100 mM. The interaction between negatively charged lipid head groups and cations results in penetration of K+ and Na+ ions inside the membrane, an artifact that has also been observed in previous simulations of membrane proteins (Böckmann et al., 2003; Vácha et al., 2009). During the simulation, the height of the energy step can be adjusted to maintain the proper ratio between average ionic concentrations within a region that ex-cludes the ions that make salt bridges with the lipid head groups.
Figure 4. A POPC lipid bilayer simulated under asymmetric ionic concentrations. (A) Snapshot of a POPC lipid bilayer simulated under asymmetric ionic concentrations. Lipid molecules are shown in licorice representation, and Cl (yellow), Na+ (red), and K+ (blue) ions are shown as spheres. (B) Average density profile of the ions along the z axis normal to the plane of membrane. (C and D) Number of Na+ and K+ ions in the top and bottom compartments as a function of time.
Khalili-Araghi et al. 471
previous MD, BD, and Poisson–Nernst–Planck (PNP) simulations (Im and Roux, 2002a; Pezeshki et al., 2009).
OmpF’s weak specificity for cations is revealed by re-versal potential (Vrev) measurements. Vrev is the applied transmembrane voltage that yields zero current in the presence of a concentration gradient across the chan-nel. The advantage of Vrev measurements are in their simplicity, as the sign of Vrev provides a quick estimation of channel selectivity. Additionally, Vrev can be used to calculate the permeability of individual ions by using the well-known Goldman-Hodgkin-Katz equation:
Vk Te
P C P C
P C P CB i
i orev
K Cl
K Cl
=[ ] + [ ][ ] + [ ]
ln .0 (21)
Experimental lipid bilayer measurements report Vrev val-ues of 27 and 26 mV for the OmpF channel from E. coli strains B and K-12, respectively (Benz et al., 1985).
Computational approaches to calculate Vrev have previ-ously been limited to GCMC/BD simulations and three-dimensional PNP electrodiffusion theory, yielding values Vrev of 27.4 and 22.1 mV, respectively (Im and Roux, 2002a). Although those results were in excellent accord with experiments (Benz et al., 1985), they were obtained from simulation models that are based on continuum electrostatic approximations. Using the nonperiodic energy-step method to establish a salt concentration gra-dient developed here, it becomes possible for the first time to calculate the reversal potential Vrev of OmpF using all-atom MD simulations with explicit solvent molecules.
To calculate Vrev, an asymmetric salt solution across the membrane was constructed with 1 M KCl above (on the extracellular side of) the membrane and 0.1 M KCl below (on the periplasmic side of) the membrane. To maintain the salt gradient, an external force of 0.557 kcal mol1 Å1 was applied to the ions as they entered a 2.5-Å wide region at the edges of the periodic box. After conver-gence, an electrostatic potential of +150, 0, or 150 mV was applied across the membrane to drive current. The ion conductance was monitored over separate 50-ns tra-jectories. The I-V relationship (Fig. 6 B) shows similar features as those calculated previously using BD and PNP (Im and Roux, 2002a). Calculation of Vrev at zero net current was determined to be 28.6 ± 5.3 mV. This positive value for Vrev, caused by the preferential move-ment of cations in response to the concentration gradi-ent, is indicative of a cation-selective OmpF channel and is in excellent agreement with previous experimen-tal measurements (Benz et al., 1985).
As a comparison, channel selectivity was deter-mined from the MD simulations by calculating the ratio of permeability coefficients PK/PCl extracted from the Goldman–Hodgkin–Katz equation, or by calculating the current ratio IK/ICl at zero applied voltage in the asym-metric KCl condition. These values (PK/PCl of 4.2 and IK/ICl of 2.4) are in reasonable agreement with each
an important role in their permeation, especially at high salt concentration. Specifically, Cl permeation has been observed to require K+ counter ions, whereas K+ permeation can occur independently of Cl (Im and Roux, 2002b).
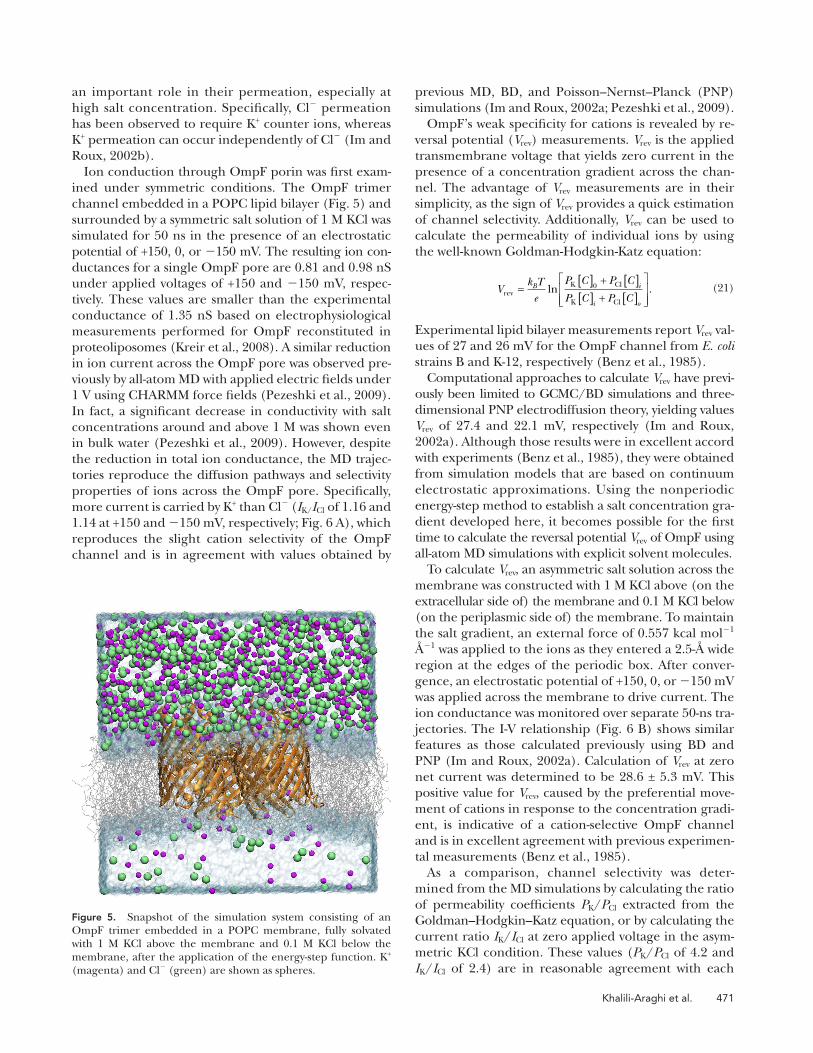
Ion conduction through OmpF porin was first exam-ined under symmetric conditions. The OmpF trimer channel embedded in a POPC lipid bilayer (Fig. 5) and surrounded by a symmetric salt solution of 1 M KCl was simulated for 50 ns in the presence of an electrostatic potential of +150, 0, or 150 mV. The resulting ion con-ductances for a single OmpF pore are 0.81 and 0.98 nS under applied voltages of +150 and 150 mV, respec-tively. These values are smaller than the experimental conductance of 1.35 nS based on electrophysiological measurements performed for OmpF reconstituted in proteoliposomes (Kreir et al., 2008). A similar reduction in ion current across the OmpF pore was observed pre-viously by all-atom MD with applied electric fields under 1 V using CHARMM force fields (Pezeshki et al., 2009). In fact, a significant decrease in conductivity with salt concentrations around and above 1 M was shown even in bulk water (Pezeshki et al., 2009). However, despite the reduction in total ion conductance, the MD trajec-tories reproduce the diffusion pathways and selectivity properties of ions across the OmpF pore. Specifically, more current is carried by K+ than Cl (IK/ICl of 1.16 and 1.14 at +150 and 150 mV, respectively; Fig. 6 A), which reproduces the slight cation selectivity of the OmpF channel and is in agreement with values obtained by
Figure 5. Snapshot of the simulation system consisting of an OmpF trimer embedded in a POPC membrane, fully solvated with 1 M KCl above the membrane and 0.1 M KCl below the membrane, after the application of the energy-step function. K+ (magenta) and Cl (green) are shown as spheres.

472 Simulation of asymmetric concentration
and assumed a symmetric concentration of K+ on both sides of the channel.
We have simulated the ion conduction pore of Kv1.2 embedded in a POPC lipid bilayer surrounded by NaCl and KCl solutions at physiological ionic concentrations. The intracellular solution is maintained at concentrations of 100 mM KCl and 10 mM NaCl, whereas the extracel-lular solution is kept at concentrations of 10 mM KCl and 100 mM NaCl. An electrostatic potential of 100 mV is applied across the membrane to mimic the hyper-polarized cellular membrane. A snapshot of the system and the electrostatic potential across a plane passing through the membrane is shown in Fig. 7 (A and B, respectively). The trajectory is obviously too short (50 ns) to obtain an accurate estimate of the channel conduc-tance, although it is sufficiently long to display the aver-age spatial distribution of the different ions around the intracellular and extracellular channel entrances.
Fig. 8 shows the local density profile of K+, Na+, and Cl ions in a plane normal to the membrane. The den-sity profiles are radially averaged over the symmetry axis of the protein (z axis). Although Cl ions are distributed uniformly between the two ionic solutions on two sides of the membrane, z > 0 and z < 0, K+ ions are concentrated on the intracellular side (z < 0), and Na+ ions are con-centrated on the extracellular side (z > 0) (Fig. 8, A–C). The average density of K+ ions is 10 and 100 mM in the extracellular and intracellular solutions, respectively, whereas the Na+ ions are distributed with an average density of 100 and 10 mM in the extracellular and intra-cellular compartments. The average Cl density in each compartment is 110 mM, resulting in a solution that is locally neutralized. Fig. 8 A shows the location of two K+ ions in the selectivity filter (high K+ density). On the other hand, Na+ ions (Fig. 8 B) accumulate in ex-cess of 200 mM near the extracellular entrance of the pore, where the selectivity filter prevents Na+ ions from entering the pore and flowing down their electrochemi-cal gradient.
other and correspond to OmpF ion selectivity values cal-culated previously from experimental data (PK/PCl of 3.9 and 3.6 for the OmpF channel from E. coli strains B and K-12, respectively; Benz et al., 1985), and from BD (PK/PCl of 3.9 and IK/ICl of 3.4) and PNP (PK/PCl of 2.9 and IK/ICl of 2.4) simulations (Im and Roux, 2002a).
Ion selectivity for the OmpF channel has been shown previously to vary dramatically with KCl concentration (Im and Roux, 2002a), preventing accurate calculation of channel selectivity in a symmetric salt solution. Im-plementation of the developed method therefore al-lows for channel properties such as ion selectivity to be determined for other molecular pores in the absence of experimental functional data.
Ionic environment of the Kv1.2 channel pore domainIn contrast to the moderate cation specificity of the OmpF porin, the Kv1.2 channel is extremely selective for K+ over Na+. These voltage-gated channels respond to changes in membrane potential by opening (or closing) their highly selective conduction pores to control the flux of ions across the membrane. Upon depolarization of the cell membrane, the ion conduction pore opens and K+ ions flow down their electrochemical gradient across the membrane. Despite a 10-fold concentration gradient, Na+ ions do not pass through the conduction pore. Al-though K+ ions flow from the intracellular side (high K+) toward the extracellular solution (low K+) through the pore, the smaller Na+ ions face a barrier at the selectivity filter and maintain a high concentration gradient on the extracellular side. Therefore, under physiological con-ditions, the channel embedded in the cell membrane is exposed to a high concentration of Na+ on the external side and is submitted to a negative membrane potential that could further drive Na+ inward. Understanding how the channel performs under realistic physiological conditions is of great interest. However, all previous MD simulations of K+ channels were constrained by PBCs
Figure 6. MD simulation of ion permeation and selectivity of OmpF porin. (A) Ion selectivity of OmpF porin. The I-V curves were calcu-lated in (A) 1 M KCl symmetric solution or (B) 0.1:1 M KCl asymmetric solution from MD trajectories. The total current per monomer (black) is the sum of K+ (purple) and Cl (green) currents. Error bars are calculated from Eq. 19.

Khalili-Araghi et al. 473
particles is known, the height of the step directly deter-mines the equilibrium concentration of the solute on each side of the membrane.
In contrast to the alternative dual-membrane–dual-volume approach, in which two bulk regions are con-structed to define independent solvent environments on the two sides of a membrane, the present method can be used to simulate a single-membrane system with almost no additional computational cost. In the case of wide membrane pores, such as OmpF, the coarse-grained methodologies that combine BD and PNP the-ories with a continuum description of the solvent are shown to reproduce conduction properties of the channel successfully (Im and Roux, 2002a). However, describ-ing the selectivity and conduction of more specialized ion channels will require an all-atom description of the system.
It is worth noting that the nonperiodic energy step could also be used to create a net charge imbalance across the membrane, resulting in an effective membrane potential of V = Q/C (Treptow et al., 2009; Delemotte et al., 2011). However, as there is no simple relationship
In these simulations, the nonperiodic energy steps are applied to Na+ and K+ ions to generate two separate ionic solutions. No energy step is applied to Cl ions, which are free to move and distribute between the two compartments. However, as shown in Fig. 8 (A–C), each ionic solution remains neutral. In the absence of any external forces, the Cl ions follow cations, crossing the barrier as part of ion pairs.
ConclusionA simple method has been developed to permit simula-tions of biomembrane systems under realistic asymmet-ric solute concentrations. Introducing an energy step at the boundaries of the periodic cell effectively sepa-rates the two solutions and generates a nonuniform dis-tribution of the solute molecules across the cell boundaries. The nonperiodic energy step is implemented through the application of external forces over a thin region near the boundaries of the system. The method allows the ion concentration on each side of the membrane to be controlled separately as long as the total number of ions remains constant. When the total number of solute
Figure 7. MD simulations of the pore domain of Kv1.2 under physiological conditions. (A) The pore domain of Kv1.2 embedded in a POPC lipid bilayer with asymmetric ionic concentrations. (B) Electrostatic potential map over a cross section of the system normal to the membrane averaged over the last 10 ns of the simulation trajectory. (C) Electrostatic potential normal to the plane of membrane averaged over 1-Å-wide cross sections along the x axis.
Figure 8. Local density profile of K+, Na+, and Cl ions obtained from the simulations of Kv1.2. Local densities are plotted as a function of radial distance from the pore axis r and the distance from the bottom of the peri-odic box z.
474 Simulation of asymmetric concentration
implementation in other simulation packages should be trivial. Although the method was illustrated with two ion channels, it is worth emphasizing that it is completely general and could be used to realistically simulate the asymmetric environment of any membrane protein.
This work was supported by grants R01-GM062342 and U54-GM087519 from the National Institutes of Health to B. Roux and K22-AI100927 to J.C. Gumbart.
Edward N. Pugh Jr. served as editor.
Submitted: 23 April 2013Accepted: 30 August 2013
R E F E R E N C E SAksimentiev, A., and K. Schulten. 2005. Imaging alpha-hemolysin
with molecular dynamics: ionic conductance, osmotic permeabil-ity, and the electrostatic potential map. Biophys. J. 88:3745–3761. http://dx.doi.org/10.1529/biophysj.104.058727
Benz, R., A. Schmid, and R.E. Hancock. 1985. Ion selectivity of gram-negative bacterial porins. J. Bacteriol. 162:722–727.
Böckmann, R.A., A. Hac, T. Heimburg, and H. Grubmüller. 2003. Effect of sodium chloride on a lipid bilayer. Biophys. J. 85:1647–1655. http://dx.doi.org/10.1016/S0006-3495(03)74594-9
Cowan, S.W., T. Schirmer, G. Rummel, M. Steiert, R. Ghosh, R.A. Pauptit, J.N. Jansonius, and J.P. Rosenbusch. 1992. Crystal struc-tures explain functional properties of two E. coli porins. Nature. 358:727–733. http://dx.doi.org/10.1038/358727a0
Cowan, S.W., R.M. Garavito, J.N. Jansonius, J.A. Jenkins, R. Karlsson, N. König, E.F. Pai, R.A. Pauptit, P.J. Rizkallah, J.P. Rosenbusch, et al. 1995. The structure of OmpF porin in a tetragonal crys-tal form. Structure. 3:1041–1050. http://dx.doi.org/10.1016/S0969-2126(01)00240-4
Crozier, P.S., D. Henderson, R.L. Rowley, and D.D. Busath. 2001a. Model channel ion currents in NaCl-extended simple point charge water solution with applied-field molecular dynamics. Biophys. J. 81:3077–3089. http://dx.doi.org/10.1016/S0006-3495(01)75946-2
Crozier, P.S., R.L. Rowley, N.B. Holladay, D. Henderson, and D.D. Busath. 2001b. Molecular dynamics simulation of continuous cur-rent flow through a model biological membrane channel. Phys. Rev. Lett. 86:2467–2470. http://dx.doi.org/10.1103/PhysRevLett.86.2467
Darden, T., D. York, and L. Pedersen. 1993. Particle mesh Ewald: An N·log(N) method for Ewald sums in large systems. J. Chem. Phys. 98:10089–10092. http://dx.doi.org/10.1063/1.464397
Delemotte, L., F. Dehez, W. Treptow, and M. Tarek. 2008. Modeling membranes under a transmembrane potential. J. Phys. Chem. B. 112:5547–5550. http://dx.doi.org/10.1021/jp710846y
Delemotte, L., M. Tarek, M.L. Klein, C. Amaral, and W. Treptow. 2011. Intermediate states of the Kv1.2 voltage sensor from atom-istic molecular dynamics simulations. Proc. Natl. Acad. Sci. USA. 108:6109–6114. http://dx.doi.org/10.1073/pnas.1102724108
Egwolf, B., Y. Luo, D.E. Walters, and B. Roux. 2010. Ion selectivity of alpha-hemolysin with beta-cyclodextrin adapter. II. Multi-ion effects studied with grand canonical Monte Carlo/Brownian dy-namics simulations. J. Phys. Chem. B. 114:2901–2909. http://dx.doi.org/10.1021/jp906791b
Feller, S.E., D. Yin, R.W. Pastor, and A.D. MacKerell Jr. 1997. Molecular dynamics simulation of unsaturated lipid bilayers at low hydration: parameterization and comparison with diffraction studies. Biophys. J. 73:2269–2279. http://dx.doi.org/10.1016/S0006-3495(97)78259-6
between the energy step, the charge imbalance, and the resulting membrane potential, this procedure would require iterative adjustments until the desired membrane potential is obtained. In contrast, a chosen transmem-brane potential can easily be established by applying a constant electric field in the z direction across the system (Roux, 2008; Gumbart et al., 2012). Because the latter method is on solid formal grounds and is more direct, it appears more advantageous (Roux, 2008; Gumbart et al., 2012).
Because the energy step impacts only the probabil-ity distribution of the solute and not the absolute num-ber of ions in each solution, it is possible to effectively simulate membrane systems with arbitrarily low ionic concentrations. To achieve physiologically low ionic concentrations in conventional simulations, the solvent volume normally must be expanded such that an inte-ger number of solute particles results in the desired concentration. For a single-membrane system, reaching micromolar concentrations would require a membrane system surrounded by 107 water molecules, i.e., 50 times larger than the average size of a typical membrane– protein MD system. In contrast, because the effective concentration is realized as a time average, it can be set to an arbitrarily low value with the nonperiodic energy-step method for a typical-size system.
We have validated the method over a wide range of external forces for the case of a small membrane slab. Next, this method has allowed us to calculate the re-versal potential of the current passing through the bacterial porin OmpF from all-atom MD simulations. These simulations replicate the experimental condi-tion under which the reversal potential is measured in electrophysiological experiments, and the quantitative agreement between the two approaches demonstrates the ability of the developed method to accurately re-produce conductance and ion selectivity properties of a complex molecular pore. Finally, we have simulated the Kv1.2 potassium channel under physiologically relevant concentrations of KCl and NaCl by control-ling the concentration of each ionic species separately. These simulations provide a realistic representation of the cellular environment in which asymmetric ionic concentrations across the membrane are essential for the proper function of the cell. The simulations reported here are too short (50 ns) to reproduce ionic currents passing through the narrow selectivity filter of potassium channels. Extremely long MD simu-lations of potassium channel under symmetric ion concentration with an external electric field did not succeed previously to reproduce the experimental conductance of K+ channels (Jensen et al., 2010, 2013) because of the limitations of the nonpolarizable atomic force field.
The nonperiodic energy-step method has been im-plemented in the MD program NAMD; however, its

Khalili-Araghi et al. 475
Gumbart, J., F. Khalili-Araghi, M. Sotomayor, and B. Roux. 2012. Constant electric field simulations of the membrane potential illustrated with simple systems. Biochim. Biophys. Acta. 1818:294–302. http://dx.doi.org/10.1016/j.bbamem.2011.09.030
Humphrey, W., A. Dalke, and K. Schulten. 1996. VMD: visual mo-lecular dynamics. J. Mol. Graph. 14:33–38. http://dx.doi.org/10.1016/0263-7855(96)00018-5
Im, W., and B. Roux. 2002a. Ion permeation and selectivity of OmpF porin: a theoretical study based on molecular dynamics, Brownian dynamics, and continuum electrodiffusion theory. J. Mol. Biol. 322:851–869. http://dx.doi.org/10.1016/S0022-2836(02)00778-7
Im, W., and B. Roux. 2002b. Ions and counterions in a biological channel: a molecular dynamics simulation of OmpF porin from Escherichia coli in an explicit membrane with 1 M KCl aqueous salt solution. J. Mol. Biol. 319:1177–1197. http://dx.doi.org/10.1016/S0022-2836(02)00380-7
Im, W., S. Seefeld, and B. Roux. 2000. A Grand Canonical Monte Carlo-Brownian dynamics algorithm for simulating ion chan-nels. Biophys. J. 79:788–801. http://dx.doi.org/10.1016/S0006-3495(00)76336-3
Jaynes, E.T. 1957. Information theory and statistical mechanics. Phys. Rev. 106:620–630. http://dx.doi.org/10.1103/PhysRev.106.620
Jensen, M.Ø., D.W. Borhani, K. Lindorff-Larsen, P. Maragakis, V. Jogini, M.P. Eastwood, R.O. Dror, and D.E. Shaw. 2010. Principles of conduction and hydrophobic gating in K+ channels. Proc. Natl. Acad. Sci. USA. 107:5833–5838. http://dx.doi.org/10.1073/pnas.0911691107
Jensen, M.Ø., V. Jogini, M.P. Eastwood, and D.E. Shaw. 2013. Atomic-level simulation of current–voltage relationships in single- file ion channels. J. Gen. Physiol. 141:619–632. http://dx.doi.org/10.1085/jgp.201210820
Jo, S., T. Kim, V.G. Iyer, and W. Im. 2008. CHARMM-GUI: a web-based graphical user interface for CHARMM. J. Comput. Chem. 29:1859–1865. http://dx.doi.org/10.1002/jcc.20945
Jorgensen, W.L., J. Chandrasekhar, J.D. Madura, R.W. Impey, and M.L. Klein. 1983. Comparison of simple potential functions for simulating liquid water. J. Chem. Phys. 79:926–935. http://dx.doi.org/10.1063/1.445869
Khalili-Araghi, F., E. Tajkhorshid, and K. Schulten. 2006. Dynamics of K+ ion conduction through Kv1.2. Biophys. J. 91:L72–L74. http://dx.doi.org/10.1529/biophysj.106.091926
Klauda, J.B., R.M. Venable, J.A. Freites, J.W. O’Connor, D.J. Tobias, C. Mondragon-Ramirez, I. Vorobyov, A.D. MacKerell Jr., and R.W. Pastor. 2010. Update of the CHARMM all-atom additive force field for lipids: validation on six lipid types. J. Phys. Chem. B. 114:7830–7843. http://dx.doi.org/10.1021/jp101759q
Kreir, M., C. Farre, M. Beckler, M. George, and N. Fertig. 2008. Rapid screening of membrane protein activity: electrophysiologi-cal analysis of OmpF reconstituted in proteoliposomes. Lab Chip. 8:587–595. http://dx.doi.org/10.1039/b713982a
Kutzner, C., H. Grubmüller, B.L. de Groot, and U. Zachariae. 2011. Computational electrophysiology: the molecular dynamics of ion channel permeation and selectivity in atomistic detail. Biophys. J. 101:809–817. http://dx.doi.org/10.1016/j.bpj.2011.06.010
Lee, K.I., H. Rui, R.W. Pastor, and W. Im. 2011. Brownian dynam-ics simulations of ion transport through the VDAC. Biophys. J. 100:611–619. http://dx.doi.org/10.1016/j.bpj.2010.12.3708
Lee, K.I., S. Jo, H. Rui, B. Egwolf, B. Roux, R.W. Pastor, and W. Im. 2012. Web interface for Brownian dynamics simulation of ion transport and its applications to beta-barrel pores. J. Comput. Chem. 33:331–339. http://dx.doi.org/10.1002/jcc.21952
Long, S.B., E.B. Campbell, and R. Mackinnon. 2005. Crystal struc-ture of a mammalian voltage-dependent Shaker family K+ chan-nel. Science. 309:897–903. http://dx.doi.org/10.1126/science.1116269
MacKerell, A.D., Jr., D. Bashford, M. Bellot, R.L. Dunbrack Jr., J.D. Evanseck, M.J. Field, S. Fischer, J. Gao, H. Guo, S. Ha, et al. 1998. All-atom empirical potential for molecular modeling and dynam-ics studies of proteins. J. Phys. Chem. B. 102:3586–3616. http://dx.doi.org/10.1021/jp973084f
Noskov, S.Y., W. Im, and B. Roux. 2004. Ion permeation through the alpha-hemolysin channel: theoretical studies based on Brownian dynamics and Poisson-Nernst-Plank electrodiffusion theory. Biophys. J. 87:2299–2309. http://dx.doi.org/10.1529/biophysj.104.044008
Pezeshki, S., C. Chimerel, A.N. Bessonov, M. Winterhalter, and U. Kleinekathöfer. 2009. Understanding ion conductance on a molecular level: an all-atom modeling of the bacterial porin OmpF. Biophys. J. 97:1898–1906. http://dx.doi.org/10.1016/j.bpj.2009.07.018
Phillips, J.C., R. Braun, W. Wang, J. Gumbart, E. Tajkhorshid, E. Villa, C. Chipot, R.D. Skeel, L. Kalé, and K. Schulten. 2005. Scalable molecular dynamics with NAMD. J. Comput. Chem. 26:1781–1802. http://dx.doi.org/10.1002/jcc.20289
Roux, B. 2008. The membrane potential and its representation by a constant electric field in computer simulations. Biophys. J. 95:4205–4216. http://dx.doi.org/10.1529/biophysj.108.136499
Roux, B. 2011. Computational electrophysiology: the molecular dynamics of ion channel permeation and selectivity in atomis-tic detail. Biophys. J. 101:755–756. http://dx.doi.org/10.1016/j.bpj.2011.07.002
Sachs, J.N., P.S. Crozier, and T.B. Woolf. 2004. Atomistic simula-tions of biologically realistic transmembrane potential gradients. J. Chem. Phys. 121:10847–10851.
Sotomayor, M., V. Vásquez, E. Perozo, and K. Schulten. 2007. Ion conduction through MscS as determined by electrophysiology and simulation. Biophys. J. 92:886–902.
Treptow, W., M. Tarek, and M.L. Klein. 2009. Initial response of the potassium channel voltage sensor to a transmembrane potential. J. Am. Chem. Soc. 131:2107–2109.
Vácha, R., M.L. Berkowitz, and P. Jungwirth. 2009. Molecular model of a cell plasma membrane with an asymmetric multicompo-nent composition: water permeation and ion effects. Biophys. J. 96:4493–4501.
Varma, S., S.-W. Chiu, and E. Jakobsson. 2006. The influence of amino acid protonation states on molecular dynamics simula-tions of the bacterial porin OmpF. Biophys. J. 90:112–123.
Zhu, F., E. Tajkhorshid, and K. Schulten. 2004. Theory and simula-tion of water permeation in aquaporin-1. Biophys. J. 86:50–57.
Related Documents