International Journal of Mechanical Sciences 43 (2001) 2237–2260 Molecular dynamics (MD) simulation of uniaxial tension of some single-crystal cubic metals at nanolevel R. Komanduri a ; ∗ , N. Chandrasekaran a , L.M. Ra b a Mechanical and Aerospace Engineering, Oklahoma State University, 218 Engineering North, Stillwater, OK 74078-5016, USA b Chemistry Department, Oklahoma State University, Physical Sciences I, Stillwater, OK 74078-5016, USA Received 5 April 2000; received in revised form 14 February 2001 Abstract Molecular Dynamics (MD) simulations of uniaxial tension at nanolevel have been carried out at a constant rate of loading (500 ms −1 ) on some single-crystal cubic metals, both FCC (Al, Cu, and Ni) and BCC (Fe, Cr, and W) to investigate the nature of deformation and fracture. Failure of the workmaterials due to void formation, their coalescence into nanocracks, and subsequent fracture or separation were observed similar to their behavior at macroscale. The engineering stress–strain diagrams obtained by the MD simulations of the tensile specimens of various materials show a rapid increase in stress up to a maximum followed by a gradual drop to zero when the specimen fails by ductile fracture. The radius of the neck is found to increase with an increase in the deformation of the specimen and to decrease as the ductility of the material decreases. In this investigation, the strain to fracture is observed to be lower with the BCC materials than FCC materials. In the case of BCC crystals, no distinct linear trend in the engineering stress–strain characteristics is observed. Instead, rapid uctuations in the force values were observed. If the drop in the force curves can be attributed to the rearrangement of atoms to a new or modied crystalline structure, it appears that BCC materials undergo a signicant change in their structure and subsequent realignment relative to the FCC materials, as previously reported in the literature. While good correlation is found between the D- and -parameters of the Morse potential with the ultimate strength and the strain to failure for the FCC metals, no such correlation is found for the BCC metals. From this, it appears that Morse potentials may not represent the deformation behavior of BCC metals as accurately as FCC metals and alternate potentials may need to be considered. ? 2001 Elsevier Science Ltd. All rights reserved. Keywords: Tension; Molecular dynamics simulation; Nano-mechanical properties ∗ Corresponding author. Tel.: +1-405-744-5900; fax: +1-405-744-7873. E-mail address: [email protected] (R. Komanduri). 0020-7403/01/$ - see front matter ? 2001 Elsevier Science Ltd. All rights reserved. PII: S0020-7403(01)00043-1

Welcome message from author
This document is posted to help you gain knowledge. Please leave a comment to let me know what you think about it! Share it to your friends and learn new things together.
Transcript
International Journal of Mechanical Sciences 43 (2001) 2237–2260
Molecular dynamics (MD) simulation of uniaxial tension ofsome single-crystal cubic metals at nanolevel
R. Komanduria ;∗, N. Chandrasekarana, L.M. Ra- b
aMechanical and Aerospace Engineering, Oklahoma State University, 218 Engineering North,Stillwater, OK 74078-5016, USA
bChemistry Department, Oklahoma State University, Physical Sciences I, Stillwater, OK 74078-5016, USA
Received 5 April 2000; received in revised form 14 February 2001
Abstract
Molecular Dynamics (MD) simulations of uniaxial tension at nanolevel have been carried out at aconstant rate of loading (500 m s−1) on some single-crystal cubic metals, both FCC (Al, Cu, and Ni) andBCC (Fe, Cr, and W) to investigate the nature of deformation and fracture. Failure of the workmaterialsdue to void formation, their coalescence into nanocracks, and subsequent fracture or separation wereobserved similar to their behavior at macroscale. The engineering stress–strain diagrams obtained by theMD simulations of the tensile specimens of various materials show a rapid increase in stress up to amaximum followed by a gradual drop to zero when the specimen fails by ductile fracture. The radiusof the neck is found to increase with an increase in the deformation of the specimen and to decreaseas the ductility of the material decreases. In this investigation, the strain to fracture is observed to belower with the BCC materials than FCC materials. In the case of BCC crystals, no distinct linear trendin the engineering stress–strain characteristics is observed. Instead, rapid 9uctuations in the force valueswere observed. If the drop in the force curves can be attributed to the rearrangement of atoms to anew or modi:ed crystalline structure, it appears that BCC materials undergo a signi:cant change intheir structure and subsequent realignment relative to the FCC materials, as previously reported in theliterature. While good correlation is found between the D- and �-parameters of the Morse potential withthe ultimate strength and the strain to failure for the FCC metals, no such correlation is found for theBCC metals. From this, it appears that Morse potentials may not represent the deformation behavior ofBCC metals as accurately as FCC metals and alternate potentials may need to be considered. ? 2001Elsevier Science Ltd. All rights reserved.
Keywords: Tension; Molecular dynamics simulation; Nano-mechanical properties
∗ Corresponding author. Tel.: +1-405-744-5900; fax: +1-405-744-7873.E-mail address: [email protected] (R. Komanduri).
0020-7403/01/$ - see front matter ? 2001 Elsevier Science Ltd. All rights reserved.PII: S 0020-7403(01)00043-1
2238 R. Komanduri et al. / International Journal of Mechanical Sciences 43 (2001) 2237–2260
1. Introduction
Technological advancements have paved the way toward the development of micro- andnano-components in micro-electro-mechanical systems (MEMS) and micro-opto-electro-mechanical systems (MOEMS) [1]. The micro- and nano-structural elements used in them arerequired to withstand the complex stress state with minimal probability of failure. At the sametime, the structural elements made of these materials are produced by such special processesthat they are almost devoid of defects. These ideal materials (with no or very few defects andstrength close to their theoretical values) are going to be the norm rather than exception fornanocomponents in MEMS and MOEMS. Hence, an investigation of the strength and defor-mation behavior of defect-free materials at nanometer level greatly facilitates the analysis ofnano-components.
Generally, the material properties of the nano-components are determined using nanoindenta-tion tests with extremely light loads in the range of nano-Newtons [2]. While tensile tests aremost common in determining the mechanical properties at macrolevel, such tests at nanoscaleare extremely diIcult, if not impossible to conduct. Even if this is possible, the costs in-volved in performing nano-regime tensile testing would be signi:cant due to the inherentcomplexity of the equipment. Also, the production of defect-free materials in the form oftensile specimens would be very diIcult. An alternative approach is MD simulations. Eventhough the fracture stress of real crystals are dependent on their defect density, the theo-retical strength of ideal materials depend on the way defect-free crystals would deform andfail [3].
In this investigation, MD simulations of tension are carried out to study the behavior of arange of single crystal cubic metals, both FCC (Al, Cu, and Ni) and BCC (Fe, Cr, and W)under uniaxial loading. An attempt is made to relate the mechanical properties and deformationbehavior determined by the simulation with the Morse potential parameters (D and �-parameters)used in the modeling of these materials.
2. Literature review
In view of the vast amount of literature in the general :eld of MD simulation, only literaturerelevant to MD simulations of tensile testing will be brie9y reviewed. Macmillan and Kelley [4]conducted MD simulations of uniaxial tension on NaCl crystals using a simple, two-body, centralforce Born–Mayer potential. Marked anisotropy in the ideal tensile strength, with a pronouncedminimum for the 〈1 0 0〉 plane was found. This is consistent with the observed cleavage onthis plane. Also, the maximum strain the crystal can withstand before failure depended on thedirection of the applied strain and whether the unit cell dimensions perpendicular to the stressdirection are allowed to relax or not. Parinello and Rahman [5] introduced a new Lagrangianformulation to perform MD simulations on systems under external stress. Using this method,they applied uniaxial stress to a FCC cubic lattice (Ni) with periodic boundary conditions at350 K. Under uniaxial compression, they suggested a transformation in the crystal structurefrom FCC to HCP. The maximum tensile strength under uniaxial tension was reported to be11× 1010 dyn cm−2.
R. Komanduri et al. / International Journal of Mechanical Sciences 43 (2001) 2237–2260 2239
Selinger et al. [6] investigated the statistical thermodynamics of stretched 2-D Lennard–Jonestype perfect crystals. They reported an increase in stress to a critical value after which thecrystal became unstable and failed. The failure was attributed to the growth of defects causedby thermal 9uctuations. It was suggested that a change to the stable state due to the thermal9uctuations is possible only when the applied stress is very close to the critical stress value.Selinger et al. [7] investigated the failure of a 3-D FCC (Pt) metal using a hybrid MD=MonteCarlo computational technique that allowed changes in both shape and volume of the periodicboundary condition. Under low temperature and slow loading conditions, a crystal–crystal phasetransition was reported to precede crystal failure. As the stretching force was increased, theyobserved the extension to increase steadily followed by a sudden jump to a longer extension.The crystal was then reported to stretch continuously in a steady manner until it broke. Theauthors attribute the sudden jump to a phase change undergone by the crystal as a result of theimposed stress. The phase change was reported to take place in order to enable the crystal topartially relieve the imposed stress. At higher temperatures, direct failure of the system due tostress-induced melting was reported.
Lynden-Bell [8,9] conducted MD=Monte Carlo simulations of uniaxial tension at various tem-peratures [(0.04–0.7)Tm; where Tm is the bulk melting temperature of the material] on platinum,gold, rhodium, and silver. Failure of the crystals was reported to be due to void formation andtheir growth to nanocracks. At low temperatures the stress was reported to increase to a maxi-mum after which a series of structural rearrangements of the crystal accompanied by a decreasein the stress magnitude was reported. Highly ductile metals, such as platinum=gold were re-ported to develop local regions of disorder :rst, in comparison to slip between planes of atomsrelative to each other, with not-so-ductile metals, such as rhodium or silver. At temperaturesabove half the melting point, all the metals were reported to be disordered before failure byvoid formation. A liquid-like, highly disordered region was said to exist in the fracture re-gion. This occurs when the free energies of the ordered and disordered states are equal. Itappears that an investigation of the tensile behavior at various temperatures would require con-sideration of both short range as well as long range order in the material. Thus, the potentialfunction used should incorporate many-body terms to represent the behavior of the metal inbulk.
Rentsch and Inasaki [10] conducted MD simulations of uniaxial tension of silicon to verify thematerial representation of silicon in fracture. They reported a linear increase in the stress–strainrelation followed by a sudden break down to zero. They also reported anisotropic deformationof silicon. The Young’s modulus and the speci:c surface energy of silicon were found to be171 GPa and 0:393 J m−2; respectively.Doyama [11] conducted MD simulations of tension on iron and copper single crystals with
free boundaries. The iron and copper specimens were prepared with a notch and pulled in the[1 1 1] and [0 0 1] directions, respectively. They suggest that the notch is normally a source ofdislocations due to stress concentration and the dislocations are mostly half-dislocations. Theyobserved no perfect dislocations in their simulations. With decreasing notch thickness, the e-ectof the crack was reported to decrease although interaction still exists across the notch. Theinitial stage of deformation was found to be due to dislocations followed by cross linkagebetween dislocations on di-erent slip planes in the middle stage resulting in work hardeningwith the :nal stage consisting of many dislocations and inhomogenous deformation. Studies of
2240 R. Komanduri et al. / International Journal of Mechanical Sciences 43 (2001) 2237–2260
crack propagation, dynamic instability, and subsequent failure by MD simulations of tensionhave been reported by other researchers [12–14].
Kitamura et al. [15] conducted atomic simulations of tension on a nanoscopic wire, :lm, andbulk of a Ni lattice without defects. To investigate the e-ect of constraint of transverse deforma-tion on the fracture process, simulations for the bulk were conducted under two conditions: (1)free transverse stress condition and (2) fully constrained condition. During the fracture process,the wire and the :lm were reported to exhibit multiple slip resulting in the neck formation aftera strain of 1.0. Concentrated shear deformation with the localization of slip in the necked regionwas reported to result in ductile fracture. However, with the bulk specimen, they reported ab-sence of necking by slip even at a strain of 1.0. The transformation was reported to be inducedby the tensile strain. In the case of tension experiments with free transverse stress condition,i.e. without the constraint of transverse deformation, yielding was reported to be brought aboutby the crystallographic slip on the (1 1 1) planes at a strain of ∼0:1. The yield stress in ten-sion was found to be ∼15–20 GPa and very little di-erence in strength was reported betweenthe wire, the :lm, and the bulk. Multiple slip even after yielding of the crystal and signi:-cant plastic deformation were reported to cause ductile shear fracture. In the simulations withconstraint of transverse deformation, the yield stress was reported to reach 40 GPa. No plasticstrain was generated. This is attributed to the restriction of dislocation glide. Cleavage crackswere observed and found to bring about brittle fracture and hence a change in the fracturemode.
Heino et al. [16] conducted MD simulations of tension and shear on Cu for [1 0 0] [0 1 0],[0 1 N1][0 1 1]; and [ N1 N1 2][1 1 1] orientations. The di-erences between the calculated and the ex-perimental tensile and shear moduli were reported to be in the range of 2–6% and 3–15%,respectively. This di-erence was attributed to the e-ect of boundary conditions. With a freeboundary condition, plastic deformation by slip on the {1 1 1} planes was reported. An in-crease in the strength with decreasing system size and a decrease with increasing disorderwere also found. The computed failure strain was 8.5%. In the study of crack propagation,generation of microvoids and crack propagation as a result of coalescing of microvoids wasobserved.
Heino et al. [17] studied MD simulations of tensile loading (periodic as well as free bound-aries) on copper with various types of defects, namely, point defects, grain boundaries, andinitial void serving as a crack seed. They used a many-atom, ab initio type potential obtainedfrom e-ective medium theory [18]. The internal temperature of the system was controlled witha Nose′–Hoover thermostat that was in contact with the boundaries but not with the processregion. The boundary between these regions was assumed to be smooth. With periodic grainboundaries, the tensile modulus of copper in the elastic region was reported to be 210 GPa. Theyconcluded that the simulation results are in quantitative agreement with the experiments. Theyobtained the tensile modulus of the grain boundary to be ∼40% less than the whole system.They also stated that the modulus of the grain boundary depend crucially on its microstructure.Cracking was reported to have been initiated at a location where the strain concentration dueto di-erences in the modulus of the grain boundary and the ordered bulk was the largest. Afterinitiation, the crack was reported to propagate along the grain boundaries. The strength of thesystem with periodic boundaries was reported to be ∼10:3 GPa. In the tensile loading of a sys-tem with grain boundaries but with free boundaries, they reported absence of crack propagation
R. Komanduri et al. / International Journal of Mechanical Sciences 43 (2001) 2237–2260 2241
with failure occurring due to grain boundary sliding. In this case, the system was reported tofail at low strain and stress values.
3. Methodology of molecular dynamics (MD) simulation
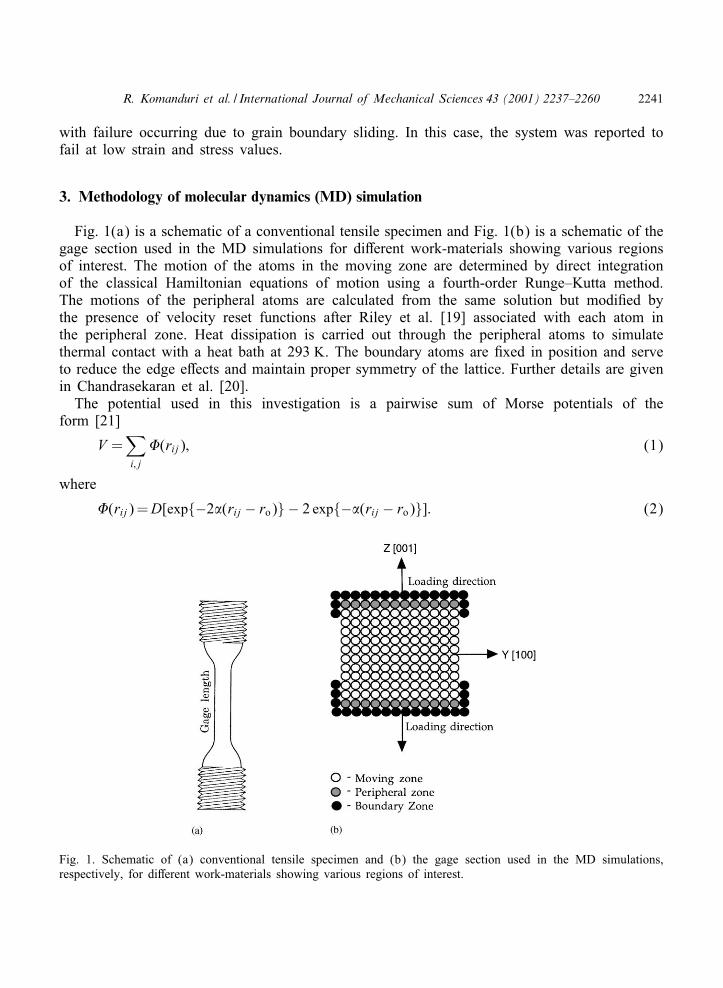
Fig. 1(a) is a schematic of a conventional tensile specimen and Fig. 1(b) is a schematic of thegage section used in the MD simulations for di-erent work-materials showing various regionsof interest. The motion of the atoms in the moving zone are determined by direct integrationof the classical Hamiltonian equations of motion using a fourth-order Runge–Kutta method.The motions of the peripheral atoms are calculated from the same solution but modi:ed bythe presence of velocity reset functions after Riley et al. [19] associated with each atom inthe peripheral zone. Heat dissipation is carried out through the peripheral atoms to simulatethermal contact with a heat bath at 293 K. The boundary atoms are :xed in position and serveto reduce the edge e-ects and maintain proper symmetry of the lattice. Further details are givenin Chandrasekaran et al. [20].
The potential used in this investigation is a pairwise sum of Morse potentials of theform [21]
V =∑
i; j
(rij); (1)
where
(rij)=D[exp{−2�(rij − ro)} − 2 exp{−�(rij − ro)}]: (2)
Fig. 1. Schematic of (a) conventional tensile specimen and (b) the gage section used in the MD simulations,respectively, for di-erent work-materials showing various regions of interest.
2242 R. Komanduri et al. / International Journal of Mechanical Sciences 43 (2001) 2237–2260
Table 1Computational parameters used in the MD simulation of uniaxial tensileloading
Con:guration 3-DPotential used Morse potentialWorkmaterial dimensions 5a× 15a× 15a, a—lattice constantTensile loading condition UniaxialSpeed of simulation 500 m=sBulk temperature 293 K
The Morse potential parameters for the tensile specimen, namely, D; � and re are generallyadjusted to the measured sublimation enthalphy, Debye temperature, and nearest-neighbor spac-ings. The cuto- radius (rc) is chosen such that the ratio of the potential at the cuto- point tothat at equilibrium is less than 4%. The use of such a cuto- radius ensures that the calcula-tions will not consume large amounts of computational time in evaluating the forces that arenear zero. The MD simulations require the solution of 6N (N -total number of atoms) simul-taneous, coupled, :rst-order di-erential equations of motion. This solution is obtained using afourth-order Runge–Kutta algorithm with a :xed integration step size of 1:019 × 10−15 s. Inte-gration accuracy is monitored using back-integration and energy conservation requirements withthe velocity reset procedure turned o-.
The specimen used for the gage section is a nano:lm of 5a × 15a × 15a long, where ais the lattice constant. The total number of atoms used in the simulations ranges from 2250to 4500 depending on the crystal structure. A Digital alpha workstation (Model 500) with aclock speed of 500 MHz was used for the simulation. The rate of loading was rather high(500 m s−1) to keep the computational time to a reasonable value. The free surfaces (i.e., frontand back surfaces as well as the sides of the specimen) are free from any external loads, asin conventional tensile testing. The top and bottom sides are :xed by the boundary atoms.The regions above the top and below the bottom of the boundary atoms represent the materialabove and below the gage section [Fig. 1(a)], respectively, similar to a conventional tensilespecimen where deformation is minimal and mostly elastic. The crystal was set-up with a cubicorientation and the uniaxial tensile force was applied along the [0 0 1] direction. Table 1 givesthe dimensions of the workmaterial, rate of loading, bulk temperature, etc. Initially, the structureof the specimen was setup, then relaxed to the equilibrium position using a damped trajectoryprocedure [22] after which the tensile load was applied. The MD simulations were carried outtill separation occurs in the tensile specimen.
4. Results and discussion
4.1. On the nature of deformation and fracture under tensile loading
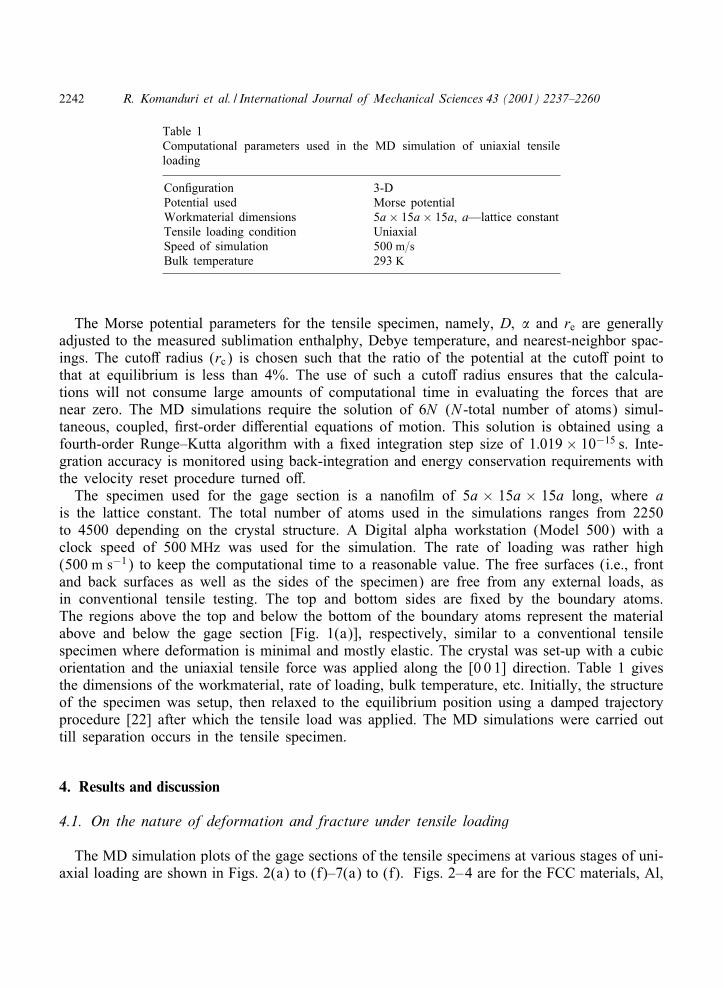
The MD simulation plots of the gage sections of the tensile specimens at various stages of uni-axial loading are shown in Figs. 2(a) to (f)–7(a) to (f). Figs. 2–4 are for the FCC materials, Al,
R. Komanduri et al. / International Journal of Mechanical Sciences 43 (2001) 2237–2260 2243
Fig. 2(a)–(f). MD simulation plots of the gage section of a tensile specimen at various stages of uniaxial loadingfor Al.
2244 R. Komanduri et al. / International Journal of Mechanical Sciences 43 (2001) 2237–2260
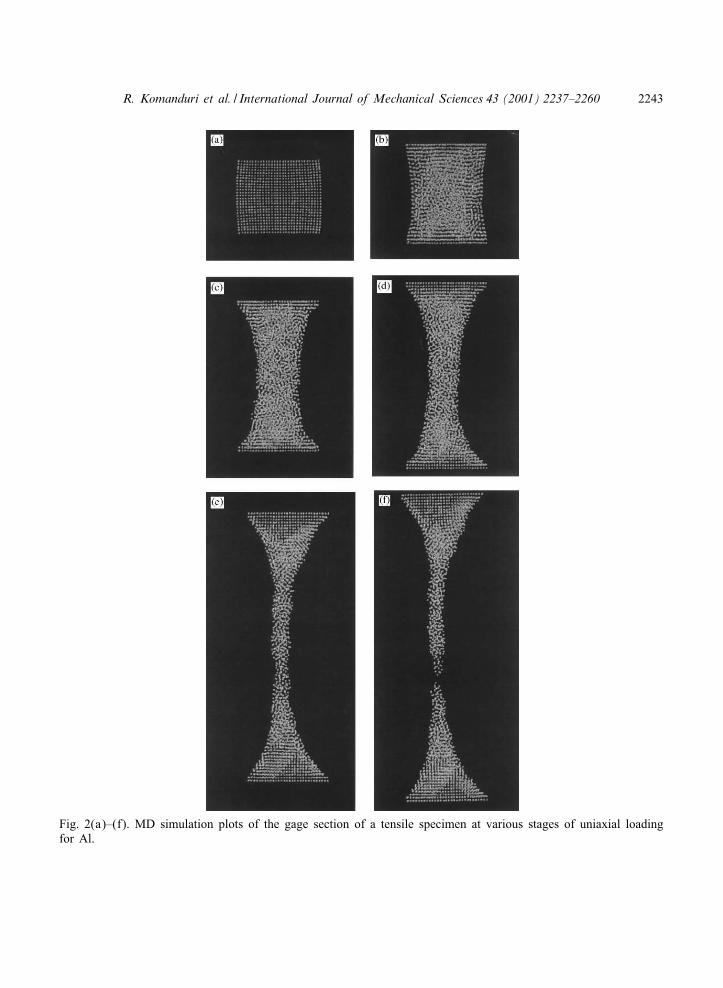
Fig. 3(a)–(f). MD simulation plots of the gage section of a tensile specimen at various stages of uniaxial loadingfor Cu.
R. Komanduri et al. / International Journal of Mechanical Sciences 43 (2001) 2237–2260 2245
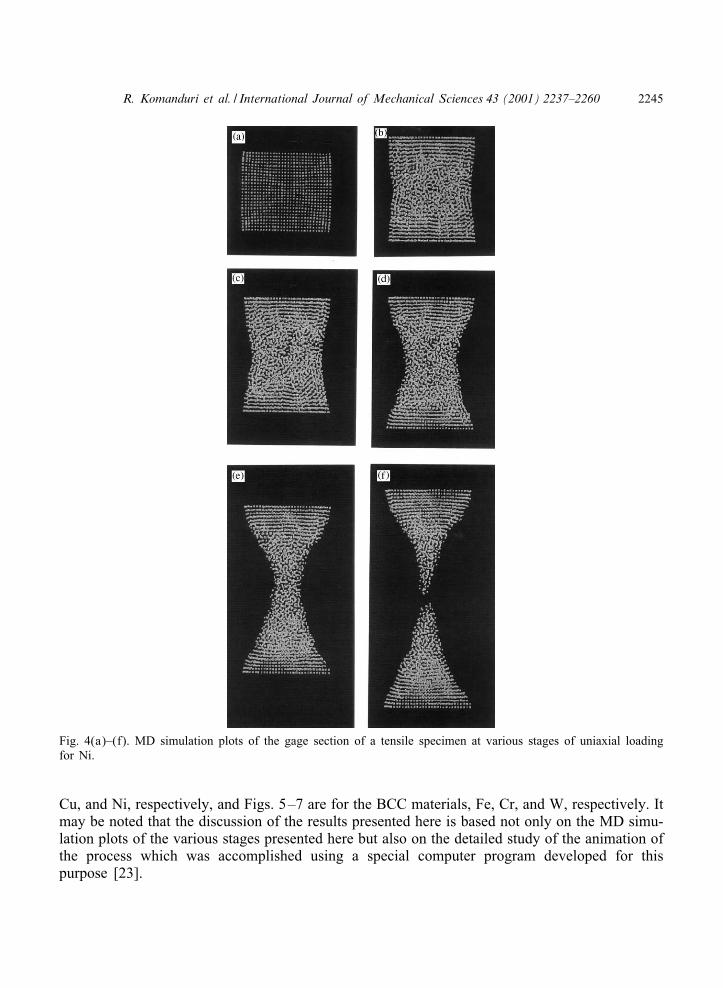
Fig. 4(a)–(f). MD simulation plots of the gage section of a tensile specimen at various stages of uniaxial loadingfor Ni.
Cu, and Ni, respectively, and Figs. 5–7 are for the BCC materials, Fe, Cr, and W, respectively. Itmay be noted that the discussion of the results presented here is based not only on the MD simu-lation plots of the various stages presented here but also on the detailed study of the animation ofthe process which was accomplished using a special computer program developed for thispurpose [23].
2246 R. Komanduri et al. / International Journal of Mechanical Sciences 43 (2001) 2237–2260
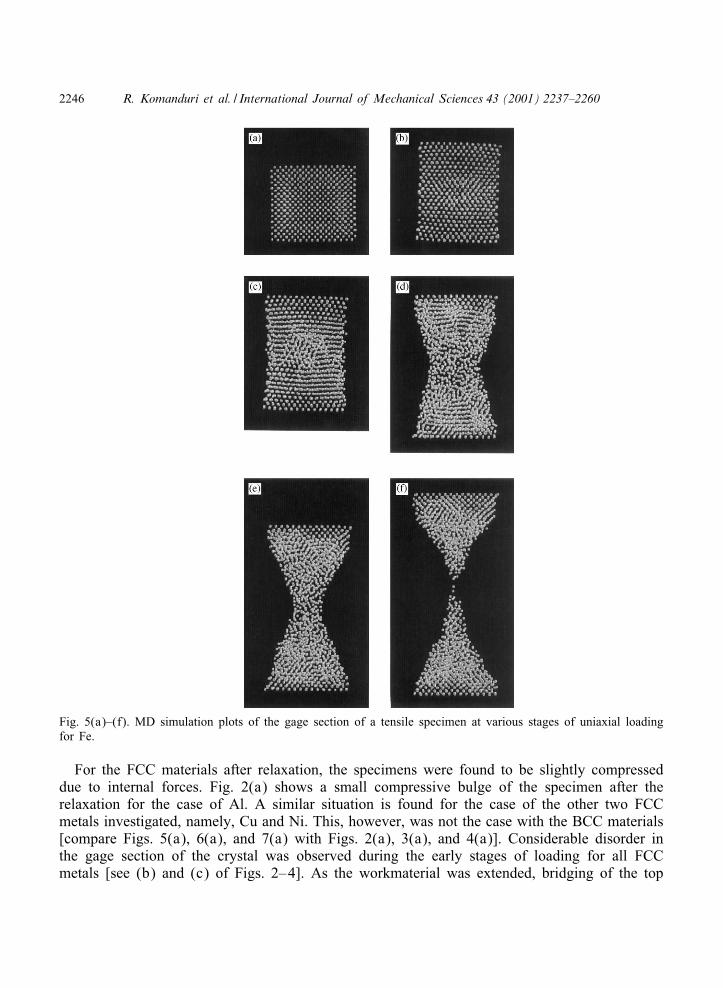
Fig. 5(a)–(f). MD simulation plots of the gage section of a tensile specimen at various stages of uniaxial loadingfor Fe.
For the FCC materials after relaxation, the specimens were found to be slightly compresseddue to internal forces. Fig. 2(a) shows a small compressive bulge of the specimen after therelaxation for the case of Al. A similar situation is found for the case of the other two FCCmetals investigated, namely, Cu and Ni. This, however, was not the case with the BCC materials[compare Figs. 5(a), 6(a), and 7(a) with Figs. 2(a), 3(a), and 4(a)]. Considerable disorder inthe gage section of the crystal was observed during the early stages of loading for all FCCmetals [see (b) and (c) of Figs. 2–4]. As the workmaterial was extended, bridging of the top
R. Komanduri et al. / International Journal of Mechanical Sciences 43 (2001) 2237–2260 2247
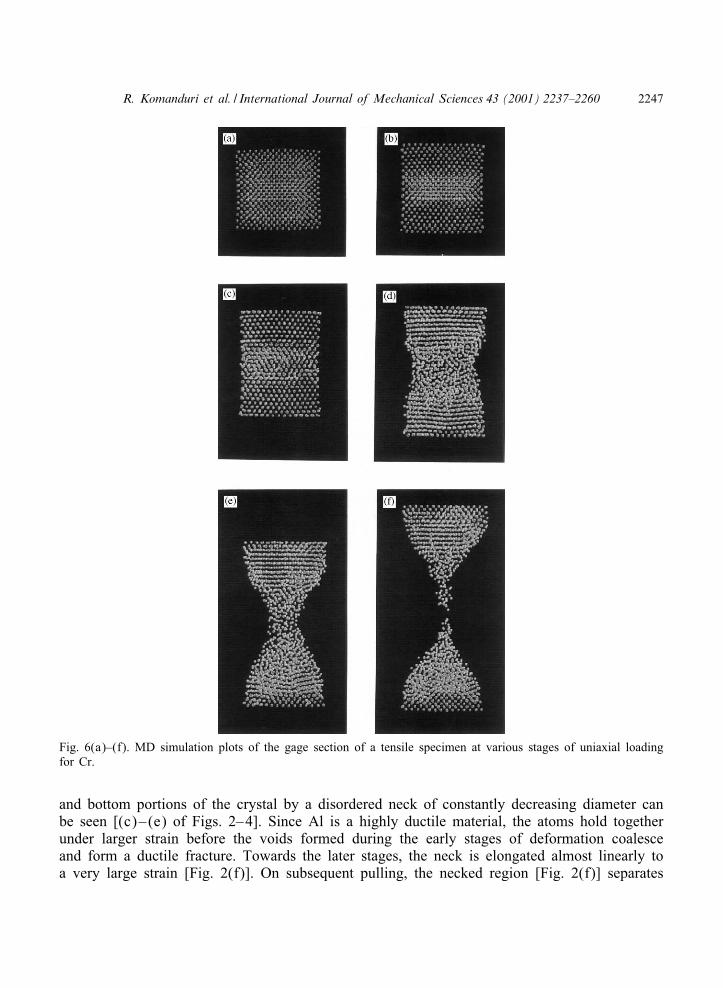
Fig. 6(a)–(f). MD simulation plots of the gage section of a tensile specimen at various stages of uniaxial loadingfor Cr.
and bottom portions of the crystal by a disordered neck of constantly decreasing diameter canbe seen [(c)–(e) of Figs. 2–4]. Since Al is a highly ductile material, the atoms hold togetherunder larger strain before the voids formed during the early stages of deformation coalesceand form a ductile fracture. Towards the later stages, the neck is elongated almost linearly toa very large strain [Fig. 2(f)]. On subsequent pulling, the necked region [Fig. 2(f)] separates
2248 R. Komanduri et al. / International Journal of Mechanical Sciences 43 (2001) 2237–2260
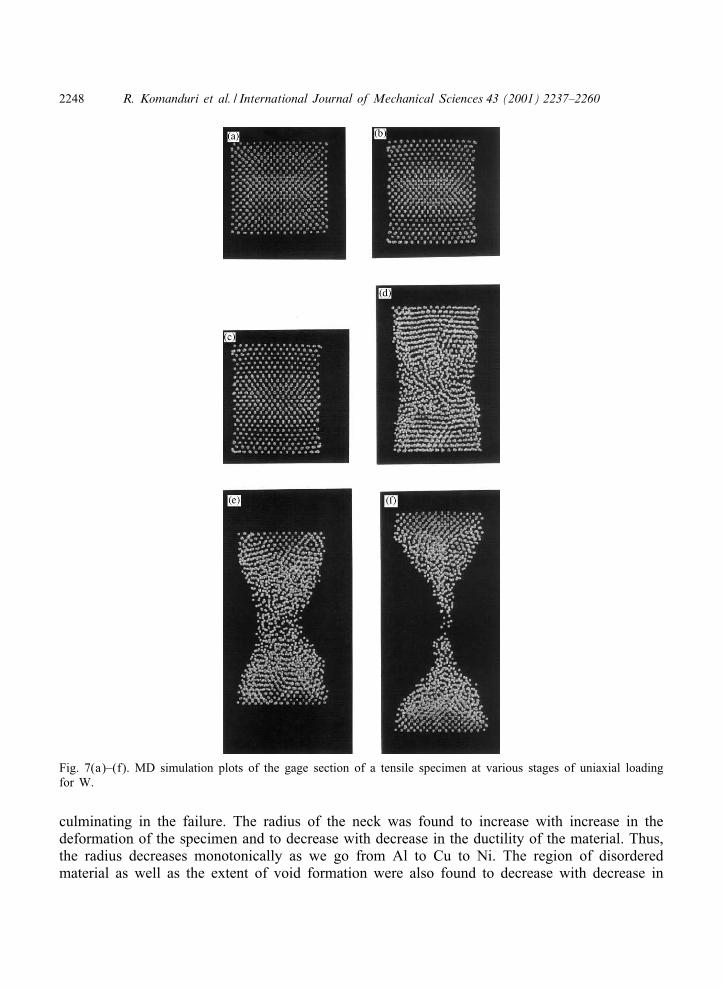
Fig. 7(a)–(f). MD simulation plots of the gage section of a tensile specimen at various stages of uniaxial loadingfor W.
culminating in the failure. The radius of the neck was found to increase with increase in thedeformation of the specimen and to decrease with decrease in the ductility of the material. Thus,the radius decreases monotonically as we go from Al to Cu to Ni. The region of disorderedmaterial as well as the extent of void formation were also found to decrease with decrease in
R. Komanduri et al. / International Journal of Mechanical Sciences 43 (2001) 2237–2260 2249
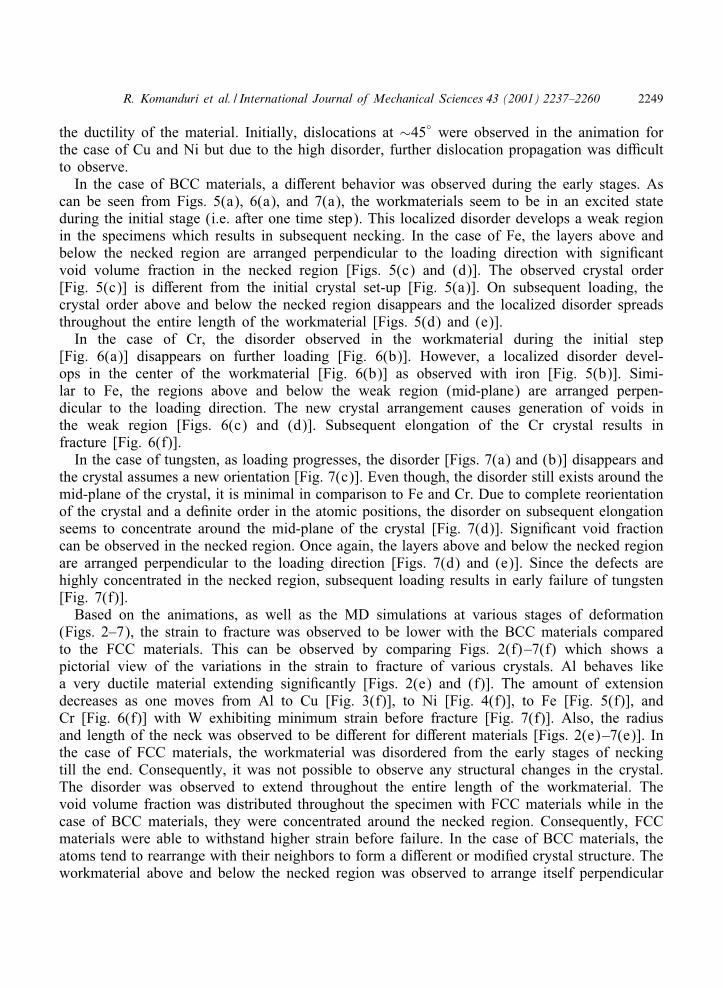
the ductility of the material. Initially, dislocations at ∼45◦ were observed in the animation forthe case of Cu and Ni but due to the high disorder, further dislocation propagation was diIcultto observe.
In the case of BCC materials, a di-erent behavior was observed during the early stages. Ascan be seen from Figs. 5(a), 6(a), and 7(a), the workmaterials seem to be in an excited stateduring the initial stage (i.e. after one time step). This localized disorder develops a weak regionin the specimens which results in subsequent necking. In the case of Fe, the layers above andbelow the necked region are arranged perpendicular to the loading direction with signi:cantvoid volume fraction in the necked region [Figs. 5(c) and (d)]. The observed crystal order[Fig. 5(c)] is di-erent from the initial crystal set-up [Fig. 5(a)]. On subsequent loading, thecrystal order above and below the necked region disappears and the localized disorder spreadsthroughout the entire length of the workmaterial [Figs. 5(d) and (e)].
In the case of Cr, the disorder observed in the workmaterial during the initial step[Fig. 6(a)] disappears on further loading [Fig. 6(b)]. However, a localized disorder devel-ops in the center of the workmaterial [Fig. 6(b)] as observed with iron [Fig. 5(b)]. Simi-lar to Fe, the regions above and below the weak region (mid-plane) are arranged perpen-dicular to the loading direction. The new crystal arrangement causes generation of voids inthe weak region [Figs. 6(c) and (d)]. Subsequent elongation of the Cr crystal results infracture [Fig. 6(f)].
In the case of tungsten, as loading progresses, the disorder [Figs. 7(a) and (b)] disappears andthe crystal assumes a new orientation [Fig. 7(c)]. Even though, the disorder still exists around themid-plane of the crystal, it is minimal in comparison to Fe and Cr. Due to complete reorientationof the crystal and a de:nite order in the atomic positions, the disorder on subsequent elongationseems to concentrate around the mid-plane of the crystal [Fig. 7(d)]. Signi:cant void fractioncan be observed in the necked region. Once again, the layers above and below the necked regionare arranged perpendicular to the loading direction [Figs. 7(d) and (e)]. Since the defects arehighly concentrated in the necked region, subsequent loading results in early failure of tungsten[Fig. 7(f)].
Based on the animations, as well as the MD simulations at various stages of deformation(Figs. 2–7), the strain to fracture was observed to be lower with the BCC materials comparedto the FCC materials. This can be observed by comparing Figs. 2(f)–7(f) which shows apictorial view of the variations in the strain to fracture of various crystals. Al behaves likea very ductile material extending signi:cantly [Figs. 2(e) and (f)]. The amount of extensiondecreases as one moves from Al to Cu [Fig. 3(f)], to Ni [Fig. 4(f)], to Fe [Fig. 5(f)], andCr [Fig. 6(f)] with W exhibiting minimum strain before fracture [Fig. 7(f)]. Also, the radiusand length of the neck was observed to be di-erent for di-erent materials [Figs. 2(e)–7(e)]. Inthe case of FCC materials, the workmaterial was disordered from the early stages of neckingtill the end. Consequently, it was not possible to observe any structural changes in the crystal.The disorder was observed to extend throughout the entire length of the workmaterial. Thevoid volume fraction was distributed throughout the specimen with FCC materials while in thecase of BCC materials, they were concentrated around the necked region. Consequently, FCCmaterials were able to withstand higher strain before failure. In the case of BCC materials, theatoms tend to rearrange with their neighbors to form a di-erent or modi:ed crystal structure. Theworkmaterial above and below the necked region was observed to arrange itself perpendicular
2250 R. Komanduri et al. / International Journal of Mechanical Sciences 43 (2001) 2237–2260
to the loading direction. The crystal symmetry in these regions resulted in a weak mid-planewith higher void volume fraction. Consequently, the crystal failed around this region at a lowerstrain in comparison to the FCC materials. This constant rearrangement of the atoms with theBCC materials will be shown to result in signi:cant force variations. It will be shown, basedon the force trends, that structural transformations also occur with FCC materials, albeit to alesser extent in comparison to BCC materials.
4.2. On the nature of force variation under tensile loading
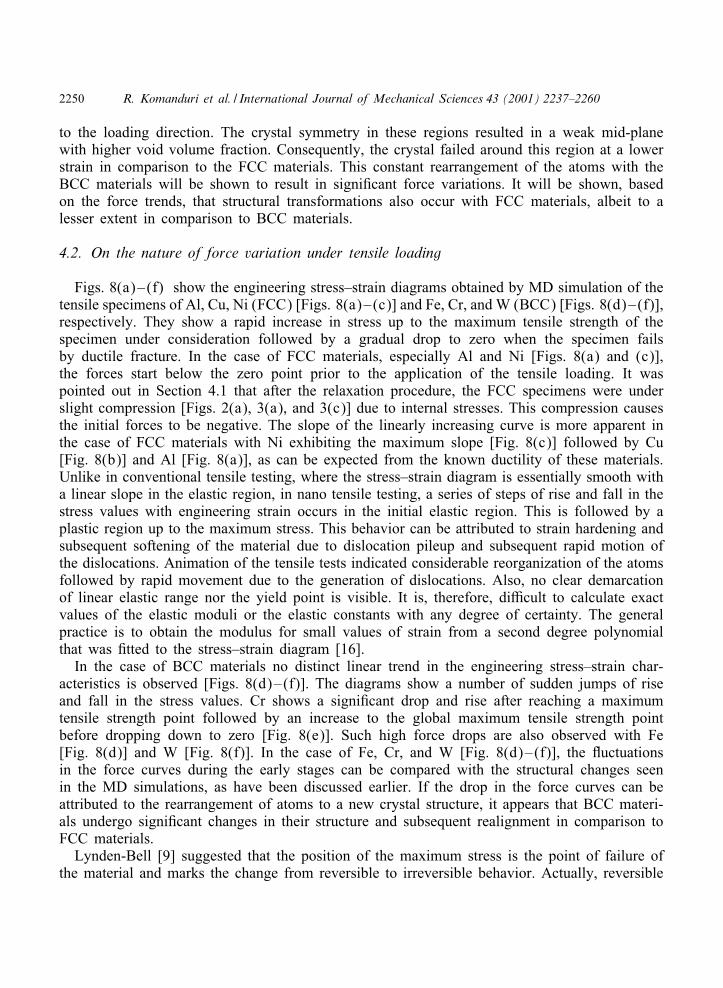
Figs. 8(a)–(f) show the engineering stress–strain diagrams obtained by MD simulation of thetensile specimens of Al, Cu, Ni (FCC) [Figs. 8(a)–(c)] and Fe, Cr, and W (BCC) [Figs. 8(d)–(f)],respectively. They show a rapid increase in stress up to the maximum tensile strength of thespecimen under consideration followed by a gradual drop to zero when the specimen failsby ductile fracture. In the case of FCC materials, especially Al and Ni [Figs. 8(a) and (c)],the forces start below the zero point prior to the application of the tensile loading. It waspointed out in Section 4.1 that after the relaxation procedure, the FCC specimens were underslight compression [Figs. 2(a), 3(a), and 3(c)] due to internal stresses. This compression causesthe initial forces to be negative. The slope of the linearly increasing curve is more apparent inthe case of FCC materials with Ni exhibiting the maximum slope [Fig. 8(c)] followed by Cu[Fig. 8(b)] and Al [Fig. 8(a)], as can be expected from the known ductility of these materials.Unlike in conventional tensile testing, where the stress–strain diagram is essentially smooth witha linear slope in the elastic region, in nano tensile testing, a series of steps of rise and fall in thestress values with engineering strain occurs in the initial elastic region. This is followed by aplastic region up to the maximum stress. This behavior can be attributed to strain hardening andsubsequent softening of the material due to dislocation pileup and subsequent rapid motion ofthe dislocations. Animation of the tensile tests indicated considerable reorganization of the atomsfollowed by rapid movement due to the generation of dislocations. Also, no clear demarcationof linear elastic range nor the yield point is visible. It is, therefore, diIcult to calculate exactvalues of the elastic moduli or the elastic constants with any degree of certainty. The generalpractice is to obtain the modulus for small values of strain from a second degree polynomialthat was :tted to the stress–strain diagram [16].
In the case of BCC materials no distinct linear trend in the engineering stress–strain char-acteristics is observed [Figs. 8(d)–(f)]. The diagrams show a number of sudden jumps of riseand fall in the stress values. Cr shows a signi:cant drop and rise after reaching a maximumtensile strength point followed by an increase to the global maximum tensile strength pointbefore dropping down to zero [Fig. 8(e)]. Such high force drops are also observed with Fe[Fig. 8(d)] and W [Fig. 8(f)]. In the case of Fe, Cr, and W [Fig. 8(d)–(f)], the 9uctuationsin the force curves during the early stages can be compared with the structural changes seenin the MD simulations, as have been discussed earlier. If the drop in the force curves can beattributed to the rearrangement of atoms to a new crystal structure, it appears that BCC materi-als undergo signi:cant changes in their structure and subsequent realignment in comparison toFCC materials.
Lynden-Bell [9] suggested that the position of the maximum stress is the point of failure ofthe material and marks the change from reversible to irreversible behavior. Actually, reversible
R. Komanduri et al. / International Journal of Mechanical Sciences 43 (2001) 2237–2260 2251
Fig. 8. Engineering stress–strain diagrams obtained by MD simulation of the tensile specimens of various materials,namely, Al, Cu, Ni (FCC) [(a)–(c)] and Fe, Cr, and W (BCC) [(d)–(f)], respectively.
behavior stops after the elastic limit and once the yield point is reached. This is far below theposition of maximum stress (or the ultimate stress). In the MD simulations conducted here,we observed that in the case of FCC workmaterials, even before the maximum stress point
2252 R. Komanduri et al. / International Journal of Mechanical Sciences 43 (2001) 2237–2260
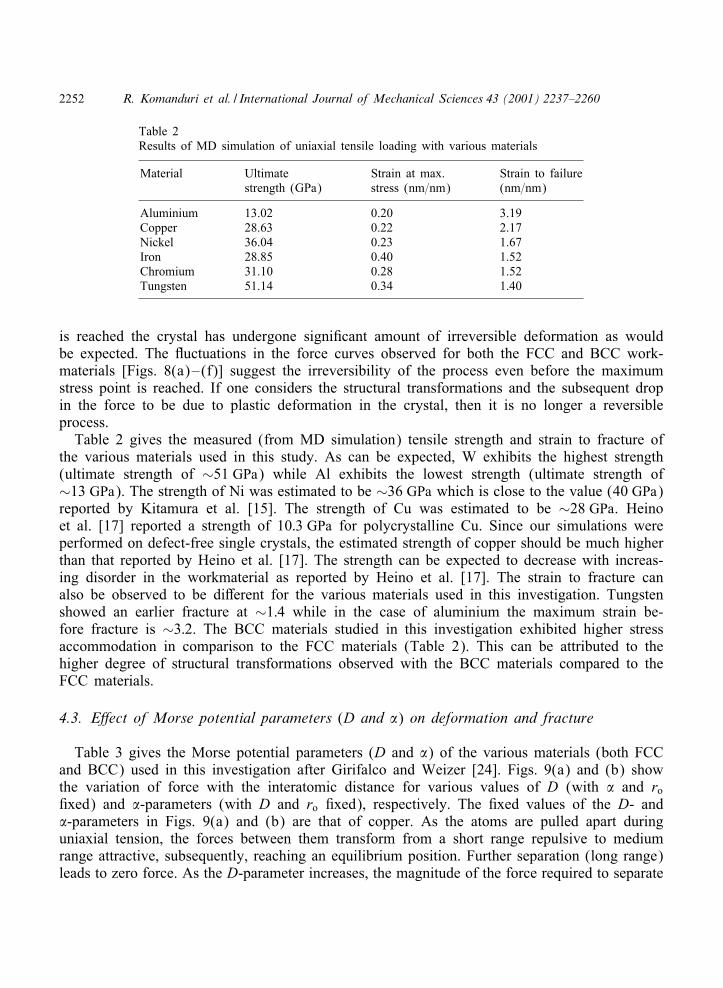
Table 2Results of MD simulation of uniaxial tensile loading with various materials
Material Ultimate Strain at max. Strain to failurestrength (GPa) stress (nm=nm) (nm=nm)
Aluminium 13.02 0.20 3.19Copper 28.63 0.22 2.17Nickel 36.04 0.23 1.67Iron 28.85 0.40 1.52Chromium 31.10 0.28 1.52Tungsten 51.14 0.34 1.40
is reached the crystal has undergone signi:cant amount of irreversible deformation as wouldbe expected. The 9uctuations in the force curves observed for both the FCC and BCC work-materials [Figs. 8(a)–(f)] suggest the irreversibility of the process even before the maximumstress point is reached. If one considers the structural transformations and the subsequent dropin the force to be due to plastic deformation in the crystal, then it is no longer a reversibleprocess.
Table 2 gives the measured (from MD simulation) tensile strength and strain to fracture ofthe various materials used in this study. As can be expected, W exhibits the highest strength(ultimate strength of ∼51 GPa) while Al exhibits the lowest strength (ultimate strength of∼13 GPa). The strength of Ni was estimated to be ∼36 GPa which is close to the value (40 GPa)reported by Kitamura et al. [15]. The strength of Cu was estimated to be ∼28 GPa. Heinoet al. [17] reported a strength of 10:3 GPa for polycrystalline Cu. Since our simulations wereperformed on defect-free single crystals, the estimated strength of copper should be much higherthan that reported by Heino et al. [17]. The strength can be expected to decrease with increas-ing disorder in the workmaterial as reported by Heino et al. [17]. The strain to fracture canalso be observed to be di-erent for the various materials used in this investigation. Tungstenshowed an earlier fracture at ∼1:4 while in the case of aluminium the maximum strain be-fore fracture is ∼3:2. The BCC materials studied in this investigation exhibited higher stressaccommodation in comparison to the FCC materials (Table 2). This can be attributed to thehigher degree of structural transformations observed with the BCC materials compared to theFCC materials.
4.3. E5ect of Morse potential parameters (D and �) on deformation and fracture
Table 3 gives the Morse potential parameters (D and �) of the various materials (both FCCand BCC) used in this investigation after Girifalco and Weizer [24]. Figs. 9(a) and (b) showthe variation of force with the interatomic distance for various values of D (with � and ro:xed) and �-parameters (with D and ro :xed), respectively. The :xed values of the D- and�-parameters in Figs. 9(a) and (b) are that of copper. As the atoms are pulled apart duringuniaxial tension, the forces between them transform from a short range repulsive to mediumrange attractive, subsequently, reaching an equilibrium position. Further separation (long range)leads to zero force. As the D-parameter increases, the magnitude of the force required to separate
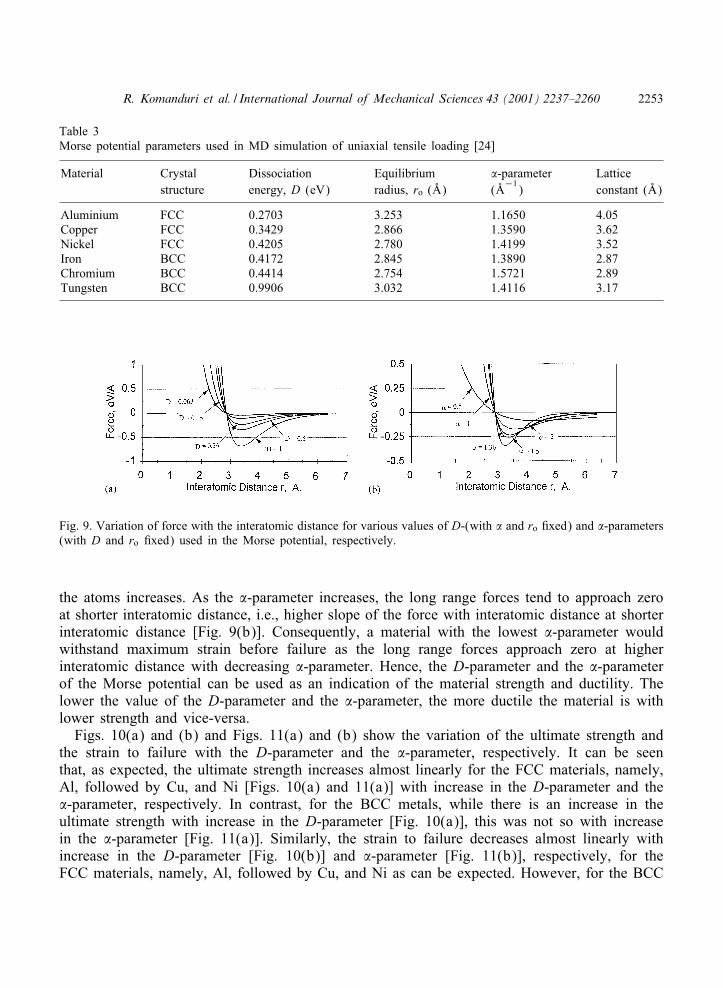
R. Komanduri et al. / International Journal of Mechanical Sciences 43 (2001) 2237–2260 2253
Table 3Morse potential parameters used in MD simulation of uniaxial tensile loading [24]
Material Crystal Dissociation Equilibrium �-parameter Latticestructure energy, D (eV) radius, ro ( SA) ( SA
−1) constant ( SA)
Aluminium FCC 0.2703 3.253 1.1650 4.05Copper FCC 0.3429 2.866 1.3590 3.62Nickel FCC 0.4205 2.780 1.4199 3.52Iron BCC 0.4172 2.845 1.3890 2.87Chromium BCC 0.4414 2.754 1.5721 2.89Tungsten BCC 0.9906 3.032 1.4116 3.17
Fig. 9. Variation of force with the interatomic distance for various values of D-(with � and ro :xed) and �-parameters(with D and ro :xed) used in the Morse potential, respectively.
the atoms increases. As the �-parameter increases, the long range forces tend to approach zeroat shorter interatomic distance, i.e., higher slope of the force with interatomic distance at shorterinteratomic distance [Fig. 9(b)]. Consequently, a material with the lowest �-parameter wouldwithstand maximum strain before failure as the long range forces approach zero at higherinteratomic distance with decreasing �-parameter. Hence, the D-parameter and the �-parameterof the Morse potential can be used as an indication of the material strength and ductility. Thelower the value of the D-parameter and the �-parameter, the more ductile the material is withlower strength and vice-versa.
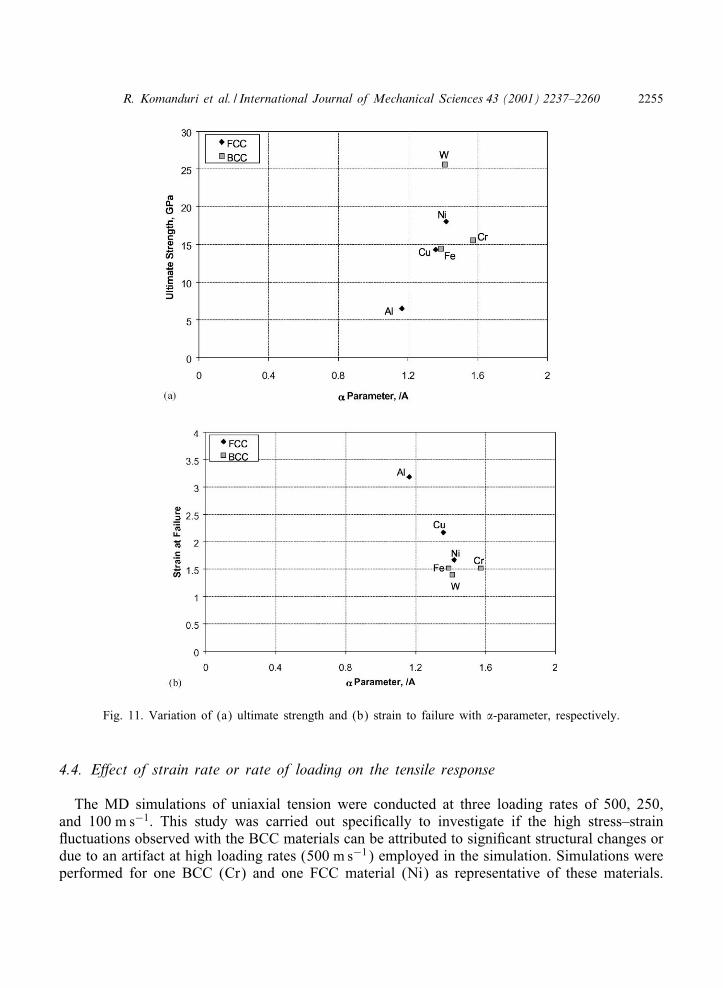
Figs. 10(a) and (b) and Figs. 11(a) and (b) show the variation of the ultimate strength andthe strain to failure with the D-parameter and the �-parameter, respectively. It can be seenthat, as expected, the ultimate strength increases almost linearly for the FCC materials, namely,Al, followed by Cu, and Ni [Figs. 10(a) and 11(a)] with increase in the D-parameter and the�-parameter, respectively. In contrast, for the BCC metals, while there is an increase in theultimate strength with increase in the D-parameter [Fig. 10(a)], this was not so with increasein the �-parameter [Fig. 11(a)]. Similarly, the strain to failure decreases almost linearly withincrease in the D-parameter [Fig. 10(b)] and �-parameter [Fig. 11(b)], respectively, for theFCC materials, namely, Al, followed by Cu, and Ni as can be expected. However, for the BCC
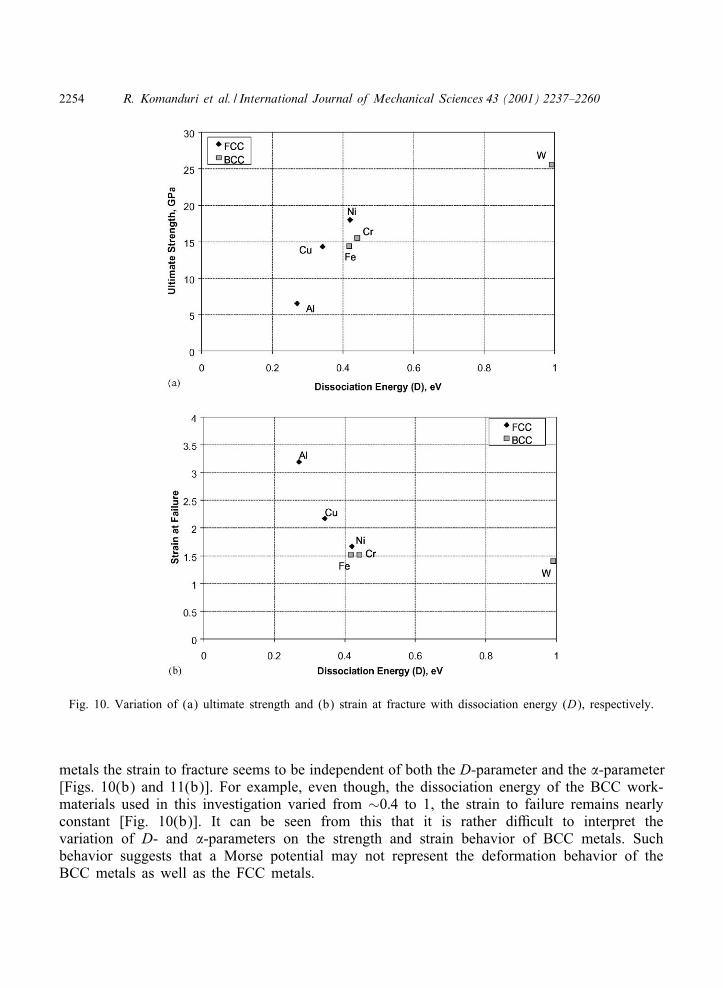
2254 R. Komanduri et al. / International Journal of Mechanical Sciences 43 (2001) 2237–2260
Fig. 10. Variation of (a) ultimate strength and (b) strain at fracture with dissociation energy (D), respectively.
metals the strain to fracture seems to be independent of both the D-parameter and the �-parameter[Figs. 10(b) and 11(b)]. For example, even though, the dissociation energy of the BCC work-materials used in this investigation varied from ∼0:4 to 1, the strain to failure remains nearlyconstant [Fig. 10(b)]. It can be seen from this that it is rather diIcult to interpret thevariation of D- and �-parameters on the strength and strain behavior of BCC metals. Suchbehavior suggests that a Morse potential may not represent the deformation behavior of theBCC metals as well as the FCC metals.
R. Komanduri et al. / International Journal of Mechanical Sciences 43 (2001) 2237–2260 2255
Fig. 11. Variation of (a) ultimate strength and (b) strain to failure with �-parameter, respectively.
4.4. E5ect of strain rate or rate of loading on the tensile response
The MD simulations of uniaxial tension were conducted at three loading rates of 500, 250,and 100 m s−1: This study was carried out speci:cally to investigate if the high stress–strain9uctuations observed with the BCC materials can be attributed to signi:cant structural changes ordue to an artifact at high loading rates (500 m s−1) employed in the simulation. Simulations wereperformed for one BCC (Cr) and one FCC material (Ni) as representative of these materials.
2256 R. Komanduri et al. / International Journal of Mechanical Sciences 43 (2001) 2237–2260
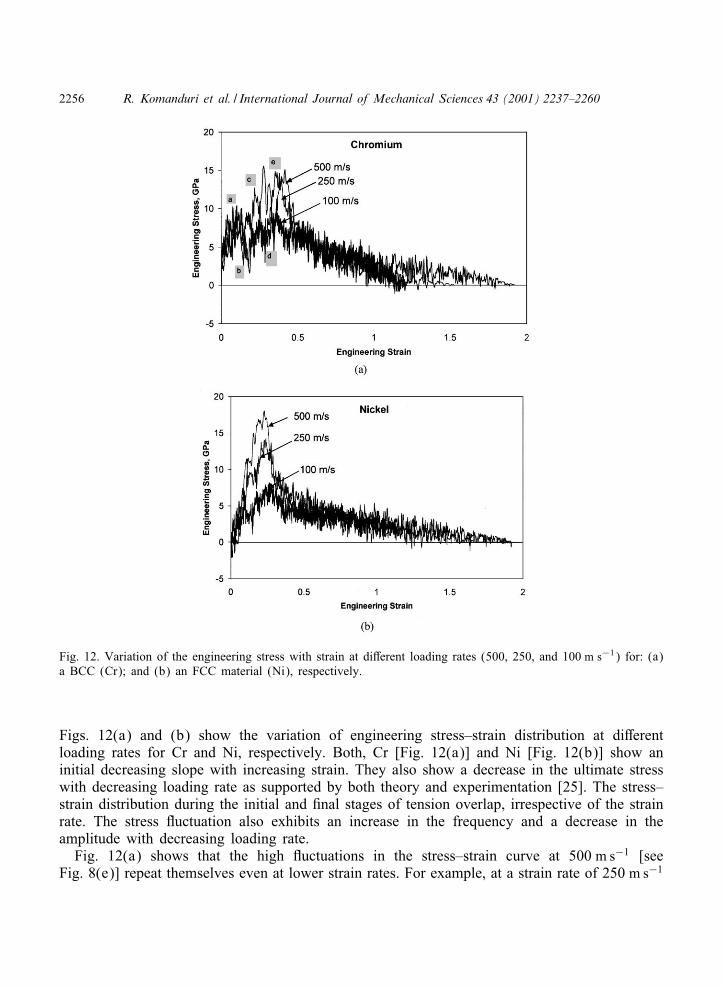
Fig. 12. Variation of the engineering stress with strain at di-erent loading rates (500, 250, and 100 m s−1) for: (a)a BCC (Cr); and (b) an FCC material (Ni), respectively.
Figs. 12(a) and (b) show the variation of engineering stress–strain distribution at di-erentloading rates for Cr and Ni, respectively. Both, Cr [Fig. 12(a)] and Ni [Fig. 12(b)] show aninitial decreasing slope with increasing strain. They also show a decrease in the ultimate stresswith decreasing loading rate as supported by both theory and experimentation [25]. The stress–strain distribution during the initial and :nal stages of tension overlap, irrespective of the strainrate. The stress 9uctuation also exhibits an increase in the frequency and a decrease in theamplitude with decreasing loading rate.
Fig. 12(a) shows that the high 9uctuations in the stress–strain curve at 500 m s−1 [seeFig. 8(e)] repeat themselves even at lower strain rates. For example, at a strain rate of 250 m s−1
R. Komanduri et al. / International Journal of Mechanical Sciences 43 (2001) 2237–2260 2257
for Cr, the stress 9uctuates from point ‘a’ through ‘d’ :nally reaches the maximum stress at‘e’ before the stress decreases to zero [Fig. 12(a)]. Similar 9uctuations can also be observedwith other strain rates, namely 100 and 500 m s−1: However, the strain at which these high9uctuations are observed seem to vary with strain rate. Based on this result, it appears that thehigh 9uctuations (higher amplitude) in the stress–strain curve for BCC materials are not due tothe high loading rates but due to the signi:cant structural transformations observed with BCCmaterials in comparison to FCC materials, as explained earlier.
In the case of Ni, a gradual and systematic drop in the ultimate tensile strength with decreasingstrain rate is observed [Fig. 12(b)]. The ultimate tensile strength of Ni decreases by a factorof ∼3 while the ultimate strength of Cr decreases by a factor ¡ 2 as the strain rate is reducedby a factor of :ve. However, according to theory [25], one would expect BCC metals toexhibit higher strain rate sensitivity than FCC metals. The strain at which the ultimate strengthis measured seems to remain constant for both BCC and FCC metals. However, the strain tofailure increases with decreasing strain rate for Ni while it does not follow a particular trend withCr. These contradictions again suggest that Morse-type potentials may not adequately representBCC metals.
5. Conclusions
1. MD simulations of uniaxial tension have been carried out at constant rate of loading(500 m s−1) on some single-crystal cubic metals, both FCC (Al, Cu, and Ni) and BCC (Fe, Cr,and W) to investigate the nature of deformation and fracture in these materials. Failure of theworkmaterials due to void formation, their coalescence into nanocracks, and subsequent fractureor separation are observed to be similar to their behavior at macroscale.
2. For FCC materials, considerable disorder in the gage section of the crystal is observedduring the early stages of loading. Further loading resulted in the disorder spreading throughthe entire length of the workmaterial. In the case of BCC materials, the disorder is observed tobe highly localized around the midplane of the workmaterial. The layers above and below thenecked region are arranged perpendicular to the loading direction. The new crystal arrangementgenerates voids in the weak region. Due to the di-erences in the defect distribution and crystalreorientation, the strain to fracture is observed to be lower with the BCC materials comparedto the FCC materials.
3. The radius and length of the neck are observed to be di-erent for di-erent workmaterials.They increase with increase in the deformation of the specimen and decrease with decrease inthe ductility of the material.
4. The engineering stress–strain diagrams obtained from the MD simulation of the tensilespecimens show a rapid increase in stress up to the maximum followed by a gradual drop to zerowhen the specimen fails by ductile fracture. The slope of the linearly increasing curve is moreprominent in the case of FCC materials than BCC materials. BCC materials exhibit a numberof sudden 9uctuations of the force values. If the drop in the force curves can be attributedto the rearrangement of atoms to a new crystal structure, then it appears that BCC materialsundergo a signi:cant change in their structure and subsequent realignment in comparison to theFCC materials, as previously reported in the literature.
2258 R. Komanduri et al. / International Journal of Mechanical Sciences 43 (2001) 2237–2260
5. Unlike conventional tensile testing, where the stress–strain diagram is essentially smoothwith a linear slope in the elastic region, in nano tensile testing, a series of steps of 9uctuationsin the stress value with engineering strain in the initial elastic region followed by a plasticregion up to the maximum value are found. These 9uctuations can be attributed to the strainhardening and subsequent softening of the material due to dislocation pileup and subsequentrapid motion of the dislocations.
6. The measured tensile strength (from MD simulations) showed that W exhibits the higheststrength (ultimate strength of ∼51 GPa) while Al exhibits the lowest strength (ultimate strengthof ∼13 GPa). The ultimate strength of Cu, Ni, Fe, and Cr are evaluated to be ∼28; 36; 29, and31 GPa; respectively.7. The strain to fracture was observed to be minimum with tungsten (∼1:4), followed by iron
and chromium (∼1:52), nickel (∼1:67), and copper (∼2:17). Aluminium exhibited maximumductility undergoing a maximum strain of ∼3:2 before failure. It can thus be seen that strainvalues at nanolevels are signi:cantly larger than similar values at macrolevel.
8. As expected, irreversible behavior during the loading=unloading process (for both FCC andBCC lattices) was observed even before the maximum stress point (ultimate tensile strength)was reached. This is expected as the yield point marks the demarcation between reversible andirreversible 9ow.
9. It appears that the D- and �-parameters of the Morse potential can be used as an indicationof the material ductility and strength for FCC materials. The strength of the workmaterialdecreases with decreasing D- and �-parameter while the strain to failure increases.
10. While good correlation was found between the D- and �-parameters of the Morse potentialwith the ultimate strength and the strain to failure for the FCC metals, no such correlation wasfound for the BCC metals. From this it appears that Morse potentials may not represent thedeformation behavior of the BCC metals as accurately as the FCC metals and alternate potentialsmay need to be considered.
11. MD simulations of uniaxial tension at di-erent loading rates (500, 250, and 100 m s−1)for one BCC (Cr) and one FCC material (Ni) showed an initial decrease in slope with in-creasing strain and a decrease in the ultimate stress with decreasing loading rate as supportedby both theory and experimentation [25]. Based on the simulation results for BCC materials atdi-erent loading rates, it appears that the high stress 9uctuations in the stress–strain curve forBCC materials can be attributed not to the high loading rates, but to the signi:cant structuraltransformations possible with BCC materials in comparison to FCC materials, as reported inthe literature.
Acknowledgements
This project is sponsored by grants from the Manufacturing Processes and Machines Program(DMI-9523551) of the Division of the Design, Manufacture, and Industrial Innovation (DMII)and the Tribology and Surface Engineering Program (CMS-9414610) of the Division of Civiland Mechanical Structures of the National Science Foundation. The authors thank Drs. KeshNarayanan (Acting DD), R. Rajurkar, and Delcie Durham of DMII, Dr. B.M. Kramer DD ofEngineering Centers, and Dr. J. Larsen Basse of the Tribology and Surface Engineering Program
R. Komanduri et al. / International Journal of Mechanical Sciences 43 (2001) 2237–2260 2259
for their interest in and support of this work. One of the authors (R.K.) also thanks the A.H.Nelson, Jr Endowed Chair in Engineering for the :nancial support in the preparation of themanuscript. The authors also thank Dr. Ali Noori-Khajavi for his initial assistance with thesimulation work and Mr. Robert Stewart with the animation.
References
[1] Bhushan B. Handbook of micro=nano tribology. New York: CRC Press, 1995.[2] Pethica JB, Hutchings R, Oliver WC. Hardness measurements at penetration depths as small as 20 nm.
Philosophical Magazine A 1983;48=4:593–606.[3] Lynden-Bell RM. The fracture of perfect crystals under uniaxial tension at high temperatures. Journal of
Physics: Condensation of Matter 1992;4:2172–38.[4] Macmillan NH, Kelly A. The mechanical properties of perfect crystals. Proceedings of the Royal Society
(London) A 1972;330:291–308.[5] Parinello M, Rahman A. Polymorphic transitions in single crystals: a new molecular dynamics method. Journal
of Applied Physics 1981;52(12):7182–90.[6] Selinger RLB, Wang ZG, Gelbart WM. Statistical thermodynamic approach to fracture. Physical Review A
1991;43(8):4396–400.[7] Selinger RLB, Lynden-Bell RM, Gelbart WM. Stress-induced failure and melting of ideal solids. Journal of
Chemical Physics 1993;98(12):9808–18.[8] Lynden-Bell RM. Computer simulations of fracture at the atomic level. Science 1994;263:1704–5.[9] Lynden-Bell RM. A simulation study of induced disorder, failure and fracture of perfect metal crystals under
uniaxial tension. Journal of Physics: Condensation of Matter 1995;7:4603–24.[10] Rentsch R, Inasaki I. Investigation of surface integrity by molecular dynamics simulation. Annals of CIRP
1995;44(1):295–8.[11] Doyama M. Simulation of plastic deformation of small iron and copper single crystals. Nuclear Instruments
and Methods Physics Research B 1995:102–7.[12] Sieradzki K, Dienes GJ, Paskin A, Massoumzadeh B. Atomistics of crack propagation. Acta Metallurgica
1988;36(3):651–63.[13] Abraham FF, Brodbeck D, Rafey RA, Rudge WE. Instability dynamics of fracture: a computer simulation
investigation. Physical Review Letters 1994;73(2):272–5.[14] Zhou SJ, Beazley DM, Lomdahl PS, Holian BL. Large scale molecular dynamics simulations of
three-dimensional ductile failure. Physical Review Letters 1997;78(3):479–82.[15] Kitamura T, Yashiro K, Ohtani R. Atomic simulation on deformation and fracture of nano-single crystal of
nickel in tension. JSME International A 1997;40(4):430–5.[16] Heino P, Hakkinen H, Kaski K. Molecular-dynamics study of mechanical properties of copper. Europhysics
Letters 1998;41(3):273–8.[17] Heino P, Hakkinen H, Kaski K. Molecular-dynamics study of copper with defects under strain. Physical
Review B 1998;58(2):641–52.[18] Norskov JK, Lang ND. E-ective medium theory of chemical binding: application to chemisorption. Physical
Review B 1980;21:2131–6.[19] Riley ME, Coltrin ME, Diestler DJ. A velocity reset method of simulating thermal motion and damping in
gas–solid collisions. Journal of Chemical Physics 1988;88:5934–42.[20] Chandrasekaran N, Noori-Khajavi A, Ra- LM, Komanduri R. A new method for MD simulation of nanometric
cutting. Philosophical Magazine B 1998;77(1):7–26.[21] Morse PM. Diatomic molecules according to the wave mechanics. II vibrational levels. Physical Review
1929;34:57–64.[22] Ra- LM. Energy transfer in reaction dynamics of matrix-isolated 1,2-di9uoroethane. Journal of Chemical
Physics 1990;93:3160–76.

2260 R. Komanduri et al. / International Journal of Mechanical Sciences 43 (2001) 2237–2260
[23] Stewart R. Investigation on molecular dynamics simulation of nanometric cutting. M.S. Thesis, OklahomaState University, Stillwater, OK, 1998.
[24] Girifalco LA, Weizer VG. Application of the Morse potential function to cubic metals. Physical Review1959;114(3):687–90.
[25] Hertzberg RW. Deformation and fracture mechanics of engineering materials. 4th ed. New York: Wiley, 1996.
Related Documents