RESEARCH ARTICLE Molecular detection of intra-population structure in a threatened potoroid, Potorous tridactylus: conservation management and sampling implications Greta J. Frankham • Kathrine A. Handasyde • Melinda Norton • Andrew Murray • Mark D. B. Eldridge Received: 13 August 2013 / Accepted: 21 December 2013 / Published online: 12 January 2014 Ó Springer Science+Business Media Dordrecht 2014 Abstract Fine-scale genetic structure was investigated in three regional populations of the long-nosed potoroo (Po- torous tridactylus) a threatened endemic marsupial. Two populations were from the Australian mainland and one from an island. Populations were sub-sampled at two sites, 6–8 km apart, connected by suitable habitat for dispersal. Factors influencing fine-scale structure were investigated by genotyping 157 individuals at 10 microsatellite loci and sequencing a *621 bp region of the mtDNA control region. Results indicated that P. tridactylus populations exhibit significant intra-population structure, with significant F ST and U ST values recorded between subpopulations. This structure appeared mediated by small neighbourhood size, female philopatry and limited dispersal over 6–8 km, pre- dominantly by males. Results highlighted several important features of P. tridactylus populations that have implications for conservation. Firstly, the small neighbourhood size suggests any investigations of intra-population structure should be conducted on a finer scale (e.g. 25–50 m) than many current monitoring programs. Secondly, the island populations were genetically depauperate, which may reflect processes occurring in many isolated ‘mainland island’ populations. Thirdly, the lower gene flow identified between populations separated by anthropogenically mod- ified habitat suggests P. tridactylus is sensitive to changes in habitat configuration. Keywords Potorous tridactylus Á Microsatellite Á Mitochondrial DNA Á Population structure Á Spatial autocorrelation Á Relatedness Introduction The extensive fragmentation of terrestrial habitats across the globe has resulted in the disruption of connectivity between populations of many species (Saunders et al. 1991; Haila 2002; Fischer and Lindenmayer 2007). The impacts of fragmentation vary between taxa and populations depending on factors including, the makeup of the inter- vening matrix (Ricketts 2001), as well as the species dis- persal capabilities, demography, physiology and behaviour (Anthony and Blumstein 2000; Colson et al. 2013). Habitat specialists are often more sensitive to variation in local environments (Brouat et al. 2004) and therefore the extent of fragmentation can have pronounced effects on the per- sistence of such populations in disturbed areas (Frankham 1996; Keyghobadi et al. 2005). The loss of ecological connectivity between populations, hindering migration, also results in loss of genetic connectivity, leaving popu- lations susceptible to a reduction in diversity and increased differentiation through genetic drift (Lacy 1987; Electronic supplementary material The online version of this article (doi:10.1007/s10592-013-0560-1) contains supplementary material, which is available to authorized users. G. J. Frankham (&) Á K. A. Handasyde Department of Zoology, University of Melbourne, Melbourne, VIC 3010, Australia e-mail: [email protected] G. J. Frankham Á M. D. B. Eldridge Australian Museum Research Institute, Australian Museum, Sydney, NSW 2010, Australia M. Norton National Parks and Wildlife Service, Office of Environment and Heritage, Fitzroy Falls, NSW 2577, Australia A. Murray Department of Environment and Primary Industries, Orbost, VIC 3888, Australia 123 Conserv Genet (2014) 15:547–560 DOI 10.1007/s10592-013-0560-1

Welcome message from author
This document is posted to help you gain knowledge. Please leave a comment to let me know what you think about it! Share it to your friends and learn new things together.
Transcript
RESEARCH ARTICLE
Molecular detection of intra-population structure in a threatenedpotoroid, Potorous tridactylus: conservation managementand sampling implications
Greta J. Frankham • Kathrine A. Handasyde •
Melinda Norton • Andrew Murray •
Mark D. B. Eldridge
Received: 13 August 2013 / Accepted: 21 December 2013 / Published online: 12 January 2014
� Springer Science+Business Media Dordrecht 2014
Abstract Fine-scale genetic structure was investigated in
three regional populations of the long-nosed potoroo (Po-
torous tridactylus) a threatened endemic marsupial. Two
populations were from the Australian mainland and one
from an island. Populations were sub-sampled at two sites,
6–8 km apart, connected by suitable habitat for dispersal.
Factors influencing fine-scale structure were investigated by
genotyping 157 individuals at 10 microsatellite loci and
sequencing a *621 bp region of the mtDNA control region.
Results indicated that P. tridactylus populations exhibit
significant intra-population structure, with significant FST
and UST values recorded between subpopulations. This
structure appeared mediated by small neighbourhood size,
female philopatry and limited dispersal over 6–8 km, pre-
dominantly by males. Results highlighted several important
features of P. tridactylus populations that have implications
for conservation. Firstly, the small neighbourhood size
suggests any investigations of intra-population structure
should be conducted on a finer scale (e.g. 25–50 m) than
many current monitoring programs. Secondly, the island
populations were genetically depauperate, which may
reflect processes occurring in many isolated ‘mainland
island’ populations. Thirdly, the lower gene flow identified
between populations separated by anthropogenically mod-
ified habitat suggests P. tridactylus is sensitive to changes in
habitat configuration.
Keywords Potorous tridactylus � Microsatellite �Mitochondrial DNA � Population structure �Spatial autocorrelation � Relatedness
Introduction
The extensive fragmentation of terrestrial habitats across
the globe has resulted in the disruption of connectivity
between populations of many species (Saunders et al. 1991;
Haila 2002; Fischer and Lindenmayer 2007). The impacts
of fragmentation vary between taxa and populations
depending on factors including, the makeup of the inter-
vening matrix (Ricketts 2001), as well as the species dis-
persal capabilities, demography, physiology and behaviour
(Anthony and Blumstein 2000; Colson et al. 2013). Habitat
specialists are often more sensitive to variation in local
environments (Brouat et al. 2004) and therefore the extent
of fragmentation can have pronounced effects on the per-
sistence of such populations in disturbed areas (Frankham
1996; Keyghobadi et al. 2005). The loss of ecological
connectivity between populations, hindering migration,
also results in loss of genetic connectivity, leaving popu-
lations susceptible to a reduction in diversity and increased
differentiation through genetic drift (Lacy 1987;
Electronic supplementary material The online version of thisarticle (doi:10.1007/s10592-013-0560-1) contains supplementarymaterial, which is available to authorized users.
G. J. Frankham (&) � K. A. Handasyde
Department of Zoology, University of Melbourne, Melbourne,
VIC 3010, Australia
e-mail: [email protected]
G. J. Frankham � M. D. B. Eldridge
Australian Museum Research Institute, Australian Museum,
Sydney, NSW 2010, Australia
M. Norton
National Parks and Wildlife Service, Office of Environment
and Heritage, Fitzroy Falls, NSW 2577, Australia
A. Murray
Department of Environment and Primary Industries, Orbost,
VIC 3888, Australia
123
Conserv Genet (2014) 15:547–560
DOI 10.1007/s10592-013-0560-1
Keyghobadi 2007; Lancaster et al. 2011). Genetic erosion
and increased inbreeding can also leave these populations
at a higher risk of extinction (Spielman et al. 2004).
In species with habitat or diet specialisations, restricted
dispersal capabilities or high site fidelity, fine-scale struc-
ture may also occur within populations confined to isolated
habitat patches (Peakall et al. 2003; Keyghobadi et al.
2005; Coulon et al. 2006). This intra-population structure
may vary across isolates, as it is likely to be highly influ-
enced by factors such as behaviour, terrain and habitat
(Ricketts 2001; Colson et al. 2013). Nevertheless, under-
standing intra-population structure, neighbourhood size
and how demographic processes influence structure, will
underpin successful management of these populations
(Temple et al. 2006; Colson et al. 2013).
Fine-scale processes are notoriously difficult to deter-
mine using traditional field based approaches (Solberg
et al. 2006). For species which are solitary, live in dense
habitat or occur at low densities, it is often difficult to
gather sufficient data for robust analyses using methods
such as trapping or radio-telemetry (Piggott et al. 2006a;
Ruibal et al. 2010). Recent molecular advances provide an
insightful, cost effective approach as samples collected
directly (e.g. tissue) or indirectly (e.g. scats or hair) provide
alternative data to analyse population processes (Piggott
et al. 2004; Ruibal et al. 2010). In addition, the increased
information content of modern genetic markers (Sunnucks
2000) enable molecular signals to further elucidate fine-
scale processes (Keyghobadi et al. 2005; Proctor et al.
2005; Piggott et al. 2006b).
Following European settlement of Australia in 1788
many native species underwent significant declines due to
extensive land clearing for agriculture and urban settlement
(Short and Smith 1994). This resulted in the distributions of
many species retracting to small disjunct populations
confined to native vegetation remnants (Saunders et al.
1991; Fischer and Lindenmayer 2007). Much of this habitat
fragmentation occurred within the south-eastern Australian
mesic zone. Management of these isolated populations
often occurs regionally or locally, and it is increasingly
recognised that understanding population structuring, both
within and across the fragmented landscapes, will promote
more effective management of threatened species (Moritz
1994).
The long-nosed potoroo, Potorous tridactylus, is a small
solitary macropodoid marsupial distributed across the
south-eastern Australian mesic zone, from southern
Queensland to eastern South Australia, and throughout
Tasmania (Johnston 2008). Like many Australian mam-
mals, P. tridactylus experienced significant declines since
European settlement (Short 1998). Across their distribution
adult potoroos range in mass from 700 g to 1.5 kg (Norton
et al. 2010a; Frankham et al. 2011a), and are therefore
vulnerable to predation by the introduced European red fox
(Vulpes vulpes) and domestic cat (Felis catus) (Seebeck
1978; Short 1998; Dexter and Murray 2009). As for many
other species, P. tridactylus population decline has also
been accelerated by widespread clearing and fragmentation
of habitat for agriculture and urban sprawl (Short 1998).
Consequently P. tridactylus is now listed as ‘vulnerable’
under the Environment Protection and Biodiversity Con-
servation Act 1999. As a consequence of its highly spec-
ialised diet of hypogeal fungi (truffles), and its
vulnerability to introduced predators P. tridactylus requires
environments with both dense habitat for shelter and moist
open areas to forage (Bennett 1993). In addition, the spe-
cies rarely utilises disturbed habitats (Bennett 1987;
Frankham et al. 2011a). Thus P. tridactylus is now con-
fined to highly disjunct remnant patches of native vegeta-
tion across its range (Seebeck 1981). Remaining areas of
suitable habitat tend to occur in and around protected areas
(Seebeck 1981).
Due to the patchy distribution of P. tridactylus, regional
management occurs on a state by state basis within indi-
vidually managed reserves (Martin and Temple-Smith
2010). The lack of information on intra-population structure
and dispersal capabilities of P. tridactylus, hinders effective
management. Characteristics of potoroid life history suggest
that intra-population structuring is likely to occur: females
appear philopatric and show high levels of site fidelity
(Johnson 1989; Johnson and Payne 2002; Pope et al. 2005;
Frankham et al. 2013), and dispersal is thought to be male
biased, and occurs over relatively small distances (Johnson
1989; Johnson and Payne 2002; Pope et al. 2005; Pacioni
et al. 2011). For example, one of the largest movement events
ever recorded in a potoroid was 6.5 km, in a rufous bettong
Aepyprymnus rufescens (Pope et al. 2005), the largest of the
extant potoroids (3.5 kg) and two to three times larger than P.
tridactylus.
Due to their dramatic population declines, potoroids are
actively managed across Australia (Van Dyck and Strahan
2008). While the processes determining intra-population
structure may differ between populations and taxa, knowl-
edge of demographic processes will be useful in estimating
the potential for intra-population structure within and across
species. Such data would assist managers, who do not have
the resources to conduct extensive genetic sampling, to
estimate appropriate scales on which to focus management.
It may also allow predictions of how management actions
might affect population persistence across landscapes.
This study aims to use molecular data (nuclear micro-
satellite markers and mitochondrial DNA sequences) from
three regional populations of P. tridactylus to explore
population connectivity, neighbourhood size, dispersal and
population dynamics at a local scale within continuous
habitat.
548 Conserv Genet (2014) 15:547–560
123
Materials and methods
Sample collection
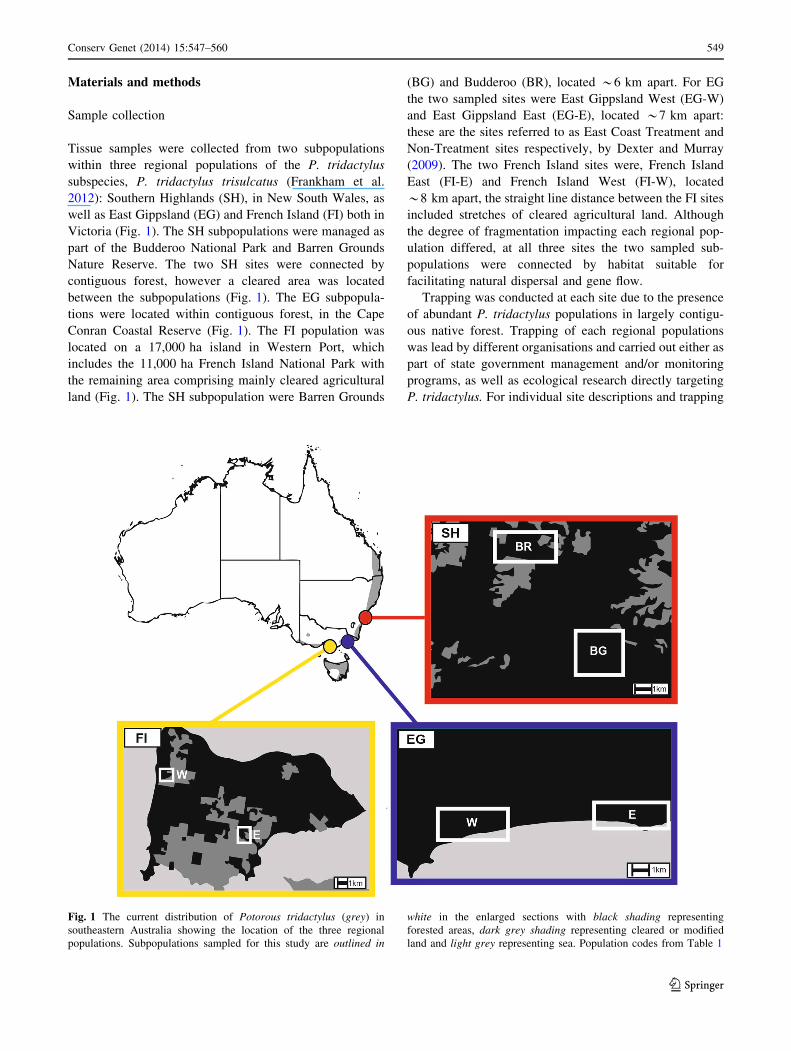
Tissue samples were collected from two subpopulations
within three regional populations of the P. tridactylus
subspecies, P. tridactylus trisulcatus (Frankham et al.
2012): Southern Highlands (SH), in New South Wales, as
well as East Gippsland (EG) and French Island (FI) both in
Victoria (Fig. 1). The SH subpopulations were managed as
part of the Budderoo National Park and Barren Grounds
Nature Reserve. The two SH sites were connected by
contiguous forest, however a cleared area was located
between the subpopulations (Fig. 1). The EG subpopula-
tions were located within contiguous forest, in the Cape
Conran Coastal Reserve (Fig. 1). The FI population was
located on a 17,000 ha island in Western Port, which
includes the 11,000 ha French Island National Park with
the remaining area comprising mainly cleared agricultural
land (Fig. 1). The SH subpopulation were Barren Grounds
(BG) and Budderoo (BR), located *6 km apart. For EG
the two sampled sites were East Gippsland West (EG-W)
and East Gippsland East (EG-E), located *7 km apart:
these are the sites referred to as East Coast Treatment and
Non-Treatment sites respectively, by Dexter and Murray
(2009). The two French Island sites were, French Island
East (FI-E) and French Island West (FI-W), located
*8 km apart, the straight line distance between the FI sites
included stretches of cleared agricultural land. Although
the degree of fragmentation impacting each regional pop-
ulation differed, at all three sites the two sampled sub-
populations were connected by habitat suitable for
facilitating natural dispersal and gene flow.
Trapping was conducted at each site due to the presence
of abundant P. tridactylus populations in largely contigu-
ous native forest. Trapping of each regional populations
was lead by different organisations and carried out either as
part of state government management and/or monitoring
programs, as well as ecological research directly targeting
P. tridactylus. For individual site descriptions and trapping
Fig. 1 The current distribution of Potorous tridactylus (grey) in
southeastern Australia showing the location of the three regional
populations. Subpopulations sampled for this study are outlined in
white in the enlarged sections with black shading representing
forested areas, dark grey shading representing cleared or modified
land and light grey representing sea. Population codes from Table 1
Conserv Genet (2014) 15:547–560 549
123
methods see Dexter and Murray (2009), Norton et al.
(2010a) and Frankham et al. (2011a). Traps were set at
varying intervals across the different sites: *25 m apart on
FI, *100 m apart in the SH and *300 m apart on EG,
with trap locations logged using GPS. A 2 mm diameter
ear biopsy was taken from each individual P. tridactylus
captured and stored in 70–95 % ethanol. Samples were
obtained from 49 individuals from SH (BG, 30; BR, 19), 61
from EG (EG-E, 32; EG-W, 29) and 47 from FI (FI-E, 36;
FI-W, 11).
DNA extraction
Genomic DNA was extracted from 157 ethanol preserved
tissue samples using Qiagen DNeasy Blood and Tissue kit
(Qiagen GmbH, Hilden, Germany) following standard
protocols.
Microsatellite DNA analysis
All individuals were genotyped at 10 microsatellite loci as
previously described by Frankham et al. (2013). Geno-
typing was carried out at the Australian Genome Research
Facility (AGRF), Melbourne. Scoring was carried out by
two independent reviewers and completed using GeneM-
apper� version 4.1 (Applied Biosystems). To test for
potential genotyping errors, nine samples genotyped as a
pilot study, were re-genotyped with all remaining samples,
and comparisons were carried out between 17 known
mother-offspring pairs (Frankham et al. 2013).
Mitochondrial DNA analysis
A *621 base pair (bp) fragment of Domain 1 of the mito-
chondrial DNA Control Region (CR) was also amplified from
each individual genotyped using primers L15999 M and
H16498 M (Fumagalli et al. 1997). PCRs were carried out in
25 ll reactions with 1,000 ng of genomic DNA; 10 9 Cor-
alLoad PCR Buffer (Qiagen); 25 mM MgCl2 (Qiagen);
5 9 Q-solution (Qiagen); Bovine serum albumin (New
England Biolabs); 0.20 mM dNTPs; 2 pmol corresponding
primers and Taq polymerase (0.5 unit Qiagen). Negative
controls were included in each PCR. PCRs were performed on
an Eppendorf Mastercycler EpS under the following condi-
tions: initial denaturation (94 �C for 2 min); 36 cycles of
denaturation (94 �C for 20 s); annealing (60 �C for 40 s) and
extension (72 �C for 50 s) followed by a final extension
(5 min at 72 �C). PCR products were cleaned using ExoSap-
IT� (USB Corporation, Cleveland, OH, USA). Sequencing
was carried out using the forward primer and resolved on an
AB 3730xl Sequencer at AGRF Sydney, and verified with
reference to chromatograms using Sequencher v4.0.10 (Gene
Codes Corporation, Ann Arbor, MI, USA). Alignment was
conducted in Mega version 5.0 (Tamura et al. 2011) using
Clustal W (Thompson et al. 1994). All gaps were coded as ‘-’
and treated as ‘indels’.
Microsatellite diversity and population bottlenecks
Deviations from Hardy–Weinberg equilibrium (HWE) and
linkage disequilibrium (LD) across all loci were tested for
using Genepop v4.0.10 (Raymond and Rousset 1995)
(Markov chain parameters; 5,000 dememorizations, 500
batches, 5,000 iterations). Standard diversity indices,
including observed and expected heterozygosity (HO and
HE), were calculated in Genalex v6.0 (Peakall and Smouse
2006). Allelic diversity (AD), allelic richness (AR) cor-
rected for minimum sample size (n = 11), and FST were
estimated using Fstat (Goudet 1995). Significant differ-
ences in diversity indices between and within regional
populations were assessed via a Wilcoxon Rank Sign Test
(Quinn and Keough 2002) using SPSS v17.0 (SPSS Inc
2008). Populations were tested for signatures of recent
bottlenecks using the program Bottleneck (Piry et al.
1999). The Wilcoxon’s Heterozygosity Excess test was
used under the two phase model (TPM) with parameters
recommended by Piry et al.(1999) (95 % single step
mutations, variance among multiple steps, 12).
Mitochondrial DNA diversity indices
Standard population diversity indices (h, haplotype diver-
sity; p, nucleotide diversity) and pairwise differentiation
(UST) amongst populations were estimated using Arlequin
v3.5.1.2 (Excoffier and Lischer 2010). A haplotype net-
work for each regional population was constructed using
TCS (Clement et al. 2000), which uses the probability of
parsimony calculated for pairwise comparisons (Templeton
et al. 1992) to create the network.
Population structure (assignment tests)
Inter- and intra-population structure were investigated
using the microsatellite data via Bayesian clustering
methods implemented in Structure v2.3.1 (Pritchard et al.
2000) assuming no a priori population information. Anal-
yses were conducted using the admixture model, alpha
inferred from the data, independent allele frequencies and
lambda set at 1.0. A burn-in of 300,000 runs was used with
500,000 iterations performed. The number of populations
(K) was tested for: all populations together (K = 1 to
K = 10); EG and SH mainland populations only (K = 1 to
K = 8) and each regional population independently (K = 1
to K = 5). All simulations were carried out with 10 repli-
cates of each K value. K was inferred from both posterior
probability (Pritchard et al. 2000) and the delta log
550 Conserv Genet (2014) 15:547–560
123
likelihood (Evanno et al. 2005) which was visualised using
Structure Harvester (Earl and vonHoldt 2012).
Gene flow and migration
Relative gene flow (migration) was estimated between sub-
populations within each region via two methods. Firstly,
using the method of Wright (1951) the number of migrants
Nem = [1/hST - 1]/4 was calculated, using FST values esti-
mated from the microsatellite data. Secondly, relative rates of
female migration were compared, using UST calculated from
mtDNA data, using the equation Nem = [1/UST - 1]/2
(Slatkin 1993; Avise 2004). The private allele method
(Barton and Slatkin 1986) was also employed in Genepop to
investigate relative migration between populations. First
generation migrants were also determined using GeneClass 2
using the following methods: L_home/L_max likelihood
ratio, Rannala and Mountain (1997) criterion, and Paetkau
et al. (2004) algorithm, with 100,000 simulated individuals.
Neighbourhood size, spatial autocorrelation
and relatedness
Spatial autocorrelation analyses of the microsatellite data
were conducted using Genalex v6.4 to estimate the
neighbourhood size of males and females (separately)
using 10 9 50 m distance classes (500 m). 1,000 permu-
tations of the data were used to create the 95 % confidence
interval around the null hypothesis (r = 0) and estimates of
r were plotted at the end point of each distance class.
500 m was chosen as the maximum distance class as pre-
liminary analyses using distance classes up to 3,000 m did
not show any significant structure (data not shown).
Sex specific relatedness within each of the subpopula-
tions was calculated in Genalex v6.4. Male and female
sample sizes for each sub-sample population were as
follows; BG, 14 #, 16 $; BR, 12 #, 7 $; EG-W, 18 #, 11 $;
EG-E, 20 #, 12 $; FI-E, 19 #, 13 $; FI-W, 7 #, 4 $.
Pairwise relatedness (r) estimates were calculated using the
Queller and Goodnight (1989) method and the Pop Mean
option was used to determine an average of pairwise
relatedness within the population using 1,000 permutations
and 1,000 bootstraps to estimate the 95 % confidence
intervals around r.
Results
Microsatellite diversity and population bottlenecks
All individuals were genotyped successfully at 10 micro-
satellite loci. After correction for multiple sampling (Rice
1989) several loci were found to deviate significantly from
HWE in some, but not all, populations [Pl12, Pa297, Y175
(EG), Pa297, Bt76 (SH) and G26.4 (FI)]. Results of pre-
liminary analyses did not differ when data was run
including and excluding these loci, therefore all were
retained in the final analysis. All loci were in LD. AD
ranged from 2.90 to 9.70 (Table 1), and when corrected for
the smallest sample size (n = 11) AR ranged from 2.16 to
5.66 (Table 1). Expected heterozygosity ranged from 0.47
to 0.80 (Table 1). Data per loci is presented in Table S1,
supplementary material. No recent bottlenecks were
detected in any of the populations. The results of the
Wilcoxon Rank Sign tests indicated that there were no
significant differences between any of the intra-population
comparisons (AD, AR, HO, HE), however most inter-pop-
ulation comparisons were significant (Table 2).
Mitochondrial DNA diversity
Approximately 621 bp of the mtDNA CR was sequenced
from 157 individuals, with 23 unique haplotypes identified
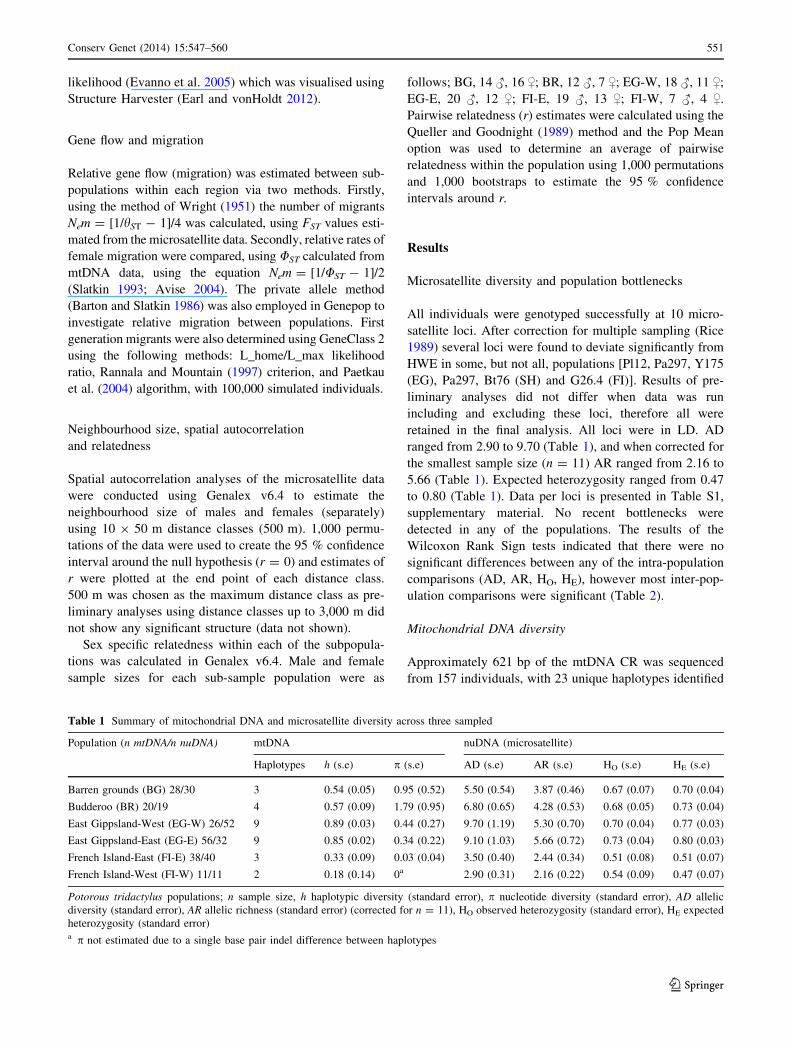
Table 1 Summary of mitochondrial DNA and microsatellite diversity across three sampled
Population (n mtDNA/n nuDNA) mtDNA nuDNA (microsatellite)
Haplotypes h (s.e) p (s.e) AD (s.e) AR (s.e) HO (s.e) HE (s.e)
Barren grounds (BG) 28/30 3 0.54 (0.05) 0.95 (0.52) 5.50 (0.54) 3.87 (0.46) 0.67 (0.07) 0.70 (0.04)
Budderoo (BR) 20/19 4 0.57 (0.09) 1.79 (0.95) 6.80 (0.65) 4.28 (0.53) 0.68 (0.05) 0.73 (0.04)
East Gippsland-West (EG-W) 26/52 9 0.89 (0.03) 0.44 (0.27) 9.70 (1.19) 5.30 (0.70) 0.70 (0.04) 0.77 (0.03)
East Gippsland-East (EG-E) 56/32 9 0.85 (0.02) 0.34 (0.22) 9.10 (1.03) 5.66 (0.72) 0.73 (0.04) 0.80 (0.03)
French Island-East (FI-E) 38/40 3 0.33 (0.09) 0.03 (0.04) 3.50 (0.40) 2.44 (0.34) 0.51 (0.08) 0.51 (0.07)
French Island-West (FI-W) 11/11 2 0.18 (0.14) 0a 2.90 (0.31) 2.16 (0.22) 0.54 (0.09) 0.47 (0.07)
Potorous tridactylus populations; n sample size, h haplotypic diversity (standard error), p nucleotide diversity (standard error), AD allelic
diversity (standard error), AR allelic richness (standard error) (corrected for n = 11), HO observed heterozygosity (standard error), HE expected
heterozygosity (standard error)a p not estimated due to a single base pair indel difference between haplotypes
Conserv Genet (2014) 15:547–560 551
123
(GenBank Accession numbers: KF979308 – KF979330).
21 of the 23 haplotypes identified were recorded in mul-
tiple individuals, the two samples that represented single-
ton haplotypes were sequenced from two independent
PCRs to confirm the sequence. The EG populations
appeared to harbour the most diversity and FI the lowest
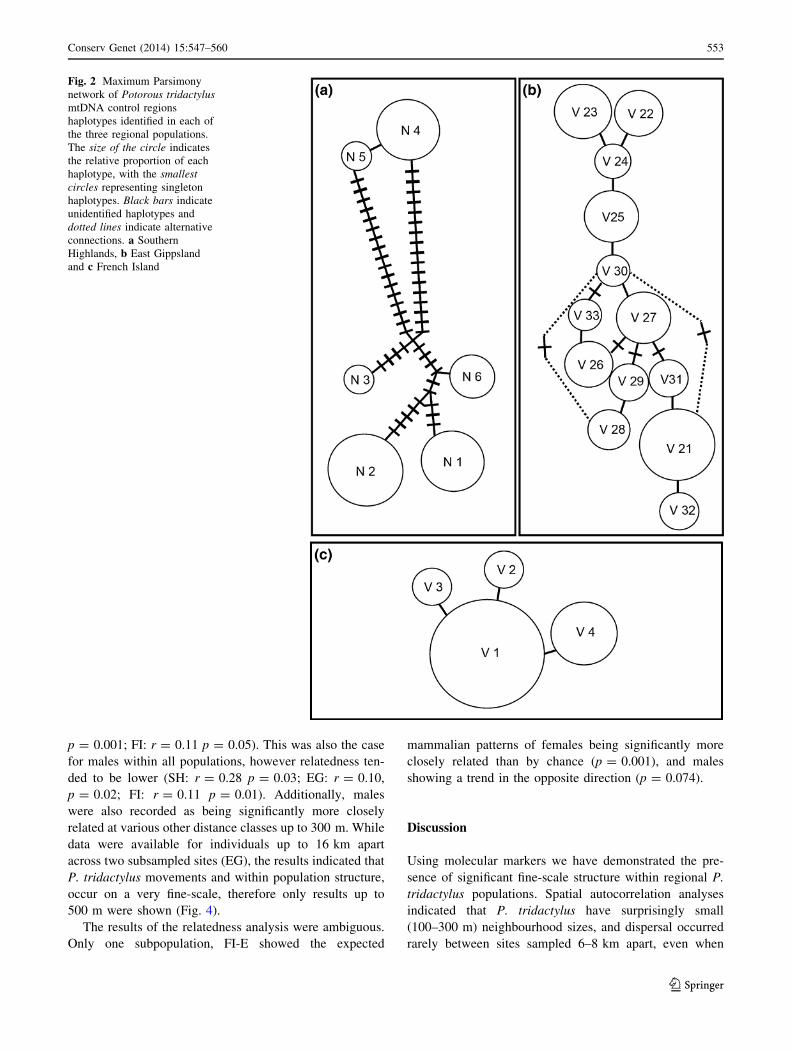
(Table 1). While some haplotypes were shared between
subpopulations, none were shared between the regions
(Fig. 2). All FI haplotypes were closely related with lim-
ited mutational steps separating each haplotype on the
island. Conversely, while SH and EG had some haplotypes
that were closely related (\5 steps), these populations also
included haplotypes that were over 5–10 steps different
from the others in the population, SH had the most missing
haplotypes with over 20 steps recorded between haplotypes
(Fig. 2).
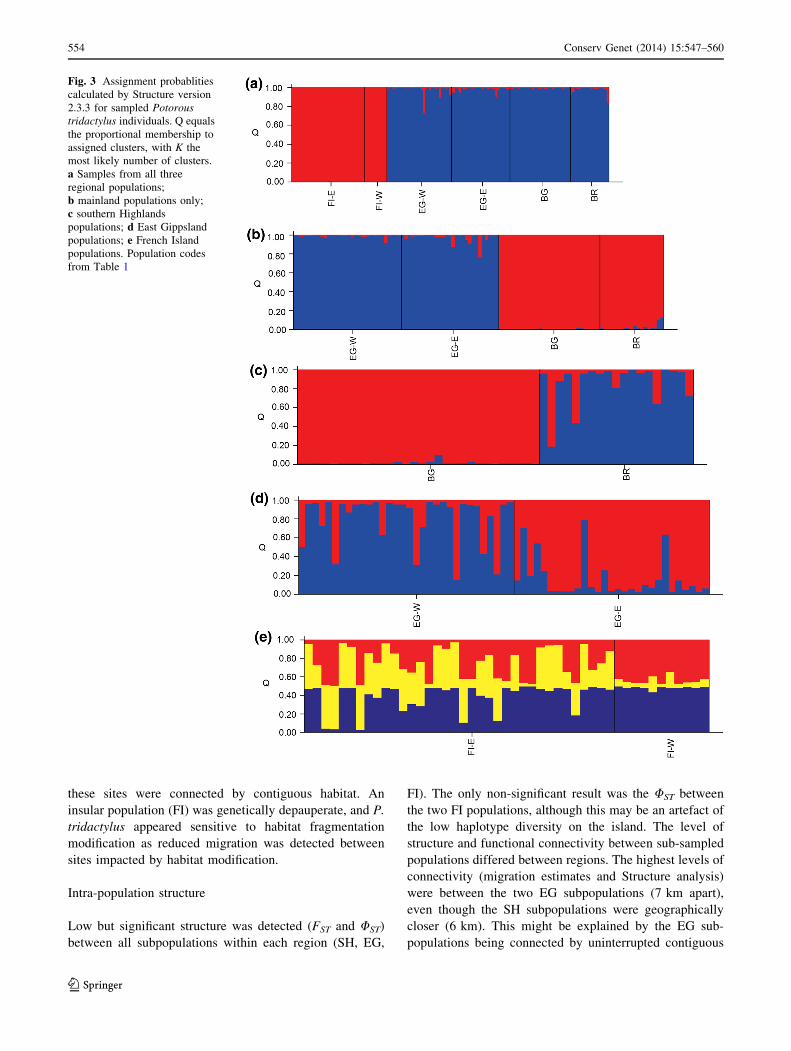
Population structure (assignment tests)
Structure analyses identified both inter-population and
intra-population structuring across all sites in the micro-
satellite data (Fig. 3). Analysis of all regional populations
suggested K = 2 was the best fit for the data, grouping the
mainland SH and EG populations and separating the FI
populations (Fig. 3a). Analysis of mainland populations
only suggested K = 2 was the most likely fit for the data,
separating SH and EG populations (Fig. 3b). Analysis of
individual populations also revealed intra-population
structuring with K = 2 proposed within the SH and EG
subpopulations (Fig. 3c and d) and K = 3 across FI
(Fig. 3e). The K = 2 subpopulations identified in SH and
EG equated to the two sub-sampled populations, however
the levels of admixture differed between subpopulations.
Between the two SH subpopulations Q [ 0.9, indicating
low levels of gene flow. Conversely higher levels of
admixture were present between the two EG subpopula-
tions (Q B 0.7). Individuals from the two sub-sampled
populations on FI were equally as likely to belong to any of
the three populations suggested by Structure, with Q values
suggesting high levels of admixture (Q B 0.5), although it
is likely that the low genetic diversity on FI reduced the
resolving power of data.
Gene flow and migration
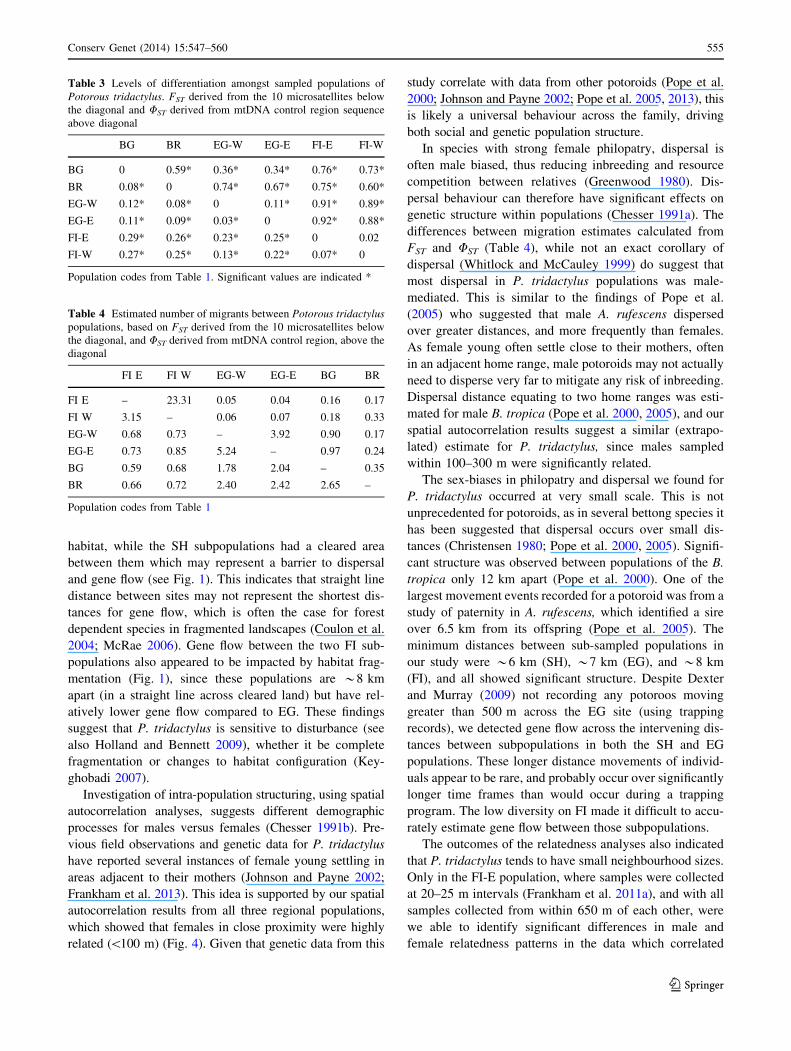
FST and UST values were significant between all regional
populations (FST range: 0.09–0.29, UST range: 0.34–0.91;
see Table 3) and subpopulations FST range: 0.03–0.08, UST
range: 0.02–0.59; see Table 3). The only non-significant
result was the UST value between the two FI subpopula-
tions. Migration rates between regional populations were
low. Analyses using the Wright (1951) and Slatkin (1993)
methods suggested that there was less than one migrant per
generation between FI and the other regional populations
(Table 4). Some migration however was estimated to occur
between EG and the SH. Migration rates were higher
between the sub-sampled populations within SH, EG and
FI, with the two EG subpopulations appearing to have the
highest relative migration rates, with up to three times
more migration between subpopulations using the Wright
(1951) method (Table 4). The private allele method (Bar-
ton and Slatkin 1986) suggested more conservative esti-
mates of migration between subpopulations. Although the
relative migration rates between different populations were
similar, values for EG were the highest and those for FI the
lowest. The migration rates estimated using the mtDNA
data were consistently lower, suggesting that the estimate
of overall migration was biased by male movements
(Table 4). The higher rate of migration recorded in females
on FI can be explained by the presence of only four hap-
lotypes on FI that differed by only one base pair indel in
each case.
GeneClass 2 assignment testing suggested nearly all
individuals (95 %) were native to the subpopulation in
which they were sampled. First generations migrants were
rare, although two (out of 29) were identified in the EG-E
site and three (out of 32) were identified in the EG-W site.
Lower first generation migration was recorded across the
SH subpopulations with only two (out of 19) identified in
the BR subpopulation. No first generation migrations were
identified between the FI populations. Overall, all but one
first generation migrants were male.
Neighbourhood size, spatial autocorrelation
and relatedness
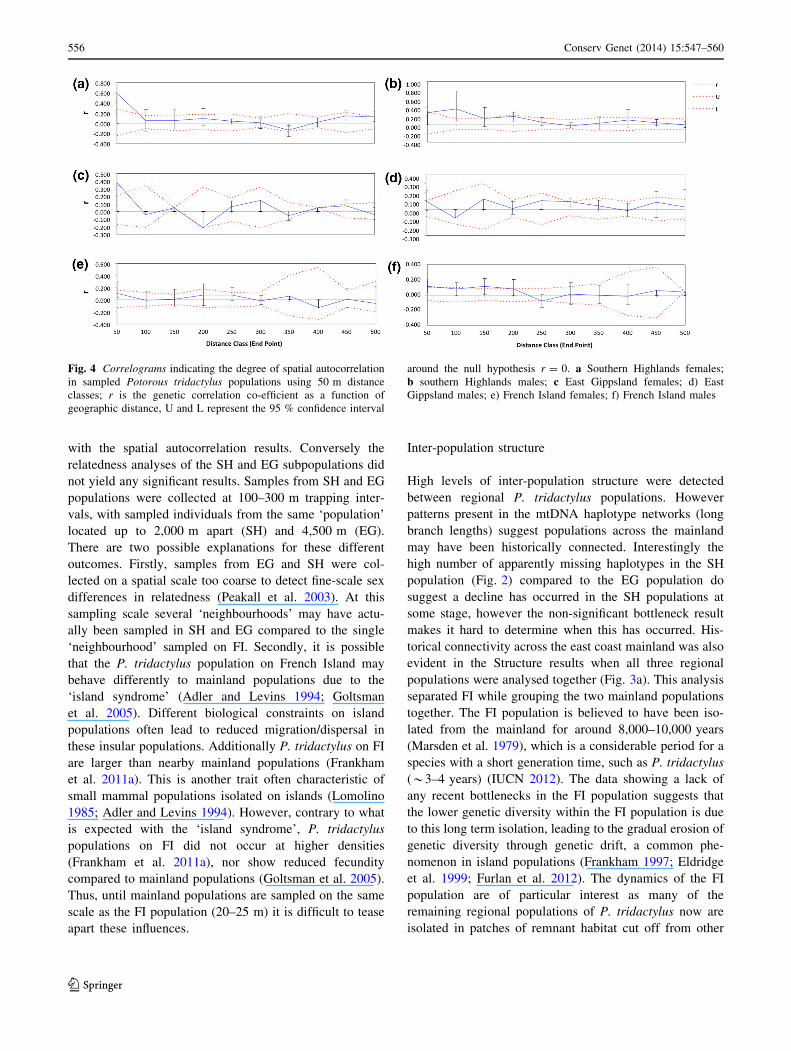
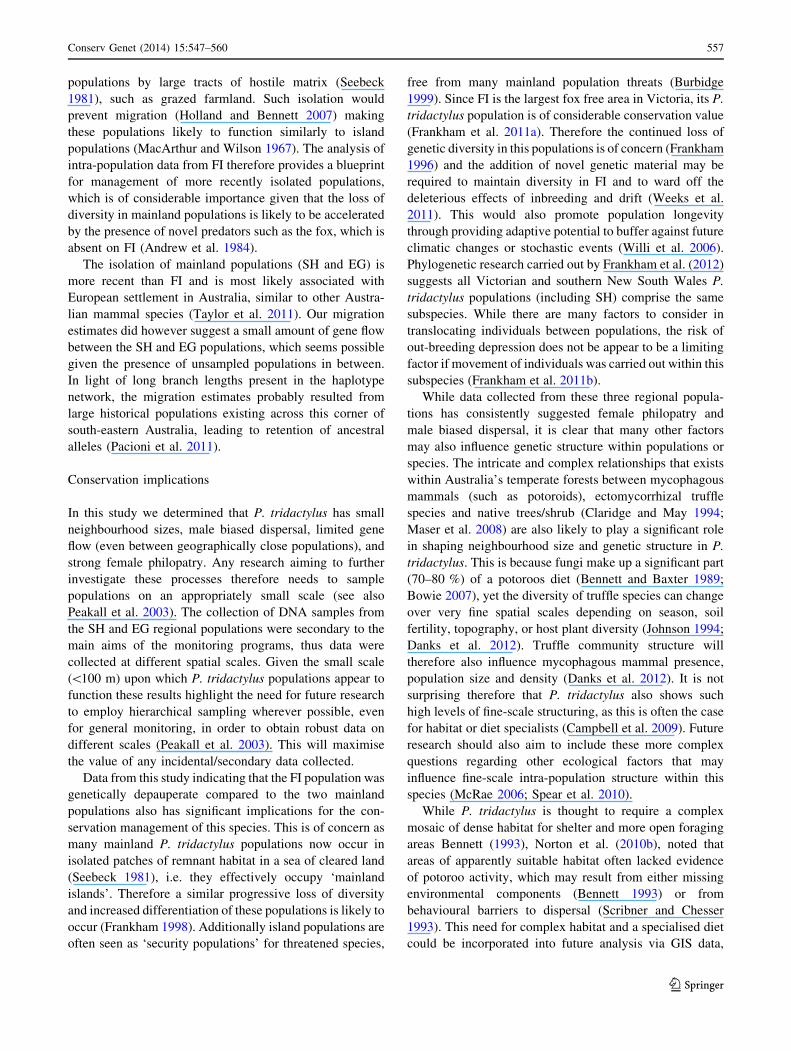
The results of the spatial autocorrelation (Fig. 4) indicated
that females sampled within 100 m of one another, across
all populations, were significantly more closely related than
by chance (SH: r = 0.60, p = 0.003; EG: r = 0.38,
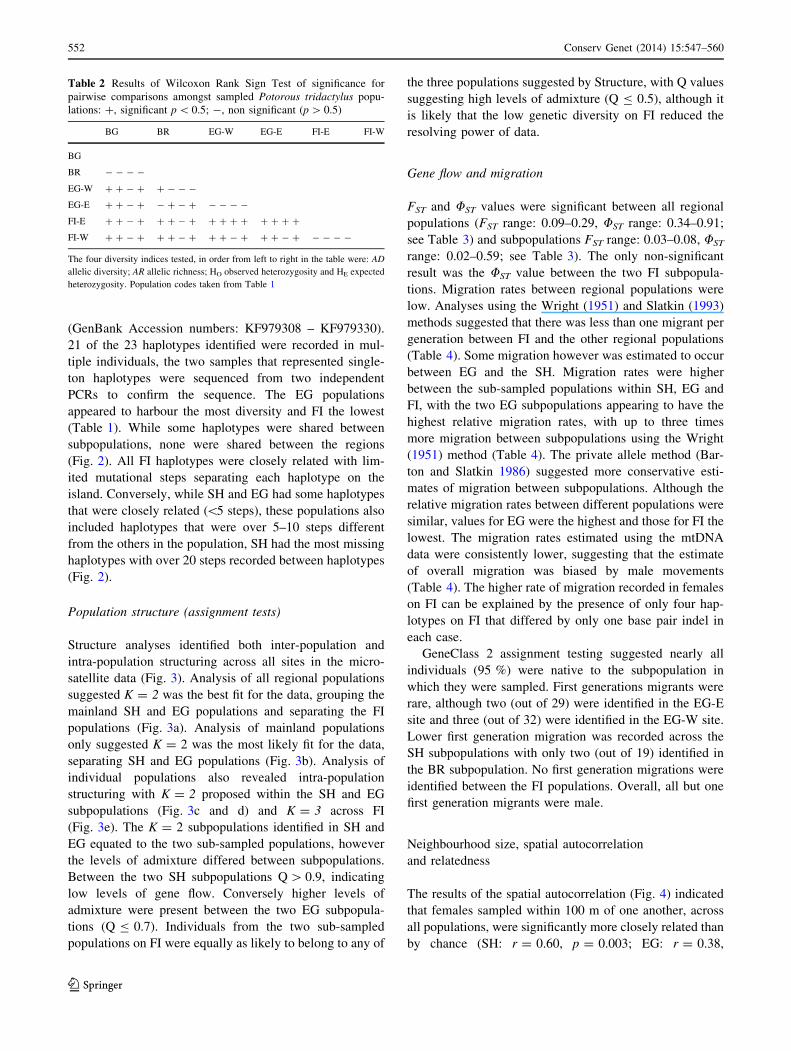
Table 2 Results of Wilcoxon Rank Sign Test of significance for
pairwise comparisons amongst sampled Potorous tridactylus popu-
lations: ?, significant p \ 0.5; -, non significant (p [ 0.5)
BG BR EG-W EG-E FI-E FI-W
BG
BR - - - -
EG-W ? ? - ? ? - - -
EG-E ? ? - ? - ? - ? - - - -
FI-E ? ? - ? ? ? - ? ? ? ? ? ? ? ? ?
FI-W ? ? - ? ? ? - ? ? ? - ? ? ? - ? - - - -
The four diversity indices tested, in order from left to right in the table were: AD
allelic diversity; AR allelic richness; HO observed heterozygosity and HE expected
heterozygosity. Population codes taken from Table 1
552 Conserv Genet (2014) 15:547–560
123
p = 0.001; FI: r = 0.11 p = 0.05). This was also the case
for males within all populations, however relatedness ten-
ded to be lower (SH: r = 0.28 p = 0.03; EG: r = 0.10,
p = 0.02; FI: r = 0.11 p = 0.01). Additionally, males
were also recorded as being significantly more closely
related at various other distance classes up to 300 m. While
data were available for individuals up to 16 km apart
across two subsampled sites (EG), the results indicated that
P. tridactylus movements and within population structure,
occur on a very fine-scale, therefore only results up to
500 m were shown (Fig. 4).
The results of the relatedness analysis were ambiguous.
Only one subpopulation, FI-E showed the expected
mammalian patterns of females being significantly more
closely related than by chance (p = 0.001), and males
showing a trend in the opposite direction (p = 0.074).
Discussion
Using molecular markers we have demonstrated the pre-
sence of significant fine-scale structure within regional P.
tridactylus populations. Spatial autocorrelation analyses
indicated that P. tridactylus have surprisingly small
(100–300 m) neighbourhood sizes, and dispersal occurred
rarely between sites sampled 6–8 km apart, even when
Fig. 2 Maximum Parsimony
network of Potorous tridactylus
mtDNA control regions
haplotypes identified in each of
the three regional populations.
The size of the circle indicates
the relative proportion of each
haplotype, with the smallest
circles representing singleton
haplotypes. Black bars indicate
unidentified haplotypes and
dotted lines indicate alternative
connections. a Southern
Highlands, b East Gippsland
and c French Island
Conserv Genet (2014) 15:547–560 553
123
these sites were connected by contiguous habitat. An
insular population (FI) was genetically depauperate, and P.
tridactylus appeared sensitive to habitat fragmentation
modification as reduced migration was detected between
sites impacted by habitat modification.
Intra-population structure
Low but significant structure was detected (FST and UST)
between all subpopulations within each region (SH, EG,
FI). The only non-significant result was the UST between
the two FI populations, although this may be an artefact of
the low haplotype diversity on the island. The level of
structure and functional connectivity between sub-sampled
populations differed between regions. The highest levels of
connectivity (migration estimates and Structure analysis)
were between the two EG subpopulations (7 km apart),
even though the SH subpopulations were geographically
closer (6 km). This might be explained by the EG sub-
populations being connected by uninterrupted contiguous
Fig. 3 Assignment probablities
calculated by Structure version
2.3.3 for sampled Potorous
tridactylus individuals. Q equals
the proportional membership to
assigned clusters, with K the
most likely number of clusters.
a Samples from all three
regional populations;
b mainland populations only;
c southern Highlands
populations; d East Gippsland
populations; e French Island
populations. Population codes
from Table 1
554 Conserv Genet (2014) 15:547–560
123
habitat, while the SH subpopulations had a cleared area
between them which may represent a barrier to dispersal
and gene flow (see Fig. 1). This indicates that straight line
distance between sites may not represent the shortest dis-
tances for gene flow, which is often the case for forest
dependent species in fragmented landscapes (Coulon et al.
2004; McRae 2006). Gene flow between the two FI sub-
populations also appeared to be impacted by habitat frag-
mentation (Fig. 1), since these populations are *8 km
apart (in a straight line across cleared land) but have rel-
atively lower gene flow compared to EG. These findings
suggest that P. tridactylus is sensitive to disturbance (see
also Holland and Bennett 2009), whether it be complete
fragmentation or changes to habitat configuration (Key-
ghobadi 2007).
Investigation of intra-population structuring, using spatial
autocorrelation analyses, suggests different demographic
processes for males versus females (Chesser 1991b). Pre-
vious field observations and genetic data for P. tridactylus
have reported several instances of female young settling in
areas adjacent to their mothers (Johnson and Payne 2002;
Frankham et al. 2013). This idea is supported by our spatial
autocorrelation results from all three regional populations,
which showed that females in close proximity were highly
related (\100 m) (Fig. 4). Given that genetic data from this
study correlate with data from other potoroids (Pope et al.
2000; Johnson and Payne 2002; Pope et al. 2005, 2013), this
is likely a universal behaviour across the family, driving
both social and genetic population structure.
In species with strong female philopatry, dispersal is
often male biased, thus reducing inbreeding and resource
competition between relatives (Greenwood 1980). Dis-
persal behaviour can therefore have significant effects on
genetic structure within populations (Chesser 1991a). The
differences between migration estimates calculated from
FST and UST (Table 4), while not an exact corollary of
dispersal (Whitlock and McCauley 1999) do suggest that
most dispersal in P. tridactylus populations was male-
mediated. This is similar to the findings of Pope et al.
(2005) who suggested that male A. rufescens dispersed
over greater distances, and more frequently than females.
As female young often settle close to their mothers, often
in an adjacent home range, male potoroids may not actually
need to disperse very far to mitigate any risk of inbreeding.
Dispersal distance equating to two home ranges was esti-
mated for male B. tropica (Pope et al. 2000, 2005), and our
spatial autocorrelation results suggest a similar (extrapo-
lated) estimate for P. tridactylus, since males sampled
within 100–300 m were significantly related.
The sex-biases in philopatry and dispersal we found for
P. tridactylus occurred at very small scale. This is not
unprecedented for potoroids, as in several bettong species it
has been suggested that dispersal occurs over small dis-
tances (Christensen 1980; Pope et al. 2000, 2005). Signifi-
cant structure was observed between populations of the B.
tropica only 12 km apart (Pope et al. 2000). One of the
largest movement events recorded for a potoroid was from a
study of paternity in A. rufescens, which identified a sire
over 6.5 km from its offspring (Pope et al. 2005). The
minimum distances between sub-sampled populations in
our study were *6 km (SH), *7 km (EG), and *8 km
(FI), and all showed significant structure. Despite Dexter
and Murray (2009) not recording any potoroos moving
greater than 500 m across the EG site (using trapping
records), we detected gene flow across the intervening dis-
tances between subpopulations in both the SH and EG
populations. These longer distance movements of individ-
uals appear to be rare, and probably occur over significantly
longer time frames than would occur during a trapping
program. The low diversity on FI made it difficult to accu-
rately estimate gene flow between those subpopulations.
The outcomes of the relatedness analyses also indicated
that P. tridactylus tends to have small neighbourhood sizes.
Only in the FI-E population, where samples were collected
at 20–25 m intervals (Frankham et al. 2011a), and with all
samples collected from within 650 m of each other, were
we able to identify significant differences in male and
female relatedness patterns in the data which correlated
Table 3 Levels of differentiation amongst sampled populations of
Potorous tridactylus. FST derived from the 10 microsatellites below
the diagonal and UST derived from mtDNA control region sequence
above diagonal
BG BR EG-W EG-E FI-E FI-W
BG 0 0.59* 0.36* 0.34* 0.76* 0.73*
BR 0.08* 0 0.74* 0.67* 0.75* 0.60*
EG-W 0.12* 0.08* 0 0.11* 0.91* 0.89*
EG-E 0.11* 0.09* 0.03* 0 0.92* 0.88*
FI-E 0.29* 0.26* 0.23* 0.25* 0 0.02
FI-W 0.27* 0.25* 0.13* 0.22* 0.07* 0
Population codes from Table 1. Significant values are indicated *
Table 4 Estimated number of migrants between Potorous tridactylus
populations, based on FST derived from the 10 microsatellites below
the diagonal, and UST derived from mtDNA control region, above the
diagonal
FI E FI W EG-W EG-E BG BR
FI E – 23.31 0.05 0.04 0.16 0.17
FI W 3.15 – 0.06 0.07 0.18 0.33
EG-W 0.68 0.73 – 3.92 0.90 0.17
EG-E 0.73 0.85 5.24 – 0.97 0.24
BG 0.59 0.68 1.78 2.04 – 0.35
BR 0.66 0.72 2.40 2.42 2.65 –
Population codes from Table 1
Conserv Genet (2014) 15:547–560 555
123
with the spatial autocorrelation results. Conversely the
relatedness analyses of the SH and EG subpopulations did
not yield any significant results. Samples from SH and EG
populations were collected at 100–300 m trapping inter-
vals, with sampled individuals from the same ‘population’
located up to 2,000 m apart (SH) and 4,500 m (EG).
There are two possible explanations for these different
outcomes. Firstly, samples from EG and SH were col-
lected on a spatial scale too coarse to detect fine-scale sex
differences in relatedness (Peakall et al. 2003). At this
sampling scale several ‘neighbourhoods’ may have actu-
ally been sampled in SH and EG compared to the single
‘neighbourhood’ sampled on FI. Secondly, it is possible
that the P. tridactylus population on French Island may
behave differently to mainland populations due to the
‘island syndrome’ (Adler and Levins 1994; Goltsman
et al. 2005). Different biological constraints on island
populations often lead to reduced migration/dispersal in
these insular populations. Additionally P. tridactylus on FI
are larger than nearby mainland populations (Frankham
et al. 2011a). This is another trait often characteristic of
small mammal populations isolated on islands (Lomolino
1985; Adler and Levins 1994). However, contrary to what
is expected with the ‘island syndrome’, P. tridactylus
populations on FI did not occur at higher densities
(Frankham et al. 2011a), nor show reduced fecundity
compared to mainland populations (Goltsman et al. 2005).
Thus, until mainland populations are sampled on the same
scale as the FI population (20–25 m) it is difficult to tease
apart these influences.
Inter-population structure
High levels of inter-population structure were detected
between regional P. tridactylus populations. However
patterns present in the mtDNA haplotype networks (long
branch lengths) suggest populations across the mainland
may have been historically connected. Interestingly the
high number of apparently missing haplotypes in the SH
population (Fig. 2) compared to the EG population do
suggest a decline has occurred in the SH populations at
some stage, however the non-significant bottleneck result
makes it hard to determine when this has occurred. His-
torical connectivity across the east coast mainland was also
evident in the Structure results when all three regional
populations were analysed together (Fig. 3a). This analysis
separated FI while grouping the two mainland populations
together. The FI population is believed to have been iso-
lated from the mainland for around 8,000–10,000 years
(Marsden et al. 1979), which is a considerable period for a
species with a short generation time, such as P. tridactylus
(*3–4 years) (IUCN 2012). The data showing a lack of
any recent bottlenecks in the FI population suggests that
the lower genetic diversity within the FI population is due
to this long term isolation, leading to the gradual erosion of
genetic diversity through genetic drift, a common phe-
nomenon in island populations (Frankham 1997; Eldridge
et al. 1999; Furlan et al. 2012). The dynamics of the FI
population are of particular interest as many of the
remaining regional populations of P. tridactylus now are
isolated in patches of remnant habitat cut off from other
Fig. 4 Correlograms indicating the degree of spatial autocorrelation
in sampled Potorous tridactylus populations using 50 m distance
classes; r is the genetic correlation co-efficient as a function of
geographic distance, U and L represent the 95 % confidence interval
around the null hypothesis r = 0. a Southern Highlands females;
b southern Highlands males; c East Gippsland females; d) East
Gippsland males; e) French Island females; f) French Island males
556 Conserv Genet (2014) 15:547–560
123
populations by large tracts of hostile matrix (Seebeck
1981), such as grazed farmland. Such isolation would
prevent migration (Holland and Bennett 2007) making
these populations likely to function similarly to island
populations (MacArthur and Wilson 1967). The analysis of
intra-population data from FI therefore provides a blueprint
for management of more recently isolated populations,
which is of considerable importance given that the loss of
diversity in mainland populations is likely to be accelerated
by the presence of novel predators such as the fox, which is
absent on FI (Andrew et al. 1984).
The isolation of mainland populations (SH and EG) is
more recent than FI and is most likely associated with
European settlement in Australia, similar to other Austra-
lian mammal species (Taylor et al. 2011). Our migration
estimates did however suggest a small amount of gene flow
between the SH and EG populations, which seems possible
given the presence of unsampled populations in between.
In light of long branch lengths present in the haplotype
network, the migration estimates probably resulted from
large historical populations existing across this corner of
south-eastern Australia, leading to retention of ancestral
alleles (Pacioni et al. 2011).
Conservation implications
In this study we determined that P. tridactylus has small
neighbourhood sizes, male biased dispersal, limited gene
flow (even between geographically close populations), and
strong female philopatry. Any research aiming to further
investigate these processes therefore needs to sample
populations on an appropriately small scale (see also
Peakall et al. 2003). The collection of DNA samples from
the SH and EG regional populations were secondary to the
main aims of the monitoring programs, thus data were
collected at different spatial scales. Given the small scale
(\100 m) upon which P. tridactylus populations appear to
function these results highlight the need for future research
to employ hierarchical sampling wherever possible, even
for general monitoring, in order to obtain robust data on
different scales (Peakall et al. 2003). This will maximise
the value of any incidental/secondary data collected.
Data from this study indicating that the FI population was
genetically depauperate compared to the two mainland
populations also has significant implications for the con-
servation management of this species. This is of concern as
many mainland P. tridactylus populations now occur in
isolated patches of remnant habitat in a sea of cleared land
(Seebeck 1981), i.e. they effectively occupy ‘mainland
islands’. Therefore a similar progressive loss of diversity
and increased differentiation of these populations is likely to
occur (Frankham 1998). Additionally island populations are
often seen as ‘security populations’ for threatened species,
free from many mainland population threats (Burbidge
1999). Since FI is the largest fox free area in Victoria, its P.
tridactylus population is of considerable conservation value
(Frankham et al. 2011a). Therefore the continued loss of
genetic diversity in this populations is of concern (Frankham
1996) and the addition of novel genetic material may be
required to maintain diversity in FI and to ward off the
deleterious effects of inbreeding and drift (Weeks et al.
2011). This would also promote population longevity
through providing adaptive potential to buffer against future
climatic changes or stochastic events (Willi et al. 2006).
Phylogenetic research carried out by Frankham et al. (2012)
suggests all Victorian and southern New South Wales P.
tridactylus populations (including SH) comprise the same
subspecies. While there are many factors to consider in
translocating individuals between populations, the risk of
out-breeding depression does not be appear to be a limiting
factor if movement of individuals was carried out within this
subspecies (Frankham et al. 2011b).
While data collected from these three regional popula-
tions has consistently suggested female philopatry and
male biased dispersal, it is clear that many other factors
may also influence genetic structure within populations or
species. The intricate and complex relationships that exists
within Australia’s temperate forests between mycophagous
mammals (such as potoroids), ectomycorrhizal truffle
species and native trees/shrub (Claridge and May 1994;
Maser et al. 2008) are also likely to play a significant role
in shaping neighbourhood size and genetic structure in P.
tridactylus. This is because fungi make up a significant part
(70–80 %) of a potoroos diet (Bennett and Baxter 1989;
Bowie 2007), yet the diversity of truffle species can change
over very fine spatial scales depending on season, soil
fertility, topography, or host plant diversity (Johnson 1994;
Danks et al. 2012). Truffle community structure will
therefore also influence mycophagous mammal presence,
population size and density (Danks et al. 2012). It is not
surprising therefore that P. tridactylus also shows such
high levels of fine-scale structuring, as this is often the case
for habitat or diet specialists (Campbell et al. 2009). Future
research should also aim to include these more complex
questions regarding other ecological factors that may
influence fine-scale intra-population structure within this
species (McRae 2006; Spear et al. 2010).
While P. tridactylus is thought to require a complex
mosaic of dense habitat for shelter and more open foraging
areas Bennett (1993), Norton et al. (2010b), noted that
areas of apparently suitable habitat often lacked evidence
of potoroo activity, which may result from either missing
environmental components (Bennett 1993) or from
behavioural barriers to dispersal (Scribner and Chesser
1993). This need for complex habitat and a specialised diet
could be incorporated into future analysis via GIS data,
Conserv Genet (2014) 15:547–560 557
123
resistance layers (McRae 2006; Spear et al. 2010) and
least-cost path methods (Coulon et al. 2004), to reveal the
roles of landscape features and food availability in driving
fine-scale structure in P. tridactylus. These analyses should
also be coupled with hierarchical sampling (fine-scale to
regional) to identify the appropriate scale for data collec-
tion and to aid in identifying subtle barriers to gene flow
that may not be immediately obvious.
Acknowledgments Funding for this research was provided by the
Holsworth Wildlife Research Endowment, The Margaret Middleton
Fund for endangered Australian native vertebrate animals (The
Australian Academy of Sciences), The Geddes Postgraduate Award
(The Australian Museum), The M.A. Ingram Trust, and the University
of Melbourne. French Island field work was possible through the help
of the French Island Parks Victoria staff and field volunteers and was
conducted under Victorian Department of Sustainability and Envi-
ronment Wildlife Research Permits (10003301/10004552), and
approved by the University of Melbourne Animal Ethics Committee
(05023/0808507). East Gippsland field work was funded by the
Federal Australian Department of Environment and Heritage, and the
Victorian Department of Sustainability and Environment and carried
out under Victorian Department of Natural Resources & Environment
Animal Ethics Committee Approval Number 99/001. Southern
Highlands field work was funded by the New South Wales National
Parks and Wildlife Service and assisted by Alison Hartman (nee
Prentice), Juliet Dingle and numerous NPWS Highlands Area staff,
trapping was conducted under the Animal ethics number 031027/02.
The authors would also like to thank the Wildlife Genetics and
Microscopy Unit at the Australian Museum for their technical
support.
References
Adler GH, Levins R (1994) The island syndrome in rodent
populations. Q Rev Biol 69:473–490
Andrew DL, Lumsden LF, Dixon JM (1984) Sites of zoological
significance in the western Port region. Department of Conser-
vation, Forests and Lands, Melbourne
Anthony LL, Blumstein DT (2000) Integrating behaviour into wildlife
conservation: the multiple ways that behaviour can reduce Ne.
Biol Conserv 95:303–315. doi:10.1016/S0006-3207(00)00037-9
Avise JC (2004) Molecular markers, natural history, and evolution.
Sinauer Associates Inc, Sunderland
Barton NH, Slatkin M (1986) A quasi-equilibrium theory of the
distribution of rare alleles in a subdivided population. Heredity
56:409–415. doi:10.1038/hdy.1986.63
Bennett AF (1987) Conservation of mammals within a fragmented
forest environment: the contributions of insular biogeography
and autecology. In: Saunders DA, Arnold GW, Burbidge AA,
Hopkins AJM (eds) Nature conservation: the role of remnants of
native vegetation. Surrey Beatty, Sydney, pp 41–52
Bennett AF (1993) Microhabitat use by the long-nosed potoroo,
Potorous tridactylus, and other small mammals in remnant forest
vegetation of south-western Victoria. Wildl Res 20:267–285.
doi:10.1071/WR9930267
Bennett AF, Baxter BJ (1989) Diet of the long-nosed potoroo
Potorous tridactylus (Marsupialia: Potoroidae) in south-western
Victoria. Aust Wildl Res 16:263–272. doi:10.1071/WR9890263
Bowie F (2007) Fungal diversity in the diet of three small mammals
from French Island, Victoria. B.Sc. (Honours) Thesis, University
of Melbourne
Brouat C, Chevallier H, Meusnier S, Noblecourt T, Rasplus JY (2004)
Specialization and habitat: spatial and environmental effects on
abundance and genetic diversity of forest generalist and
specialist Carabus species. Mol Ecol 13:1815–1826. doi:10.
1111/j.1365-294X.2004.02206.x
Burbidge AA (1999) Conservation values and management of
Australian islands for non-volant mammal conservation. Aust
Mammal 21:67–74
Campbell S, Guay PJ, Mitrovski PJ, Mulder R (2009) Genetic
differentiation among populations of a specialist fishing bat
suggests lack of suitable habitat connectivity. Biol Conserv
142:2657–2664. doi:10.1016/j.biocon.2009.06.014
Chesser RK (1991a) Influence of gene flow and breeding tactics on
gene diversity within populations. Genetics 129:573–583
Chesser RK (1991b) Gene diversity and female philopatry. Genetics
127:437–447
Christensen PES (1980) The biology of Bettongia penicillata (Gray,
1837) and Macropus eugenii (Desmarest, 1817) in relation to
fire. Forests Department, Perth
Claridge AW, May TW (1994) Mycophagy among Australian
mammals. Austral Ecol 19:251–275. doi:10.1111/j.1442-9993.
1994.tb00489.x
Clement M, Posada D, Crandall KA (2000) TCS: a computer program
to estimate gene genealogies. Mol Ecol 9:1657–1659. doi:10.
1046/j.1365-294x.2000.01020.x
Colson K, Brinkman T, Person D, Hundertmark K (2013) Fine-scale
social and spatial genetic structure in Sitka black-tailed deer.
Conserv Genet. doi:10.1007/s10592-012-0388-0
Coulon A, Cosson JF, Angibault JM, Cargnelutti B, Galan M,
Morellet N, Petit E, Aulagnier S, Hewison AJM (2004)
Landscape connectivity influences gene flow in a roe deer
population inhabiting a fragmented landscape: an individual-
based approach. Mol Ecol 13:2841–2850. doi:10.1111/j.1365-
294X.2004.02253.x
Coulon AL, Guillot G, Cosson JF, Angibault JMA, Aulagnier S,
Cargnelutti B, Galan M, Hewison AJM (2006) Genetic structure
is influenced by landscape features: empirical evidence from a
roe deer population. Mol Ecol 15:1669–1679. doi:10.1111/j.
1365-294X.2006.02861.x
Danks M, Lebel T, Vernes K, Andrew N (2012) Truffle-like fungi
sporocarps in a eucalypt-dominated landscape: patterns in
diversity and community structure. Fungal Divers. doi:10.1007/
s13225-012-0193-6
Dexter N, Murray A (2009) The impact of fox control on the relative
abundance of forest mammals in East Gippsland, Victoria. Wildl
Res 36:252–261. doi:10.1071/WR08135
Earl D, vonHoldt B (2012) STRUCTURE HARVESTER: a website
and program for visualizing STRUCTURE output and imple-
menting the Evanno method. Conserv Genet Resour 4:359–361.
doi:10.1007/s12686-011-9548-7
Eldridge MDB, King JM, Loupis AK, Spencer PBS, Taylor AC, Pope
LC, Hall GP (1999) Unprecedented low levels of genetic
variation and inbreeding depression in an island population of
the black-footed rock-wallaby. Conserv Biol 13:531–541.
doi:10.1046/j.1523-1739.1999.98115.x
Evanno G, Regnaut S, Goudet J (2005) Detecting the number of
clusters of individuals using the software structure: a simulation
study. Mol Ecol 14:2611–2620. doi:10.1111/j.1365-294X.2005.
02553.x
Excoffier L, Lischer HEL (2010) Arlequin suite ver 3.5: a new series
of programs to perform population genetics analyses under
Linux and Windows. Mol Ecol Resour 10:564–567. doi:10.1111/
j.1755-0998.2010.02847.x
Fischer J, Lindenmayer DB (2007) Landscape modification and
habitat fragmentation: a synthesis. Glob Ecol Biogeogr
16:265–280. doi:10.1111/j.1466-8238.2007.00287.x
558 Conserv Genet (2014) 15:547–560
123
Frankham R (1996) Relationship of genetic variation to population
size in wildlife. Conserv Biol 10:1500–1508. doi:10.1046/j.
1523-1739.1996.10061500.x
Frankham R (1997) Do island populations have less genetic variation
than mainland populations? Heredity 78:311–327. doi:10.1038/
hdy.1997.46
Frankham R (1998) Inbreeding and extinction: island populations.
Conserv Biol 12:665–675. doi:10.1111/j.1523-1739.1998.96456.x
Frankham GJ, Reed RL, Fletcher TP, Handasyde KA (2011a)
Population ecology of the long-nosed potoroo (Potorous tri-
dactylus) on French Island, Victoria. Aust Mammal 33:73–81.
doi:10.1071/AM10051
Frankham R, Ballou JD, Eldridge MDB, Lacy RC, Ralls K, Dudash
MR, Fenster CB (2011b) Predicting the probability of outbreed-
ing depression. Conserv Biol 25:465–475. doi:10.1111/j.1523-
1739.2011.01662.x
Frankham GJ, Handasyde KA, Eldridge MDB (2012) Novel insights
into the phylogenetic relationships of the endangered marsupial
genus Potorous. Mol Phylogenet Evol 64:592–602. doi:10.1016/
j.ympev.2012.05.013
Frankham GJ, Reed RL, Eldridge MDB, Handasyde KA (2013) The
genetic mating system of the long-nosed potoroo (Potorous
tridactylus) with notes on male strategies for securing paternity.
Aust J Zool 60:225–234. doi:10.1071/ZO12064
Fumagalli L, Pope LC, Taberlet P, Moritz C (1997) Versatile primers
for the amplification of the mitochondrial DNA control region in
marsupials. Mol Ecol 6:1199–1201. doi:10.1046/j.1365-294X.
1997.00298.x
Furlan E, Stoklosa J, Griffiths J, Gust N, Ellis R, Huggins RM,
Weeks AR (2012) Small population size and extremely low
levels of genetic diversity in island populations of the
platypus, Ornithorhynchus anatinus. Ecol Evol 2:844–857.
doi:10.1002/ece3.195
Goltsman M, Kruchenkova EP, Sergeev S, Volodin I, Macdonald DW
(2005) ‘Island syndrome’ in a population of Arctic foxes (Alopex
lagopus) from Mednyi Island. J Zool 267:405–418. doi:10.1017/
S0952836905007557
Goudet J (1995) FSTAT (version 1.2): a computer program to
calculate F-statistics. J Hered 86:485–486
Greenwood PJ (1980) Mating systems, philopatry and dispersal in
birds and mammals. Anim Behav 28:1140–1162. doi:10.1016/
S0003-3472(80)80103-5
Haila Y (2002) A conceptual genealogy of fragmentation research:
from island biogeography to landscape ecology. Ecol Appl
12:321–334. doi:10.1890/1051-0761(2002)012[0321:ACGOFR]
2.0.CO;2
Holland GJ, Bennett AF (2007) Occurrence of small mammals in a
fragmented landscape: the role of vegetation heterogeneity.
Wildl Res 34:387–397. doi:10.1071/WR07061
Holland GJ, Bennett AF (2009) Differing responses to landscape
change: implications for small mammal assemblages in forest
fragments. Biodivers Conserv 18:2997–3016. doi:10.1007/
s10531-009-9621-7
IUCN (2012) IUCN red list of threatened species. Version 2012.1.
http://www.iucnredlist.org. Accessed Sept 2012
Johnson CN (1989) Dispersal and philopatry in the Macropodoids. In:
Grigg G, Jarman PJ, Hume I (eds) Kangaroos, wallabies and rat-
kangaroos. Surrey Beatty & Sons, Chipping Norton, pp 593–601
Johnson C (1994) Fruiting of hypogeous fungi in dry sclerophyll
forest in Tasmania, Australia: seasonal variation and annual
production. Mycol Res 98:1173–1182. doi:10.1016/S0953-
7562(09)80201-3
Johnson CN, Payne A (2002) Sex-biased dispersal in the rufous
bettong Aepyprymnus rufescens. Aust Mammal 24:233–235.
doi:10.1071/AM02233
Johnston PG (2008) Long-nosed potoroo. In: Van Dyck S, Strahan R
(eds) Mammals of Australia. New Holland Publishers, Chats-
wood, pp 302–304
Keyghobadi N (2007) The genetic implications of habitat fragmen-
tation for animals. Can J Zool 85:1049–1064. doi:10.1139/Z07-
095
Keyghobadi N, Roland J, Strobeck C (2005) Genetic differentiation
and gene flow among populations of the alpine butterfly,
Parnassius smintheus, vary with landscape connectivity. Mol
Ecol 14:1897–1909. doi:10.1111/j.1365-294X.2005.02563.x
Lacy RC (1987) Loss of genetic diversity from managed populations:
interacting effects of drift, mutation, immigration, selection, and
population subdivision. Conserv Biol 1:143–158. doi:10.1111/j.
1523-1739.1987.tb00023.x
Lancaster ML, Taylor AC, Cooper SJB, Carthew SM (2011) Limited
ecological connectivity of an arboreal marsupial across a forest/
plantation landscape despite apparent resilience to fragmenta-
tion. Mol Ecol 20:2258–2271. doi:10.1111/j.1365-294X.2011.
05072.x
Lomolino MV (1985) Body size of mammals on islands: the island
rule reexamined. Am Nat 125:310–316
MacArthur RH, Wilson EO (1967) The theory of island biogeogra-
phy. Princeton University Press, Princeton
Marsden MAH, Mallett CW, Donaldson AK (1979) Geological and
physical setting, sediments and environments, Western Port,
Victoria. Mar Geol 30:11–46. doi:10.1016/0025-3227(79)90004-5
Martin D, Temple-Smith P (2010) National recovery plan (draft) for
the long-nosed potoroo Potorous tridactylus tridactylus. Depart-
ment of Sustainability and Environment, East Melbourne
Maser C, Claridge A, Trappe JM (2008) Trees, truffles, and beasts:
how forests function. Rutgers University Press, New Brunswick
McRae BH (2006) Isolation by resistance. Evolution 60:1551–1561.
doi:10.1111/j.0014-3820.2006.tb00500.x
Moritz C (1994) Defining ‘Evolutionarily Significant Units’ for
conservation. Trends Ecol Evol 9:373–375. doi:10.1016/0169-
5347(94)90057-4
Norton MA, Claridge AW, French K, Prentice A (2010a) Population
biology of the long-nosed potoroo (Potorous tridactylus) in the
southern Highlands of New South Wales. Aust J Zool
58:362–368. doi:10.1071/ZO10075
Norton MA, French K, Claridge AW (2010b) Habitat associations of
the long-nosed potoroo (Potorous tridactylus) at multiple spatial
scales. Aust J Zool 58:303–316. doi:10.1071/ZO10042
Pacioni C, Wayne AF, Spencer PBS (2011) Effects of habitat
fragmentation on population structure and long-distance gene
flow in an endangered marsupial: the woylie. J Zool 283:98–107.
doi:10.1111/j.1469-7998.2010.00750.x
Paetkau D, Slade R, Burden M, Estoup A (2004) Genetic assignment
methods for the direct, real-time estimation of migration rate: a
simulation-based exploration of accuracy and power. Mol Ecol
13:55–65. doi:10.1046/j.1365-294X.2004.02008.x
Peakall R, Smouse PE (2006) Genalex 6: genetic analysis in Excel.
Population genetic software for teaching and research. Mol Ecol
Notes 6:288–295. doi:10.1111/j.1471-8286.2005.01155.x
Peakall R, Ruibal M, Lindenmayer DB (2003) Spatial autocorrelation
analysis offers new insights into gene flow in the Australian bush
rat, Rattus fuscipes. Evolution 57:1182–1195. doi:10.1111/j.
0014-3820.2003.tb00327.x
Piggott MP, Bellemain E, Taberlet P, Taylor AC (2004) A multiplex
pre-amplification method that significantly improves microsat-
ellite amplification and error rates for faecal DNA in limiting
conditions. Conserv Genet 5:417–420. doi:10.1023/B:COGE.
0000031138.67958.44
Piggott MP, Banks SC, Stone N, Banffy C, Taylor AC (2006a)
Estimating population size of endangered brush-tailed rock-
Conserv Genet (2014) 15:547–560 559
123
wallaby (Petrogale penicillata) colonies using faecal DNA. Mol
Ecol 15:81–91. doi:10.1111/j.1365-294X.2005.02783.x
Piggott MP, Banks SC, Taylor AC (2006b) Population structure of
brush-tailed rock-wallaby (Petrogale penicillata) colonies
inferred from analysis of faecal DNA. Mol Ecol 15:93–105.
doi:10.1111/j.1365-294X.2005.02784.x
Piry S, Luikart G, Cornuet JM (1999) Computer note. BOTTLE-
NECK: a computer program for detecting recent reductions in
the effective size using allele frequency data. J Hered
90:502–503. doi:10.1093/jhered/90.4.502
Pope LC, Estoup A, Moritz C (2000) Phylogeography and population
structure of an ecotonal marsupial, Bettongia tropica, deter-
mined using mtDNA and microsatellites. Mol Ecol
9:2041–2053. doi:10.1046/j.1365-294X.2000.01110.x
Pope LC, Blair D, Johnson CN (2005) Dispersal and population
structure of the rufous bettong, Aepyprymnus rufescens (Marsu-
pialia: Potoroidae). Austral Ecol 30:572–580. doi:10.1111/j.
1442-9993.2005.01472.x
Pope LC, Vernes K, Goldizen AW, Johnson CN (2013) Mating
system and local dispersal patterns of an endangered potoroid,
the northern bettong (Bettongia tropica). Aust J Zool
60:278–287. doi:10.1071/ZO12071
Pritchard JK, Stephens M, Donnelly P (2000) Inference of population
structure using multilocus genotype data. Genetics 155:945–959
Proctor MF, McLellan BN, Strobeck C, Barclay RMR (2005) Genetic
analysis reveals demographic fragmentation of grizzly bears
yielding vulnerably small populations. Proc R Soc Lond B Biol
Sci 272:2409–2416. doi:10.1098/rspb.2005.3246
Queller DC, Goodnight KF (1989) Estimating relatedness using
genetic markers. Evolution 43:258–275
Quinn G, Keough M (2002) Experimental design and data analysis for
biologists. Cambridge University Press, Cambridge
Rannala B, Mountain JL (1997) Detecting immigration by using
multilocus genotypes. Proc Natl Acad Sci 94:9197–9201
Raymond M, Rousset F (1995) GENEPOP (Version 1.2): population
genetics software for exact tests and ecumenicism. J Hered
86:248–249
Rice WR (1989) Analyzing tables of statistical tests. Evolution
43:223–225
Ricketts TH (2001) The matrix matters: effective isolation in
fragmented landscapes. Am Nat 158:87–99
Ruibal M, Peakall R, Claridge A, Murray A, Firestone K (2010)
Advancement to hair-sampling surveys of a medium-sized
mammal: DNA-based individual identification and population
estimation of a rare Australian marsupial, the spotted-tailed quoll
(Dasyurus maculatus). Wildl Res 37:27–38. doi:10.1071/
WR09087
Saunders DA, Hobbs RJ, Margules CR (1991) Biological conse-
quences of ecosystem fragmentation: a review. Conserv Biol
5:18–32. doi:10.1111/j.1523-1739.1991.tb00384.x
Scribner KT, Chesser RK (1993) Environmental and demographic
correlates of spatial and seasonal genetic structure in the eastern
cottontail (Sylvilagus floridanus). J Mammal 74:1026–1044
Seebeck JH (1978) Diet of the fox Vulpes vulpes in a western
Victorian forest. Austral Ecol 3:105–108. doi:10.1111/j.1442-
9993.1978.tb00856.x
Seebeck JH (1981) Potorous tridactylus (Kerr) (Marsupialia: Mac-
ropodidae) its distribution, status and habitat preferences in
Victoria, Australia. Aust Wildl Res 8:285–306. doi:10.1071/
WR9810285
Short J (1998) The extinction of rat-kangaroos (Marsupialia: Poto-
roidae) in New South Wales, Australia. Biol Conserv
86:365–377. doi:10.1016/S0006-3207(98)00026-3
Short J, Smith A (1994) Mammal decline and recovery in Australia.
J Mammal 75:288–297
Slatkin M (1993) Isolation by distance in equilibrium and non-
equilibrium populations. Evolution 47:264–279
Solberg KH, Bellemain E, Drageset OM, Taberlet P, Swenson JE
(2006) An evaluation of field and non-invasive genetic methods
to estimate brown bear (Ursus arctos) population size. Biol
Conserv 128:158–168. doi:10.1016/j.biocon.2005.09.025
Spear SF, Balkenhol N, Fortin MJ, McRae BH, Scribner KIM (2010)
Use of resistance surfaces for landscape genetic studies:
considerations for parameterization and analysis. Mol Ecol
19:3576–3591. doi:10.1111/j.1365-294X.2010.04657.x
Spielman D, Brook BW, Frankham R, Schaal BA (2004) Most
species are not driven to extinction before genetic factors impact
them. Proc Natl Acad Sci USA 101:15261–15264
SPSS Inc (2008) SPSS statistics for Windows version 17.0, SPSS Inc,
Chicago
Sunnucks P (2000) Efficient genetic markers for population biology.
Trends Ecol Evol 15:199–203. doi:10.1016/S0169-5347(00)01825-5
Tamura K, Peterson D, Peterson N, Stecher G, Nei M, Kumar S
(2011) MEGA5: molecular evolutionary genetics analysis using
maximum likelihood, evolutionary distance, and maximum
parsimony methods. Mol Biol Evol 28:2731–2739. doi:10.
1093/molbev/msr121
Taylor AC, Walker FM, Goldingay RL, Ball T, van der Ree R (2011)
Degree of landscape fragmentation influences genetic isolation
among populations of a gliding mammal. PLoS One 6:e26651.
doi:10.1371/journal.pone.0026651
Temple HJ, Hoffman JI, Amos W (2006) Dispersal, philopatry and
intergroup relatedness: fine-scale genetic structure in the white-
breasted thrasher, Ramphocinclus brachyurus. Mol Ecol
15:3449–3458. doi:10.1111/j.1365-294X.2006.03006.x
Templeton AR, Crandall KA, Sing CF (1992) A cladistic analysis of
phenotypic associations with haplotypes inferred from restriction
endonuclease mapping and DNA sequence data. III. Cladogram
estimation. Genetics 132:619–633
Thompson JD, Higgins DG, Gibson TJ (1994) CLUSTAL W:
improving the sensitivity of progressive multiple sequence
alignment through sequence weighting, position-specific gap
penalties and weight matrix choice. Nucleic Acids Res
22:4673–4680. doi:10.1093/nar/22.22.4673
Van Dyck S, Strahan R (2008) Mammals of Australia. New Holland
Publishing, Chatswood
Weeks AR, Sgro CM, Young AG, Frankham R, Mitchell NJ, Miller
KA, Byrne M, Coates DJ, Eldridge MDB, Sunnucks P, Breed
MF, James EA, Hoffmann AA (2011) Assessing the benefits and
risks of translocations in changing environments: a genetic
perspective. Evol Appl 4:709–725. doi:10.1111/j.1752-4571.
2011.00192.x
Whitlock MC, McCauley DE (1999) Indirect measures of gene flow
and migration: FST = 1/(4Nm ? 1). Heredity 82:117–125.
doi:10.1038/sj.hdy.6884960
Willi Y, van Buskirk J, Hoffmann AA (2006) Limits to the adaptive
potential of small populations. Annu Rev Ecol Evol Syst
37:433–458. doi:10.2307/annurev.ecolsys.37.091305.30
Wright S (1951) The genetical structure of populations. Ann Eugen
15:323–354. doi:10.1111/j.1469-1809.1949.tb02451.x
560 Conserv Genet (2014) 15:547–560
123
Related Documents