This article was downloaded by: [Dr Manjit S. Kang] On: 09 August 2015, At: 03:44 Publisher: Taylor & Francis Informa Ltd Registered in England and Wales Registered Number: 1072954 Registered office: 5 Howick Place, London, SW1P 1WG Journal of Crop Improvement Publication details, including instructions for authors and subscription information: http://www.tandfonline.com/loi/wcim20 Molecular Clustering and Interrelationships among Agronomic Traits of Jordanian Barley Cultivars Muhanad W. Akash a & Manjit S. Kang b a The University of Jordan, Faculty of Agriculture, Department of Horticulture and Crop Science , Amman, Jordan b Punjab Agricultural University , Ludhiana, India Published online: 04 Dec 2009. To cite this article: Muhanad W. Akash & Manjit S. Kang (2009) Molecular Clustering and Interrelationships among Agronomic Traits of Jordanian Barley Cultivars, Journal of Crop Improvement, 24:1, 28-40, DOI: 10.1080/15427520903307205 To link to this article: http://dx.doi.org/10.1080/15427520903307205 PLEASE SCROLL DOWN FOR ARTICLE Taylor & Francis makes every effort to ensure the accuracy of all the information (the “Content”) contained in the publications on our platform. However, Taylor & Francis, our agents, and our licensors make no representations or warranties whatsoever as to the accuracy, completeness, or suitability for any purpose of the Content. Any opinions and views expressed in this publication are the opinions and views of the authors, and are not the views of or endorsed by Taylor & Francis. The accuracy of the Content should not be relied upon and should be independently verified with primary sources of information. Taylor and Francis shall not be liable for any losses, actions, claims, proceedings, demands, costs, expenses, damages, and other liabilities whatsoever or howsoever caused arising directly or indirectly in connection with, in relation to or arising out of the use of the Content. This article may be used for research, teaching, and private study purposes. Any substantial or systematic reproduction, redistribution, reselling, loan, sub-licensing, systematic supply, or distribution in any form to anyone is expressly forbidden. Terms & Conditions of access and use can be found at http://www.tandfonline.com/page/terms- and-conditions

Welcome message from author
This document is posted to help you gain knowledge. Please leave a comment to let me know what you think about it! Share it to your friends and learn new things together.
Transcript

This article was downloaded by: [Dr Manjit S. Kang]On: 09 August 2015, At: 03:44Publisher: Taylor & FrancisInforma Ltd Registered in England and Wales Registered Number: 1072954 Registeredoffice: 5 Howick Place, London, SW1P 1WG
Journal of Crop ImprovementPublication details, including instructions for authors andsubscription information:http://www.tandfonline.com/loi/wcim20
Molecular Clustering andInterrelationships among AgronomicTraits of Jordanian Barley CultivarsMuhanad W. Akash a & Manjit S. Kang ba The University of Jordan, Faculty of Agriculture, Department ofHorticulture and Crop Science , Amman, Jordanb Punjab Agricultural University , Ludhiana, IndiaPublished online: 04 Dec 2009.
To cite this article: Muhanad W. Akash & Manjit S. Kang (2009) Molecular Clustering andInterrelationships among Agronomic Traits of Jordanian Barley Cultivars, Journal of CropImprovement, 24:1, 28-40, DOI: 10.1080/15427520903307205
To link to this article: http://dx.doi.org/10.1080/15427520903307205
PLEASE SCROLL DOWN FOR ARTICLE
Taylor & Francis makes every effort to ensure the accuracy of all the information (the“Content”) contained in the publications on our platform. However, Taylor & Francis,our agents, and our licensors make no representations or warranties whatsoever as tothe accuracy, completeness, or suitability for any purpose of the Content. Any opinionsand views expressed in this publication are the opinions and views of the authors,and are not the views of or endorsed by Taylor & Francis. The accuracy of the Contentshould not be relied upon and should be independently verified with primary sourcesof information. Taylor and Francis shall not be liable for any losses, actions, claims,proceedings, demands, costs, expenses, damages, and other liabilities whatsoever orhowsoever caused arising directly or indirectly in connection with, in relation to or arisingout of the use of the Content.
This article may be used for research, teaching, and private study purposes. Anysubstantial or systematic reproduction, redistribution, reselling, loan, sub-licensing,systematic supply, or distribution in any form to anyone is expressly forbidden. Terms &Conditions of access and use can be found at http://www.tandfonline.com/page/terms-and-conditions

28
Journal of Crop Improvement, 24:28–40, 2010Copyright © Taylor & Francis Group, LLC ISSN: 1542-7528 print/1542-7535 onlineDOI: 10.1080/15427520903307205
WCIM1542-75281542-7535Journal of Crop Improvement, Vol. 24, No. 1, October 2009: pp. 0–0Journal of Crop Improvement
Molecular Clustering and Interrelationships among Agronomic Traits of Jordanian
Barley Cultivars
Molecular Clustering in Jordanian BarleyM. W. Akash and M. S. Kang
MUHANAD W. AKASH1 and MANJIT S. KANG2
1The University of Jordan, Faculty of Agriculture, Department of Horticulture and Crop Science, Amman, Jordan
2Punjab Agricultural University, Ludhiana, India
To make barley breeding programs more effective, comprehensiveinformation on the amount of molecular diversity in barley culti-vars and on interrelationships among agronomic traits is needed.Path-coefficient and principal-component analyses were used tostudy the interrelationships among barley grain yield and variousgrain yield components. Eleven amplified fragment-length polymor-phism (AFLP) primer combinations were used to cluster barley culti-vars into distinct groups. Path analysis across cultivars showed thatnumber of fertile tillers per plant had the largest positive direct effect(0.94) on grain yield, followed by biological yield (0.491), and spikeweight (0.357). However, number of tillers per plant (-0.917) andspike length (-0.263) showed negative direct effects. Principal com-ponent analysis using GGEbiplot showed that ‘Rum’ cultivar had thehighest values for biological yield, spike weight, plant height atmaturity, leaf width, peduncle length, and days to heading. It alsohad the highest grain yield, followed by Acsad-176; the other threecultivars yielded below average. This cultivar separation was con-firmed by cluster analysis. Such molecular and morphological dif-ferentiation should be of great help for barley breeding programs.
KEYWORDS AFLP-based clustering, GGEbiplot analysis, pathcoefficients, principal component
The authors acknowledge the financial support of the Deanship of Academic Researchat The University of Jordan, grant number 1017.
Address correspondence to Muhanad W. Akash, The University of Jordan, Faculty ofAgriculture, Department of Horticulture and Crop Science, Amman 11942, Jordan. E-mail:[email protected]
Dow
nloa
ded
by [
Dr
Man
jit S
. Kan
g] a
t 03:
44 0
9 A
ugus
t 201
5
Molecular Clustering in Jordanian Barley 29
INTRODUCTION
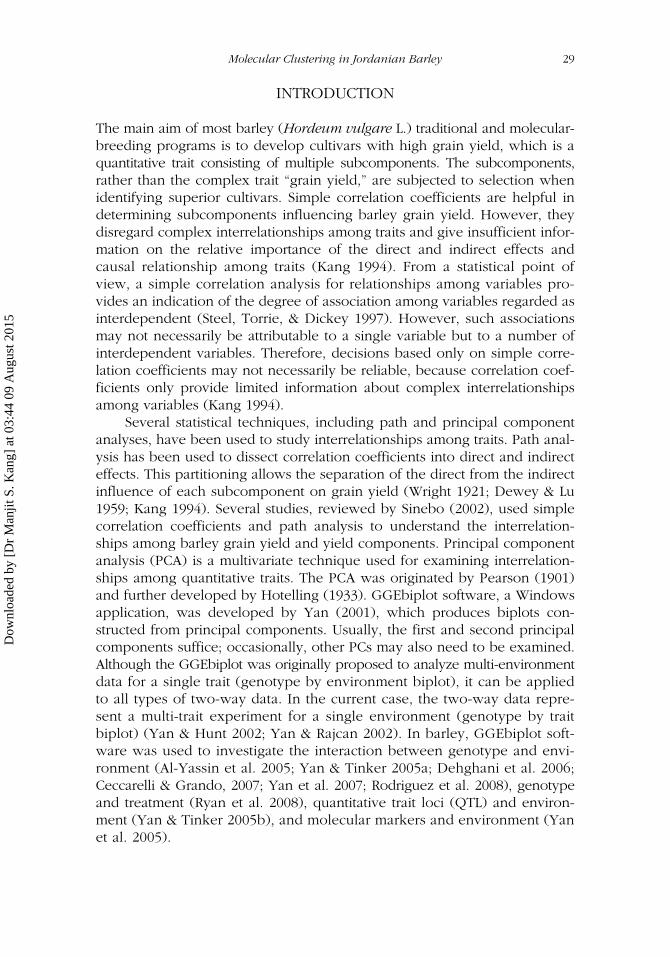
The main aim of most barley (Hordeum vulgare L.) traditional and molecular-breeding programs is to develop cultivars with high grain yield, which is aquantitative trait consisting of multiple subcomponents. The subcomponents,rather than the complex trait “grain yield,” are subjected to selection whenidentifying superior cultivars. Simple correlation coefficients are helpful indetermining subcomponents influencing barley grain yield. However, theydisregard complex interrelationships among traits and give insufficient infor-mation on the relative importance of the direct and indirect effects andcausal relationship among traits (Kang 1994). From a statistical point ofview, a simple correlation analysis for relationships among variables pro-vides an indication of the degree of association among variables regarded asinterdependent (Steel, Torrie, & Dickey 1997). However, such associationsmay not necessarily be attributable to a single variable but to a number ofinterdependent variables. Therefore, decisions based only on simple corre-lation coefficients may not necessarily be reliable, because correlation coef-ficients only provide limited information about complex interrelationshipsamong variables (Kang 1994).
Several statistical techniques, including path and principal componentanalyses, have been used to study interrelationships among traits. Path anal-ysis has been used to dissect correlation coefficients into direct and indirecteffects. This partitioning allows the separation of the direct from the indirectinfluence of each subcomponent on grain yield (Wright 1921; Dewey & Lu1959; Kang 1994). Several studies, reviewed by Sinebo (2002), used simplecorrelation coefficients and path analysis to understand the interrelation-ships among barley grain yield and yield components. Principal componentanalysis (PCA) is a multivariate technique used for examining interrelation-ships among quantitative traits. The PCA was originated by Pearson (1901)and further developed by Hotelling (1933). GGEbiplot software, a Windowsapplication, was developed by Yan (2001), which produces biplots con-structed from principal components. Usually, the first and second principalcomponents suffice; occasionally, other PCs may also need to be examined.Although the GGEbiplot was originally proposed to analyze multi-environmentdata for a single trait (genotype by environment biplot), it can be appliedto all types of two-way data. In the current case, the two-way data repre-sent a multi-trait experiment for a single environment (genotype by traitbiplot) (Yan & Hunt 2002; Yan & Rajcan 2002). In barley, GGEbiplot soft-ware was used to investigate the interaction between genotype and envi-ronment (Al-Yassin et al. 2005; Yan & Tinker 2005a; Dehghani et al. 2006;Ceccarelli & Grando, 2007; Yan et al. 2007; Rodriguez et al. 2008), genotypeand treatment (Ryan et al. 2008), quantitative trait loci (QTL) and environ-ment (Yan & Tinker 2005b), and molecular markers and environment (Yanet al. 2005).
Dow
nloa
ded
by [
Dr
Man
jit S
. Kan
g] a
t 03:
44 0
9 A
ugus
t 201
5

30 M. W. Akash and M. S. Kang
To improve effectiveness of barley-breeding programs, comprehensiveinformation on the amount of molecular diversity in barley cultivars is needed.Cluster analysis using amplified fragment-length polymorphism (AFLP) canbe used to classify cultivars into main groups and subgroups based on bandsimilarity and dissimilarity. Varshney and colleagues (2007) used AFLP markersto study genetic diversity in barley. Because the potential and usefulness ofpath coefficient analysis, GGEbiplot and AFLP-based cluster analyses havenot been demonstrated for Jordanian barley cultivars, the objective of thisinvestigation was to determine, via path coefficient and principal componentanalyses, the interrelationships and the influential patterns involving grainyield and its subcomponents under arid and semi-arid Mediterranean conditions.In addition, our research was aimed at examining cultivars in reference totheir molecular performance using AFLP-based cluster analysis.
MATERIALS AND METHODS
Data
Detailed information on barley cultivars, environmental conditions, and meth-odology used for field experiments is given elsewhere (Akash et al. 2009). Inbrief, five barley cultivars (Acsad-176, Athroh, Mutah, Rum, and Yarmouk) wereevaluated under field conditions at four locations. At each location, a ran-domized complete-block design with three replications was used. Data wererecorded from each plot on the following traits: leaf length (LL), leaf width(LW), number of fertile tillers per plant (FTN), number of tillers per plant(TN), plant height at maturity (PH), spike width (SW), spike length (SL),spike weight (SWt), length of awns (AL), awn softness (AS), pedunclelength (PL), days to heading (HT), days to maturity (MT), biological yield(BY), grain yield (GY), harvest index (HI), thousand grain weight (TGWt),and number of nodes per plant (NN).
Path Analysis
Mean values of traits for each cultivar were subjected to Pearson’s correla-tion analysis. These correlations were, in turn, subjected to path coeffi-cient analysis. Only traits that had a significant correlation with grain yieldwere used in the path analysis. Grain yield was the response variable andthe other traits were treated as independent variables. The CORR procedureof SAS software (SAS Institute, 2002) was used to perform Pearson’s corre-lation analysis. Path-coefficient analysis was completed using IML versionof a program described by Kang (1994). For a path-coefficient analysis, acause-and-effect relation was assumed and a path diagram was constructed(Figure 1).
Dow
nloa
ded
by [
Dr
Man
jit S
. Kan
g] a
t 03:
44 0
9 A
ugus
t 201
5

Molecular Clustering in Jordanian Barley 31
Principal Component Analysis
Biplots constructed from the first and second principal components wereused to investigate the interrelationship among all studied traits. In thesebiplots, the cosine of the angle between the vectors of any two traits approxi-mates the correlation coefficient between them (Yan & Kang 2003). Thetraits less closely associated with grain yield, which explained less than 66%of the grain yield variation, were removed from the biplot analysis.
Biplots were also used to investigate genotype by trait interaction. Thisinvestigation allowed us to determine which cultivar had the highest or lowestvalues for various traits, cultivar ranking based on grain yield, and cultivarcomparison for all traits. The biplot analysis was performed using the GGE-biplot software (Yan 2001; Yan & Kang 2003).
Cluster Analysis Based on AFLP Markers
DNA was extracted from fresh young leaves harvested as a bulk samplefrom five plants of each cultivar according to Rogowsky and colleagues
FIGURE 1 Path diagram showing causal relationships of five predictor variables [number oftillers per plant (TN), number of fertile tillers per plant (FTN), spike length (SL), spike weight(SWt), and biological yield (BY)] with a response variable (grain yield) in barley cultivars.Single directional arrows (→) represent direct paths (P) and two directional arrows (↔)represent Pearson correlation coefficients (r).
Dow
nloa
ded
by [
Dr
Man
jit S
. Kan
g] a
t 03:
44 0
9 A
ugus
t 201
5

32 M. W. Akash and M. S. Kang
(1991) with minor modifications. Spectrophotometry was used to determinequantity and quality via the A260/A280 ratio of absorbance. After digestionwith EcoRI (E) and MseI (M) endonucleases, the digested DNA samples wereligated using E-adapter (CTCGTAGACTGCGTACC and AATTGGTACG-CAGTCTAC) and M-adapter (GACGATGAGTCCTGAG and TACTCAGGACT-CAT). Pre-amplification step was performed using E-primer (GACTGCGTACCAATTCA) and M-primer (GATGAGTCCTGAGTAAC). Eleven primer com-binations (E-ACA + M-CAA, E-AAG + M-CTG, E-ACT + M-CAT, E-ACA + M-CAC,E-AAC + M-CTG, E-ACT + M-CAC, E-AAG + M-CAC, E-AAC + M-CAT, E-ACT+ M-CAA, E-AAC + M-CTA, E-ACA + M-CAT) were used to generate AFLPdata. All four steps of AFLP analysis were performed using modified proce-dures of Vos and colleagues (1995). Amplified fragments were separated ona 6% denaturing polyacrylamide gel and were then detected using silverstaining method.
Only polymorphic bands were used to construct a binary matrix thatshowed (1) for present bands, (0) for absent bands, and (.) for missing bands.The matrix data were analyzed to generate Jaccard’s genetic similarity (GS) coef-ficients (Jaccard, 1908). GSij = a/(a + b + c), where GSij is the measurement of thegenetic similarity between cultivars i and j; ‘a’ is the number of polymorphicbands present in both cultivars; ‘b’ is the number of bands present in i andabsent in j; and ‘c’ is the number of bands present in j and absent in i culti-var. These similarity coefficients were used to draw dendrograms using theunweighted pair group method with arithmetic average (UPGMA), according toSneath and Sokal (1973). DISTANCE and CLUSTER procedures of SAS (SAS Insti-tute, 2002) were used to perform similarity and cluster analyses, respectively.
RESULTS AND DISCUSSION
The associations among variables were studied using phenotypic correlationcoefficients (Table 1) and biplot analyses (Figure 2). In bilpot analysis, aspointed out earlier, the cosine of the angle between vectors of any two traitsapproximates the correlation coefficient between those traits (Figure 2A).Results of both analyses revealed that barley GY was positively correlatedwith BY (r = 0.97) and SWt (r = 0.94), but negatively correlated with TN(r = −0.88), FTN (r = −0.98), and SL (r = −0.98) (Table 1; Figure 2B). Traitsthat were not closely associated with GY were removed, and those that werekept in the analysis explained 66% of the GY variation. These five traits weremoved to the next step of path analysis.
Path Analysis
This analysis partitioned correlation coefficients into direct and indirecteffects that furnished further information on the interrelationships among
Dow
nloa
ded
by [
Dr
Man
jit S
. Kan
g] a
t 03:
44 0
9 A
ugus
t 201
5

33
TA
BLE
1Pea
rson C
orr
elat
ion C
oef
fici
ents
(r)
for 18
Var
iable
s [L
eaf Le
ngt
h (
LL), L
eaf W
idth
(LW
), N
um
ber
Of Fe
rtile
Till
ers
Per
Pla
nt (F
TN
), N
um
ber
Of Till
ers
Per
Pla
nt (T
N), M
aturity
Pla
nt H
eigh
t (P
H), S
pik
e W
idth
(SW
), S
pik
e Le
ngt
h (
SL), S
pik
e W
eigh
t (S
Wt), Le
ngt
h o
f A
wns
(AL)
, A
wn S
oftnes
s(A
S), Ped
uncl
e Le
ngt
h (
PL)
, D
ays
to H
eadin
g (H
T), D
ays
to M
aturity
(M
T), B
iolo
gica
l Y
ield
(B
Y), G
rain
Yie
ld (
GY
), H
arve
st I
ndex
(H
I), Thousa
nd
Gra
in W
eigh
t (T
GW
t), an
d N
um
ber
Of N
odes
Per
Pla
nt (N
N)] in B
arle
y
GY
PH
TN
FTN
NN
LLLW
AL
AS
SLSW
PL
BY
SWt
TG
Wt
HT
MT
PH
0.58
TN
−0.8
8*−0
.85
FTN
−0.9
3*−0
.76
0.99
*N
N0.
770.
83−0
.95*
−0.9
2*LL
−0.1
40.
350.
040.
130.
15LW
0.59
0.50
−0.5
5−0
.56
0.72
0.59
AL
−0.1
20.
28−0
.27
−0.1
90.
22−0
.47
−0.4
7A
S−0
.41
0.15
0.31
0.40
−0.4
30.
32−0
.45
0.04
SL−0
.98*
*−0
.68
0.92
*0.
96**
−0.8
80.
01−0
.70
0.08
0.44
SW0.
080.
49−0
.10
−0.0
20.
000.
610.
13−0
.29
0.80
−0.0
8PL
0.67
0.94
−0.8
3−0
.77
0.87
0.52
0.76
−0.0
2−0
.02
−0.7
80.
48B
Y0.
97**
0.59
−0.8
1−0
.87
0.65
−0.1
50.
45−0
.14
−0.1
8−0
.92*
0.27
0.64
SWt
0. 9
4*0.
40−0
.71
−0.7
90.
660.
010.
74−0
.42
−0.5
1−0
.92*
0.05
0.60
0.88
*TG
Wt
−0.0
80.
220.
110.
16−0
.31
0.19
−0.3
5−0
.09
0.93
*0.
160.
870.
090.
17−0
.19
HT
0.31
−0.1
50.
03−0
.06
0.08
0.45
0.71
−0.9
3*−0
.36
−0.3
20.
090.
200.
250.
62−0
.21
MT
0.51
0.43
−0.7
3−0
.72
0.74
−0.4
50.
210.
65−0
.63
−0.5
7−0
.55
0.34
0.35
0.32
−0.5
8−0
.35
HI
0.04
−0.0
9−0
.17
−0.1
90.
39−0
.12
0.35
0.22
−0.8
6−0
.15
−0.8
20.
04−0
.21
0.11
−0.9
8**
0.09
0.65
*, *
*Sig
nific
ant at
0.0
5 an
d 0
.01
pro
bab
ility
lev
el, re
spec
tivel
y.
Dow
nloa
ded
by [
Dr
Man
jit S
. Kan
g] a
t 03:
44 0
9 A
ugus
t 201
5

34 M. W. Akash and M. S. Kang
FIGURE 2 Vector view of genotype by trait biplot showing (A) the interrelationships amongtraits (the cosine of the angle between victors of two traits approximates the correlation coef-ficients between traits), and (B) the interrelationships among traits that are more closely asso-ciated with grain yield of barley cultivars. Traits are leaf length (LL), leaf width (LW), numberof fertile tillers per plant (FTN), number of tillers per plant (TN), maturity plant height (PH),spike width (SW), spike length (SL), spike weight (SWt), length of awns (AL), awn softness(AS), peduncle length (PL), days to heading (HT), days to maturity (MT), biological yield(BY), grain yield (GY), harvest index (HI), thousand grain weight (TGWt), and number ofnodes per plant (NN).
Dow
nloa
ded
by [
Dr
Man
jit S
. Kan
g] a
t 03:
44 0
9 A
ugus
t 201
5

Molecular Clustering in Jordanian Barley 35
variables and their effects on barley GY. In other words, the analysisrevealed whether the association of GY with other variables was attributableto the direct effects of variable traits on GY or was a consequence of its indirecteffects via some other traits. The residual effect, R(X), shown in Figure 1,was composed of effects other than those included in the model.
Results of the path analysis across cultivars showed that FTN had thelargest positive direct effect (0.94) on GY, followed by BY (0.491) and SWt(0.357). However, negative direct effects were noted for TN (−0.917) and SL(−0.263) (Table 2). The magnitudes of TN and FTN direct effects were similarto the magnitudes of correlations between them and GY, indicating that thecorrelations explained the true relationship as the indirect effects for bothtraits counter-balanced one another. For example, the FTN indirect effect(0.927) counter-balanced the indirect effect of SL (−0.243), BY (−0.399), andSWT (−0.252). These results suggested that GY was heavily dependent uponTN and FTN as both TN and FTN affect spread of the canopy above theground and hence provide the necessary ground cover against moisture lossfrom the soil. Also, increased photosynthetic area from the increased TN mayhave contributed to increased grain yield. Spike weight and SL had relativelysmall direct effects on GY. Spike weight had a large positive indirect effect onGY via TN. However, it had a negative indirect effect via FTN. Similarly, SLhad a large positive indirect effect via FTN. However, it had a negative indirecteffect via TN. The negative association between SL and TN indicted that as TNincreased, SL decreased. Results suggested that genetic improvement forhigher grain yield should minimize such adverse relationships among grainyield components to enable us to maximize the contribution of componentsthat showed strong positive relationship with grain yield (e.g., TN and FTN.)
Principal Component Analysis
Figure 3A revealed that GY, BY, SWt, PH, LW, PL, and HT fell in the ‘Rum’sector, suggesting that cultivar Rum had the highest values for these traits.
TABLE 2 Path Coefficient Analyses Showing Direct (diagonal) and Indirect Effects of YieldComponents [Number of Tillers Per Plant (TN), Number of Fertile Tillers Per Plant (FTN),Spike Length (SL), Spike Weight (SWt), and Biological Yield (BY)] on Grain Yield of FiveBarley Cultivars
Indirect effects via
Variable Direct effect TN FTN SL BY SWt Total correlation
TN −0.917 0.927 −0.243 −0.399 −0.252 −0.881FTN 0.940 −0.904 −0.253 −0.427 −0.283 −0.932SL −0.263 −0.848 0.905 −0.449 −0.329 −0.979BY 0.491 0.744 −0.817 0.241 0.313 0.966SWt 0.357 0.647 −0.745 0.243 0.431 0.940
Dow
nloa
ded
by [
Dr
Man
jit S
. Kan
g] a
t 03:
44 0
9 A
ugus
t 201
5
36 M. W. Akash and M. S. Kang
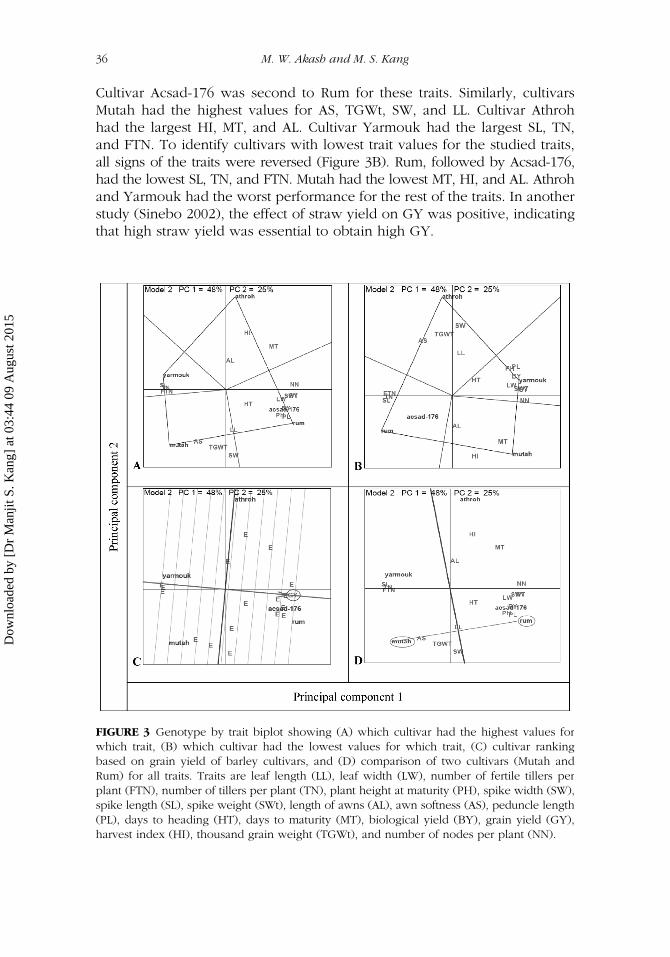
Cultivar Acsad-176 was second to Rum for these traits. Similarly, cultivarsMutah had the highest values for AS, TGWt, SW, and LL. Cultivar Athrohhad the largest HI, MT, and AL. Cultivar Yarmouk had the largest SL, TN,and FTN. To identify cultivars with lowest trait values for the studied traits,all signs of the traits were reversed (Figure 3B). Rum, followed by Acsad-176,had the lowest SL, TN, and FTN. Mutah had the lowest MT, HI, and AL. Athrohand Yarmouk had the worst performance for the rest of the traits. In anotherstudy (Sinebo 2002), the effect of straw yield on GY was positive, indicatingthat high straw yield was essential to obtain high GY.
FIGURE 3 Genotype by trait biplot showing (A) which cultivar had the highest values forwhich trait, (B) which cultivar had the lowest values for which trait, (C) cultivar rankingbased on grain yield of barley cultivars, and (D) comparison of two cultivars (Mutah andRum) for all traits. Traits are leaf length (LL), leaf width (LW), number of fertile tillers perplant (FTN), number of tillers per plant (TN), plant height at maturity (PH), spike width (SW),spike length (SL), spike weight (SWt), length of awns (AL), awn softness (AS), peduncle length(PL), days to heading (HT), days to maturity (MT), biological yield (BY), grain yield (GY),harvest index (HI), thousand grain weight (TGWt), and number of nodes per plant (NN).
Dow
nloa
ded
by [
Dr
Man
jit S
. Kan
g] a
t 03:
44 0
9 A
ugus
t 201
5

Molecular Clustering in Jordanian Barley 37
In Figure 3C, two lines were drawn, one passing through the biplot ori-gin and grain yield and another line perpendicular to this line, which alsopassed through the biplot origin. Rum, followed by Acsad-176, had thehighest grain yield; whereas cultivars below the perpendicular line yieldedbelow average, with Yarmouk being the lowest in grain yield. In earlier studies,tall plants with relatively large biomass and HI were found to be associatedwith high yield under low-rainfall environments in Jordan (Shakhatreh et al.2001; Dinssa 2003).
Rum and Mutah cultivars were compared in Figure 3D by drawing aline to connect the two cultivars and drawing a perpendicular to the con-nector line that passed through the bilpot origin. Figure 3D indicated thatsix traits (AS, TGWt, SW, SL, TN, and FTN) were on the same side of theperpendicular line as Mutah cultivar. This clearly showed that Mutah per-formed better than Rum with respect to these six traits but had lower perfor-mance for the rest of the traits. Results from principal component analysissuggested that breeders might use Rum as recurrent parent and Mutah asdonor parents to introgress the drought-adapted traits of Mutah into highergrain yield of Rum.
Cluster Analysis Based on AFLP Markers
Using 11 primer combinations, a genotype × locus (bands) matrix was producedthat consisted of 450 observations. There were 27 missing cases because offailure in amplification. The 11 AFLP primer combinations detected three(E-ACA + M-CAA, E-ACA + M-CAT) to 12 (E-ACT + M-CAC, E-AAC + M-CAT)polymorphic bands, with an average of eight polymorphic bands per primercombination for the examined cultivars (Table 1). The polymorphism ratefound for different primer combinations ranged from 4% (E-ACA + M-CAT)to 16% (E-ACT + M-CAC). Similar numbers of polymorphic bands per AFLPprimer combination were obtained by Teulat, Borries, and This (2001) inbarley and Soleimani, Baum, and Johnson (2002) in wheat. However, amuch higher percentage of polymorphic bands (27 polymorphic bands perprimer combination) was obtained when discriminating a large number ofwild barley (Varshney et al. 2007).
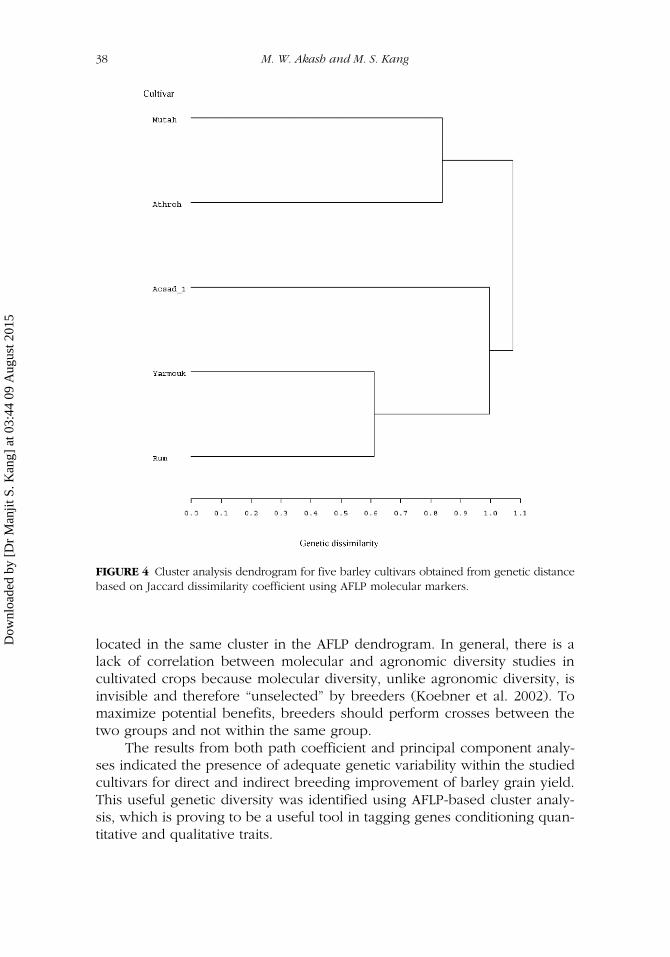
The range between genetic dissimilarity coefficients varied from 0.61 to0.84. Cultivars were clustered as shown in Figure 4. Mutah and Athroh,which yielded below average, were grouped together, and the rest of thecultivars, which yielded above average, comprised almost a uniform group.This two-group phylogenetic tree was able to discriminate, under arid andsemi-arid Mediterranean environment, between high-yielding cultivars andlow-yielding ones. This high association between yield performance underMediterranean environment and DNA-based clustering was also achievedby Moghaddam and colleagues (2005); five of the six drought-susceptiblegenotypes clustered together in the agronomic dendrogram and were
Dow
nloa
ded
by [
Dr
Man
jit S
. Kan
g] a
t 03:
44 0
9 A
ugus
t 201
5
38 M. W. Akash and M. S. Kang
located in the same cluster in the AFLP dendrogram. In general, there is alack of correlation between molecular and agronomic diversity studies incultivated crops because molecular diversity, unlike agronomic diversity, isinvisible and therefore “unselected” by breeders (Koebner et al. 2002). Tomaximize potential benefits, breeders should perform crosses between thetwo groups and not within the same group.
The results from both path coefficient and principal component analy-ses indicated the presence of adequate genetic variability within the studiedcultivars for direct and indirect breeding improvement of barley grain yield.This useful genetic diversity was identified using AFLP-based cluster analy-sis, which is proving to be a useful tool in tagging genes conditioning quan-titative and qualitative traits.
FIGURE 4 Cluster analysis dendrogram for five barley cultivars obtained from genetic distancebased on Jaccard dissimilarity coefficient using AFLP molecular markers.
Dow
nloa
ded
by [
Dr
Man
jit S
. Kan
g] a
t 03:
44 0
9 A
ugus
t 201
5

Molecular Clustering in Jordanian Barley 39
REFERENCES
Akash, M., A. Al-Abdallat, H. Saoub, and J. Ayad. 2009. Molecular and field compar-ison of selected barley cultivars for drought tolerance. J. New Seeds 10: 98–111.
Al-Yassin, A., S. Grando, O. Kafawin, A. Tell and S. Ceccarelli. 2005. Heritabilityestimates in contrasting environments as influenced by the adaptation level ofbarley germplasm. Ann. Appl. Biol. 147:235–244.
Ceccarelli, S., and S. Grando. 2007. Decentralized-participatory plant breeding: anexample of demand driven research. Euphytica 155:349–360.
Dehghani H., A. Ebadi, A. Yousefi. 2006. Biplot analysis of genotype by environ-ment interaction for barley yield in Iran. Agron. J. 98:388–393.
Dewey, D.R., and K H. Lu. 1959. A correlation and path coefficient analysis of com-ponents of crested wheat grass production. Agron. J. 51:515–518.
Dinssa, F.F. 2003. Molecular genetic variation, yield and yield components of barley(Hordeum vulgare L.) in decentralized-participatory breeding in low moistureenvironments. PhD diss., The University of Jordan, Amman, Jordan.
Hotelling, H. 1933. Analysis of a complex of statistical variables into principal com-ponents. J. Edu. Psychol. 24:417–441.
Jaccard, P. 1908: Nouvelles recherches sur la distribution florale. Bull. Soc. VaudSci. Nat. 44:223–270.
Kang, M.S. 1994. Applied quantitative genetics. Baton Rouge, LA: Kang Publ.Koebner, R.M.D., P. Donini, J. Reeves, R.J. Cooke, and J.R. Law. 2002. Temporal
flux in the morphological and molecular diversity of UK barley. Theor. Appl.Genet. 106:550–558.
Moghaddam, A.E., R.M. Trethowan, H.M. William, A. Rezai, A. Arzani and A.F. Mirlohi.2005. Assessment of genetic diversity in bread wheat genotypes for toleranceto drought using AFLPs and agronomic traits. Euphytica 141:147–56.
Pearson, K. 1901. On lines and planes of closest fit to systems of points in space.Philosophical Magazine 6:559–572.
Rodriguez M., D. Rau, R. Papa, and G. Attene. 2008. Genotype by environment interac-tions in barley (Hordeum vulgare L.): different responses of landraces, recombinantinbred lines and varieties to Mediterranean environment. Euphytica 163:231–247.
Rogowsky, P.M., F.L.Y. Guidet, P. Langridge, K.W. Shepherd, and R.M.D. Koebner.1991. Isolation and characterization of wheat-rye recombinants involving chro-mosome arm 1DS of wheat. Theor. Appl. Genet. 82:537–544.
Ryan, J., S. Masri, S. Ceccarelli, S. Grando, and H. Ibrikci. 2008. Differential responses ofbarley landraces and improved barley cultivars to nitrogen-phosphorus fertilizer.J. Plant Nutr. 31:381–393.
SAS Inc. 2002. SAS/Stat software. Release 9.0. Cary, NC: SAS Institute.Shakhatreh, Y., O. Kafawin, S. Ceccarelli, and H. Saoub. 2001. Selection of barley
lines for drought tolerance in low-rainfall areas. J. Agron. Crop Sci. 186:119–127. Sinebo, W. 2002. Yield relationships of barleys grown in a tropical highland envi-
ronment. Crop Sci. 42: 428–437.Sneath, P.H.A., and R.R. Sokal. 1973. Numerical taxonomy. San Francisco, CA: Freeman.Soleimani, V.D., B.R. Baum, and D.A. Johnson. 2002. AFLP and pedigree-based
genetic diversity estimates in modern cultivars of durum wheat [Triticum turgi-dum L. subsp. durum (Desf.) Husn.]. Theor. Appl. Genet. 104:350–357.
Dow
nloa
ded
by [
Dr
Man
jit S
. Kan
g] a
t 03:
44 0
9 A
ugus
t 201
5

40 M. W. Akash and M. S. Kang
Steel, R.G.D., J.H. Torrie and D.A. Dickey. 1997. Principles and procedures of statistics,a biometrical approach, 3rd ed. New York: McGraw-Hill.
Teulat, B., C. Borries, and D. This. 2001a. New QTLs identified for plant water-status,water-soluble carbohydrate and osmotic adjustment in a barley populationgrown in a growth-chamber under two water regimes. Theor. Appl. Genet.103:161–170.
Varshney, R.K., K. Chabane, P.S. Hendre, R.K. Aggarwal, and A. Graner. 2007. Com-parative assessment of EST-SSR, EST-SNP and AFLP markers for evaluation ofgenetic diversity and conservation of genetic resources using wild, cultivatedand elite barleys. Plant Sci. 173:638–649.
Vos, P., R. Hogers, M. Bleeker, M. Reijans, T. Van de Lee, M. Hornes, A. Fritjters,J. Pot, J. Peleman, M. Kuiper, and M. Zabeau. 1995. AFLP: A new technique forDNA fingerprinting. Nucleic Acids Res. 23:4407–4414.
Wright, S. 1921. Correlation and causation. J. Agric. Res. 20:557–585.Yan,W. 2001. GGEbiplot: A windows application for graphical analysis of multi-
environment trial data and other types of two-way data. Agron. J. 93:1111–1118.Yan, W., and L.A. Hunt. 2002. Biplot analysis of diallel data. Crop Sci. 42:21–30.Yan,W., and M.S. Kang. 2003. GGE biplot analysis: Agraphical tool for breeders,
geneticists, and agronomists. Boca Raton, FL: CRC Press.Yan, W., M.S. Kang, B. Ma, S. Woods, P.L. Cornelius. 2007. GGE biplots vs. AMMI
analysis of genotype-by-environment data. Crop Sci. 47:643–655.Yan, W., and I. Rajcan. 2002. Biplot evaluation of test sites and trait relations of soy-
bean in Ontario. Crop Sci. 42:11–20.Yan, W., and N.A. Tinker. 2005a. An integrated system of biplot analysis for dis-
playing, interpreting, and exploring genotype-by-environment interactions.Crop Sci. 45:1004–1016.
Yan, W., and N.A. Tinker. 2005b. A biplot approach for investigating QTL-by-environment patterns. Mol. Breed. 15:31–43.
Yan, W., N.A. Tinker, and D.E. Falk. 2005. QTL identification, mega-environmentclassification, and strategy development for marker-based selection using biplots.J. Crop Improve. 14:299–324.
Dow
nloa
ded
by [
Dr
Man
jit S
. Kan
g] a
t 03:
44 0
9 A
ugus
t 201
5
Related Documents