MOLECULAR AND MORPHOMETRIC DATA PINPOINT SPECIES BOUNDARIES IN HALIMEDA SECTION RHIPSALIS (BRYOPSIDALES, CHLOROPHYTA) 1 Heroen Verbruggen, 2 Olivier De Clerck Phycology Research Group and Center for Molecular Phylogenetics and Evolution, Ghent University, Krijgslaan 281 (S8), B-9000 Gent, Belgium Wiebe H. C. F. Kooistra Stazione Zoologica ‘‘Anton Dohrn,’’ Villa Comunale, 80121 Naples, Italy and Eric Coppejans Phycology Research Group, Ghent University, Krijgslaan 281 (S8), B-9000 Gent, Belgium Molecular systematic studies have changed the face of algal taxonomy. Particularly at the species level, molecular phylogenetic research has revealed the inaccuracy of morphology-based taxonomy: Cryptic and pseudo-cryptic species were shown to exist within many morphologically conceived spe- cies. This study focused on section Rhipsalis of the green algal genus Halimeda. This section was known to contain cryptic diversity and to comprise species with overlapping morphological bounda- ries. In the present study, species diversity within the section and identity of individual specimens were assessed using ITS1–5.8S–ITS2 (nrDNA) and rps3 (cpDNA) sequence data. The sequences grouped in a number of clear-cut genotypic clus- ters that were considered species. The same speci- mens were subjected to morphometric analysis of external morphological and anatomical structures. Morphological differences between the genotypic cluster species were assessed using discriminant analysis. It was shown that significant morphologi- cal differences exist between genetically delineated species and that allocation of specimens to species on the basis of morphometric variables is nearly perfect. Anatomical characters yielded better re- sults than external morphological characters. Two approaches were offered to allow future morpho- logical identifications: a probabilistic approach based on classification functions of discriminant analyses and the classical approach of an identifi- cation key. Key index words: anatomy; discriminant analysis; DNA barcoding; genotypic cluster species; Hali- meda incrassata; Halimeda melanesica; morphology; morphometrics; species delineation; taxonomy Abbreviations: DA, discriminant analysis; ITS, in- ternal transcribed spacer; MP, maximum parsi- mony; PCA, principal component analysis The last two decades have seen the incorporation of molecular phylogenetic methods in algal systematic re- search. Several studies have shown that morphological taxonomic insights did not correspond with the evolu- tionary history inferred from DNA sequences. This has been especially true for species-level studies, in which many cases of cryptic and pseudo-cryptic diversity were revealed (van der Strate et al. 2002, Gurgel et al. 2003, Zuccarello and West 2003, Cohen et al. 2004, De Clerck et al. 2005). Cryptic species are species that are morphologically indistinguishable, whereas pseudo-cryptic entities are distinguishable morpholog- ically once the appropriate characters are considered (Knowlton 1993). Such key traits may not immediately catch the attention of the observer because they are often more subtle than trends in environmentally in- duced phenotypic plasticity shared among the entities. Morphological plasticity in its own right has also led to erroneous taxonomy; several molecular phylogenetic studies have demonstrated that morphological oddities at the fringes of the plasticity spectrum have been de- scribed as new species (Zuccarello and West 2002, Yano et al. 2004, Kooistra and Verbruggen 2005). Thalli of the tropical green algal genus Halimeda are composed of green calcified segments (Lamouroux 1812, Hillis-Colinvaux 1980). Anatomically, the thalli consist of a single, branched, siphonous cell. The high- ly organized siphonous branches form the segments and string them together (Barton 1901, Hillis- Colinvaux 1980). Halimeda is a well-studied example of a genus in which species diversity was underesti- mated by morphology-based taxonomy. First, all but 1 Received 23 November 2004. Accepted 13 February 2005. 2 Author for correspondence: e-mail [email protected]. 606 J. Phycol. 41, 606–621 (2005) r 2005 Phycological Society of America DOI: 10.1111/j.1529-8817.2005.00083.x

Welcome message from author
This document is posted to help you gain knowledge. Please leave a comment to let me know what you think about it! Share it to your friends and learn new things together.
Transcript
MOLECULAR AND MORPHOMETRIC DATA PINPOINT SPECIES BOUNDARIES INHALIMEDA SECTION RHIPSALIS (BRYOPSIDALES, CHLOROPHYTA)1
Heroen Verbruggen,2 Olivier De Clerck
Phycology Research Group and Center for Molecular Phylogenetics and Evolution, Ghent University, Krijgslaan 281 (S8),
B-9000 Gent, Belgium
Wiebe H. C. F. Kooistra
Stazione Zoologica ‘‘Anton Dohrn,’’ Villa Comunale, 80121 Naples, Italy
and
Eric Coppejans
Phycology Research Group, Ghent University, Krijgslaan 281 (S8), B-9000 Gent, Belgium
Molecular systematic studies have changed theface of algal taxonomy. Particularly at the specieslevel, molecular phylogenetic research has revealedthe inaccuracy of morphology-based taxonomy:Cryptic and pseudo-cryptic species were shown toexist within many morphologically conceived spe-cies. This study focused on section Rhipsalis ofthe green algal genus Halimeda. This section wasknown to contain cryptic diversity and to comprisespecies with overlapping morphological bounda-ries. In the present study, species diversity withinthe section and identity of individual specimenswere assessed using ITS1–5.8S–ITS2 (nrDNA) andrps3 (cpDNA) sequence data. The sequencesgrouped in a number of clear-cut genotypic clus-ters that were considered species. The same speci-mens were subjected to morphometric analysis ofexternal morphological and anatomical structures.Morphological differences between the genotypiccluster species were assessed using discriminantanalysis. It was shown that significant morphologi-cal differences exist between genetically delineatedspecies and that allocation of specimens to specieson the basis of morphometric variables is nearlyperfect. Anatomical characters yielded better re-sults than external morphological characters. Twoapproaches were offered to allow future morpho-logical identifications: a probabilistic approachbased on classification functions of discriminantanalyses and the classical approach of an identifi-cation key.
Key index words: anatomy; discriminant analysis;DNA barcoding; genotypic cluster species; Hali-
meda incrassata; Halimeda melanesica; morphology;morphometrics; species delineation; taxonomy
Abbreviations: DA, discriminant analysis; ITS, in-ternal transcribed spacer; MP, maximum parsi-mony; PCA, principal component analysis
The last two decades have seen the incorporation ofmolecular phylogenetic methods in algal systematic re-search. Several studies have shown that morphologicaltaxonomic insights did not correspond with the evolu-tionary history inferred from DNA sequences. This hasbeen especially true for species-level studies, in whichmany cases of cryptic and pseudo-cryptic diversitywere revealed (van der Strate et al. 2002, Gurgelet al. 2003, Zuccarello and West 2003, Cohen et al.2004, De Clerck et al. 2005). Cryptic species are speciesthat are morphologically indistinguishable, whereaspseudo-cryptic entities are distinguishable morpholog-ically once the appropriate characters are considered(Knowlton 1993). Such key traits may not immediatelycatch the attention of the observer because they areoften more subtle than trends in environmentally in-duced phenotypic plasticity shared among the entities.Morphological plasticity in its own right has also led toerroneous taxonomy; several molecular phylogeneticstudies have demonstrated that morphological odditiesat the fringes of the plasticity spectrum have been de-scribed as new species (Zuccarello and West 2002, Yanoet al. 2004, Kooistra and Verbruggen 2005).
Thalli of the tropical green algal genus Halimeda arecomposed of green calcified segments (Lamouroux1812, Hillis-Colinvaux 1980). Anatomically, the thalliconsist of a single, branched, siphonous cell. The high-ly organized siphonous branches form the segmentsand string them together (Barton 1901, Hillis-Colinvaux 1980). Halimeda is a well-studied exampleof a genus in which species diversity was underesti-mated by morphology-based taxonomy. First, all but
1Received 23 November 2004. Accepted 13 February 2005.2Author for correspondence: e-mail [email protected].
606
J. Phycol. 41, 606–621 (2005)r 2005 Phycological Society of AmericaDOI: 10.1111/j.1529-8817.2005.00083.x

one of the pantropical species were shown to consist oftwo unrelated species, one inhabiting the Caribbeanand a second populating Indo-Pacific coasts (Kooistraet al. 2002). Second, a considerable number of addi-tional cryptic species were found within both oceanbasins (Verbruggen and Kooistra 2004, Verbruggenet al. 2005c).
Systematists are now facing the challenge of distin-guishing among species that have not been recognizedby many generations of alpha-taxonomists. In an at-tempt to provide a tool for this purpose, Verbruggenet al. (2005a,b) applied a series of morphometric tech-niques to nine Halimeda species representing the fivesections of the genus. The present study puts themorphometric techniques explored in Verbruggenet al. (2005a) into practice within Halimeda sectionRhipsalis. In this section, medullar siphons that gothrough the nodes between segments fuse with theirneighbors laterally, resulting in a meshwork of poresinterconnecting the siphons at the height of the node(Kooistra et al. 2002, Verbruggen and Kooistra 2004).The section is further characterized by segment agglu-tination in the basal thallus region (Kooistra et al.2002, Verbruggen and Kooistra 2004). Most speciesbelonging to section Rhipsalis grow on sandy or muddysubstrates of tropical lagoons and mangroves. Theirholdfast is modified into a large bulbous structure toallow attachment in loose substratum. However, thisholdfast type is not a defining trait for the section be-cause bulbous holdfasts can be found, at times, in othersections (Verbruggen and Kooistra 2004) and one spe-cies in the section (H. melanesica, species authoritieslisted in Appendix 1) has lost the bulbous holdfastsecondarily (Kooistra et al. 2002, Verbruggen andKooistra 2004).
The section features several taxonomic problems.First, Noble (1987) noticed that the absence of nodalfusions, which sets H. melanesica apart from other spe-cies, was not constant within the species. She notedconsiderable blurring of the boundary betweenH. melanesica and H. incrassata because of this varia-bility. Second, H. incrassata turned out to consist of twounrelated species, one in the Atlantic and one in theIndo-Pacific (Kooistra et al. 2002). The morphologicalboundaries between the entities remained a mystery.Third, current species boundaries contradict geneticpatterns in the species pair H. simulans–borneensis. On amorphological basis, H. borneensis was thought to berestricted to southwest Pacific waters. Halimeda simulanswas reported from the Caribbean and several locationsin the Indo-Pacific (Hillis-Colinvaux 1980). Verbrug-gen et al. (2005a) showed that Indo-Pacific specimensidentified as H. simulans did not belong to the cladeof Atlantic H. simulans but instead clustered withH. borneensis. Fourth, a similar situation occurs withthe H. monile–cylindracea species pair. Halimeda cylind-racea is an Indo-Pacific species, and Indo-Pacific spec-imens identified as H. monile belong to H. cylindracea.Finally, the status of H. stuposa, which had never beenquestioned in traditional taxonomic research, was
doubted by Kooistra et al. (2002) because the smallsubunit sequence obtained from an isotype specimenwas nearly identical to that of H. borneensis.
This study aims 1) to identify genotypic clusters in aset of ITS1–5.8S–ITS2 and rps3 sequences and to re-define species on the basis of these clusters, 2) to assesswhether it is possible to distinguish between genotypiccluster species on the basis of morphometric variables,3) to pinpoint species boundaries using morphometricvariables, 4) to present a probabilistic approach towardspecies identification based on measurements of ana-tomical structures, and 5) to present a more classicalidentification method (i.e. a dichotomous key).
MATERIALS AND METHODS
Specimen collection, DNA sequencing, and phylogenetic infer-ence. Specimens were collected from natural populationsthroughout the species’ ranges (Appendix 1). Part of thethallus was preserved in ethanol 95% or silica gel for DNAextraction; the remainder of the specimen was preserved inliquid preservative (ethanol 95% or formalin 5%) formorphometric analyses. Specimens were identified usingHillis-Colinvaux (1980).
Extraction of total genomic DNA followed Kooistra et al.(2002), but for a few specimens, a standard cetyl trimethyl am-monium bromide (CTAB) procedure was used. The nuclearribosomal ITS1–5.8S–ITS2 region and the plastid UCP7 region(rps19–rps3) were amplified according to Kooistra et al. (2002)and Provan et al. (2004), respectively. Sequences were deter-mined with forward and reverse primers, using an ABI Prism3100 automated sequencer (Applied Biosystems, Foster City,CA, USA). Of the rps19–rps3 sequences, partial rps19 and theintergenic spacer were discarded, leaving only partial rps3 se-quences. The rps3 sequences were aligned on the basis of theiramino acid sequences using ClustalW 1.82 at the EBI (Euro-pean Bioinformatics Institute) server, with default settings. TheITS1–5.8S–ITS2 sequences were aligned using ClustalW 1.82with default settings (European Bioinformatics Institute (EBI)server, www.ebi.ac.be/clustalw). Sequences and alignments weresubmitted to GenBank (see Appendix 1 for accession numbers)and Treebase (preliminary accession number SN2128).
Both alignments were subjected to maximum parsimony(MP) analysis in PAUP* 4.0b10 (Swofford 2003). Starting treeswere obtained by random stepwise addition. A single tree wasretained at each step. Branch swapping was achieved by treebisection-reconnection. Gaps were treated as missing data. Thenumber of rearrangements was limited to 100 million per ad-dition-sequence replicate. The analysis performed 50 addition-sequence replicates and was carried out without outgroup(midpoint rooting). The MP bootstrapping analyses (1000 rep-licates) was performed using the same MP settings (Felsenstein1985). Genotypic clusters in the DNA data were identified byeye from the obtained phylograms.
Morphometrics. Measurements and morphometric analy-ses were carried out as detailed in Verbruggen et al. (2005a),with a number of modifications. Per specimen, 10 segmentswere photographed. These segments were picked at random,after exclusion of apical and noncalcified segments, and seg-ments from the basal thallus zone, as recommended by Ver-bruggen et al. (2005b). From the aligned digital images,categorical shape variables were scored. Landmarks wereplaced on the images as described in Figure 2a of Verbruggenet al. (2005a) and served for landmark analysis and calcula-tion of conventional measurements and ratio shape variables.In the light of the conclusions of Verbruggen et al. (2005a),elliptic Fourier analysis of segment outlines was omitted.
DEFINING SPECIES BOUNDARIES IN HALIMEDA 607
Table 1 lists the segment variables and their abbreviations.Two data sets were constructed from the data: first, one withdata of all segments (10 per specimen) and, second, one with asingle entry per specimen (median values of segments belong-ing to the specimen in question).
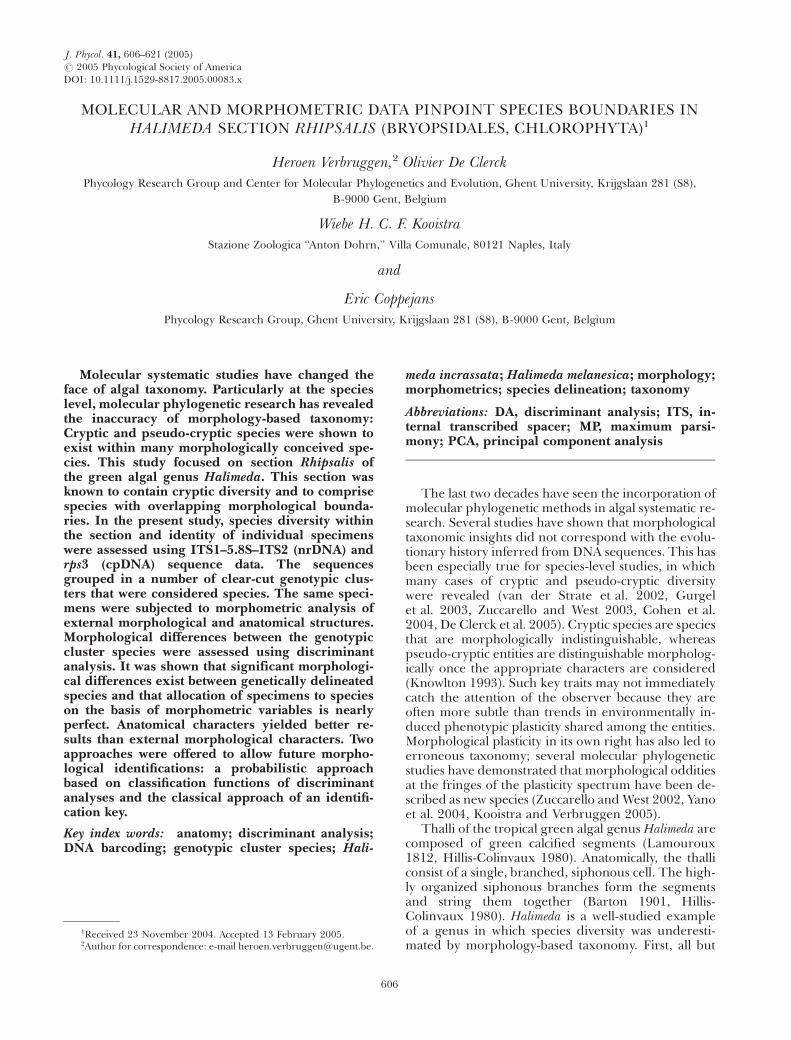
Measurements of anatomical structures were made accord-ing to Verbruggen et al. (2005a), with some slight modifica-tions. Anatomical investigation was limited to a single segmentfrom the central part of the thallus, following the recommen-dations of Verbruggen et al. (2005b). All anatomical observa-tions were made with an Olympus BX51 microscope (OlympusEurope, Hamburg, Germany). The diameter of side branchesof medullar siphons at their constriction was not measured.Peripheral utricles were drawn and digitized as described inVerbruggen et al. (2005a). Images were aligned to have theupper plane of utricles horizontal and were overlain with apattern of horizontal lines (Fig. 1A). The pattern consisted offive equidistant horizontal lines and was superimposed on theutricle in such a way that the upper line touched the top side ofthe utricle and the lower line went through the base of theutricle. Ten landmarks (Fig. 1A) were digitized on the picturesusing tpsDig 1.40 (Rohlf 2004). From the landmark files, sev-eral size and shape variables were calculated (Fig. 1, B and C):utricle height and width, their ratio (formula 1), and the rel-ative width at 75%, 50%, and 25% of the utricle’s height (for-mulas 2, 3, and 4). Table 2 lists the anatomical variables andtheir abbreviations. Ten replicate measurements per segmentwere made (e.g. measurements of 10 random peripheralutricles within a single segment). Two data sets were created:first, one with data of all replicates (10 per specimen) and, sec-ond, one with a single entry per specimen (median values ofreplicates). All data sets are available from the correspondingauthor upon request.
Statistical analysis of morphometrics. Data exploration: Explo-rative data analysis included visual examination of univariatehistograms. Measurement data were log-transformed for an-alyses requiring so (natural logarithm; indicated with prefixL_ added to the variable name). Principal component anal-yses (PCAs) were carried out to explore the multivariate datasets in more detail. All PCAs were carried out in Statistica 6.0(Statsoft, Tulsa, OK, USA).
Initial discriminant analyses: The four data sets were sub-jected to discriminant analysis (DA) using the General Dis-criminant Analysis module of Statistica (Statsoft). Genotypic
clusters found in the molecular phylogenies were used as apriori groups in DA. Classifications were carried out withequal prior probabilities and without cross-validation. Alleffects were entered at once.
DA of degenerate data sets: After initial DA, further DAswere carried out on partial data sets, with the aim of singlingout characters or character combinations that allow goodseparation between species. Structure coefficients of the ca-nonical roots of previous DAs were used as a guide for fur-ther DA: Variables uncorrelated with major canonical rootswere omitted. Furthermore, we closed in on specific speciesgroups by including only those species in DA.
RESULTS
Sequence data, genotypic clusters, and identifications. In-formation on length, base composition, and variability
TABLE 1. Variables describing segment morphology.
Categorical shape variabless01 form_seg Categorical segment form: reniform, ovate, elliptical, obovate, cuneate, rectangulars02 seg_widt Categorical variable for relative segment width: narrow, medium, broads03 stalk Categorical variable describing the proximal stalk zone: absent, intermediate, presents04 form_bas Categorical variable for the form of the segment base: auriculate to acute in five stepss05 lobedne Categorical variable describing the segment’s lobedness: absent, shallow, medium, deeps06 numlobes Number of lobes:1 to 6 (six meaning many)Conventional measurementss07 length Segment length (mm)s08 width Segment width (mm)s09 attach Width of attachment zone (mm)s10 homw Height of maximal segment width (mm)s11 thick Segment thickness (mm)Ratio shape variabless12 thk_len Relative segment thickness: thickness over length ratios13 thk_att Ratio of segment thickness over the width of the attachment zonePartial warp scores (landmark analysis)s14 pw_UniX Uniform shape change score Xs15 pw_UniY Uniform shape change score Ys16 pw_1X Partial warp score 1Xs17 pw_1Y Partial warp score 1Ys18 pw_2X Partial warp score 2Xs19 pw_2Y Partial warp score 2Y
1
2
3 4
5 6
7 8
9 10
p_he
ight
p_width
p_w_75
p_w_50
p_w_25
(2) p_rel_w_75 =p_w_75
p_width
(3) p_rel_w_50 =p_w_50
p_width(4) p_rel_w_25 =
p_w_25
p_width
(1) p_rel_h =p_height
p_width
A B
C
FIG. 1. Peripheral utricle measurements. (A) Utricles over-lain with a line pattern, showing the ten digitized positions.(B) Measurements calculated from the landmark files. (C) Ratioscalculated from the measurements.
HEROEN VERBRUGGEN ET AL.608
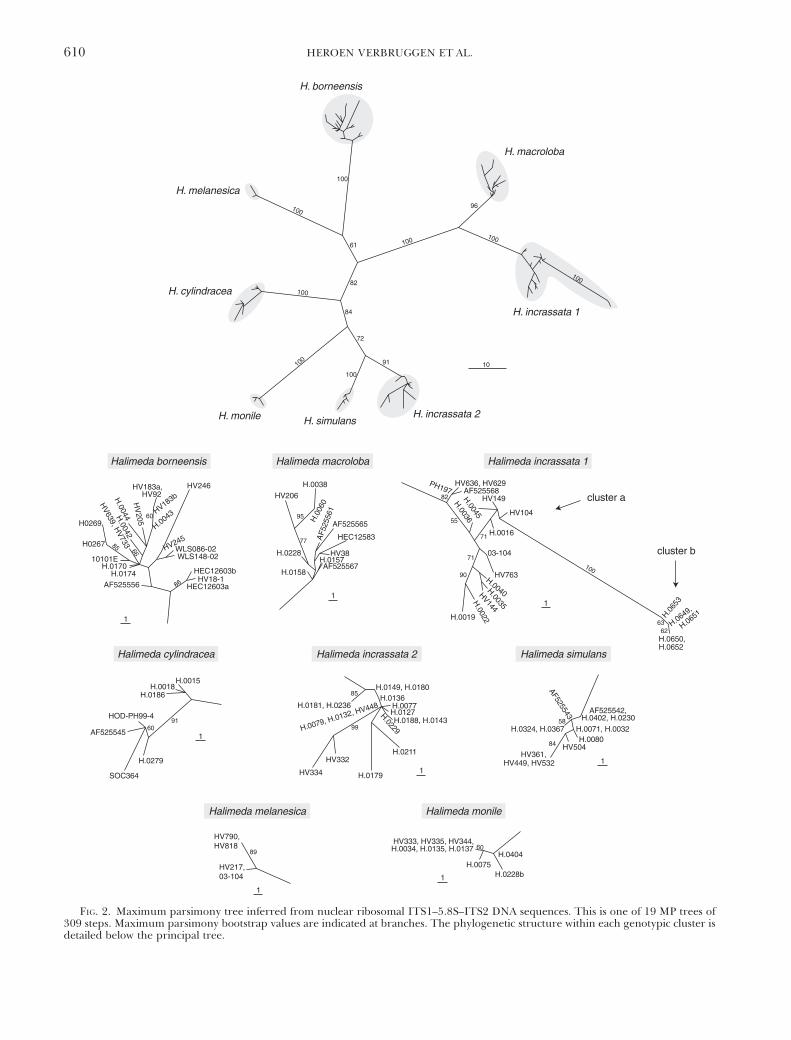
of sequence data are listed in Table 3. Figures 2 and3 depict the phylograms obtained by MP analysis ofITS1–5.8S–ITS2 and rps3 sequence data, respectively.The trees featured a number of genotypic clustersof closely related specimens separated from othersuch clusters by long branches with high bootstrapsupport. Specimens forming a genotypic cluster in theITS–5.8S–ITS2 tree, also grouped in the rps3 tree andvice versa.
Species names were assigned to the genotypic clus-ters on the basis of correspondence with morphology-based identifications of specimens belonging to theclusters. In a few cases, genotypic clusters and mor-phological identifications did not match. Several spec-imens with an H. simulans morphology were recoveredin the H. borneensis cluster, and the H. incrassata 1agenotypic cluster contained multiple specimens that
stood midway between H. incrassata and H. melanesicamorphologies.
There was a discrepancy in branch lengths betweenthe H. monile–simulans–incrassata 2 group and the re-mainder of the species in the rps3 tree, branches be-tween species being much longer within the group inquestion. Furthermore, within-species sequence diver-gence was large within H. monile and H. incrassata 2.These discrepancies were caused by codon indels.
Within the Indo-Pacific H. incrassata diversity(named H. incrassata 1 in Figs. 2 and 3), two geno-typic clusters were present. The first cluster (1a)represented the bulk of the specimens and occursthroughout the Indo-Pacific. The second cluster (1b)contained five specimens from Honolua Bay, Maui,Hawaii. In the ITS1–5.8S–ITS2 tree (Fig. 2), cluster 1bbranched off from within cluster 1a, which was leftparaphyletic. The branch leading toward cluster b wasvery long and obtained 100% bootstrap support. In therps3 tree, clusters 1a and 1b were both monophyleticand received high bootstrap support. Cluster 1a wasthe closest sister to H. macroloba; cluster 1b was sister tothe H. macroloba–incrassata 1a clade. Clusters 1a and 1bwere retained as distinct entities for further analyses.
We were unable to obtain H. stuposa specimens suit-able for DNA analysis. Amplification of DNA from thespecimen sequenced by Kooistra et al. (2002) failed onseveral attempts. As a consequence, this species was notrepresented in the trees. Nonetheless, H. stuposa wasretained as a separate entity in further analyses.
Exploration of morphometric data. Segment morpho-logical variables were scored from 90 specimens and
TABLE 2. Variables describing anatomical structures.
Medullar charactersa01 diam_ir Distance between two subsequent ramifications (mm)a02 constr_m Medullary siphon diameter (mm)a03 len_ir Length over diameter ratio of the siphon segment: len_ir/dia_ira04 ir_rel_len Constriction of main branch diameter (mm)a05 dichotomy Fraction dichotomous ramificationsa06 trichotomy Fraction trichotomous ramificationsa07 quadrichotomy Fraction quadrichotomous ramificationsNodal propertiesa08 node_act Distance from below node to supranodal ramification (mm)a09 len_supr Thickness of the supranodal interramification (mm)a10 diam_supr Actual pore size or node height (mm)Peripheral utriclesa11 p_surf Surface diameter peripheral utricle (mm)a12 p_height Height of peripheral utricle (mm)a13 p_width Diameter of peripheral utricle (mm)a14 p_rel_w_75 Relative width of peripheral utricle at 3/4 of its heighta15 p_rel_w_50 Relative width of peripheral utricle at 1/2 of its heighta16 p_rel_w_25 Relative width of peripheral utricle at 1/4 of its heighta17 p_rel_h Relative height of utricle: p_height over p_width ratioSecondary utriclesa18 s_height Length (mm) of the secondary utriclea19 s_width Maximal diameter (mm) of the secondary utriclea20 s_rel_h Relative height of secondary utricle: s_length over s_width ratioa21 s_succ Number of peripheral utricles carried by the secondary utricleTertiary utriclesa22 t_height Length (mm) of the tertiary utriclea23 t_width Maximal diameter (mm) of the tertiary utriclea24 t_rel_h Relative height of tertiary utricle: t_length over t_width ratioa25 t_succ Number of secondary utricles carried by the tertiary utricle
TABLE 3. Length, variability, and composition of DNAdata.
ITS1–5.8S–ITS2 rps3
Sequence length 436–472 660–876Alignment length 485 1014Constant positions 338 422Variable positions 147 592Parsimony informative positions 116 497T 19.1% 26.0%C 29.3% 18.7%A 20.8% 34.6%G 30.8% 20.7%Indels 5.6% 26.6%
DEFINING SPECIES BOUNDARIES IN HALIMEDA 609
H. monile
Halimeda monile
H. simulansH. incrassata 2
H. macroloba
H. incrassata 1
H. melanesica
Halimeda melanesica
H. cylindracea
Halimeda borneensis
Halimeda cylindracea
H. borneensis
Halimeda simulansHalimeda incrassata 2
Halimeda incrassata 1Halimeda macroloba
FIG. 2. Maximum parsimony tree inferred from nuclear ribosomal ITS1–5.8S–ITS2 DNA sequences. This is one of 19 MP trees of309 steps. Maximum parsimony bootstrap values are indicated at branches. The phylogenetic structure within each genotypic cluster isdetailed below the principal tree.
HEROEN VERBRUGGEN ET AL.610
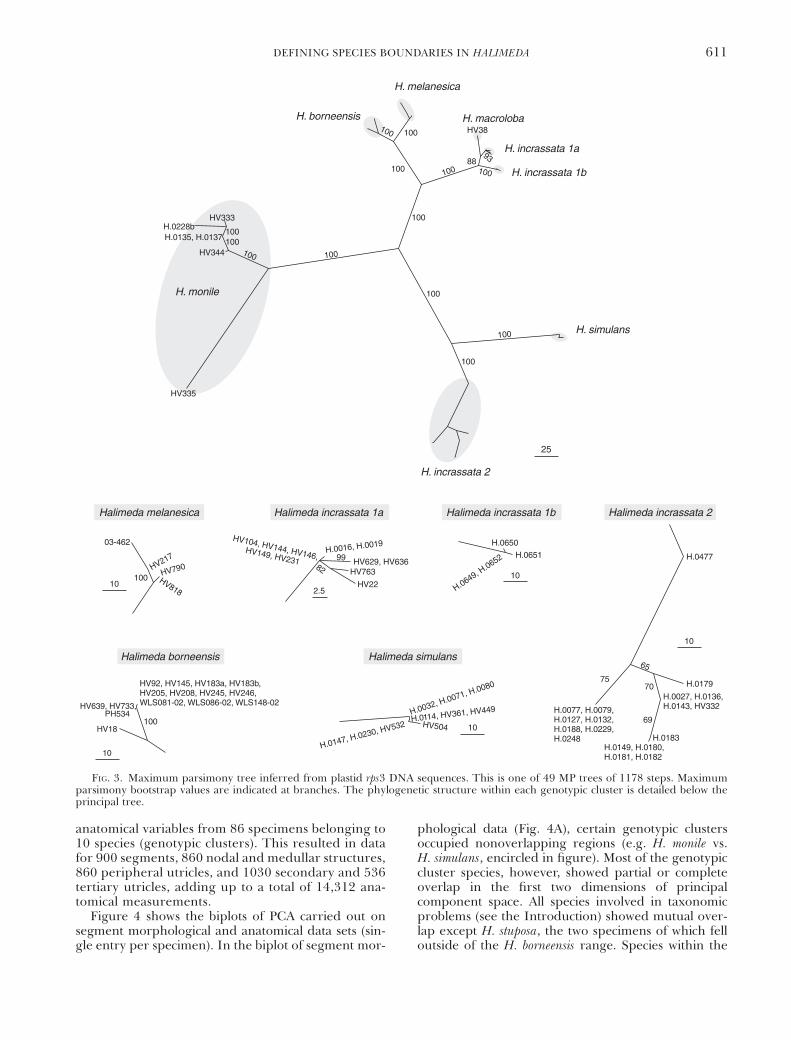
anatomical variables from 86 specimens belonging to10 species (genotypic clusters). This resulted in datafor 900 segments, 860 nodal and medullar structures,860 peripheral utricles, and 1030 secondary and 536tertiary utricles, adding up to a total of 14,312 ana-tomical measurements.
Figure 4 shows the biplots of PCA carried out onsegment morphological and anatomical data sets (sin-gle entry per specimen). In the biplot of segment mor-
phological data (Fig. 4A), certain genotypic clustersoccupied nonoverlapping regions (e.g. H. monile vs.H. simulans, encircled in figure). Most of the genotypiccluster species, however, showed partial or completeoverlap in the first two dimensions of principalcomponent space. All species involved in taxonomicproblems (see the Introduction) showed mutual over-lap except H. stuposa, the two specimens of which felloutside of the H. borneensis range. Species within the
25
H. macroloba
H. incrassata 1a
H. incrassata 1b
H. melanesica
H. borneensis
H. incrassata 2
H. simulans
H. monile
HV335
HV344
H.0135, H.0137H.0228b
HV333
Halimeda incrassata 2
10
H.0477
H.0077, H.0079,H.0127, H.0132,H.0188, H.0229,H.0248
H.0179
H.0027, H.0136,H.0143, HV332
H.0183H.0149, H.0180,H.0181, H.0182
Halimeda simulans
H.0032, H.0071, H.0080
H.0114, HV361, HV449
H.0147, H.0230, HV532 HV504 10
Halimeda incrassata 1b
H.0649, H.0652
H.0650
H.0651
Halimeda incrassata 1a
10HV763
2.5HV22
HV629, HV636H.0016, H.0019
HV104, HV144, HV146,HV149, HV231
Halimeda borneensis
10
HV790HV217
03-462
Halimeda melanesica
HV81810
HV18
HV639, HV733,PH534
HV92, HV145, HV183a, HV183b,HV205, HV208, HV245, HV246,WLS081-02, WLS086-02, WLS148-02
100
100
100
100
100100
100100
100
100
100
100
75
65
70
69
100 100 10088
93
8299
HV38
FIG. 3. Maximum parsimony tree inferred from plastid rps3 DNA sequences. This is one of 49 MP trees of 1178 steps. Maximumparsimony bootstrap values are indicated at branches. The phylogenetic structure within each genotypic cluster is detailed below theprincipal tree.
DEFINING SPECIES BOUNDARIES IN HALIMEDA 611
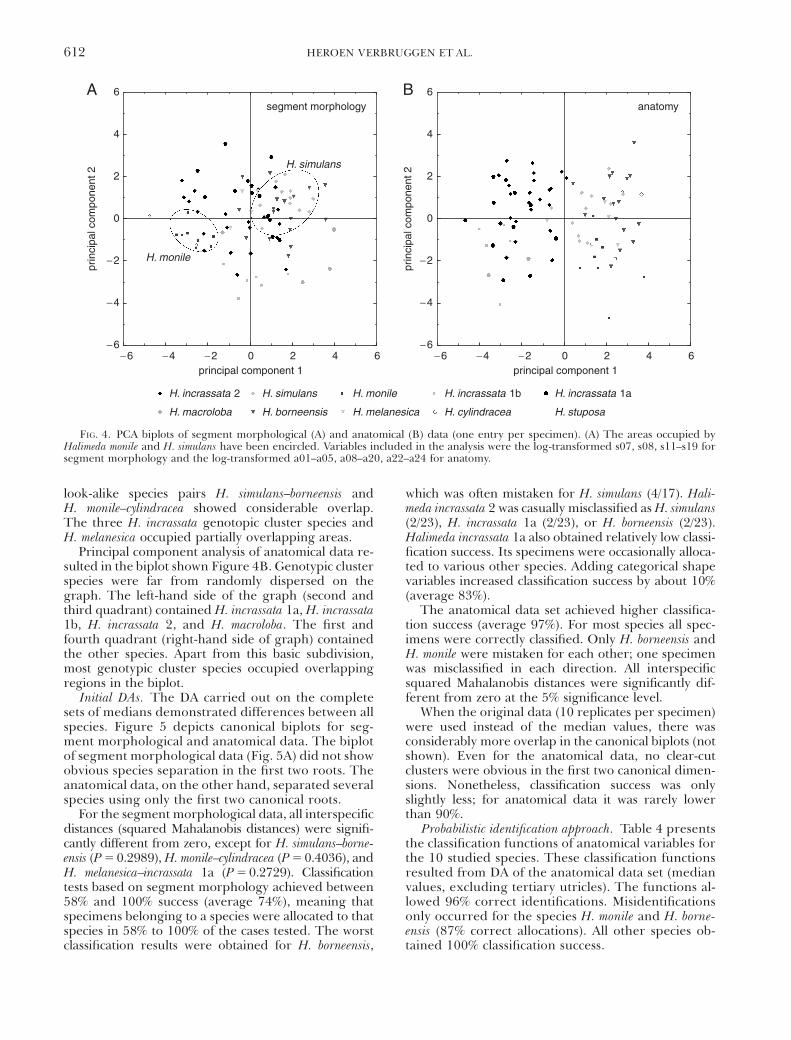
look-alike species pairs H. simulans–borneensis andH. monile–cylindracea showed considerable overlap.The three H. incrassata genotopic cluster species andH. melanesica occupied partially overlapping areas.
Principal component analysis of anatomical data re-sulted in the biplot shown Figure 4B. Genotypic clusterspecies were far from randomly dispersed on thegraph. The left-hand side of the graph (second andthird quadrant) contained H. incrassata 1a, H. incrassata1b, H. incrassata 2, and H. macroloba. The first andfourth quadrant (right-hand side of graph) containedthe other species. Apart from this basic subdivision,most genotypic cluster species occupied overlappingregions in the biplot.
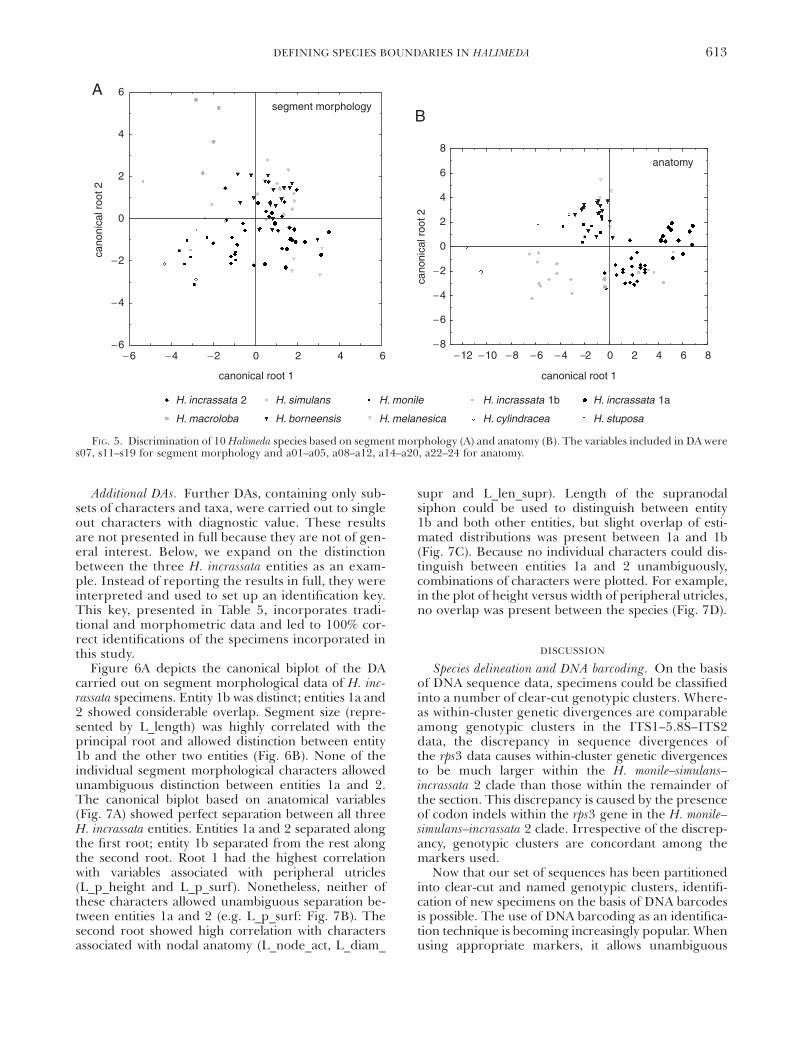
Initial DAs. The DA carried out on the completesets of medians demonstrated differences between allspecies. Figure 5 depicts canonical biplots for seg-ment morphological and anatomical data. The biplotof segment morphological data (Fig. 5A) did not showobvious species separation in the first two roots. Theanatomical data, on the other hand, separated severalspecies using only the first two canonical roots.
For the segment morphological data, all interspecificdistances (squared Mahalanobis distances) were signifi-cantly different from zero, except for H. simulans–borne-ensis (P 5 0.2989), H. monile–cylindracea (P 5 0.4036), andH. melanesica–incrassata 1a (P 5 0.2729). Classificationtests based on segment morphology achieved between58% and 100% success (average 74%), meaning thatspecimens belonging to a species were allocated to thatspecies in 58% to 100% of the cases tested. The worstclassification results were obtained for H. borneensis,
which was often mistaken for H. simulans (4/17). Hali-meda incrassata 2 was casually misclassified as H. simulans(2/23), H. incrassata 1a (2/23), or H. borneensis (2/23).Halimeda incrassata 1a also obtained relatively low classi-fication success. Its specimens were occasionally alloca-ted to various other species. Adding categorical shapevariables increased classification success by about 10%(average 83%).
The anatomical data set achieved higher classifica-tion success (average 97%). For most species all spec-imens were correctly classified. Only H. borneensis andH. monile were mistaken for each other; one specimenwas misclassified in each direction. All interspecificsquared Mahalanobis distances were significantly dif-ferent from zero at the 5% significance level.
When the original data (10 replicates per specimen)were used instead of the median values, there wasconsiderably more overlap in the canonical biplots (notshown). Even for the anatomical data, no clear-cutclusters were obvious in the first two canonical dimen-sions. Nonetheless, classification success was onlyslightly less; for anatomical data it was rarely lowerthan 90%.
Probabilistic identification approach. Table 4 presentsthe classification functions of anatomical variables forthe 10 studied species. These classification functionsresulted from DA of the anatomical data set (medianvalues, excluding tertiary utricles). The functions al-lowed 96% correct identifications. Misidentificationsonly occurred for the species H. monile and H. borne-ensis (87% correct allocations). All other species ob-tained 100% classification success.
− 6 − 4 − 2 0 2 4 6− 6
− 4
− 2
0
2
4
6
principal component 1
prin
cipa
l com
pone
nt 2
A
− 6 − 4 − 2 0 2 4 6− 6
− 4
− 2
0
2
4
6
principal component 1
prin
cipa
l com
pone
nt 2
B
H. incrassata 2
H. macroloba
H. simulans H. monile H. incrassata 1b H. incrassata 1a
H. borneensis H. melanesica H. cylindracea H. stuposa
H. monile
H. simulans
segment morphology anatomy
FIG. 4. PCA biplots of segment morphological (A) and anatomical (B) data (one entry per specimen). (A) The areas occupied byHalimeda monile and H. simulans have been encircled. Variables included in the analysis were the log-transformed s07, s08, s11–s19 forsegment morphology and the log-transformed a01–a05, a08–a20, a22–a24 for anatomy.
HEROEN VERBRUGGEN ET AL.612
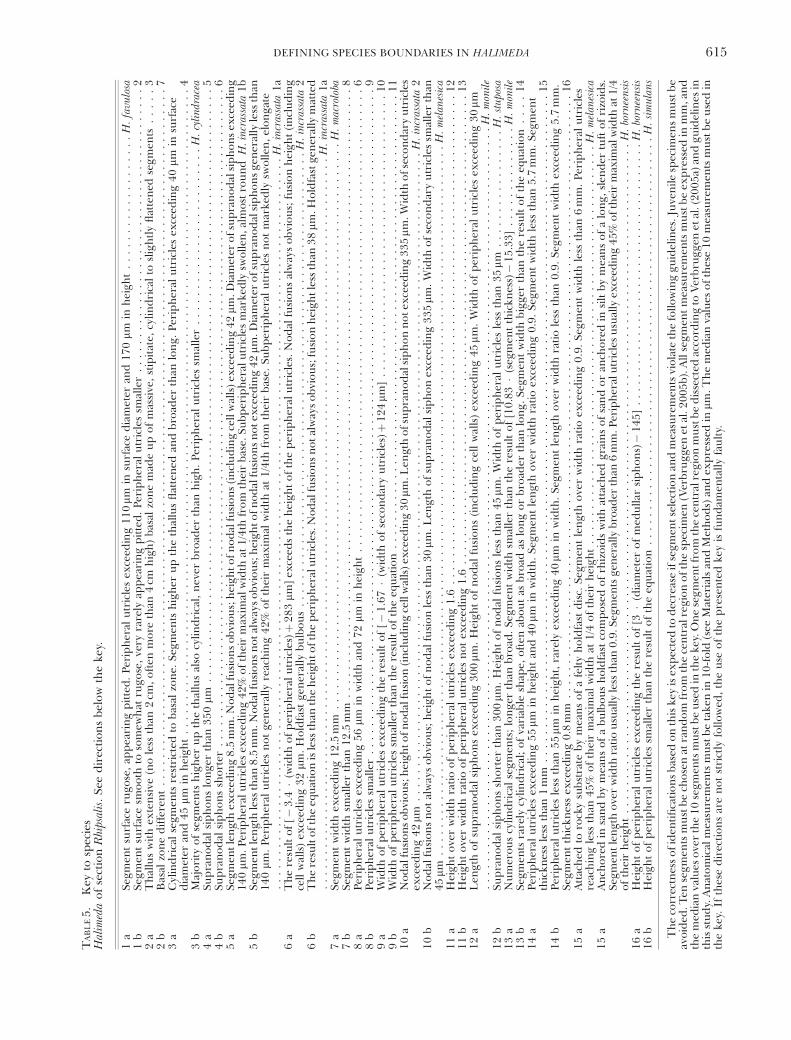
Additional DAs. Further DAs, containing only sub-sets of characters and taxa, were carried out to singleout characters with diagnostic value. These resultsare not presented in full because they are not of gen-eral interest. Below, we expand on the distinctionbetween the three H. incrassata entities as an exam-ple. Instead of reporting the results in full, they wereinterpreted and used to set up an identification key.This key, presented in Table 5, incorporates tradi-tional and morphometric data and led to 100% cor-rect identifications of the specimens incorporated inthis study.
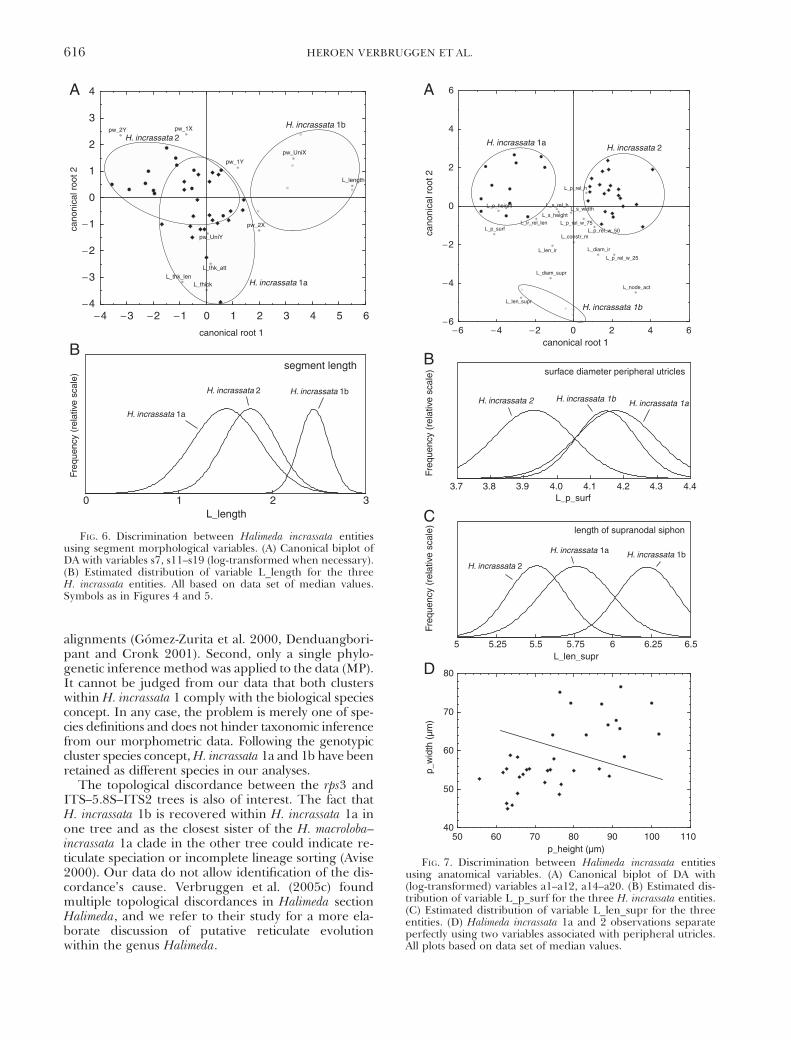
Figure 6A depicts the canonical biplot of the DAcarried out on segment morphological data of H. inc-rassata specimens. Entity 1b was distinct; entities 1a and2 showed considerable overlap. Segment size (repre-sented by L_length) was highly correlated with theprincipal root and allowed distinction between entity1b and the other two entities (Fig. 6B). None of theindividual segment morphological characters allowedunambiguous distinction between entities 1a and 2.The canonical biplot based on anatomical variables(Fig. 7A) showed perfect separation between all threeH. incrassata entities. Entities 1a and 2 separated alongthe first root; entity 1b separated from the rest alongthe second root. Root 1 had the highest correlationwith variables associated with peripheral utricles(L_p_height and L_p_surf). Nonetheless, neither ofthese characters allowed unambiguous separation be-tween entities 1a and 2 (e.g. L_p_surf: Fig. 7B). Thesecond root showed high correlation with charactersassociated with nodal anatomy (L_node_act, L_diam_
supr and L_len_supr). Length of the supranodalsiphon could be used to distinguish between entity1b and both other entities, but slight overlap of esti-mated distributions was present between 1a and 1b(Fig. 7C). Because no individual characters could dis-tinguish between entities 1a and 2 unambiguously,combinations of characters were plotted. For example,in the plot of height versus width of peripheral utricles,no overlap was present between the species (Fig. 7D).
DISCUSSION
Species delineation and DNA barcoding. On the basisof DNA sequence data, specimens could be classifiedinto a number of clear-cut genotypic clusters. Where-as within-cluster genetic divergences are comparableamong genotypic clusters in the ITS1–5.8S–ITS2data, the discrepancy in sequence divergences ofthe rps3 data causes within-cluster genetic divergencesto be much larger within the H. monile–simulans–incrassata 2 clade than those within the remainder ofthe section. This discrepancy is caused by the presenceof codon indels within the rps3 gene in the H. monile–simulans–incrassata 2 clade. Irrespective of the discrep-ancy, genotypic clusters are concordant among themarkers used.
Now that our set of sequences has been partitionedinto clear-cut and named genotypic clusters, identifi-cation of new specimens on the basis of DNA barcodesis possible. The use of DNA barcoding as an identifica-tion technique is becoming increasingly popular. Whenusing appropriate markers, it allows unambiguous
− 6 − 4 − 2 0 2 4 6− 6
− 4
− 2
0
2
4
6
canonical root 1
cano
nica
l roo
t 2A
canonical root 1
cano
nica
l roo
t 2
B
H. incrassata 2
H. macroloba
H. simulans H. monile H. incrassata 1b H. incrassata 1a
H. borneensis H. melanesica H. cylindracea H. stuposa
segment morphology
anatomy
− 12 − 10 − 8 − 6 − 4 −2 0 2 4 6 8− 8
− 6
− 4
− 2
0
2
4
6
8
FIG. 5. Discrimination of 10 Halimeda species based on segment morphology (A) and anatomy (B). The variables included in DA weres07, s11–s19 for segment morphology and a01–a05, a08–a12, a14–a20, a22–24 for anatomy.
DEFINING SPECIES BOUNDARIES IN HALIMEDA 613
identification, helps unmask look-alike species regard-less of their life stage, and has the potential to revealthe existence of species new to science (Besansky et al.2003, Hebert et al. 2004a,b, Hogg and Hebert 2004).Our aim, however, was not to replace traditional iden-tification methods by DNA barcoding but rather tohave DNA sequence data serve as a foundation onwhich to construct a new taxonomy, based on reliablemorphological differences between species.
Evolution of Halimeda incrassata 1. It is beyonddoubt that clusters a and b of H. incrassata 1 are dis-tinct from one another. In the rps3 tree both aremonophyletic. In the ITS1–5.8S–ITS2 tree, H. inc-rassata 1b branches off from within the H. incrassata1a genotypic cluster and sits on a long branch with100% bootstrap support.
In most cases, our genotypic cluster species aremonophyletic and can also be regarded genealogical
species (Baum and Donoghue 1995). Interfertility as-says confirm that, at least for what the H. monile–simulans–incrassata 2 clade is concerned, the genotypiccluster, genealogical, and biological species conceptscorrespond (K. E. Clifton, personal communication).The phylogenetic pattern within H. incrassata 1 hindersthe equation of our genotypic cluster species with ge-nealogical species. If H. incrassata 1b is to be considereda species, H. incrassata 1a is left nonmonophyletic in theITS1–5.8S–ITS2 tree and thus does not comply withthe genealogical species definition (Baum and Donog-hue 1995). However, two things must be noted in thiscontext. First, several aspects of ITS sequence evolu-tion and alignment may lead to suboptimal topologies(Alvarez and Wendel 2003). Especially the ClustalWalignment algorithm, which does not take structuralfeatures of ITS into account but was preferred to avoidsubjectivity in alignments, may lead to suboptimal
TABLE 4. Classification functions for anatomical variables.
Species Score
Halimeda incrassata 2 81.8 � L_diam_ir� 107.5 � L_constr_mþ 146.9 � L_len_irþ 115.9 � L_node_act� 2.13 � L_len_suprþ 207.9 � L_diam_suprþ 385.8 � L_p_surfþ 122.7 � L_p_heightþ 187.6 L_p_widthþ 21.9 � L_p_rel_w_75þ 112.5 � L_p_rel_w_50–30.4 � L_p_rel_w_25þ 239.0 � L_p_rel_h� 103.2 � L_s_heightþ 323.1 � L_s_width� 3028
H. simulans 80.6 � L_diam_ir� 97.1 � L_constr_mþ 142.2 � L_len_irþ 113.9 � L_node_actþ 0.77 � L_len_suprþ 219.9 � L_diam_suprþ 333.7 � L_p_surfþ 72.0 � L_p_heightþ 183.5 � L_p_width� 23.5 � L_p_rel_w_75þ 112.4 � L_p_rel_w_50–32.6 � L_p_rel_w_25þ 221.0 � L_p_rel_h� 91.4 � L_s_heightþ 313.2 � L_s_width� 2697
H. monile 66.8 � L_diam_ir� 102.6 � L_constr_mþ 143.9 � L_len_irþ 121.2 � L_node_actþ 7.09 � L_len_suprþ 212.8 � L_diam_suprþ 365.3 � L_p_surfþ 89.2 � L_p_heightþ 203.8 � L_p_widthþ 2.23 � L_p_rel_w_75þ 107.8 � L_p_rel_w_50–17.6 � L_p_rel_w_25þ 255.9 � L_p_rel_h� 93.5 � L_s_heightþ 297.6 � L_s_width� 2843
H. incrassata 1b 72.9 � L_diam_ir� 104.4 � L_constr_mþ 147.4 � L_len_irþ 123.8 � L_node_actþ 4.87 � L_len_suprþ 226.4 � L_diam_suprþ 401.4 � L_p_surfþ 108.0 � L_p_heightþ 225.6 � L_p_widthþ 7.46 � L_p_rel_w_75þ 110.9 � L_p_rel_w_50–3.01 � L_p_rel_w_25þ 252.3 � L_p_rel_h� 105.5 � L_s_heightþ 320.3 � L_s_width� 3279
H. incrassata 1a 62.8 � L_diam_ir� 110.9 � L_constr_mþ 151.7 � L_len_irþ 107.0 � L_node_actþ 2.47 � L_len_suprþ 210.8 � L_diam_suprþ 405.5 � L_p_surfþ 181.7 � L_p_heightþ 169.1 � L_p_widthþ 80.6 � L_p_rel_w_75þ 112.9 � L_p_rel_w_50–46.3 � L_p_rel_w_25þ 224.9 � L_p_rel_h� 106.9 � L_s_heightþ 313.6 � L_s_width� 3179
H. macroloba 83.2 � L_diam_ir� 108.9 � L_constr_mþ 151.8 � L_len_irþ 115.1 � L_node_actþ 6.09 � L_len_suprþ 213.9 � L_diam_suprþ 384.3 � L_p_surfþ 128.6 � L_p_heightþ 146.4 � L_p_widthþ 24.4 � L_p_rel_w_75þ 147.1 � L_p_rel_w_50–67.6 � L_p_rel_w_25þ 252.9 � L_p_rel_h� 88.0 � L_s_heightþ 317.6 � L_s_width� 3073
H. borneensis 60.9 � L_diam_ir� 105.9 � L_constr_mþ 153.2 � L_len_irþ 109.5 � L_node_actþ 2.42 � L_len_suprþ 209.8 � L_diam_suprþ 369.1 � L_p_surfþ 100.2 � L_p_heightþ 202.8 � L_p_widthþ 24.2 � L_p_rel_w_75þ 114.1 � L_p_rel_w_50–10.4 � L_p_rel_w_25þ 249.2 � L_p_rel_h� 96.0 � L_s_heightþ 287.9 � L_s_width� 2777
H. melanesica 54.8 � L_diam_ir� 102.1 � L_constr_mþ 140.4 � L_len_irþ 99.3 � L_node_actþ 11.24 � L_len_suprþ 211.7 � L_diam_suprþ 368.8 � L_p_surfþ 145.8 � L_p_heightþ 159.4 � L_p_width� 11.6 � L_p_rel_w_75þ 134.0 � L_p_rel_w_50� 49.4 � L_p_rel_w_25þ 218.9 � L_p_rel_h� 90.9 � L_s_heightþ 289.5 � L_s_width� 2769
H. cylindracea 80.6 � L_diam_ir� 84.7 � L_constr_mþ 132.8 � L_len_irþ 108.2 � L_node_actþ 3.99 � L_len_suprþ 222.9 � L_diam_suprþ 289.6 � L_p_surfþ 70.4 � L_p_heightþ 136.7 � L_p_width� 35.8 � L_p_rel_w_75þ 114.8 � L_p_rel_w_50� 34.2 � L_p_rel_w_25þ 184.8 � L_p_rel_h� 77.2 � L_s_heightþ 302.3 � L_s_width� 2395
H. stuposa 76.8 � L_diam_ir� 104.8 � L_constr_mþ 146.7 � L_len_irþ 103.2 � L_node_act� 3.52 � L_len_suprþ 218.7 � L_diam_suprþ 330.7 � L_p_surfþ 91.8 � L_p_heightþ 174.3 � L_p_width� 95.0 � L_p_rel_w_75þ 140.4 � L_p_rel_w_50� 54.7 � L_p_rel_w_25þ 251.6 � L_p_rel_h� 76.0 � L_s_heightþ 289.4 � L_s_width� 2656
Specimens can be identified by filling in the values obtained for the different variables. The species that receives the highest score isthe species to which the specimen belongs with the highest probability. Probability values can be calculated by dividing the scores foreach species by the sum of all scores. Halimeda favulosa is not included; this species can be easily recognized by its exceptionally largeperipheral utricles (see line 1 of identification key, Table 5).
HEROEN VERBRUGGEN ET AL.614
TA
BL
E5
.K
eyto
spec
ies
Hal
imed
ao
fse
ctio
nR
hips
alis
.S
eed
irec
tion
sb
elow
the
key
.
1a
Seg
men
tsu
rfac
eru
gose
,ap
pea
rin
gp
itte
d.
Per
iph
eral
utr
icle
sex
ceed
ing
11
0mm
insu
rfac
ed
iam
eter
and
170mm
inh
eig
ht
..
..
..
..
..
..
..
..
..
.H
.fa
vulo
sa1
bS
egm
ent
surf
ace
smo
oth
toso
mew
hat
rug
ose
,ve
ryra
rely
app
eari
ng
pit
ted
.P
erip
her
alu
tric
les
smal
ler
..
..
..
..
..
..
..
..
..
..
..
..
..
..
..
..
..
..
..
..
.2
2a
Th
allu
sw
ith
ex
ten
sive
(no
less
than
2cm
,o
ften
mo
reth
an4
cmh
igh
)b
asal
zon
em
ade
up
of
mas
sive
,st
ipit
ate,
cylin
dri
cal
tosl
igh
tly
flat
ten
edse
gm
ents
..
..
.3
2b
Bas
alzo
ne
dif
fere
nt
..
..
..
..
..
..
..
..
..
..
..
..
..
..
..
..
..
..
..
..
..
..
..
..
..
..
..
..
..
..
..
..
..
..
..
..
..
..
..
..
..
..
..
..
..
..
..
..
..
..
73
aC
ylin
dri
cal
seg
men
tsre
stri
cted
tob
asal
zon
e.S
egm
ents
hig
her
up
the
thal
lus
flat
ten
edan
db
road
erth
anlo
ng
.P
erip
her
alu
tric
les
exce
edin
g4
0mm
insu
rfac
ed
iam
eter
and
45mm
inh
eig
ht
..
..
..
..
..
..
..
..
..
..
..
..
..
..
..
..
..
..
..
..
..
..
..
..
..
..
..
..
..
..
..
..
..
..
..
..
..
..
..
..
..
..
..
..
..
..
.4
3b
Maj
ori
tyo
fse
gm
ents
hig
her
up
the
thal
lus
also
cylin
dri
cal,
nev
erb
road
erth
anh
igh
.P
erip
her
alu
tric
les
smal
ler
..
..
..
..
..
..
..
..
..
..
..
..
.H
.cy
lin
drac
ea4
aS
up
ran
od
alsi
ph
on
slo
nger
than
35
0mm
..
..
..
..
..
..
..
..
..
..
..
..
..
..
..
..
..
..
..
..
..
..
..
..
..
..
..
..
..
..
..
..
..
..
..
..
..
..
..
..
..
..
.5
4b
Su
pra
no
dal
sip
ho
ns
sho
rter
..
..
..
..
..
..
..
..
..
..
..
..
..
..
..
..
..
..
..
..
..
..
..
..
..
..
..
..
..
..
..
..
..
..
..
..
..
..
..
..
..
..
..
..
..
..
..
65
aS
egm
ent
len
gth
exce
edin
g8
.5m
m.N
od
alfu
sio
ns
ob
vio
us;
hei
gh
to
fn
od
alfu
sio
ns
(in
clu
din
gce
llw
alls
)ex
ceed
ing
42mm
.Dia
met
ero
fsu
pra
no
dal
sip
ho
ns
exce
edin
g1
40mm
.P
erip
her
alu
tric
les
exce
edin
g4
2%
of
thei
rm
axim
alw
idth
at1
/4th
fro
mth
eir
bas
e.S
ubp
erip
her
alu
tric
les
mar
ked
lysw
ollen
,al
most
rou
nd
H.
incr
assa
ta1
b5
bS
egm
ent
len
gth
less
than
8.5
mm
.No
dal
fusi
on
sn
otal
way
so
bvi
ou
s;h
eig
ht
of
no
dal
fusi
on
sn
otexce
edin
g4
2mm
.Dia
met
ero
fsu
pra
no
dal
sip
ho
ns
gen
eral
lyle
ssth
an1
40mm
.P
erip
her
alu
tric
les
no
tg
ener
ally
reac
hin
g4
2%
of
thei
rm
axim
alw
idth
at1
/4th
fro
mth
eir
bas
e.S
ub
per
iph
eral
utr
icle
sn
ot
mar
ked
lysw
ollen
,el
on
gat
e.
..
..
..
..
..
..
..
..
..
..
..
..
..
..
..
..
..
..
..
..
..
..
..
..
..
..
..
..
..
..
..
..
..
..
..
..
..
..
..
..
..
..
..
..
..
..
..
..
..
..
..
..
H.
incr
assa
ta1
a6
aT
he
resu
lto
f[�
3.4�
(wid
tho
fp
erip
her
alu
tric
les)þ
28
3mm
]exce
eds
the
hei
gh
to
fth
ep
erip
her
alu
tric
les.
No
dal
fusi
on
sal
way
so
bvi
ou
s;fu
sio
nh
eig
ht
(in
clu
din
gce
llw
alls
)exce
edin
g3
2mm
.H
old
fast
gen
eral
lyb
ulb
ou
s.
..
..
..
..
..
..
..
..
..
..
..
..
..
..
..
..
..
..
..
..
..
..
..
..
..
..
..
..
..
..
..
..
H.
incr
assa
ta2
6b
Th
ere
sult
of
the
equ
atio
nis
less
than
the
hei
gh
to
fth
ep
erip
her
alu
tric
les.
Nod
alfu
sio
ns
no
tal
way
so
bvi
ou
s;fu
sio
nh
eig
ht
less
than
38mm
.Ho
ldfa
stg
ener
ally
mat
ted
..
..
..
..
..
..
..
..
..
..
..
..
..
..
..
..
..
..
..
..
..
..
..
..
..
..
..
..
..
..
..
..
..
..
..
..
..
..
..
..
..
..
..
..
..
..
..
..
..
..
..
..
.H
.in
cras
sata
1a
7a
Seg
men
tw
idth
exce
edin
g1
2.5
mm
..
..
..
..
..
..
..
..
..
..
..
..
..
..
..
..
..
..
..
..
..
..
..
..
..
..
..
..
..
..
..
..
..
..
..
..
..
..
..
..
.H
.m
acro
loba
7b
Seg
men
tw
idth
smal
ler
than
12
.5m
m.
..
..
..
..
..
..
..
..
..
..
..
..
..
..
..
..
..
..
..
..
..
..
..
..
..
..
..
..
..
..
..
..
..
..
..
..
..
..
..
..
..
..
..
88
aP
erip
her
alu
tric
les
exce
edin
g5
6mm
inw
idth
and
72mm
inh
eig
ht
..
..
..
..
..
..
..
..
..
..
..
..
..
..
..
..
..
..
..
..
..
..
..
..
..
..
..
..
..
..
..
..
..
68
bP
erip
her
alu
tric
les
smal
ler
..
..
..
..
..
..
..
..
..
..
..
..
..
..
..
..
..
..
..
..
..
..
..
..
..
..
..
..
..
..
..
..
..
..
..
..
..
..
..
..
..
..
..
..
..
..
..
.9
9a
Wid
tho
fp
erip
her
alu
tric
les
exce
edin
gth
ere
sult
of
[�1
.67�
(wid
tho
fse
con
dar
yu
tric
les)þ
12
4mm
].
..
..
..
..
..
..
..
..
..
..
..
..
..
..
..
..
..
..
..
.1
09
bW
idth
of
per
iph
eral
utr
icle
ssm
alle
rth
anth
ere
sult
of
the
equ
atio
n.
..
..
..
..
..
..
..
..
..
..
..
..
..
..
..
..
..
..
..
..
..
..
..
..
..
..
..
..
..
..
..
..
11
10
aN
od
alfu
sio
ns
ob
vio
us;
hei
gh
to
fn
od
alfu
sio
n(i
ncl
ud
ing
cell
wal
ls)
exce
edin
g3
0mm
.Len
gth
of
sup
ran
od
alsi
ph
on
no
tex
ceed
ing
335mm
.Wid
tho
fse
con
dar
yu
tric
les
ex
ceed
ing
42mm
..
..
..
..
..
..
..
..
..
..
..
..
..
..
..
..
..
..
..
..
..
..
..
..
..
..
..
..
..
..
..
..
..
..
..
..
..
..
..
..
..
..
..
..
..
..
.H
.in
cras
sata
21
0b
No
dal
fusi
on
sn
ot
alw
ays
ob
vio
us;
hei
gh
to
fn
od
alfu
sio
nle
ssth
an3
0mm
.L
eng
tho
fsu
pra
no
dal
sip
ho
nexce
edin
g3
35mm
.W
idth
of
seco
nd
ary
utr
icle
ssm
alle
rth
an4
5mm
..
..
..
..
..
..
..
..
..
..
..
..
..
..
..
..
..
..
..
..
..
..
..
..
..
..
..
..
..
..
..
..
..
..
..
..
..
..
..
..
..
..
..
..
..
..
..
..
..
..
..
H.
mel
anes
ica
11
aH
eig
ht
ove
rw
idth
rati
oo
fp
erip
her
alu
tric
les
exce
edin
g1
.6.
..
..
..
..
..
..
..
..
..
..
..
..
..
..
..
..
..
..
..
..
..
..
..
..
..
..
..
..
..
..
..
..
..
..
.1
21
1b
Hei
gh
to
ver
wid
thra
tio
of
per
iph
eral
utr
icle
sn
ot
exce
edin
g1
.6.
..
..
..
..
..
..
..
..
..
..
..
..
..
..
..
..
..
..
..
..
..
..
..
..
..
..
..
..
..
..
..
..
..
13
12
aL
eng
tho
fsu
pra
no
dal
sip
ho
ns
ex
ceed
ing
30
0mm
.H
eig
ht
of
no
dal
fusi
on
s(i
ncl
ud
ing
cell
wal
ls)
exce
edin
g4
5m m
.W
idth
of
per
iph
eral
utr
icle
sexce
edin
g3
0mm
..
..
..
..
..
..
..
..
..
..
..
..
..
..
..
..
..
..
..
..
..
..
..
..
..
..
..
..
..
..
..
..
..
..
..
..
..
..
..
..
..
..
..
..
..
..
..
..
..
..
..
..
..
..
.H
.m
onile
12
bS
up
ran
od
alsi
ph
on
ssh
ort
erth
an3
00mm
.H
eig
ht
of
no
dal
fusi
on
sle
ssth
an4
5mm
.W
idth
of
per
iph
eral
utr
icle
sle
ssth
an3
5mm
..
..
..
..
..
..
..
..
.H
.st
upo
sa1
3a
Nu
mer
ou
scy
lin
dri
cal
seg
men
ts;
lon
ger
than
bro
ad.
Seg
men
tw
idth
smal
ler
than
the
resu
lto
f[1
0.8
3�
(seg
men
tth
ick
nes
s)�
15
.33
].
..
..
..
..
..
..
.H
.m
onile
13
bS
egm
ents
rare
lycy
lin
dri
cal;
of
vari
able
shap
e,o
ften
abou
tas
bro
adas
lon
go
rb
road
erth
anlo
ng
.S
egm
ent
wid
thb
igg
erth
anth
ere
sult
of
the
equ
atio
n.
..
.1
41
4a
Per
iph
eral
utr
icle
sexce
edin
g5
5mm
inh
eig
ht
and
40mm
inw
idth
.S
egm
ent
len
gth
ove
rw
idth
rati
oexce
edin
g0
.9.
Seg
men
tw
idth
less
than
5.7
mm
.S
egm
ent
thic
kn
ess
less
than
1m
m.
..
..
..
..
..
..
..
..
..
..
..
..
..
..
..
..
..
..
..
..
..
..
..
..
..
..
..
..
..
..
..
..
..
..
..
..
..
..
..
..
..
..
..
..
..
..
..
.1
51
4b
Per
iph
eral
utr
icle
sle
ssth
an5
5mm
inh
eig
ht,
rare
lyexce
edin
g4
0mm
inw
idth
.S
egm
ent
len
gth
ove
rw
idth
rati
ole
ssth
an0
.9.
Seg
men
tw
idth
ex
ceed
ing
5.7
mm
.S
egm
ent
thic
kn
ess
exce
edin
g0
.8m
m.
..
..
..
..
..
..
..
..
..
..
..
..
..
..
..
..
..
..
..
..
..
..
..
..
..
..
..
..
..
..
..
..
..
..
..
..
..
..
..
..
..
..
..
16
15
aA
ttac
hed
toro
cky
sub
stra
teb
ym
ean
so
fa
felt
yh
old
fast
dis
c.S
egm
ent
len
gth
ove
rw
idth
rati
oexce
edin
g0
.9.
Seg
men
tw
idth
less
than
6m
m.
Per
iph
eral
utr
icle
sre
ach
ing
less
than
45
%o
fth
eir
max
imal
wid
that
1/4
of
thei
rh
eig
ht
..
..
..
..
..
..
..
..
..
..
..
..
..
..
..
..
..
..
..
..
..
..
..
..
..
..
..
..
.H
.m
elan
esic
a1
5a
An
cho
red
insa
nd
by
mea
ns
of
ab
ulb
ou
sh
old
fast
com
po
sed
of
rhiz
oid
sw
ith
atta
ched
gra
ins
of
san
do
ran
cho
red
insi
ltb
ym
ean
so
fa
lon
g,
slen
der
tuft
of
rizo
ids.
Seg
men
tle
ng
tho
ver
wid
thra
tio
usu
ally
less
than
0.9
.Seg
men
tsg
ener
ally
bro
ader
than
6m
m.P
erip
her
alu
tric
les
usu
ally
exce
edin
g4
5%
of
thei
rm
axim
alw
idth
at1
/4o
fth
eir
hei
gh
t.
..
..
..
..
..
..
..
..
..
..
..
..
..
..
..
..
..
..
..
..
..
..
..
..
..
..
..
..
..
..
..
..
..
..
..
..
..
..
..
..
..
..
..
..
..
..
..
.H
.bo
rnee
nsi
s1
6a
Hei
gh
to
fp
erip
her
alu
tric
les
exce
edin
gth
ere
sult
of
[3�
(dia
met
ero
fm
edu
llar
sip
ho
ns)�
145
].
..
..
..
..
..
..
..
..
..
..
..
..
..
..
..
..
..
..
.H
.bo
rnee
nsi
s1
6b
Hei
gh
to
fp
erip
her
alu
tric
les
smal
ler
than
the
resu
lto
fth
eeq
uat
ion
..
..
..
..
..
..
..
..
..
..
..
..
..
..
..
..
..
..
..
..
..
..
..
..
..
..
..
..
..
H.
sim
ula
ns
Th
eco
rrec
tnes
so
fid
enti
fica
tio
ns
bas
edo
nth
iskey
isex
pec
ted
tod
ecre
ase
ifse
gm
ent
sele
ctio
nan
dm
easu
rem
ents
vio
late
the
follo
win
gg
uid
elin
es.J
uve
nile
spec
imen
sm
ust
be
avoid
ed.T
ense
gm
ents
mu
stb
ech
ose
nat
ran
do
mfr
om
the
cen
tral
reg
ion
of
the
spec
imen
(Ver
bru
ggen
etal
.2
005
b).
All
seg
men
tm
easu
rem
ents
mu
stb
eex
pre
ssed
inm
m,a
nd
the
med
ian
valu
eso
ver
the
10
seg
men
tsm
ust
be
use
din
the
key
.On
ese
gm
entfr
om
the
cen
tral
reg
ion
mu
stb
ed
isse
cted
acco
rdin
gto
Ver
bru
gg
enet
al.(
20
05a)
and
gu
idel
ines
inth
isst
ud
y.A
nat
om
ical
mea
sure
men
tsm
ust
be
tak
enin
10
-fo
ld(s
eeM
ater
ials
and
Met
ho
ds)
and
ex
pre
ssed
inmm
.T
he
med
ian
valu
eso
fth
ese
10
mea
sure
men
tsm
ust
be
use
din
the
key
.If
thes
ed
irec
tion
sar
en
ot
stri
ctly
follow
ed,
the
use
of
the
pre
sen
ted
key
isfu
nd
amen
tally
fau
lty.
DEFINING SPECIES BOUNDARIES IN HALIMEDA 615
alignments (Gomez-Zurita et al. 2000, Denduangbori-pant and Cronk 2001). Second, only a single phylo-genetic inference method was applied to the data (MP).It cannot be judged from our data that both clusterswithin H. incrassata 1 comply with the biological speciesconcept. In any case, the problem is merely one of spe-cies definitions and does not hinder taxonomic inferencefrom our morphometric data. Following the genotypiccluster species concept, H. incrassata 1a and 1b have beenretained as different species in our analyses.
The topological discordance between the rps3 andITS–5.8S–ITS2 trees is also of interest. The fact thatH. incrassata 1b is recovered within H. incrassata 1a inone tree and as the closest sister of the H. macroloba–incrassata 1a clade in the other tree could indicate re-ticulate speciation or incomplete lineage sorting (Avise2000). Our data do not allow identification of the dis-cordance’s cause. Verbruggen et al. (2005c) foundmultiple topological discordances in Halimeda sectionHalimeda, and we refer to their study for a more ela-borate discussion of putative reticulate evolutionwithin the genus Halimeda.
L_length
Freq
uenc
y (r
elat
ive
scal
e)
H. incrassata 2 H. incrassata 1b
H. incrassata 1a
0 1 2 3
− 4 − 3 − 2 − 1 0 1 2 3 4 5 6
canonical root 1
− 4
− 3
− 2
− 1
0
1
2
3
4
cano
nica
l roo
t 2
A
B
H. incrassata 1b
H. incrassata 1a
H. incrassata 2
segment length
FIG. 6. Discrimination between Halimeda incrassata entitiesusing segment morphological variables. (A) Canonical biplot ofDA with variables s7, s11–s19 (log-transformed when necessary).(B) Estimated distribution of variable L_length for the threeH. incrassata entities. All based on data set of median values.Symbols as in Figures 4 and 5.
− 6 − 4 − 2 0 2 4 6canonical root 1
− 6
− 4
− 2
0
2
4
6
cano
nica
l roo
t 2
H. incrassata 2H. incrassata 1a
H. incrassata 1b
L_p_surf
Freq
uenc
y (r
elat
ive
scal
e)
H. incrassata 1bH. incrassata 2 H. incrassata 1a
3.7 3.8 3.9 4.0 4.1 4.2 4.3 4.4
L_len_supr
Freq
uenc
y (r
elat
ive
scal
e)
5 5.25 5.5 5.75 6 6.25 6.5
H. incrassata 2
H. incrassata 1a H. incrassata 1b
A
B
C
surface diameter peripheral utricles
length of supranodal siphon
50 60 70 80 90 100 110p_height (µm)
40
50
60
70
80
p_w
idth
(µm
)
D
FIG. 7. Discrimination between Halimeda incrassata entitiesusing anatomical variables. (A) Canonical biplot of DA with(log-transformed) variables a1–a12, a14–a20. (B) Estimated dis-tribution of variable L_p_surf for the three H. incrassata entities.(C) Estimated distribution of variable L_len_supr for the threeentities. (D) Halimeda incrassata 1a and 2 observations separateperfectly using two variables associated with peripheral utricles.All plots based on data set of median values.
HEROEN VERBRUGGEN ET AL.616
Morphometrics. The identification problems listed inthe introduction are clearly reflected in PCA. Species inwhich identification problems are present or withinwhich cryptic diversity is contained show partial tocomplete overlap in the biplots of all major principalcomponents. This is particularly obvious in the ana-tomical biplot, where the data are polarized into twomajor species groups, each of which contains a set oftaxonomic problems. Given that the biplots representthe most obvious differences in the data, and thus re-flect the absence of obvious differences between prob-lem species, one should not be surprised that thesection under study has suffered from misidentifica-tions and taxonomic conservatism in the past.
The initial DAs shed light on the nature of similaritiesand differences between species. In the canonical biplotbased on segment morphological characters, problem-atic species pairs occupy overlapping areas. Clear-cutseparation of a few species in the first and seconddimension of the canonical biplot based on anatomy in-dicates that anatomical characters hold more conclusivedifferences. This is confirmed by the much higher classi-fication success of DA based on anatomical characters.
Separation of species using the data set of medianvalues is much more complete than with the data set of10 replicates per specimen, both for segment morpho-logical and anatomical data. This is not surprising: Byusing medians, only the most representative values areretained and the edges of the variable distributions areconsiderably narrowed, accentuating interspecific dif-ferences and downplaying intraindividual morpho-logical plasticity.
The conclusion of the explorative DA must be thatmorphological differences between species exist. Fromthe significance of interspecific Mahalanobis distancesand the success of classification tests, it can be conclud-ed that these differences are highly significant. ThatDA points to significant differences between speciesdoes not imply that these differences correspond tothose traditionally used in literature. It may even bethat the differences are so mathematically complexthat they cannot be translated into simple morpho-logical clues for future identifications.
The issue of future identification of specimens hasbeen approached in two ways. First, classification func-tions of DA offer a framework for probabilistic speciesidentification. Second, interpretation of additional DAon increasingly trimmed-down data sets leads to anidentification key. Before discussing these identifica-tion methods in more detail, a few taxonomic issuesthat could escape notice in the mathematical approachare stressed.
Taxonomic remarks. The principal character settingH. melanesica apart from species in section Rhipsalis isthe absence of nodal fusions and the matted holdfastin the former (Valet 1966, Hillis-Colinvaux 1980).With the discovery of small nodal fusions in H. me-lanesica, Noble (1987) stressed the blurring of theboundary between H. melanesica and H. incrassata.The present study sheds more light on the identity of
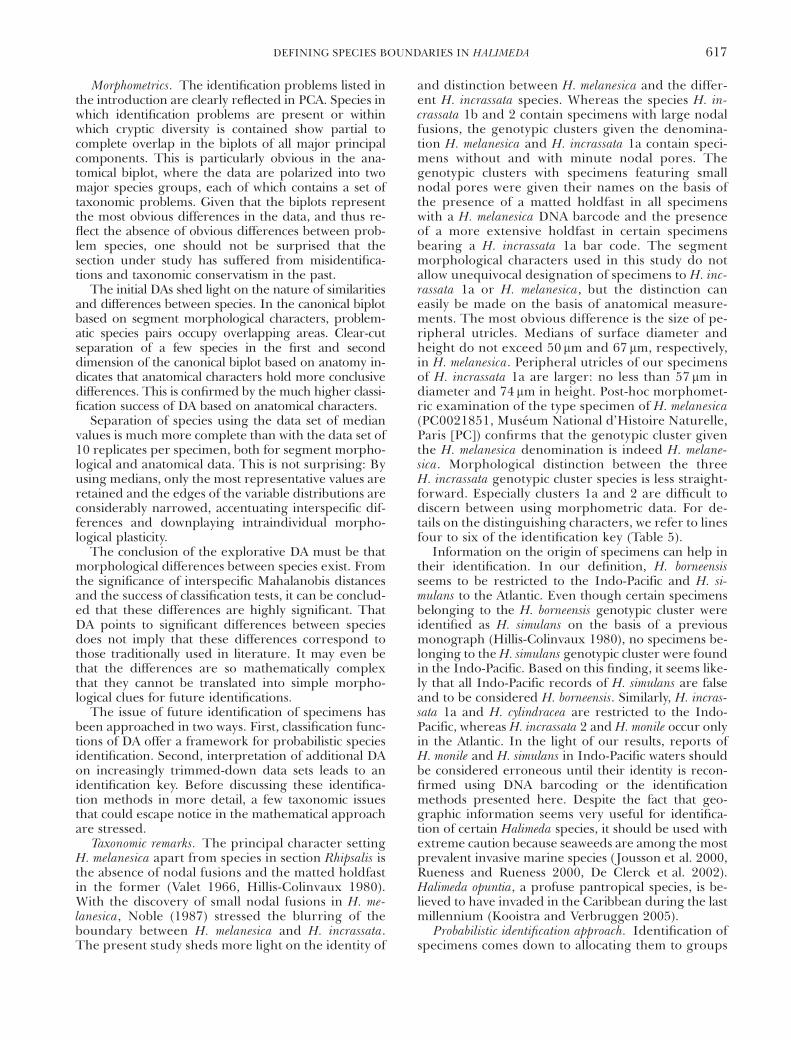
and distinction between H. melanesica and the differ-ent H. incrassata species. Whereas the species H. in-crassata 1b and 2 contain specimens with large nodalfusions, the genotypic clusters given the denomina-tion H. melanesica and H. incrassata 1a contain speci-mens without and with minute nodal pores. Thegenotypic clusters with specimens featuring smallnodal pores were given their names on the basis ofthe presence of a matted holdfast in all specimenswith a H. melanesica DNA barcode and the presenceof a more extensive holdfast in certain specimensbearing a H. incrassata 1a bar code. The segmentmorphological characters used in this study do notallow unequivocal designation of specimens to H. inc-rassata 1a or H. melanesica, but the distinction caneasily be made on the basis of anatomical measure-ments. The most obvious difference is the size of pe-ripheral utricles. Medians of surface diameter andheight do not exceed 50 mm and 67 mm, respectively,in H. melanesica. Peripheral utricles of our specimensof H. incrassata 1a are larger: no less than 57 mm indiameter and 74 mm in height. Post-hoc morphomet-ric examination of the type specimen of H. melanesica(PC0021851, Museum National d’Histoire Naturelle,Paris [PC]) confirms that the genotypic cluster giventhe H. melanesica denomination is indeed H. melane-sica. Morphological distinction between the threeH. incrassata genotypic cluster species is less straight-forward. Especially clusters 1a and 2 are difficult todiscern between using morphometric data. For de-tails on the distinguishing characters, we refer to linesfour to six of the identification key (Table 5).
Information on the origin of specimens can help intheir identification. In our definition, H. borneensisseems to be restricted to the Indo-Pacific and H. si-mulans to the Atlantic. Even though certain specimensbelonging to the H. borneensis genotypic cluster wereidentified as H. simulans on the basis of a previousmonograph (Hillis-Colinvaux 1980), no specimens be-longing to the H. simulans genotypic cluster were foundin the Indo-Pacific. Based on this finding, it seems like-ly that all Indo-Pacific records of H. simulans are falseand to be considered H. borneensis. Similarly, H. incras-sata 1a and H. cylindracea are restricted to the Indo-Pacific, whereas H. incrassata 2 and H. monile occur onlyin the Atlantic. In the light of our results, reports ofH. monile and H. simulans in Indo-Pacific waters shouldbe considered erroneous until their identity is recon-firmed using DNA barcoding or the identificationmethods presented here. Despite the fact that geo-graphic information seems very useful for identifica-tion of certain Halimeda species, it should be used withextreme caution because seaweeds are among the mostprevalent invasive marine species (Jousson et al. 2000,Rueness and Rueness 2000, De Clerck et al. 2002).Halimeda opuntia, a profuse pantropical species, is be-lieved to have invaded in the Caribbean during the lastmillennium (Kooistra and Verbruggen 2005).
Probabilistic identification approach. Identification ofspecimens comes down to allocating them to groups
DEFINING SPECIES BOUNDARIES IN HALIMEDA 617
at the specific rank in a taxonomic framework. Infer-ring the species to which a specimen belongs is amatter of following identification rules prescribedby systematists. In biological taxonomy, it usuallyconcerns morphological identification rules, andsystematists tend to compact such rules into dichot-omous identification keys that lead to unambiguous(absolute) allocation of specimens to species.
There are, however, alternative ways to approachidentification. On the one hand, the kind of data can bealtered (e.g. physiological properties, DNA barcodes).On the other hand, the identification rules can be pro-babilistic rather than absolute. This means that follow-ing the identification rules leads to probability valuesfor each species considered. In essence, absolute iden-tification is a mere variant of probabilistic identificationwith the probabilities for all but one species equal to 0and the probability of one species equal to 1. Probabi-listic methods are most often used if the charactersused do not allow absolute identification or when largeamounts of information have to be processed auto-matically (e.g. in clinical microbiology [Gyllenberg andKoski 2002, Kassama et al. 2002]).
We provide a probabilistic method of specimenidentification on the basis of anatomical measurementsfor species of Halimeda section Rhipsalis (Table 4). Ifmeasurements on new specimens are taken accordingto the methods described in this study and in Ver-bruggen et al. (2005a,b), the classification functionscan be used to calculate scores for each of the 10 spe-cies included in our morphometric analyses. The spe-cies obtaining the highest score is the taxon to whichthe specimen belongs with the highest probability.
Identification key construction. For the constructionof an identification key, further DAs were carried outon trimmed-down data sets. The identification keyincorporates traditional as well as morphometric dataand leads to 100% correct identifications for the spec-imens incorporated in this study.
The DAs expose the importance of characters forspecies differentiation. Segment morphological char-acters do not usually allow for delineation of species orgroups of species. This does not mean that segmentcharacteristics do not contain any useful informationbut that on the basis of segment data alone, one cannotmake the distinction between all species. Anatomicaldata provide much better diagnostic characters, vali-dating the results of Verbruggen et al. (2005a) andfurther stressing that the trend of increasing focus onanatomy for identification purposes continues. Anato-my is the key to discern between cryptic entities andlook-alikes. Therefore, identification based on super-ficial comparison is firmly discouraged.
Not all anatomical characters are equally importantfor species recognition. Especially peripheral utriclesyield taxonomically useful measurements, substantiat-ing the attention paid to these measurements by formersystematists. Nonetheless, certain measurements not orrarely used in previous taxonomic treatises prove use-ful in a number of cases. Examples are nodal fusion
height (a08), the distance between the nodal fusion andthe first ramification of the siphon above the node(a09), and diameter of medullar siphons (a01).
It is difficult to predict whether and how addition ofspecimens to our data set will influence the correctnessof the identification key. We have strived for repre-sentative sets of specimens of the different species,not avoiding specimens in the gray zone betweenmorpho-species. Certain species were included mere-ly to sketch a more complete picture even though theycan easily be recognized using classical characters (e.g.H. macroloba). On the other hand, certain species areunderrepresented in our data because they are rare orhighly geographically restricted (e.g. H. melanesica,H. stuposa). Whether or not the threshold values usedin the identification keys need to be updated whenincreasing numbers of specimens are added remainsan open question.
We are appreciative to the Bijzonder Onderzoeksfonds (GhentUniversity, grant 011D9101), the Fund for Scientific ResearchFlanders (grant 3G002496 and postdoctoral fellowship toO. D. C.), and the Leopold III Fund. We thank E. Cocquytfor her assistance with the molecular work. C. De maire andC. VanKerckhove are acknowledged for caring over theGENT herbarium collection and database and for assistancewith administration. We thank K. Page, H. Spalding, and P.Vroom for providing us with the Hawaiian H. incrassata spec-imens and L. de Senerpont-Domis and W. Prud’homme vanReine for a collection of Indonesian material. We thank K.Arano, M. A. Coffroth, P. Colinvaux, O. Dargent, G. De Smedt,F. Gurgel, O. A. Gussmann, I. Hendriks, L. Hillis, F. Leliaert,L. Liao, C. Payri, W. Prud’homme van Reine, M. van Veghel,B. Wysor, F. Zechman, and G. Zuccarello for various collec-tions. M. Wynne is acknowledged for sending the type mate-rial of H. borneensis. H. V. acknowledges Claude Payri, PainoVanai, and the Environmental Service of Wallis and Futuna forfacilitating fieldwork on Uvea Island. H. V. further thanksT. and C. Leigh, D. Olandesca, R. Diaz, and C. Galanza fortheir helping hands during expeditions. Two anonymousreviewers are acknowledged for their constructive remarks.
Alvarez, I. & Wendel, J. F. 2003. Ribosomal ITS sequences andplant phylogenetic inference. Mol. Phylogen. Evol. 29:417–34.
Avise, J. C. 2000. Phylogeography. The History and Formation of Species.Harvard University Press, Cambridge, MA, 447 pp.
Barton, E. S. 1901. The Genus Halimeda. Monographs of the SibogaExpedition. Vol. 60. Leiden, Brill, The Netherlands, 32 pp.
Baum, D. A. & Donoghue, M. J. 1995. Choosing among alternativephylogenetic species concepts. Syst. Bot. 20:560–73.
Besansky, N. J., Severson, D. W. & Ferdig, M. T. 2003. DNA bar-coding of parasites and invertebrate disease vectors: what youdon’t know can hurt you. Trends Parasitol. 19:545–6.
Cohen, S., Faugeron, S., Martinez, E. A., Correa, J. A., Viard, F.,Destombe, C. & Valero, M. 2004. Molecular identification oftwo sibling species under the name Gracilaria chilensis (Rho-dophyta, Gracilariales). J. Phycol. 40:742–7.
De Clerck, O., Anderson, R. J., Bolton, J. J. & Robertson-Anders-son, D. 2002. Schimmelmannia elegans (Gloiosiphoniaceae, Rho-dophyta): South Africa’s first introduced seaweed? Phycologia41:184–90.
De Clerck, O., Gavio, B., Fredericq, S. & Coppejans, E. 2005.Systematics of Grateloupia filicina (Halymeniaceae, Rhodo-phyta), based on rbcL sequence analyses and morphologicalevidence, including the reinstatement of G. minima and thedescription of G. capensis spec. nov. J. Phycol. 41:391–410.
HEROEN VERBRUGGEN ET AL.618
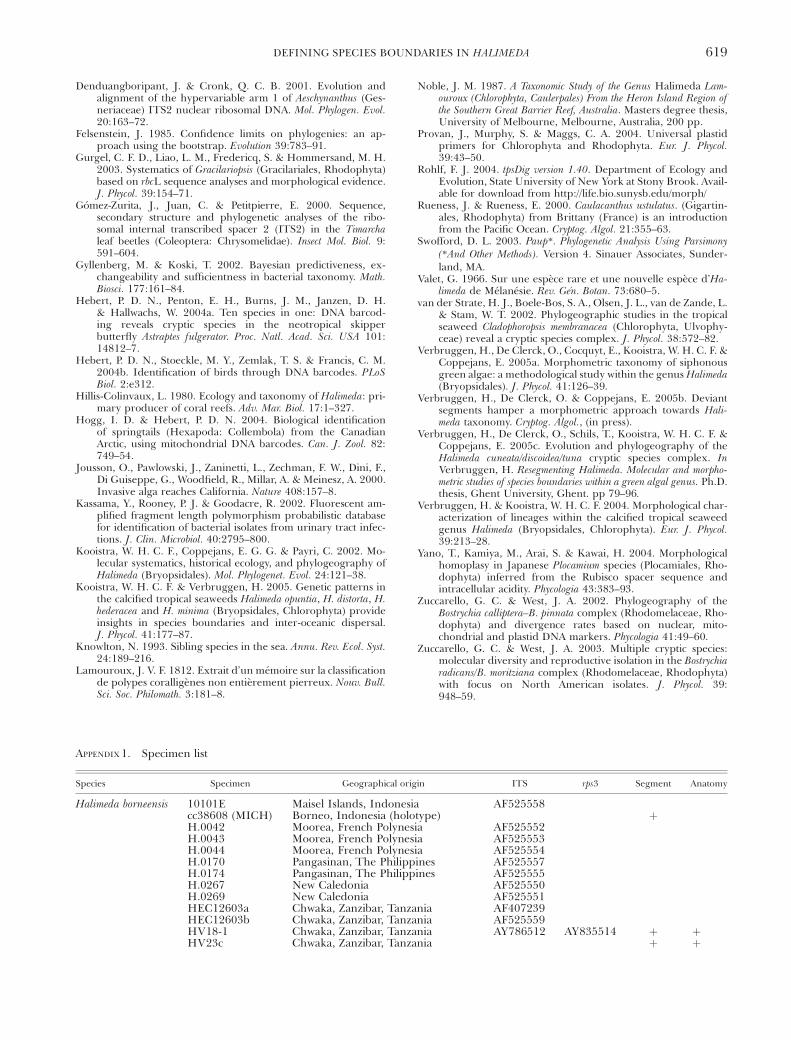
Denduangboripant, J. & Cronk, Q. C. B. 2001. Evolution andalignment of the hypervariable arm 1 of Aeschynanthus (Ges-neriaceae) ITS2 nuclear ribosomal DNA. Mol. Phylogen. Evol.20:163–72.
Felsenstein, J. 1985. Confidence limits on phylogenies: an ap-proach using the bootstrap. Evolution 39:783–91.
Gurgel, C. F. D., Liao, L. M., Fredericq, S. & Hommersand, M. H.2003. Systematics of Gracilariopsis (Gracilariales, Rhodophyta)based on rbcL sequence analyses and morphological evidence.J. Phycol. 39:154–71.
Gomez-Zurita, J., Juan, C. & Petitpierre, E. 2000. Sequence,secondary structure and phylogenetic analyses of the ribo-somal internal transcribed spacer 2 (ITS2) in the Timarchaleaf beetles (Coleoptera: Chrysomelidae). Insect Mol. Biol. 9:591–604.
Gyllenberg, M. & Koski, T. 2002. Bayesian predictiveness, ex-changeability and sufficientness in bacterial taxonomy. Math.Biosci. 177:161–84.
Hebert, P. D. N., Penton, E. H., Burns, J. M., Janzen, D. H.& Hallwachs, W. 2004a. Ten species in one: DNA barcod-ing reveals cryptic species in the neotropical skipperbutterfly Astraptes fulgerator. Proc. Natl. Acad. Sci. USA 101:14812–7.
Hebert, P. D. N., Stoeckle, M. Y., Zemlak, T. S. & Francis, C. M.2004b. Identification of birds through DNA barcodes. PLoSBiol. 2:e312.
Hillis-Colinvaux, L. 1980. Ecology and taxonomy of Halimeda: pri-mary producer of coral reefs. Adv. Mar. Biol. 17:1–327.
Hogg, I. D. & Hebert, P. D. N. 2004. Biological identificationof springtails (Hexapoda: Collembola) from the CanadianArctic, using mitochondrial DNA barcodes. Can. J. Zool. 82:749–54.
Jousson, O., Pawlowski, J., Zaninetti, L., Zechman, F. W., Dini, F.,Di Guiseppe, G., Woodfield, R., Millar, A. & Meinesz, A. 2000.Invasive alga reaches California. Nature 408:157–8.
Kassama, Y., Rooney, P. J. & Goodacre, R. 2002. Fluorescent am-plified fragment length polymorphism probabilistic databasefor identification of bacterial isolates from urinary tract infec-tions. J. Clin. Microbiol. 40:2795–800.
Kooistra, W. H. C. F., Coppejans, E. G. G. & Payri, C. 2002. Mo-lecular systematics, historical ecology, and phylogeography ofHalimeda (Bryopsidales). Mol. Phylogenet. Evol. 24:121–38.
Kooistra, W. H. C. F. & Verbruggen, H. 2005. Genetic patterns inthe calcified tropical seaweeds Halimeda opuntia, H. distorta, H.hederacea and H. minima (Bryopsidales, Chlorophyta) provideinsights in species boundaries and inter-oceanic dispersal.J. Phycol. 41:177–87.
Knowlton, N. 1993. Sibling species in the sea. Annu. Rev. Ecol. Syst.24:189–216.
Lamouroux, J. V. F. 1812. Extrait d’un memoire sur la classificationde polypes coralligenes non entierement pierreux. Nouv. Bull.Sci. Soc. Philomath. 3:181–8.
Noble, J. M. 1987. A Taxonomic Study of the Genus Halimeda Lam-ouroux (Chlorophyta, Caulerpales) From the Heron Island Region ofthe Southern Great Barrier Reef, Australia. Masters degree thesis,University of Melbourne, Melbourne, Australia, 200 pp.
Provan, J., Murphy, S. & Maggs, C. A. 2004. Universal plastidprimers for Chlorophyta and Rhodophyta. Eur. J. Phycol.39:43–50.
Rohlf, F. J. 2004. tpsDig version 1.40. Department of Ecology andEvolution, State University of New York at Stony Brook. Avail-able for download from http://life.bio.sunysb.edu/morph/
Rueness, J. & Rueness, E. 2000. Caulacanthus ustulatus. (Gigartin-ales, Rhodophyta) from Brittany (France) is an introductionfrom the Pacific Ocean. Cryptog. Algol. 21:355–63.
Swofford, D. L. 2003. Paup*. Phylogenetic Analysis Using Parsimony(*And Other Methods). Version 4. Sinauer Associates, Sunder-land, MA.
Valet, G. 1966. Sur une espece rare et une nouvelle espece d’Ha-limeda de Melanesie. Rev. Gen. Botan. 73:680–5.
van der Strate, H. J., Boele-Bos, S. A., Olsen, J. L., van de Zande, L.& Stam, W. T. 2002. Phylogeographic studies in the tropicalseaweed Cladophoropsis membranacea (Chlorophyta, Ulvophy-ceae) reveal a cryptic species complex. J. Phycol. 38:572–82.
Verbruggen, H., De Clerck, O., Cocquyt, E., Kooistra, W. H. C. F. &Coppejans, E. 2005a. Morphometric taxonomy of siphonousgreen algae: a methodological study within the genus Halimeda(Bryopsidales). J. Phycol. 41:126–39.
Verbruggen, H., De Clerck, O. & Coppejans, E. 2005b. Deviantsegments hamper a morphometric approach towards Hali-meda taxonomy. Cryptog. Algol., (in press).
Verbruggen, H., De Clerck, O., Schils, T., Kooistra, W. H. C. F. &Coppejans, E. 2005c. Evolution and phylogeography of theHalimeda cuneata/discoidea/tuna cryptic species complex. InVerbruggen, H. Resegmenting Halimeda. Molecular and morpho-metric studies of species boundaries within a green algal genus. Ph.D.thesis, Ghent University, Ghent. pp 79–96.
Verbruggen, H. & Kooistra, W. H. C. F. 2004. Morphological char-acterization of lineages within the calcified tropical seaweedgenus Halimeda (Bryopsidales, Chlorophyta). Eur. J. Phycol.39:213–28.
Yano, T., Kamiya, M., Arai, S. & Kawai, H. 2004. Morphologicalhomoplasy in Japanese Plocamium species (Plocamiales, Rho-dophyta) inferred from the Rubisco spacer sequence andintracellular acidity. Phycologia 43:383–93.
Zuccarello, G. C. & West, J. A. 2002. Phylogeography of theBostrychia calliptera–B. pinnata complex (Rhodomelaceae, Rho-dophyta) and divergence rates based on nuclear, mito-chondrial and plastid DNA markers. Phycologia 41:49–60.
Zuccarello, G. C. & West, J. A. 2003. Multiple cryptic species:molecular diversity and reproductive isolation in the Bostrychiaradicans/B. moritziana complex (Rhodomelaceae, Rhodophyta)with focus on North American isolates. J. Phycol. 39:948–59.
APPENDIX 1. Specimen list
Species Specimen Geographical origin ITS rps3 Segment Anatomy
Halimeda borneensis 10101E Maisel Islands, Indonesia AF525558cc38608 (MICH) Borneo, Indonesia (holotype) þH.0042 Moorea, French Polynesia AF525552H.0043 Moorea, French Polynesia AF525553H.0044 Moorea, French Polynesia AF525554H.0170 Pangasinan, The Philippines AF525557H.0174 Pangasinan, The Philippines AF525555H.0267 New Caledonia AF525550H.0269 New Caledonia AF525551HEC12603a Chwaka, Zanzibar, Tanzania AF407239HEC12603b Chwaka, Zanzibar, Tanzania AF525559HV18-1 Chwaka, Zanzibar, Tanzania AY786512 AY835514 þ þHV23c Chwaka, Zanzibar, Tanzania þ þ
DEFINING SPECIES BOUNDARIES IN HALIMEDA 619
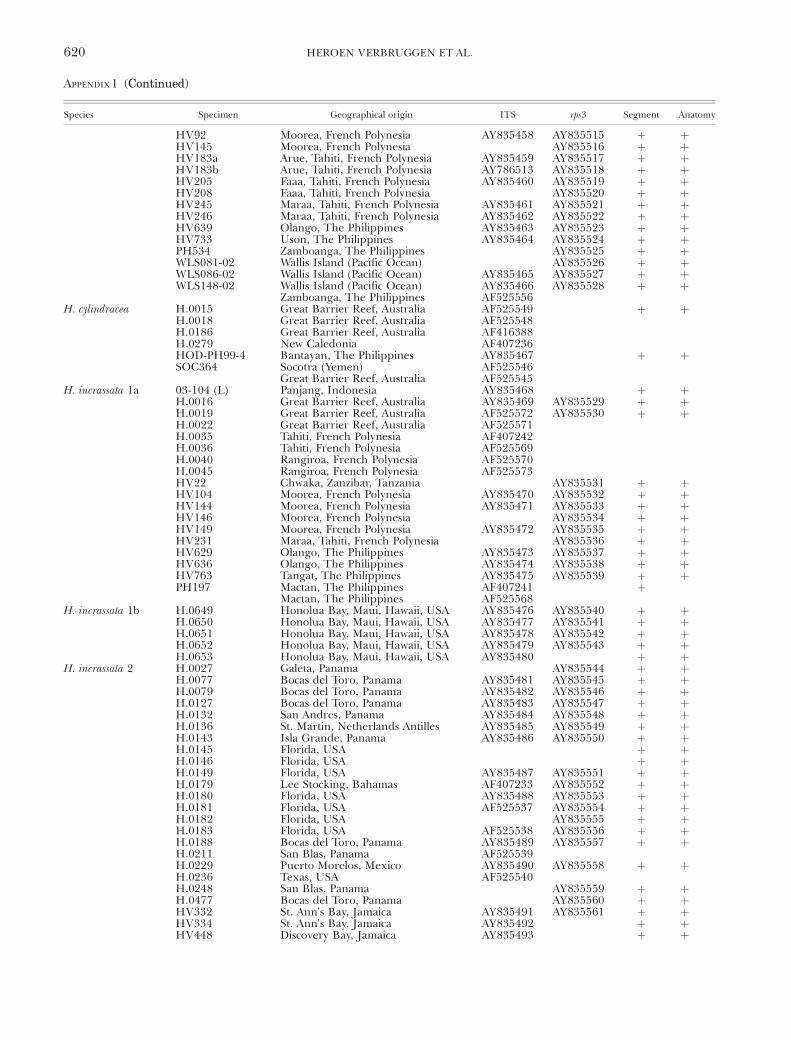
APPENDIX1 (Continued)
Species Specimen Geographical origin ITS rps3 Segment Anatomy
HV92 Moorea, French Polynesia AY835458 AY835515 þ þHV145 Moorea, French Polynesia AY835516 þ þHV183a Arue, Tahiti, French Polynesia AY835459 AY835517 þ þHV183b Arue, Tahiti, French Polynesia AY786513 AY835518 þ þHV205 Faaa, Tahiti, French Polynesia AY835460 AY835519 þ þHV208 Faaa, Tahiti, French Polynesia AY835520 þ þHV245 Maraa, Tahiti, French Polynesia AY835461 AY835521 þ þHV246 Maraa, Tahiti, French Polynesia AY835462 AY835522 þ þHV639 Olango, The Philippines AY835463 AY835523 þ þHV733 Uson, The Philippines AY835464 AY835524 þ þPH534 Zamboanga, The Philippines AY835525 þ þWLS081-02 Wallis Island (Pacific Ocean) AY835526 þ þWLS086-02 Wallis Island (Pacific Ocean) AY835465 AY835527 þ þWLS148-02 Wallis Island (Pacific Ocean) AY835466 AY835528 þ þ
Zamboanga, The Philippines AF525556H. cylindracea H.0015 Great Barrier Reef, Australia AF525549 þ þ
H.0018 Great Barrier Reef, Australia AF525548H.0186 Great Barrier Reef, Australia AF416388H.0279 New Caledonia AF407236HOD-PH99-4 Bantayan, The Philippines AY835467 þ þSOC364 Socotra (Yemen) AF525546
Great Barrier Reef, Australia AF525545H. incrassata 1a 03-104 (L) Panjang, Indonesia AY835468 þ þ
H.0016 Great Barrier Reef, Australia AY835469 AY835529 þ þH.0019 Great Barrier Reef, Australia AF525572 AY835530 þ þH.0022 Great Barrier Reef, Australia AF525571H.0035 Tahiti, French Polynesia AF407242H.0036 Tahiti, French Polynesia AF525569H.0040 Rangiroa, French Polynesia AF525570H.0045 Rangiroa, French Polynesia AF525573HV22 Chwaka, Zanzibar, Tanzania AY835531 þ þHV104 Moorea, French Polynesia AY835470 AY835532 þ þHV144 Moorea, French Polynesia AY835471 AY835533 þ þHV146 Moorea, French Polynesia AY835534 þ þHV149 Moorea, French Polynesia AY835472 AY835535 þ þHV231 Maraa, Tahiti, French Polynesia AY835536 þ þHV629 Olango, The Philippines AY835473 AY835537 þ þHV636 Olango, The Philippines AY835474 AY835538 þ þHV763 Tangat, The Philippines AY835475 AY835539 þ þPH197 Mactan, The Philippines AF407241 þ
Mactan, The Philippines AF525568H. incrassata 1b H.0649 Honolua Bay, Maui, Hawaii, USA AY835476 AY835540 þ þ
H.0650 Honolua Bay, Maui, Hawaii, USA AY835477 AY835541 þ þH.0651 Honolua Bay, Maui, Hawaii, USA AY835478 AY835542 þ þH.0652 Honolua Bay, Maui, Hawaii, USA AY835479 AY835543 þ þH.0653 Honolua Bay, Maui, Hawaii, USA AY835480 þ þ
H. incrassata 2 H.0027 Galeta, Panama AY835544 þ þH.0077 Bocas del Toro, Panama AY835481 AY835545 þ þH.0079 Bocas del Toro, Panama AY835482 AY835546 þ þH.0127 Bocas del Toro, Panama AY835483 AY835547 þ þH.0132 San Andres, Panama AY835484 AY835548 þ þH.0136 St. Martin, Netherlands Antilles AY835485 AY835549 þ þH.0143 Isla Grande, Panama AY835486 AY835550 þ þH.0145 Florida, USA þ þH.0146 Florida, USA þ þH.0149 Florida, USA AY835487 AY835551 þ þH.0179 Lee Stocking, Bahamas AF407233 AY835552 þ þH.0180 Florida, USA AY835488 AY835553 þ þH.0181 Florida, USA AF525537 AY835554 þ þH.0182 Florida, USA AY835555 þ þH.0183 Florida, USA AF525538 AY835556 þ þH.0188 Bocas del Toro, Panama AY835489 AY835557 þ þH.0211 San Blas, Panama AF525539H.0229 Puerto Morelos, Mexico AY835490 AY835558 þ þH.0236 Texas, USA AF525540H.0248 San Blas, Panama AY835559 þ þH.0477 Bocas del Toro, Panama AY835560 þ þHV332 St. Ann’s Bay, Jamaica AY835491 AY835561 þ þHV334 St. Ann’s Bay, Jamaica AY835492 þ þHV448 Discovery Bay, Jamaica AY835493 þ þ
HEROEN VERBRUGGEN ET AL.620
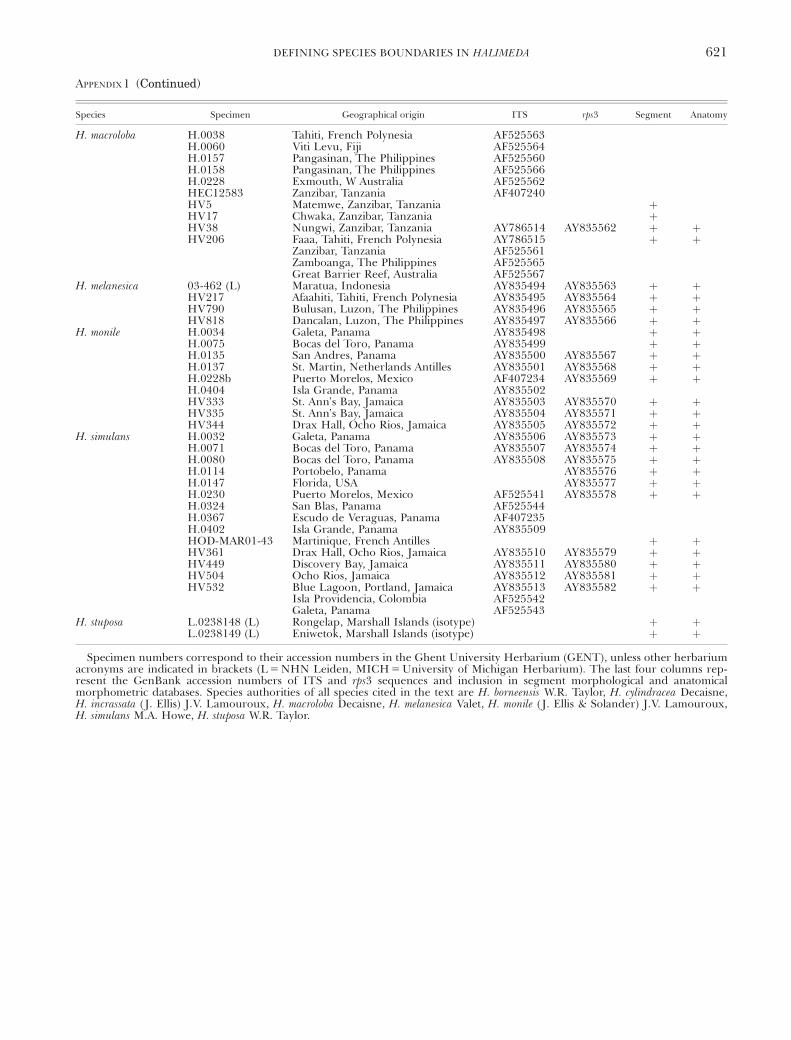
APPENDIX1 (Continued)
Species Specimen Geographical origin ITS rps3 Segment Anatomy
H. macroloba H.0038 Tahiti, French Polynesia AF525563H.0060 Viti Levu, Fiji AF525564H.0157 Pangasinan, The Philippines AF525560H.0158 Pangasinan, The Philippines AF525566H.0228 Exmouth, W Australia AF525562HEC12583 Zanzibar, Tanzania AF407240HV5 Matemwe, Zanzibar, Tanzania þHV17 Chwaka, Zanzibar, Tanzania þHV38 Nungwi, Zanzibar, Tanzania AY786514 AY835562 þ þHV206 Faaa, Tahiti, French Polynesia AY786515 þ þ
Zanzibar, Tanzania AF525561Zamboanga, The Philippines AF525565Great Barrier Reef, Australia AF525567
H. melanesica 03-462 (L) Maratua, Indonesia AY835494 AY835563 þ þHV217 Afaahiti, Tahiti, French Polynesia AY835495 AY835564 þ þHV790 Bulusan, Luzon, The Philippines AY835496 AY835565 þ þHV818 Dancalan, Luzon, The Philippines AY835497 AY835566 þ þ
H. monile H.0034 Galeta, Panama AY835498 þ þH.0075 Bocas del Toro, Panama AY835499 þ þH.0135 San Andres, Panama AY835500 AY835567 þ þH.0137 St. Martin, Netherlands Antilles AY835501 AY835568 þ þH.0228b Puerto Morelos, Mexico AF407234 AY835569 þ þH.0404 Isla Grande, Panama AY835502HV333 St. Ann’s Bay, Jamaica AY835503 AY835570 þ þHV335 St. Ann’s Bay, Jamaica AY835504 AY835571 þ þHV344 Drax Hall, Ocho Rios, Jamaica AY835505 AY835572 þ þ
H. simulans H.0032 Galeta, Panama AY835506 AY835573 þ þH.0071 Bocas del Toro, Panama AY835507 AY835574 þ þH.0080 Bocas del Toro, Panama AY835508 AY835575 þ þH.0114 Portobelo, Panama AY835576 þ þH.0147 Florida, USA AY835577 þ þH.0230 Puerto Morelos, Mexico AF525541 AY835578 þ þH.0324 San Blas, Panama AF525544H.0367 Escudo de Veraguas, Panama AF407235H.0402 Isla Grande, Panama AY835509HOD-MAR01-43 Martinique, French Antilles þ þHV361 Drax Hall, Ocho Rios, Jamaica AY835510 AY835579 þ þHV449 Discovery Bay, Jamaica AY835511 AY835580 þ þHV504 Ocho Rios, Jamaica AY835512 AY835581 þ þHV532 Blue Lagoon, Portland, Jamaica AY835513 AY835582 þ þ
Isla Providencia, Colombia AF525542Galeta, Panama AF525543
H. stuposa L.0238148 (L) Rongelap, Marshall Islands (isotype) þ þL.0238149 (L) Eniwetok, Marshall Islands (isotype) þ þ
Specimen numbers correspond to their accession numbers in the Ghent University Herbarium (GENT), unless other herbariumacronyms are indicated in brackets (L 5 NHN Leiden, MICH 5 University of Michigan Herbarium). The last four columns rep-resent the GenBank accession numbers of ITS and rps3 sequences and inclusion in segment morphological and anatomicalmorphometric databases. Species authorities of all species cited in the text are H. borneensis W.R. Taylor, H. cylindracea Decaisne,H. incrassata (J. Ellis) J.V. Lamouroux, H. macroloba Decaisne, H. melanesica Valet, H. monile (J. Ellis & Solander) J.V. Lamouroux,H. simulans M.A. Howe, H. stuposa W.R. Taylor.
DEFINING SPECIES BOUNDARIES IN HALIMEDA 621
Related Documents


![[164] pinpoint](https://static.cupdf.com/doc/110x72/587065dc1a28ab48378b4f79/164-pinpoint.jpg)


