W O RK I N G T O G E T H E R F O R A S U S TA I N A B L E F U T U R E MOIRA SHIRE COUNCIL BUDGET REPORT - 2015/2016 ADOPTED 29 JUNE 2015 This Budget Report has been prepared with reference to Chartered Accountants Australia and New Zealand “Victorian City Council Model Budget 2015/2016” a best practice guide for reporting local government budgets in Victoria. This version of this Model Budget reflects the authorised version of the Local Government (Planning and Reporting) Regulations which were made in April 2014 following a public submission process. The new Regulations commenced operation on 18 April 2014.

Welcome message from author
This document is posted to help you gain knowledge. Please leave a comment to let me know what you think about it! Share it to your friends and learn new things together.
Transcript

WORKING TOGETHER FOR A SUSTAINABLE FUTURE
MOIRA SHIRE COUNCILBUDGET REPORT - 2015/2016
ADOPTED 29 JUNE 2015
This Budget Report has been prepared with reference to Chartered Accountants Australia and New Zealand
“Victorian City Council Model Budget 2015/2016” a best practice guide for reporting local government budgets in Victoria.
This version of this Model Budget reflects the authorised version of the Local Government (Planning and Reporting)
Regulations which were made in April 2014 following a public submission process.
The new Regulations commenced operation on 18 April 2014.

PAGE 1 OF 72
TABLE OF CONTENTS
Mayor’s Introduction 2
Chief Executive Officer’s Summary 3
Budget Processes 8
Overview 11
Linkage to the Council Plan
Services, initiatives and service performance indicators
Budget Influences
Budget analysis 27
Analysis of operating budget
Analysis of budgeted cash position
Analysis of capital budget
Analysis of budgeted financial position
Long term strategies 56
Strategic resource plan and financial performance indicators
Rating information
Summary of Other Strategies
Appendices 71
A Financial Statements
B Rates and Charges
C Capital Works Program
D Fees and Charges Schedule

PAGE 2 OF 72
Mayor’s Introduction
It gives me great pleasure to present this Budget to the community of Moira Shire.
Moira Shire’s 2015/16 Budget reflects the strategic goals and objectives contained within our 2013-2017 Council Plan. Our Budget recognizes that after more than three years and $50 million of flood, fire and tornado recovery works, Moira Shire’s underlying financial position is stable. However we have little buffer to address the immediate financial pressures created by the reduction in 2015/16 government grant funding, and the additional challenges that will follow in future years with the introduction of rate capping from 2016/17.
The Budget supports Moira’s adjustment to a challenging financial operating environment by:
Freezing operating expenditure at 2014/15 levels except where legal commitments such as
existing contracts, Enterprise Agreements and construction standards obligate Council to fund
increases;
Not increasing Council borrowings and continuing to pay down existing debt in accordance with
the repayment schedules;
Restricting increases in Council user fees and charges to CPI (2.6%);
No increase to kerbside organic waste collection service however the charge will apply for the full
year.
To maintain service levels to the community within these constraints, the 2015/16 Budget proposes:
an increase of 4% in general rates, municipal and waste charges;
a capital investment program of $11.57 million which includes $1.65 million of new initiatives and
$1.50 million of projects carried over from 2014/15 financial year
The rate increase in line with the principles outlined above is sufficient to meet required service levels and capital works activities. With the commencement of rate capping in 2016/17 rates are projected to increase by 2.6%.
Highlights of the capital works program include:
‘Renewal’ projects totalling: $6 6m
‘Upgrade’ projects totalling: $2.35m
‘Expansion’ projects totalling: $2.58m including Cobram Library $1.6m.
This budget was developed through a rigorous process of consultation and review and Council endorses it as financially responsible.
Councillor Marie Martin, Mayor

PAGE 3 OF 72
Chief Executive Officer’s Summary
Council has prepared a Budget for the 2015/16 financial year which seeks to balance the demand for services and infrastructure with the community’s capacity to pay. Key budget information is provided below about the rate increase, operating result, services, cash and investments, capital works, financial position, financial sustainability and strategic objectives of the Council.
1. Rates & Charges
Council’s required general rate and municipal charge revenue from 2015/16 is $33.25m. This represents a 4% increase in rates over 2014/15. The revenue generated through this rate increase will go towards major capital works programs such as maintaining roads and bridges, drainage improvements, maintaining service to the community in general and meeting the cost of a number of external influences, such as the increase in insurance.

PAGE 4 OF 72
2. Operating result
The total operating result for 2015/16 is a $1.85m surplus which represents a decrease of $0.98m in surplus over 2014/15. Main reasons being, lower increase in rate revenue in preparation for rate capping, reduction in grant funding year on year combined with absorbing CPI increases in contractual arrangements.
3. Services
The net cost of services delivered to the community for the 2015/16 year is expected to be $35.64m an increase of $1.58m on 2014/15. This is primarily due to increases in contract related costs. The net cost of services is the total operating cost of services delivered less income directly attributable to those services, such as fees.
6.44
2.84
1.85
0.71
-0.75
0.00
-2
-1
0
1
2
3
4
5
6
7
A 2013/14 F2014/15 B2015/16 SRP2016/17 SRP2017/18 SRP2018/19
Millio
ns

PAGE 5 OF 72
4. Cash and Investments
Cash and investments are expected to decrease by $0.99m during the year 2015/16 to $13.66m as at 30 June 2016. This net cash outflow reduction is mainly due to the need for Council to fund $6.24m of Capital budget for 2015/16.
5. Capital Works
The capital works program for the 2015/16 year is expected to be $11.57m. This includes projects funded in prior years carried forward into 2015/16 of $1.50m. The capital expenditure program has been set and prioritized based on a rigorous process of professional review using Council’s Projects Assessment Committee and consultation. This has enabled Council to assess needs and develop sound business cases for each project. Below is a summary of the capital works program by asset class.
7.30
10.89 11.57 11.10 11.54
10.64
-
2
4
6
8
10
12
14
A 2013/14 F2014/15 B2015/16 SRP2016/17 SRP2017/18 SRP2018/19
Mill
ion
s
CAPITAL EXPENDITURE YEAR-ON-YEAR COMPARISONS

PAGE 6 OF 72
The graph below sets out the required and actual renewal over the life the current Strategic Resource Plan.
6. Financial position
Net assets (net worth) will increase by $1.86m as at 30 June 2016, which is mainly due to the increase in fixed assets offset by repayment of bank borrowings.
494.66
497.50
499.35
500.06
499.31 499.32
491
492
493
494
495
496
497
498
499
500
501
A 2013/14 F2014/15 B2015/16 SRP2016/17 SRP2017/18 SRP2018/19
Mill
ion
s
FINANCIAL POSITION (NET WORTH) YEAR-ON-YEAR COMPARISONS

PAGE 7 OF 72
7. Financial sustainability
A high level Strategic Resource Plan for the years 2014/15 to 2016/17 has been developed to assist Council in adopting a budget within a longer term prudent financial framework.
The key objective of the Plan is financial sustainability in the medium to long term, while still achieving the Council’s strategic objectives as specified in the Council Plan.
The underlying result is a measure of financial sustainability. This measure is the operating result reduced for the contributed assets as a percentage of the underlying revenue, which is total revenue plus proceeds of sale of assets less contributed assets. Council projects a decreasing underlying surplus for 2015/16.
8. Strategic objectives
9.91
4.92
3.04
0.93
(1.72)
(0.34)
-4.00
-2.00
0.00
2.00
4.00
6.00
8.00
10.00
12.00
A 2013/14 F2014/15 B2015/16 SRP2016/17 SRP2017/18 SRP2018/19
Pe
rce
nta
ge
UNDERLYING RESULT YEAR-ON-YEAR COMPARISONS

PAGE 8 OF 72
The annual budget included a range of service and initiatives to be funded that will contribute to achieving the strategic objectives specified in the Council Plan. The above graph show the level of funding allocated in the budget to achieve the strategic objectives as set out in the Council Plan for the 2015/16 year
9. Council Expenditure Allocations
The above chart provides an indication of how council allocates its expenditure across the main services that it delivers. It shows how much is allocated to each service area for every $100 that Council spends.
This budget has been developed through a rigorous process of consultation and review and management endorses it as financially responsible. More detailed budget information is available throughout this document.
Mark Henderson Chief Executive Officer

PAGE 9 OF 72
Budget processes
This section lists the steps to adopt the Budget in accordance with the Local Government Act 1989 (the Act) and Local Government (Planning and Reporting) Regulations 2014 (the Regulations). Under the Act, Council is required to prepare and adopt an annual budget for each financial year. The budget must include information about the rates and charges that Council intends to levy as well as a range of other information required by the Regulations which support the Act.
The 2015/16 budget, which is included in this report, is for the year 1 July 2015 to 30 June 2016 and is prepared in accordance with the Act and Regulations. The budget includes financial statements - Comprehensive Income Statement, Balance Sheet, Statement of Changes in Equity, Statement of Cash Flows and Statement of Capital Works. These statements have been prepared for the year ending 30 June 2016 in accordance with the Act and Regulations, and consistent with the annual financial statements which are prepared in accordance with Australian Accounting Standards. The budget also includes information about the rates and charges to be levied, the p ropos ed capital works program, the human resources required, and other financial information Council requires in order to make an informed decision about the adoption of the budget. In advance of preparing the budget, Officers firstly review and update Council's long term financial projections. Financial projections for at least four years are ultimately included in Council's Strategic Resource Plan, which is the key medium-term financial plan produced by Council on a rolling basis. The preparation of the budget, within this broader context, begins with Officers preparing the operating and capital components of the annual budget during January and February. A draft consolidated budget is then prepared and various iterations are considered by Council at informal briefings during March and April. During 2015/16 Moira Shire introduced a rigorous Project Assessment process for all new projects, programs and initiatives proposed for inclusion in the 2015/16 Budget. The assessment process considers the immediate and longer time costs, risks and benefits of each proposal and assigns a score. The scores were used to prioritise the project proposals for inclusion in the 2015/16 Budget. A ‘proposed’ budget was prepared in accordance with the Act and submitted to Council in May for approval ’in principle’. Council is then required to give ’public notice’ that it intends to ’adopt’ the budget. It must give 28 days notice of its intention to adopt the proposed budget and make the budget available for inspection at its offices and on its web site. A person has a right to make a submission on any proposal contained in the budget and any submission must be considered before adoption of the budget by Council. The final step is for Council to adopt the budget after receiving and considering any submissions from interested parties. The budget is required to be adopted by 30 June and a copy submitted to the Minister within 28 days after adoption. The key dates for the budget process are summarised below:

PAGE 10 OF 72
Budget process Timing
1. Proposed budget submitted to Council for approval April
2. Public notice advising Council has prepared draft budget and it is on public display for 28 days
April
3. Budget available for public inspection and comment April
4. Submissions period closes May
5. Submissions considered by Special meeting of Council June
6. Budget and submissions presented to Ordinary meeting of Council for adoption
June
7. Copy of adopted budget to be submitted to the Minister July

PAGE 11 OF 72
Overview
1. Linkage to the Council Plan
This section describes how the Annual Budget links to the achievement of the Council Plan within an overall planning and reporting framework. This framework guides the Council in identifying community needs and aspirations over the medium term (Council Plan) and short term (Annual Budget) and then holding itself accountable (Annual Report).
1.1 Planning and accountability framework
The Strategic Resource Plan, part of and prepared in conjunction with the Council Plan, is a rolling four year plan that outlines the financial and non-financial resources that Council requires to achieve the strategic objectives described in the Council Plan. The Annual Budget is framed within the Strategic Resource Plan, taking into account the services and initiatives which contribute to achieving the strategic objectives specified in the Council Plan. The diagram below depicts the planning and accountability framework that applies to local government in Victoria.
Source: Department of Environment, Land, Water and Planning (formerly Department of Transport, Planning and Local Infrastructure)
The timing of each component of the planning framework is critical to the successful achievement of the planned outcomes. The Council Plan, including the Strategic Resource Plan, is required to be completed by 30 June following a general election and is reviewed each year in advance of the commencement of the Annual Budget process. Council adopted an updated 2013-2017 Council Plan at the June Council Meeting.

PAGE 12 OF 72
1.2 Our purpose
Vision Moira on the Murray; with an environmentally, economically and socially sustainable community: the best place to be. Mission To serve our community through transparent open governance, active engagement, strong advocacy and the provision of affordable services. Core Values Ethical leadership underpins Council’s decision making and operations. At all levels, Council seeks to ensure there is an appropriate balance between the values-based organisational culture described by our Core Values and enforcing relevant controls. Community, honesty, innovation, integrity, responsibility, responsiveness, trust, leadership and accountability.
1.3 Strategic Objectives
Our Council Plan gives priority to three strategic goals that enable the Moira Shire Council in partnership with our community to meet our challenges and strengthen Moira’s economic and social wellbeing: 1. Strong regional partnerships
2. Improve Moira’s Liveability
3. Build on our economic strengths in agriculture, manufacturing and tourism
Our ability to realise these strategic goals will depend on four enabling objectives:
4. Smarter delivery of existing services and programs
5. Delivering sound financial management
6. Involving and communicating with our community
7. Demonstrating good governance
8. Rebalancing Moira’s asset mix
Collectively the strategic goals and enabling objectives represent Council’s Strategic Objectives as set out in the Council Plan for the years 2013-17.
Council delivers services and initiatives to support three strategic goals and five enabling objectives as detailed in our Council Plan 2013-17. The following table lists and describes the goals and objectives.

PAGE 13 OF 72
Strategic Objective Description
1. Strong regional partnerships
Strong stakeholder relationships will help inform Council’s operations
and investment priorities. Council will also draw on this understanding to
ensure Moira’s business and community needs are effectively
represented within local, state and federal government and agency
forums and able to access its fair share of funding and service
opportunities.
2. Improve Moira’s Liveability
Investing in Moira’s liveability improves the quality of life for our residents and at the same time encourages greater economic growth by enhancing our region’s ability to attract, retain and grow business activity
3. Build on our economic
strengths in agriculture,
manufacturing and tourism
Moira’s climate, location, irrigation infrastructure and transport options means it is well placed to grow its agriculture, manufacturing and tourism sectors. Moira’s Economic Development Strategy, adopted in 2013, remains a key priority supported by the ‘whole of council’ approach outlined in the Council Plan.
4. Smarter delivery of existing
services and programs
Finding smarter and more efficient ways to deliver local government services is critical to delivering agreed service standards within our available financial resources. Council Plan proposed to involve industry and the community in the improvement and streamlining of Council processes and in determining acceptable trade-offs between cost and community service standards
5. Delivering sound financial
management
Financial sustainability underpins Council’s ability to deliver services and invest in community assets that support our community’s economic growth and social wellbeing. The Victorian Auditor- General’s Office (VAGO) annual audit and review program will be the primary indicator of our performance.
6. Involving and
communicating with our
community
As we strive to deliver ‘more with less’, our community planning is vital to allowing our communities be a part of the decision making process as they evaluate and define service and asset needs and the trade-offs associated with change. The resulting plans inform Council’s long term land use planning, asset management, service delivery and investment decision-making across our Shire.
7. Demonstrating good
governance
Good governance underpins our community’s, investors’ and stakeholders’ confidence in Council and our ability to attract grant and other investment and funding. Within the Council Plan, Council seeks to demonstrate the rigour of its governance, policies and decisions by adopting Best Value Principles.
8. Rebalancing Moira’s asset
mix
Council will work with the community to review and plan for the longer term renewal investment requirements to meet future service and asset needs of the community, business and stakeholders.

PAGE 14 OF 72
2. Services, initiatives and service performance indicators
This section provides a description of the services and initiatives to be funded in the Budget for the 2015/16 year and how these will contribute to achieving the strategic objectives outlined in the Council Plan. It also describes a number of major initiatives, initiatives and service performance outcome indicators for key areas of Council’s operations. Council is required by legislation to identify major initiatives, initiatives and service performance outcome indicators in the Budget and report against them in their Annual Report to support transparency and accountability. The relationship between these accountability requirements in the Council Plan, the Budget and the Annual Report is shown below.
Source: Department of Environment, Land, Water and Planning (formerly Transport, Planning and Local Infrastructure)
Services for which there are prescribed performance indicators to be reported on in accordance with the Regulations are shown in bold and underlined in the following sections.

PAGE 15 OF 72
2.1 Strategic Objective 1: Strong regional partnerships
To achieve our objective, we will continue to plan, deliver and improve high quality, cost effective, accessible and responsive services. The services, initiatives, major initiatives and service performance indicators for each business area are described below.
Services
Service
area
Description of services provided Expenditure
(Revenue)
Net Cost $’000
Office of the
CEO
This service provides leadership guidance to the
business, Council and guides the development and
delivery of Council’s representation and advocacy
efforts.
1,299
(21)
1,278
Initiatives
1. Develop an advocacy plan focusing on Council’s regional opportunities in agriculture, manufacturing and tourism. ($Nil additional cost)
2. Actively engage in relevant forums and networks to promote Moira’s interests including MAV, HRLGN, Hume RDA and Murray Group of Councils. ($Nil additional cost)
3. Liaise with key industry groups about future directions to explore collaborative opportunities and advocate for growth and investment. ($Nil additional cost)

PAGE 16 OF 72
2.2 Strategic Objective 2: Improving Moira’s Liveability
To achieve our objective we will continue to plan, deliver and improve high quality, cost effective, accessible and responsive services. The services, initiatives, major initiatives and service performance indicators for each business area are described below.
Services
Service area Description of services provided Expenditure (Revenue) Net Cost
$’000
Emergency
Response
Management
This service assists Moira communities to prepare, respond and
recover from emergencies and natural disasters in line with
Moira’s Emergency Management Plan.
131
(69)
62
Children,
Youth &
Families
This service provides contributions to 9 community based not for
profit preschools to ensure quality and affordable preschool
services are available across the Shire. Maternal and child health
services in Cobram, Nathalia, Numurkah, Strathmerton and
Yarrawonga and outreach services to our smaller centres. Youth
services and events that aim to connect and engage our younger
citizens, such as Junior Council. Immunisation programs for
infants and school children.
1,691
(945)
746
Library
Services
Council provides a financial contribution to the operation of the
Goulburn Valley Regional Library Corporation who in turn provide
a range of library services at 4 locations within the Shire and via a
mobile library service to smaller towns and centres.
748
(0)
748
Health &
Community
Wellbeing
Council works with communities to improve liveability for all
residents across the shire through arts and culture, access and
inclusion and health and wellbeing programs. Council provides
assistance to a range of partner agencies including Community
Houses, Moira Health Care Alliance and Moira Foodbank. Council
works with committees and volunteer groups to plan for the future
needs of our community and to ensure Council fulfils its legislated
Public Health and Wellbeing obligations. Council provides targeted
grant programs to assist community groups and organisations to
achieve goals within their local communities.
1,191
(44)
1,147

PAGE 17 OF 72
Service area Description of services provided Expenditure (Revenue) Net Cost
$’000
Sports and
recreation
services
Cost of operating and maintaining five outdoor swimming pools at
Yarrawonga, Cobram, Numurkah, Strathmerton and Nathalia, the
water slide and splash park on the Yarrawonga foreshore, the
Nathalia Sports and Community Centre, the Cobram Sports
Stadium, and the Numurkah Aquatic & Fitness Centre along with
the irrigating and mowing, general upkeep of Council’s 19
recreation reserves and four showgrounds. The service also
undertakes strategic reviews of service needs to identify and plan
for future requirements.
1,376
(31)
1,345
Public health This service protects the community’s health and wellbeing by
coordinating food safety support programs, Tobacco Act activities
and public health promotions. The service also works to rectify
public health concerns relation to unreasonable noise emissions,
housing standards and pest controls.
627
(212)
415
Public safety This service provides staff at school crossings throughout the
municipality to ensure that all pedestrians, but mainly school
aged children, are able to cross the road safely. It maintains and
improves the health and safety of people, animals and the
environment in Council by providing animal management
services including a dog and cat collection service, a lost and
found notification service, a pound service, a registration and
administration service, an after-hours service and an emergency
service. It also provides education, regulation and enforcement of
the Local Law and relevant State legislation.
1018
(262)
756
Parks and
reserves
Cost of maintaining and upgrading of Council’s parks and
gardens, reserves, town entrances and open spaces including 80
parks and gardens (open spaces), 44 playgrounds, 31 public toilet
blocks, public BBQs and their irrigation systems. This service is
responsible for the management, maintenance and safety of
parks and gardens, sporting grounds and playground facilities.
4,165
(0)
4,165

PAGE 18 OF 72
Service area Description of services provided Expenditure (Revenue) Net Cost
$’000
Roads,
footpaths
and drainage
This service conducts ongoing maintenance of Council’s road and
bridge network which includes 80 bridges and major culverts,1000
km of sealed roads, 2500 km of gravel roads varying from link
roads to access tracks, 600 km of farm access tracks, 239 km of
kerb and channel and 60 km of footpaths. Activities include
repairing, resealing, asphalting, resheeting and patching
The service also maintains CBD streetscapes in the four major
towns and 18 smaller towns, fire plug maintenance for 14 brigades
and inspection and maintenance of flood pumps and gross
pollutant traps.
9,516
(7,050)
2,466
Waste
management This service provides waste collection including kerbside rubbish collection of garbage, recyclables and organic waste from all households and some commercial properties in Council. It also operates 9 transfer stations and a landfill site, along with monitoring and maintaining decommissioned landfills to meet required environmental standards. It also provides street cleaning, leaf collection, weed removal, drainage pit cleaning and street litter bins throughout Council. The income in this service area is driven by the collection of the environmental levy, garbage and recycling fees, which helps fund environmental planning costs, Landfill capital works and future landfill rehabilitation costs.
4,903
(8,149)
(3,246)
Environmental
planning
This service develops environmental policy, coordinates and implements environmental projects and works with other services to improve Council’s environmental performance. The service assists with implementing Councils roadside management plan, roadside pest and weed management program, responding to planning and other referrals relating to Natural Resource Management, and in partnership with other agencies, management of Kinnairds wetlands.
1,103
(169)
934
Description of services provided
Major Initiatives
1. During 2015/16 Council will complete construction of the Cobram Library ($1.6 million net cost).
2. Council will continue to work with local community to progress ideas to build an all-abilities
playground in Yarrawonga. The budget includes initial funding commitment however the project is
yet to be fully scoped with future ownership, management and maintenance responsibilities yet to
be costed and assigned. ($0.18 million net cost).
Initiatives
1. Develop 2015 – 2025 Recreation Strategy
2. Review Moira’s Walking and Cycling (Tracks’n’Trails) Strategy and prepare construction program
3. Develop the 2015-2019 Arts and Culture Strategy

PAGE 19 OF 72
4. Review the Streetscape Strategy for the four major towns.
5. Review Moira’s Road Management Plan to align with changes in road use and reduced road
funding
6. Develop a foot path strategy to guide Council and community investment
7. Commence implementation of Numurkah Flood Study recommendations

PAGE 20 OF 72
Service Performance Outcome Indicators
Service
Indicator
Performance Measure
Computation
Libraries Participation
Active library members (Percentage of the municipal population that are active library members)
[Number of active library members / municipal population] x100
Aquatic
Facilities Utilisation
Utilisation of aquatic facilities (Number of visits to aquatic facilities per head of municipal population)
Number of visits to aquatic facilities / Municipal population
Waste
collection
Waste
diversion
Kerbside collection waste diverted from Landfill (Percentage of garbage, recyclables and green organics collected from kerbside bins that is diverted from landfill)
[Weight of recyclables and green organics collected from kerbside bins / Weight of garbage, recyclables and green organics collected from kerbside bins] x100
Roads Satisfaction
Satisfaction with sealed local roads (Community satisfaction rating out of 100 with how Council has performed on the condition of sealed local roads)
Community satisfaction rating out of 100 with how Council has performed on the condition of sealed local roads.
Animal Management
Health and safety
Animal management prosecutions (Number of successful animal management prosecutions)
Number of successful animal management prosecutions
Food safety Health and
safety
Critical and major non-compliance Notifications (Percentage of critical and major non- compliance notifications that are followed up by Council)
[Number of critical
non-compliance notifications and major non- compliance notifications about a food premises followed up / Number of critical non- compliance notifications and major non- compliance notifications about food premises] x100

PAGE 21 OF 72
2.3 Strategic Objective 3: Build on our economic strengths in agriculture, manufacturing and tourism
To achieve our objective, we will continue to plan, deliver and improve high quality, cost effective, accessible and responsive services. The services, initiatives, major initiatives and service performance indicators for each business area are described below.
Services
Service area Description of services provided Expenditure
(Revenue)
Net Cost
$’000
Economic
Development
This service supports the attraction, growth and innovation of
existing and prospective businesses across the Shire.
1,052
(215)
836
Tourism This service provides support to the business plans of local
tourism associations, and plans for future tourism opportunities
and infrastructure needs. The service provides contributions to
tourism marketing including Murray Regional Tourism.
1.009
(68)
941
Statutory
Planning
This service monitors the Council’s Planning Scheme as well as
preparing major policy documents shaping the future of the
Shire. It also prepares and processes amendments to the
Council Planning Scheme and carries out research on
demographic, urban development, economic and social issues
affecting Council. It also processes all planning applications,
provides advice and makes decisions about development
proposals which require a planning permit, as well as
representing Council at the Victorian Civil and Administrative
Tribunal where necessary.
1.191
(315)
876
Building
Services
This service provides statutory building services to the Council
community including processing of building permits, emergency
management responsibilities, fire safety inspections, audits of
swimming pool barriers and investigations of complaints and
illegal works.
617
(322)
295
Major Initiatives 1. The major review of Council’s Municipal Strategic Statement will commence in 2015 ($Nil net
cost).
2. Involve industry and community in the improvement of customer-focused planning and building
service delivery ($nil net cost)
Initiatives
1. Implement Business and Innovation Strategy 2013-2017
2. Develop Moira Shire Tourism and Event Strategy (destination management plan)
3. Develop land use master plan for Yarrawonga
4. Review Structure plan for Cobram

PAGE 22 OF 72
Service Performance Outcome Indicators
Service
Indicator
Performance Measure
Computation
Statutory planning
Decision making
Council planning decisions upheld at VCAT (Percentage of planning application decisions subject to review by VCAT and that were not set aside)
[Number of VCAT decisions that did not set aside Council’s decision in relation to a planning application / Number of VCAT decisions in relation to planning applications] x100
2.4 Strategic Objective 4: Smarter delivery of services and programs -
To achieve our objective, we will continue to plan, deliver and improve high quality, cost effective, accessible and responsive services. The services, initiatives, major initiatives and service performance indicators for each business area are described below.
Services
Service areas Description of services provided Expenditure
(Revenue)
Net Cost
$’000
Information
Services
This service provides, supports and maintains reliable and cost
effective communications and computing systems, facilities
and infrastructure to Council staff enabling them to deliver
services in a smart, productive and efficient way.
2,945
(0)
2,945
Organisational
Development
This service provides Council with strategic and operational
organisational development support including Occupational
Health and Safety obligations. The service develops and
implements strategies, policies and procedures through the
provision of human resources and industrial relations services.
The service also assists managers to determine and
progress toward future structures, capability and cultures in
their service units.
1,478
(6)
1,472
Customer Service This service is the main customer interface with the community
and includes customer service delivered by phone and from
centres in Cobram and Yarrawonga, agency services in 8 other
local centres and an online through Council‘s website.
573
(0)
573
Major Initiatives
1. Develop first stage of 3 year customer service excellence strategy (Nil net cost)
Initiatives
1. Undertake reviews of Council services, which will include consultation with stakeholders and the
development of service standards and commitments for these services ($Nil net cost).
2. Develop and implement People and Organisational Development Strategy
3. Develop & implement IT and Information Management Strategy

PAGE 23 OF 72
2.5 Strategic Objective 5: Deliver sound financial management
To achieve our objective, we will continue to plan, deliver and improve high quality, cost effective, accessible and responsive services. The services, initiatives, major initiatives and service performance indicators for each business area are described below.
Services
Service areas Description of services provided Expenditure
(Revenue)
Net Cost
$’000 Financial
Services
This service provides financial based services to both
internal and external customers including the
management of Council’s finances, payment of
salaries and wages to Council employees,
procurement and contracting of services, raising and
collection of rates and charges and valuation of
properties throughout the municipality. The income in
this service area is driven by the collection of rates
charges and Commonwealth grants, which helps fund
other costs.
12,181
(34,111)
(21,930)
Initiatives
1. Develop long term financial management principles and model
2. Review revenue rating strategy

PAGE 24 OF 72
2.6 Strategic Objective 6: Involving and communicating with our community
To achieve our objective, we will continue to plan, deliver and improve high quality, cost effective, accessible and responsive services. The services, initiatives, major initiatives and service performance indicators for each business area are described below.
Services
Service areas Description of services provided Expenditure
(Revenue)
Net Cost$’000
Communications This service is responsible for the management and
provision of advice on external and internal communication, in consultation with relevant stakeholders, on behalf of Council.
767
(0)
767
Community
Development This service is responsible for working with the community, stakeholders and partner agencies to develop long term community plans that inform Council’s land use planning, asset management, service delivery and investment decision-making across the Shire.
1,243
(0)
1,243
Initiatives
1. Develop Community Plans for towns and townships

PAGE 25 OF 72
2.7 Strategic Objective 7: Demonstrating good governance
To achieve our objective, we will continue to plan, deliver and improve high quality, cost effective, accessible and responsive services. The services, initiatives, major initiatives and service performance indicators for each business area are described below.
Services
Service areas Description of services provided Expenditure
(Revenue)
Net Cost
$’000
Business
Compliance and
Risk Services
This service is responsible for the
maintenance, management and strategic planning for
Council’s building, land and property leases and licenses
591
(457)
134
Governance and
compliance
This includes Councillor entitlements along with the costs
of ensuring we comply with the governance obligations
under the Local Government Act and other legislation.
753
(11)
742
Initiatives
1. Review Section 86 committee of management model
2. Identify and plan compliance upgrades of Council infrastructure within reduced grant and financial
resources.
Service Performance Outcome Indicators
Service
Indicator
Performance Measure
Computation
Governance Satisfaction Satisfaction with Council decisions
(Community satisfaction rating out of
100 with how Council has performed
in making decisions in the interests of
the community)
Community satisfaction rating
out of 100 with how Council
has performed in making
decisions in the interests of
the community

PAGE 26 OF 72
2.8 Strategic Objective 8: Rebalancing Council’s asset mix
To achieve our objective, we will continue to plan, deliver and improve high quality, cost effective, accessible and responsive services. The services, initiatives, major initiatives and service performance indicators for each business area are described below.
Services
Service areas
Description of services provided
Expenditure
(Revenue)
Net Cost
$000
$’000 Infrastructure Planning
This service conducts capital works planning for
Council’s main civil infrastructure assets in an
integrated and prioritised manner in order to optimise
their strategic value and service potential. These
include roads, laneways, car parks, foot/bike paths,
drains and bridges
12,161
(5,313)
6,848
Engineering Design and Management
This service undertakes design, tendering, contract
management and supervision of various works
within Council’s capital works program. The service
also approves and supervises private development
activities such as subdivisions and infrastructure
associated with Buildings and unit developments.
932
(0)
932
Civic Buildings This service oversees repairs, maintenance of
Council’s more than 570 buildings that range from
small pump sheds to historical and aging halls and
community buildings. Costs include contributions to
local Committees of Management, utilities as well
as repairs and maintenance.
704
(0)
704
Council Assets Council operates and maintains a range of ‘other’
assets including pumps and basins. This category
also includes the costs of insurance for council
buildings, plant and other assets.
1.566
(39)
1,527
Major Initiatives
1. Deliver capital works to budget and schedule
Initiatives
1. Develop public pool strategy
2. Conduct audit of lease holdings

PAGE 27 OF 72
2.9. Performance Statement
The service performance indicators detailed in the preceding pages will be reported on in the Performance Statement which is prepared at the end of the year as required by Section 132 of the Act and included in the 2015/16 Annual Report. The Performance Statement will also include reporting on prescribed indicators of financial performance (outlined in Section 8) and sustainable capacity, which are not included in this budget report. The prescribed performance indicators contained in the Performance Statement are audited each year by the Victorian Auditor General who issues an audit opinion on the Performance Statement. The major initiatives detailed in the preceding pages will be reported in the Annual Report in the form of a statement of progress in the Report of Operations.
2.10 Reconciliation with budget operating results
Net Cost
(Revenue)
$'000
Expenditure
$'000
Revenue
$'000
Strong regional partnership 1,278 1,299 21
Improving Moira's Liveability 9,537 26,467 16,931
Build Economic Strengths-agriculture, manufacturing & tourism 2,949 3,869 921
Smarter delivery of service programs 4,991 4,996 6
Delivery sound financial management (868) 12,181 13,049
Involving and communicating with community 2,010 2,010 -
Demonstrating good governance 877 1,344 468
Rebalancing Council's asset mix 3,753 3,792 39
Total services and initiatives 24,527 55,960 31,433
Deficit before funding sources 24,527
Funding sources
Rates & charges 21,062
Capital income 5,313
Total funding source 26,375
Surplus for the year 1,848

PAGE 28 OF 72
3. Budget influences
This section sets out the key budget influences arising from the internal and external environment within which the Council operates.
3.1 Snapshot of Moira Shire Council
Our location
Moira Shire is located in the Hume region of Victoria and stretches across 4,045 square kilometres from Bundalong in the East to the Barmah National Park to the West. Our northern boundary is defined by the Murray River and our south-west, southern and south east regions share boundaries with Councils of Campaspe, Greater Shepparton, Benalla, Wangaratta and Indigo. Moira is centrally located to the regional cities of Shepparton, Wangaratta and Albury-Wodonga . Moira includes four major towns; Cobram, Nathalia, Numurkah and Yarrawonga and 17 smaller communities including Barmah, Bearii, Bundalong, Invergordon, Katamatite, Katunga, Koonoomoo, Lake Rowan, Peechelba, Picola, St James, Strathmerton, Tungamah, Waaia, Wilby, Wunghnu and Yarroweyah. There is no single dominant major town within the Shire and importantly, each major town has a unique combination of economic and liveability advantages.
Our community
In the 2011 Census, there were 28,123 people in Moira of these:
49.7% were male and 50.3% were female.
Aboriginal and Torres Strait Islander people made up 1.4% of the population.
85% of people were born in Australia, which is considerably higher than the state and national
result.
79.1% of people had both parents born in Australia and 12.6% of people had both parents born
overseas.
90% of people speak only English at home, with Italian, Arabic and Indo-Aryan (eg Punjabi) the
most common non-English languages.
The median age of Moira’s population is 44 years, which is higher than the state and national median of 37 years. Children aged 0 - 14 years made up 19.3% of the population and people aged 65 years and over made up 21.6% of the population.
Our Economy
Moira’s food processing sector, comprising principally dairy products (output $632m) and meat processing (output $115m), is the largest sector based on output in the Moira Shire. Food processing also includes significant output in oils and fats (output $43m), fruit and vegetable products (output $14m), wine ($8m) and other food products (output $29m). Moira is home to major manufacturers including Murray-Goulburn Cooperative, the Bega Cheese plant in Strathmerton and Graincorp Oilseeds – Riverland in Numurkah and Ryan’s Meats in Nathalia. Agricultural land use accounts for approximately 71%of the total land area, currently divided equally between irrigated and dry-land production. In June 2013, there were 11,832 local jobs in Moira Shire, with 12,934 employed residents. A total of 3,128 businesses were registered in the Shire across all industries. At present, Tourism is the seventh largest contributor to economic output in the municipality generating an estimated $90 million for the local community, including approximately 510 jobs, or about 5.6% of Moira Shire’s workforce. The Moira community is serviced by local hospitals in each of the major towns along with a wide range of medical and allied health service providers. As a result health services are an important sector within and for the local community.

PAGE 29 OF 72
Budget implications
As a result of Moira’s dispersed service delivery and demographic profile there are a number of budget implications in the short and long term as follows:
Higher cost service delivery model and limited capacity to pay. Compared with equivalent Victorian Councils, Moira covers a large geographic area with multiple service locations and a relatively small, slower growing, dispersed and aging population. This combination means Moira has relatively higher costs to deliver the equivalent range and standard of Council services.
Communities’ capacity to pay has peaked and there is limited scope to supplement rate revenue through other income streams.
With limited access to additional grant and funding options, Council anticipates increased tension between Council’s desire to fund existing assets and Council’s ability to support contemporary services and asset needs.
Many of Moira’s assets are in the latter stage of their useful life, community use is declining but community service standards along with public use, safety and construction standards are increasing. With more than 16,000 individual assets and 550 buildings, this Budget will see Council commence a process to understand community and to identify changes in the asset mix required to support the community’s future needs.
3.2 External influences
Consumer Price Index (CPI) increases on goods and services of 1.7% through the year to
December quarter 2014 (ABS release 28 January 2015).
The Victorian State Government has announced that local government rates will be capped from
2016/17. Depending on the level at which rates are capped Council may need to undertake a
review of services that are provided to the community with the aim of reducing the level of rate
payer subsidy for services undertaken by Local Government on behalf of the State and Federal
Government.
Councils across Australia raise approximately 3% of the total taxation collected by all levels of
Government in Australia. In addition Councils are entrusted with the maintenance of more than
30% of the all Australian public assets including roads, bridges, parks, footpaths and public
buildings. This means that a large proportion of Council’s income must be allocated to the
maintenance and replacement of these valuable public assets in order to ensure the quality of
public infrastructure is maintained at satisfactory levels.
The Fire Services Property Levy will continue to be collected by Council on behalf of the State
Government with the introduction of the Fire Services Property Levy Act 2012.
3.3 Internal influences
As well as external influences, there are also a number of internal influences which are expected to have a significant impact on the preparation of the 2015/16 Budget.
During 2014/15 Council reduced its executive management team from three directors to two
General Managers with a corresponding realignment and reduction of management roles.

PAGE 30 OF 72
3.4 Budget principles
In response to these influences, guidelines were prepared and distributed to all Council officers with budget responsibilities. The guidelines set out the key budget principles upon which the officers were to prepare their budgets. The principles included:
All new project, program initiatives were subject to rigorous review through Council’s project
assessment committee and assigned a rating that prioritised their ability to be funded within
Council’s budget
Operating expenditure frozen at 2014/15 levels except where legal commitments such as existing
contracts, Enterprise Agreements and construction standards obligate Council to meet increases.
No additional borrowings and continuing to pay down existing debt in accordance with the
repayment schedules,
Council user fees and charges to increase by CPI (2.6%);
No increase to kerbside organic waste collection service however the charge will apply for the full
year;
To maintain service levels to the community within these constraints, the 2015/16 Budget proposes:
an increase of 4% in general rates, municipal and waste charges;
a capital investment program of $11.57 million which includes $1.50 million of projects carried
over from 2014/15 financial year
3.5 Long term strategies
The budget includes consideration of a number of long term strategies and contextual information to assist Council to prepare the Budget in a proper financial management context. These include a Strategic Resource Plan for 2015/16 to 2018/19 (Section 8.), Rating Information (Section 9.) and Other Long term Strategies (Section 10.) including borrowings, infrastructure and service deliver.

PAGE 31 OF 72
Budget analysis
4. Analysis of operating budget
This section analyses the operating budget including income and expenses of the Council for the 2015/16 year.
4.1 Budgeted income statement
Forecast
2014/15
$’000
Adopted
Budget
2015/16
$’000
Variance
$’000
Total revenue 53,749 54,389 640
Total expenses (50,910) (52,541) (1,630)
Operating surplus/(deficit) 2,839 1,848 (990)
Grants – capital (5,596) (4,525) 1,071
Contributions - non-monetary (200) (200) -
Underlying surplus/(deficit) (2,957) (2,877) 80
4.1.1 Adjusted underlying deficit ($0.08 million decrease)
The adjusted underlying result is the net surplus or deficit for the year, adjusted for non-recurrent capital grants, non-monetary asset contributions, and capital contributions from other sources. It is a measure of financial sustainability and Council’s ability to achieve its service delivery objectives as it is not impacted by capital income items which can often mask the operating result. The adjusted underlying result for the 2015/16 year is a deficit of $2.88 million which is an improvement of $0.08 million due to a reduced reliance on Capital Grants.

PAGE 32 OF 72
4.2 Income
Revenue Types
Ref.
Forecast
2014/15
$’000
Adopted
Budget
2015/16
$’000
Variance
$’000
Rates 5.2.1 31,461 33,254 1,793
Grants – operating 5.2.2 11,430 10,932 (498)
Grants – capital 5.2.3 5,596 4,525 (1,071)
Contributions - cash 5.2.4 115 133 18
Contributions - non-monetary 5.2.5 200 200 -
Users charges 5.2.6 2,893 2,934 41
Statutory fees and fines 5.2.7 914 862 (52)
Other revenue 5.2.8 1,141 1,549 408
Total operating revenue 53,749 54,389 640

PAGE 33 OF 72

PAGE 34 OF 72
4.2.1 Rates and charges ($1.79 million increase)
Rates and charges have increased by 5.7% or $1.79 million over 2014/15 to $33.25 million. This includes increases in general rates of 4.0%; municipal charge of 4.0%; environmental levy of 4.0%; garbage service charge of 4.0%; recycling service charge of 4.0%, the organic waste service charge (introduced in Dec 2014) will not increase but will be applied for the full year in 2015/16; and forecasts supplementary rates to remain the same as 2014/15 at $0.34 million. Section 9. Rating Information includes a more detailed analysis of the rates and charges to be levied for 2015/16. Information on rates and charges specifically required by the Regulations is included in Appendix B.
4.2.2 Statutory fees and fines ($0.05 million decrease)
Statutory fees relate mainly to fees and fines levied in accordance with legislation and include animal registrations, Public Health and Wellbeing Act 2008 registrations and parking fines. Increases in statutory fees are made in accordance with legislative requirements. Statutory fees and fines are projected to decrease by 5.7% or $0.52 million over 2014/15 are mainly due to lower Town Planning and Building fees. A detailed listing of fees and charges is included in the appendices
4.2.3 User fees ($0.04 million increase)
User charges relate mainly to the recovery of service delivery costs through the charging of fees to users of Council’s services. These include use of leisure, entertainment and other community facilities and the provision of human services such as family day care and home help services. In setting the budget, the key principle for determining the level of user charges has been to ensure that increases do not exceed CPI increases or market levels. User charges are projected to increase by 1.4% or $0.41 million over 2014/15. The main area contributing to the increase is rental charges for Council leased properties. A detailed listing of fees and charges is included in Appendix D.
4.2.4 Contributions - monetary ($0.02 million increase)
Contributions relate to monies paid by developers in regard to public resort and recreation, drainage and car parking in accordance with planning permits issued for property development.
4.2.5 Grants - operating ($0.50 million decrease)
Operating grants include all monies received from State and Federal sources for the purposes of funding the delivery of Council’s services to ratepayers. Overall, the level of operating grants is projected to decrease by 4.4% or $0.50 million compared to 2014/15. A list of operating grants by type and source, classified into recurrent and non-recurrent, is included below

PAGE 35 OF 72
Operating Grants Forecast 2014/15
Budget 2015/16
Non-recurrent - State Government
Community health and safety (46) (28)
Economic Development (90) (30)
Environmental Programs (432) (130)
Flood Mitigation (40) -
Other (5) (21)
Recreation, leisure and community activities (30) -
Recreational, leisure and community facilities (25) -
Non-recurrent - State Government Total (668) (209)
Recurrent - State Government
Community health and safety (74) (66)
Economic Development (10) (10)
Environmental Programs (30) (20)
Maternal and child health (255) (290)
Other (8) (1)
Recreation, leisure and community activities (65) (65)
Roadside weeds and pest management (50) -
School crossing supervisors (16) (17)
Recurrent - State Government Total (507) (468)
Recurrent -Commonwealth Government
Family day care (510) (491)
Victoria Grants Commission (9,745) (9,765)
Recurrent -Commonwealth Government Total (10,255) (10,255)
Grand Total (11,430) (10,932)

PAGE 36 OF 72
4.2.6 Grants – capital ($1.07 million decrease)
Capital grants include all monies received from State and Federal sources for the purposes of funding the delivery of Council’s infrastructure services to ratepayers. Overall, the level of capital grants is projected to decrease due to completion of one-off infrastructure projects.
Capital Grants Forecast 2014/15
Budget 2015/16
Recurrent - Commonwealth Government
Roads to recovery (1,665) (3,200)
Recurrent - Commonwealth Government Total (1,665) (3,200)
Non-recurrent - Commonwealth Government
Roads - black spot program (295) -
Non-recurrent - Commonwealth Government Total (295) -
Non-recurrent - State Government
Aerodrome - (400)
Buildings (1,082) (250)
Country roads and bridges (1,000) -
Drainage (250) -
Parks, open space and streetscapes (960) -
Recreational, leisure and community facilities (343) -
Roads - (675)
Non-recurrent - State Government Total (3,635) (1,325)
Grand Total (5,595) (4,525)

PAGE 37 OF 72
4.2.7 Net gain on disposal of property, infrastructure, plant and equipment is $ 0.04 million ($0.03 million increase)
Proceeds from the disposal of Council assets is forecast to be $0.10 million for 2015/16 and relate mainly to the planned cyclical replacement of the plant and equipment and vehicle fleet. The written down value of assets sold is forecast to be $0.06 million.
4.2.8 Other revenue ($0.41 million increase)
Other revenues include Capital contributions, reimbursement and subsidies, interest from investments. The increase of $0.41 million is mainly due to higher level of capital contribution expected as against 2014/15.
4.3 Expenses
Expenditure Types
Forecast
2014/15
$’000
Adopted
Budget
2015/16
$’000
Variance
$’000
Employee costs 18,611 19,699 1,088
Materials and services 11,230 11,003 (227)
External Contract Services 5,756 6,345 590
Depreciation and amortisation 8,740 8,886 146
Interest on borrowings 527 465 (63)
Other expenses 6,047 6,143 96
Total operating expenditure 50,910 52,541 1,630

PAGE 38 OF 72
Contractors
B & D. Debts
Depreciation
Emp.cost
Int. on Borrowings
Landfill-Interest
Materials & Services
Other Expenses
Share Net Profit Associated Entity
Utilities
WDV of Infrastructure Replaced
0
5
10
15
20
25
Millio
ns
Budget 2015/16 Operating expenses
Forecast Dec 14 Budget 2015/16

PAGE 39 OF 72
4.3.1 Employee costs
Employee costs include all labour related expenditure such as wages and salaries and on-costs such as allowances, leave entitlements, employer superannuation, rostered days off, etc.
Employee costs are forecast to increase by 5.9% or $1.09 million compared to 2014/15. This increase relates to three key factors:
Increase resulting from Council’s Enterprise Bargaining Agreement (EBA) which is estimated to cost $1.46 million in 2015/16
Anticipated wages reduction of $0.37 million in 2015/16, which is as a result of the impact of operational realignments in 2014/15, offset by the full year impact of replacement FTE for positions which remained unoccupied for periods in 2014/15.
Department Budget 2015/16
$'000
Permanent Full time
$'000
Permanent Part time
$'000
Asset management 1,935.2 1,919.0 16.2
Community services 2,463.3 1,353.7 1,109.6
Corporate Services 3,360.7 3,225.2 135.5
Culture and leisure 624.8 403.2 221.6
Environment and amenity 2,618.3 2,127.2 491.1
Shire services 7,220.7 6,864.4 356.3
Total permanent staff expenditure 18,223.0 15,892.7 2,330.4
Casuals and other expenditure 1,476.1
Capitalised Labour costs -
Total expenditure 19,699.2

PAGE 40 OF 72
A summary of the number of full time equivalent (FTE) Council staff in relation to the above expenditure is included below
Department Budget 2015/16
FTE
Permanent Full time
FTE
Permanent Part time
FTE
Asset management 19.3 19.1 0.2
Community services 25.0 13.1 11.9
Corporate Services 44.9 43.1 1.8
Culture and leisure 8.0 4.8 3.2
Environment and amenity 29.2 22.5 6.7
Shire services 69.1 65.1 4.0
Total permanent staff 195.4 167.7 27.7
Casuals and other 12.3
Capitalised Labour costs -
Total staff 207.7
The most significant increases in employee costs by service unit are summarised below:
Department
Service unit
2014/15
$'000
Budget 2015/16
$'000
Variance
$'000
Asset management Support services 204 217 14
Infrastructure 1,257 1,507 250
Maintenance 102 107 5
Design 97 104 7
Community services Art & Culture 73 80 7
Community support 1,335 1,524 189

PAGE 41 OF 72
Youth development 365 482 116
Maternal and child health 390 378 - 13
Shire services Building maintenance 551 686 134
General operations 2,968 2,851 - 117
Parks and gardens 1,250 1,303 53
Planning 438 634 197
Roads 676 717 41
Municipal services 89 94 5
Street cleaning 268 273 5
Support services 490 664 174
4.3.2 Materials and services ($0.23 million decrease) Materials and services include the purchases of consumables, utility costs. Materials and services are forecast to decrease by 2.0% or $0.23 million compared to 2014/15. The main areas contributing to the decrease are the one-off costs associated with the introduction of the Organic Waste Service and savings from various waste management programs. 4.3.3 External Contract Services ($0.59 million increase) External contracts are forecast to increase by 10.25% or $0.59 million compared to 2014/15. The main areas contributing to this increase are the full year impact of the introduction of the Organic Waste Service and the costs associated with the statutory revaluation of all properties in the 2015/16 financial year. 4.3.4 Bad and doubtful debts ( No change)
Bad and doubtful debts is projected to remain at $0.005 million. 4.3.5 Depreciation and amortisation ($0.15 million increase) Depreciation is an accounting measure which attempts to allocate the value of an asset over its useful life for Council’s property, plant and equipment including infrastructure assets such as roads and drains. The increase of $0.15 million for 2015/16 is due mainly to the completion of the 2015/16 capital works program and the full year effect of depreciation on the 2014/15 capital works program. Refer to Section 6. ‘Analysis of Capital Budget’ for a more detailed analysis of Council’s capital works program for the 2015/16 year. 4.3.6 Borrowing costs ($0.06 million decrease) Borrowing costs relate to interest charged by financial institutions on funds borrowed. The reduction in borrowing costs results from the planned reduction in borrowings due to repayment of principal in accordance with loan agreements.

PAGE 42 OF 72
4.3.7 Other expenses ($0.10 million increase) Other items of expense relate to a range of unclassified items including contributions to community groups, councillor expenses and other miscellaneous expenditure items. Other expenses are forecast to increase by 1.6% or $0.10 million compared to 2014/15. This is mainly due to increased insurance costs and increases in Council’s contribution to the GV Library and other community organisations. 5. Analysis of budgeted cash position This section analyses the expected cash flows from the operating, investing and financing activities for Council for the 2015/16 year. Budgeting cash flows for Council is a key factor in setting the level of rates and providing a guide to the level of capital expenditure that can be sustained with or without using existing cash reserves. The analysis is based on three main categories of cash flows:
Operating Activities – Refers to the cash generated or used in the normal service delivery functions of Council. Cash remaining after paying for the provision of services to the community may be available for investment in capital works, or repayment of debt.
Investing Activities – Refers to cash generated or used in the enhancement or creation of infrastructure and other assets. These activities also include the acquisition and sale of other assets such as vehicles, property and equipment.
Financing Activities – Refers to cash generated or used in the financing of Council functions and include borrowings from financial institutions and advancing of repayable loans to other organisations. These activities also include repayment of the principal component of loan repayments for the year.

PAGE 43 OF 72
5.1 Budgeted cash flow statement
Forecast Adopted Budget Variance
CASH FLOWS FROM OPERATING ACTIVITIES 2014/15 2015/16 (Outflow)
$'000 $'000 $'000
CASH FLOWS FROM OPERATING ACTIVITIES
Receipts from Ratepayers 31,234 33,062 1,827
Receipts from Grants 17,026 15,457 (1,568)
Contributions 308 820 512
Reimbursements and Subsidies 60 63 3
User Charges/Statutory Fees & Fines 3,731 3,829 98
Interest Received 360 350 (10)
Other Receipts 448 366 (82)
Proceeds from Sale of Land held for Resale 142 100 (42)
Net GST refund - - -
Payments to Employees (18,149) (19,215) (1,066)
Payments to Suppliers (17,987) (18,229) (241)
Interest paid (527) (465) 63
Payments for Purchase of Land held for Resale (300) (300) 0
Other payments (4,400) (4,459) (59)
NET CASH FLOWS FROM OPERATING ACTIVITIES 11,944 11,379 (565)
CASHFLOWS FROM INVESTING ACTIVITIES
Proceeds from Sale of Fixed Assets 67 101 33
From Community Organisations - - -

PAGE 44 OF 72
Forecast Adopted Budget Variance
CASH FLOWS FROM OPERATING ACTIVITIES 2014/15 2015/16 (Outflow)
$'000 $'000 $'000
Recoupment of Loans/Advances (15) 15 30
Payments for Purchase of Fixed Assets (10,892) (11,571) (680)
NET CASHFLOWS FROM INVESTING ACTIVITIES (10,839) (11,456) (617)
CASH FLOWS FROM FINANCING ACTIVITIES
Repayment of Borrowings (830) (892) (63)
Repayment of Non-Interest Bearing Liabilities (60) (60) -
Increase/(decrease) of Trust Monies 16 17 0
Proceeds from Borrowings - - -
NET CASH FLOWS FROM FINANCING ACTIVITIES (873) (936) (62)
NET CHANGE IN CASH HELD 232 (1,012) (1,244)
Cash at Beginning of the Financial Year 14,438 14,670 232
CASH AT END OF FINANCIAL YEAR 14,670 13,658 (1,012)

PAGE 45 OF 72
5.1.1 Operating activities ($0.52 million decrease)
The decrease in cash flows from operating activities is due mainly to decrease in Operating and Capital grants relating to one-off projects and the freeze in the Victorian Grants funding from the year 2015/16. The net cash flow from operating activities does not equal the surplus/deficit for the year as the expected revenues and expenses of the Council include non-cash items which have been excluded from the Cash Flow Statement. The budgeted operating result is reconciled to budgeted cash flows available from operating activities as set out in the following table.
Forecast
2014/15
$’000
Adopted
Budget
2015/16
$’000
Variance
$’000
Surplus (deficit) for the year 2,839 1,848 (990)
Contributed assets (200) (200) -
Bad and doubtful debts 5 5 -
Depreciation 8,740 8,886 146
Interest on unwinding of discount on provisions 430 491 62
Loss (gain) on sale of assets - - -
Share of net loss of associated entity 20 20 -
Written down value of Infrastructure replaced 200 200 -
Net movement in current assets and liabilities [balancing figure]
69 329 260
Cash flows available from operating activities
12,103 11,580 (523)

PAGE 46 OF 72
5.1.2 Investing activities ($0.6 million decrease) The decrease in investment activities is mainly due to increase in capital expenditure for 2015/16 due to carry forward of projects from 2014/15. 5.1.3 Financing activities ($0.06 million decrease) For 2015/16 the total of principal repayments is projected to be $0.90 million and finance charges is projected to be $0.47 million. 5.1.4 Cash and cash equivalents at the end of the year ($1.0 million) Overall, total cash and investments is forecast to decrease by $1 million as at 30 June 2016. 5.2 Restricted and unrestricted cash and investments Cash and cash equivalents held by Council are restricted in part and not fully available for Council’s operations. The budgeted cash flow statement above indicates that Council is estimating at 30 June 2016 it will have cash and investments of $13.67 million, which has been restricted as shown in the following table.
Forecast
2014/15
$’000
Adopted
Budget
2015/16
$’000
Strategic Resource Plan
Projections
2016/17
$’000
2017/18
$’000
2018/19
$’000
Total Cash and investments 14,670 13,658 12,350 9,618 8,287
Restricted cash & investments
Statutory reserves (1,311) (1,341) (1,371) (1,401) (1,431)
Trust funds and deposits (565) (582) (600) (618) (636)
Unrestricted cash and investments 12,794 11,735 10,379 7,599 6,220
5.2.1 Statutory reserves ($1.34 million) These funds must be applied for specified statutory purposes in accordance with various legislative requirements. While these funds earn interest revenues for Council, the funds are not available for other purposes.

PAGE 47 OF 72
5.2.2 Cash held to fund carry forward capital works There is no amount shown as cash held to fund carry forward works at 30 June 2016, as it is expected that the capital works budget in the 2015/16 financial year will be fully expended. An amount of $1.50 million is forecast to be held at 30 June 2015 to fund capital works budgeted but not completed in the 2014/15 financial year. Section 6.2 contains further details on capital works funding. 5.2.3 Unrestricted cash and investments ($11.74 million) The amount shown is in accordance with the definition of unrestricted cash included in the Section 3 of the Regulations. These funds are free of statutory reserve funds and cash to be used to fund capital works expenditure from the previous financial year. 5.2.4 Discretionary reserves There is no amount shown as cash for discretionary reserves. Council has made no resolution to reserve funds as discretionary. 5.2.5 Unrestricted cash adjusted for discretionary reserves ($11.74 million) These funds are free of all specific Council commitments and represent funds available to meet daily cash flow requirements, unexpected short term needs and any budget commitments which will be expended in the following year such as grants and contributions. Council regards these funds as the minimum necessary to ensure that it can meet its commitments as and when they fall due without borrowing further funds. 5.2.6 Trust funds and deposits ($0.6 million) These funds are received for specific purposes and after the compliance period the amounts are to be refunded.

PAGE 48 OF 72
6. Analysis of capital budget
This section analyses the planned capital works expenditure budget for the 2015/16 year and the sources of funding for the capital budget. Further detail on the capital works program can be found in Appendix C.
6.1 Capital works expenditure
Capital Works Areas Ref
Forecast
2014/15
$’000
Adopted
Budget
2015/16
$’000
Variance
$’000
Bridges 6.1.1
180 180
Buildings 6.1.2 1,281 2,315 1,034
Drainage 6.1.3 525 380 (145)
Footpaths 6.1.4 80 325 245
Kerb and channel 6.1.5 400 400 -
Furniture & Equipment 6.1.6
56 56
Land 6.1.7
- -
Land Improvements 6.1.8 2,408 1,132 (1,276)
Other Assets 6.1.9 175 - (175)
Plant and equipment 6.1.10 801 957 156
Playground Equipment 6.1.11
250 250
Roads 6.1.12 5,220 5,576 356
Total Capital Works
10,892 11,571 680
Represented by:
Renewal 6.1.13 6,706 6,637 (69)
Upgrade 6.1.14 3,447 2,351 (1,096)
Expansion 6.1.15 739 2,583 1,844
Total Capital Works
10,892 11,571 680

PAGE 49 OF 72

PAGE 50 OF 72
6.1.1 Carried Forward Works ($1.50 million) At the end of each financial year there are projects which are either incomplete or not commenced due to factors including planning issues, weather delays and extended consultation. For the 2014/15 year it is forecast that ($1.5 million) of Capital Works will be incomplete and be carried forward into the 2015/16 year. The more significant projects include: the Cobram Library ($1.0 million); and the Yarrawonga Aerodrome ($0.5 million). 6.1.2 Property ($2.32 million) The property class comprises buildings and building improvements including Community Facilities, Municipal offices, Sports Facilities and Pavilions. For the 2015/16 year, ($2.32 million) will be expended on building and building improvement projects. The more significant projects include: construction of the Cobram Library ($1.60 million); Civic Buildings safety and electrical works ($0.18 million); Public Hall and Toilets renewals ($0.19 million); replacement of Numurkah Aquatic Centre heater ($0.10 million); and relocation of IT Disaster Recovery facility ($0.11 million). 6.1.3 Plant and Equipment ($1.01 million) Plant and Equipment includes plant, machinery and equipment, computers and telecommunications and library books. For the 2015/16 year, ($1.01 million) will be expended on plant, equipment and other projects. The more significant projects include: ongoing cyclical replacement of the plant and vehicle fleet ($0.92 million); upgrade and replacement of information technology ($0.06 million); and renewal of aquatic facilities plant ($0.04 million). 6.1.4 Infrastructure ($8.24 million) Infrastructure includes roads, bridges, footpaths and cycle ways, drainage, recreation, leisure and community facilities, parks, open space and streetscapes, off street car parks and other structures. For the 2015/16 year, ($5.47 million) will be expended on road projects. The more significant projects include: local road reconstructions ($1.96 million); and federally funded Roads to Recovery projects ($3.28 million). ($0.38 million) will be expended on drainage projects. The more significant of these include the Yarrawonga drainage upgrade ($0.15 million); and drainage works in Cobram ($0.23 million). Other new infrastructure expenditure includes: ($0.50 million) on Yarrawonga Aerodrome; ($0.18 million) on bridges; ($0.33 million) on footpaths and cycleways; $0.40 million on Kerb and Channel; $0.39 million on recreational, leisure and community facilities; $0.11 million on car parks; $0.18 million on Levee Banks at Nathalia; $0.18 million at Yarrawonga Caravan Park; and $0.12 million on other infrastructure.
6.1.5 Asset Renewal ($6.64 million), Upgrade ($2.35 million) and Expansion ($2.58 million) A distinction is made between expenditure on new Assets, Asset Renewal, Upgrade and Expansion. Expenditure on Asset Renewal is expenditure on an existing asset, or on replacing an existing asset that returns the service of the asset to its original capability. Expenditure on new assets does not have any element of expansion or upgrade of existing assets but will result in an additional burden for future operation, maintenance and capital renewal. All capital expenditure represents renewals and expansion/upgrades of existing assets.

PAGE 51 OF 72
6.2 Funding sources
Sources of Funding
Forecast
2014/15
$’000
Adopted
Budget
2015/16
$’000
Variance
$’000
External
Proceeds on sale of assets 142 100 (42)
Special charge scheme - - -
Grants – Capital 5,596 4,525 (1,070)
Community contributions 193 688 494
New loan borrowings - - -
Internal
Cash and investments 4,961 6,259 1,298
Total funding sources 10,892 11,572 681
Budgeted total funding sources 2015/16

PAGE 52 OF 72
6.2.1 Grants ($4.5 million) Capital grants include all monies received from State and Federal sources for the purposes of funding the capital works program. Significant grants and contributions are budgeted to be received for the Yarrawonga Aerodrome $0.40 million and Numurkah Road Katunga intersection upgrade ($0.60 million). Roads to Recovery projects ($3.20 million). 6.2.2 Council Cash – Operations ($6.26 million) Council generates cash from its operating activities, which is used as a funding source for the Capital Works program. It is forecast that ($11.38 million) will be generated from Operations to fund the 2015/16 Capital Works program. This amount equates to the cash generated from operating activities of ($6.26 million) as set out in Section 5. “Analysis of Budgeted Cash Position” adjusted for capital grants of ($4.52 million), Community Contributions of ($0.70 million) and Proceeds of sale of assets ($0.10 million) and no borrowing costs. 6.2.3 Council cash - proceeds from sale of assets ($0.10 million) Proceeds from sale of assets include motor vehicle and light and heavy plant sales in accordance with Council’s fleet and equipment renewal policy.
6.2.4 Council Cash – Reserve Cash and Investments ($1.26 million)
Council has cash reserves, which it is currently using to fund its annual Capital Works program. The reserves include monies set aside for specific purposes such as Open Space Reserve and Car Parking Reserve. For 2015/16 ($0.31 million) will be used to fund part of the new Capital Works program including: the All Abilities Playground, Yarrawonga ($0.20 million); and Witt Street Carpark, Yarrawonga ($0.11 million).
6.2.5 Council cash - unrestricted cash and investments ($0.00)
Council has not received grants or contributions in advance during the year 2014/15

PAGE 53 OF 72
7. Analysis of budgeted financial position
This section analyses the movements in the assets, liabilities and equity between 2014/15 and 2015/16. It also considers a number of key financial performance indicators.
7.1 Budgeted balance sheet
BUDGETED BALANCE SHEET
Forecast 2014/15 $'000
Adopted Budget 2015/16 $'000
Variance (Outflow)$'000
Current Assets
Cash Assets 14,670 13,658 (1,012)
Receivables 3,700 3,766 66
Inventory 424 438 15
Land held for Resale 231 441 210
Other 123 127 4
Total Current Assets 19,148 18,431 (717)
Non-Current Assets
Receivables 57 131 74
Property Plant and Equipment 499,930 501,806 1,875
Intangible Assets 910 910 -
Investments in Associate 629 609 (20)
Total Non-Current Assets 501,526 503,456 1,929
TOTAL ASSETS 520,674 521,886 1,212
Current Liabilities
Payables 2,800 2,905 106
Trusts 565 582 17

PAGE 54 OF 72
BUDGETED BALANCE SHEET
Forecast 2014/15 $'000
Adopted Budget 2015/16 $'000
Variance (Outflow)$'000
Interest Bearing Liabilities 892 966 73
Non-Interest Bearing Liabilities 60 60 -
Employee Benefits 3,781 4,198 417
Provision for Landfill Rehabilitation 1,003 970 (32)
Total Current Liabilities 9,101 9,682 580
Non-Current Liabilities
Trade and Other Payables - -
Interest Bearing Liabilities 5,579 4,614 (966)
Non-Interest Bearing Liabilities 60 0 (60)
Employee Benefits 401 468 67
Provision for Landfill Rehabilitation 8,030 7,772 (258)
Total Non-Current Liabilities 14,070 12,853 (1,217)
TOTAL LIABILITIES 23,172 22,535 (636)
NET ASSETS 497,503 499,351 1,848
EQUITY
Accumulated Surplus 174,302 108,571 (65,731)
Statutory Reserves 1,311 1,341 30

PAGE 55 OF 72
BUDGETED BALANCE SHEET
Forecast 2014/15 $'000
Adopted Budget 2015/16 $'000
Variance (Outflow)$'000
Asset Revaluation Reserves 321,890 389,439 67,549
TOTAL EQUITY 497,503 499,351 1,848
7.1.1 Current Assets ($0.72 million decrease) and Non-Current Assets ($1.93 million increase)
Cash and cash equivalents include cash and investments such as cash held in the bank and in petty cash and the value of investments in deposits or other highly liquid investments with short term maturities of three months or less. These balances are projected to decrease by $1.01 million during the year mainly to fund the capital works program during the year. Trade and other receivables are monies owed to Council by ratepayers and others. Short term debtors are not expected to change significantly in the budget. Long term debtors (non-current) relating to Special rates debtors will increase by $0.07 million in accordance with agreed repayment terms. Other assets includes items such as prepayments for expenses that Council has paid in advance of service delivery, inventories or stocks held for sale or consumption in Council’s services and other revenues due to be received in the next 12 months.
Property, infrastructure, plant and equipment is the largest component of Council’s worth and represents the value of all the land, buildings, roads, vehicles, equipment, etc which has been built up by Council over many years. The $1.88 million increase in this balance is attributable to the net result of the capital works program ($11.57 million of new assets), depreciation of assets ($8.89 million), sale through sale of property, plant and equipment ($0.10 million) and projected Landfill adjustment ($0.78 million)
7.1.2 Current Liabilities ($0.58 million increase) and Non-Current Liabilities ($1.22 million decrease)
Trade and other payables are those to whom Council owes money is expected to increase by ($0.11 million) over 2014/15 levels. Provisions include accrued long service leave, annual leave and rostered days off owing to employees. These employee entitlements are expected to increase by ($0.48 million) due to leave earned during the employees’ tenure of employment. Provisions also include Landfill Rehabilitation which is expected to decrease by ($0.29 million). Interest-bearing liabilities are borrowings of Council. Council is budgeting to repay loan principal of ($0.89 million) over the year. Council is also budgeting to repay non-interest-bearing liabilities of ($0.06 million) over the year.

PAGE 56 OF 72
7.1.3 Working Capital ($1.30 million decrease)
Working capital is the excess of current assets above current liabilities. This calculation recognises that although Council has current assets, some of those assets are already committed to the future settlement of liabilities in the following 12 months, and are therefore not available for discretionary spending.
Some of Council’s cash assets are restricted in that they are required by legislation to be held in reserve for specific purposes or are held to fund carry forward capital works from the previous financial year.
Forecast
$’000
Adopted
Budget
2015/16
$’000
Variance
$’000
Current assets 19,148 18,431 (717)
Current liabilities 9,101 9,682 580
Working capital 10,047 8,749 (1,298)
Restricted cash and investment current assets
-
Statutory reserves - - -
Cash used to fund fund carry forward capital works - - -
Trust fund and deposits - -
Unrestricted working capital 10,047 8,749 (1,298)
Council is projecting nil Discretionary Reserves as at 30 June 2016.
7.1.4 Equity ($1.85 million increase)
Total equity always equals net assets and is made up of the following components:
Asset revaluation reserve which represents the difference between the previously recorded value
of assets and their current valuations.
Statutory reserves that are funds that Council wishes to separately identify as being set aside to
meet a specific purpose in the future and to which there is no existing liability. These amounts are
transferred from the Accumulated Surplus of the Council to be separately disclosed.
Accumulated surplus which is the value of all net assets less Reserves that have accumulated
over time, the increase in accumulated surplus results directly from the surplus for the year.

PAGE 57 OF 72
7.2 Key assumptions
In preparing the Balance Sheet for the year ending 30 June 2016 it was necessary to make a number of assumptions about assets, liabilities and equity balances. The key assumptions are as follows:
A total of 95.0% of total rates and charges raised expected to be collected in the 2015/16 year (2014/15: 92.6% actual)
Trade creditors to be based on total capital and operating expenditure less written down value of assets sold, depreciation and employee costs. Payment cycle is 30 days
Other debtors and creditors to remain consistent with 2014/15 levels
Employee entitlements to be increased by the Enterprise Bargaining Agreement outcome.
Repayment of loan principal to be $0.89 million
Total capital expenditure to be $11.57 million, of which $1.5 million is expected to be funded from existing cash reserves.

PAGE 58 OF 72
Long term strategies
8. Strategic resource plan and financial performance indicators
This provides information on the long term financial projections of the Council.
8.1 Plan Development
The Act requires a SRP to be prepared describing both financial and non-financial resources (including Human Resources) for at least the next four financial years to achieve the strategic objectives in the Council Plan. In preparing the SRP, Council must take into account all other plans and strategies in regard to services and initiatives which commit financial and non-financial resources for the period of the SRP.
Council has prepared a SRP for the four years 2015/16 to 2018/19 as part of its ongoing financial planning to assist in adopting a budget within a longer term framework. The SRP takes the strategic objectives and strategies as specified in the Council Plan and expresses them in financial terms for the next four years.
The key objective, which underlines the development of the SRP, is financial sustainability in the medium to long term, while still achieving Council’s strategic objectives as specified in the Council Plan. The key objectives, which underpin the SRP, are:
Financial sustainability in the medium to long term
Delivering Council strategic objectives as specified in the Council Plan
In preparing the SRP, Council has also been mindful of the need to comply with the following Principles of Sound Financial Management as contained in the Act:
Prudently manage financial risks relating to debt, assets and liabilities
Provide reasonable stability in the level of rate burden
Consider the financial effects of Council decisions on future generations
Provide full, accurate and timely disclosure of financial information
The SRP is updated annually through a rigorous process of consultation with Council service providers followed by a detailed sensitivity analysis to achieve the key financial objectives.

PAGE 59 OF 72
8.2 Financial resources
The following table summarises the key financial indicators for the next four years as set out in the SRP years 2015/16 to 2018/19. Appendix A includes a more detailed analysis of the financial resources over the four year period.
Indicator Forecast
2014/15
$’000
Adopted
Budget
2015/16
$’000
Strategic Resource Plan Trend
Projections +/0/-
2016/17 2017/18 2018/19
$’000 $’000 $’000
Operating surplus / [deficit] 2,839 1,848 714 (750) 4 -
Adjusted underlying result (3,217) (3,665) (3,511) (5,325) (3,021) +
Cash assets 14,670 13,658 12,350 9,618 8,287 -
Cash from operations 12,102 11,579 10,539 9,577 10,159 -
Capital expenditure 10,892 11,571 11,096 11,535 10,635 -
The following graph shows the general financial indicators over the four year period.
Key to Forecast Trend: + Forecasts improvement in Council's financial performance/financial position indicator o Forecasts that Council's financial performance/financial position indicator will be steady
- Forecasts deterioration in Council's financial performance/financial position indicator

PAGE 60 OF 72
The key outcomes of the SRP are as follows: Financial sustainability (Section 5) - Cash and investments is forecast to decrease significantly over the four year period from $13.66 million to $8.29 million, which forecasts a reduction of cash reserves driven by the anticipated capping of rates and the need to draw on cash reserves to fund future capital works. Rating levels (Section 9) – Modest rate increases are forecast over the four years at an average of 2.6%, in line with the projected CPI levels. Service delivery strategy (Section 10) – Service levels have been maintained throughout the four year period. The adjusted underlying result is a deficit reducing over the four year period, it is expected Council will see an operating deficit occur in 2017/18 and continue at a reduced level in 2018/19. The adjusted underlying result is a measure of financial sustainability and is an important measure as one-off capital items which can often mask the operating result. Borrowing strategy (Section 10) – Borrowings are forecast to reduce from $6.47 million to $3.57 million over the four year period. No new borrowings are forecast over the four year period. Infrastructure strategy (Section 10) - Capital expenditure over the four year period will total $44.38 million at an average of $11.21 million.
8.3 Financial performance indicators
The following table highlights Council’s current and projected performance across a range of key financial indicators. These indicators provide a useful analysis of Council’s financial position and performance and should be used in the context of the organisation’s objectives.
Indicator Measure Note
Forecast 2014/15
Adopted
Budget
2015/16
Strategic Resource Plan
Trend +/o/- Projections
2016/17 2017/18 2018/19
Operating position
Adjusted underlying result
Adjusted underlying surplus (deficit) / Adjusted underlying revenue 1 4.92% 3.04% 0.93% (1.72)% (0.34)% 0
Liquidity
Working capital
Current assets/current liabilities 2 2.10
1.90 1.71 1.37 1.22 -
Unrestricted cash
Unrestricted cash/current liabilities 1.41
1.21 1.02 0.70 0.55 0
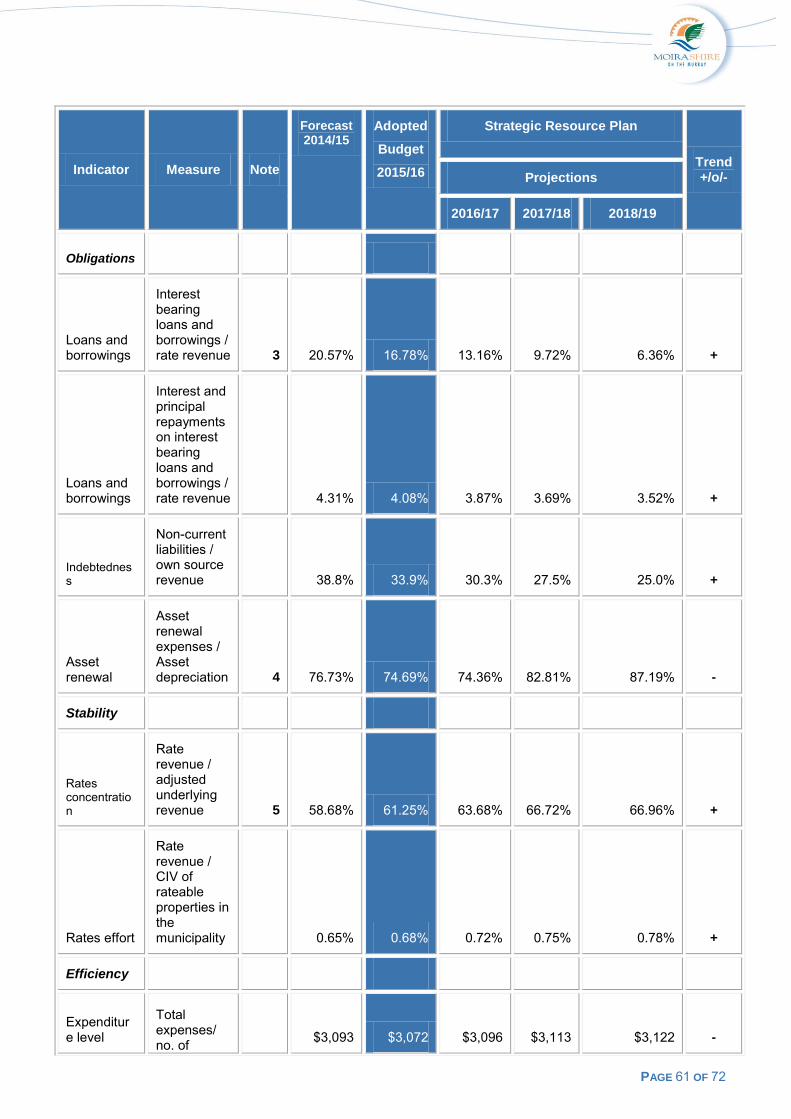
PAGE 61 OF 72
Indicator Measure Note
Forecast 2014/15
Adopted
Budget
2015/16
Strategic Resource Plan
Trend +/o/- Projections
2016/17 2017/18 2018/19
Obligations
Loans and borrowings
Interest bearing loans and borrowings / rate revenue 3 20.57% 16.78% 13.16% 9.72% 6.36% +
Loans and borrowings
Interest and principal repayments on interest bearing loans and borrowings / rate revenue
4.31% 4.08% 3.87% 3.69% 3.52% +
Indebtedness
Non-current liabilities / own source revenue
38.8% 33.9% 30.3% 27.5% 25.0% +
Asset renewal
Asset renewal expenses / Asset depreciation 4 76.73% 74.69% 74.36% 82.81% 87.19% -
Stability
Rates concentration
Rate revenue / adjusted underlying revenue 5 58.68% 61.25% 63.68% 66.72% 66.96% +
Rates effort
Rate revenue / CIV of rateable properties in the municipality 0.65% 0.68% 0.72% 0.75% 0.78% +
Efficiency
Expenditure level
Total expenses/ no. of
$3,093 $3,072 $3,096 $3,113 $3,122 -

PAGE 62 OF 72
Indicator Measure Note
Forecast 2014/15
Adopted
Budget
2015/16
Strategic Resource Plan
Trend +/o/- Projections
2016/17 2017/18 2018/19
property assessments
Revenue level
Residential rate revenue / No. of residential property assessments
$940 $980 $1,006 $1,032 $1,059 +
Workforce turnover
No. of permanent staff resignations & terminations/average no. of permanent staff for the financialyear
9.81% 9.6% 9.4% 9.2% 9% +
Key to Forecast Trend: + Forecasts improvement in Council's financial performance/financial position indicator o Forecasts that Council's financial performance/financial position indicator will be steady - Forecasts deterioration in Council's financial performance/financial position indicator
1 Adjusted underlying result – An indicator of the sustainable operating result required to enable Council to continue to provide core services and meet its objectives. Financial performance is expected to decline over the longer term as future losses means increased reliance on Council's cash reserves or increased debt to maintain services. 2 Working Capital – The proportion of current liabilities represented by current assets. Working capital is forecast to decrease in 2015/16 year due to a run down in cash reserves to fund the capital program. The trend in later years indicates a decrease which the Council plan to take decisive measures to improve and to meet the VAGO requirements. 3 Debt compared to rates - Trend indicates Council's reducing reliance on debt against its annual rate revenue through redemption of long term debt. 4 Asset renewal - This percentage indicates the extent of Council's renewal of assets against its depreciation charge (an indication of the decline in value of its existing capital assets). A percentage greater than 100 indicates Council is maintaining its existing assets, while a percentage less than 100 means its assets are deteriorating faster than they are being renewed and future capital expenditure will be required to renew assets. 5 Rates concentration - Reflects extent of reliance on rate revenues to fund all of Council's
on-going services. Trend indicates Council will become more reliant on rate revenue compared
to all other revenue sources.

PAGE 63 OF 72
8.4 Non-financial indicators
In addition to the financial resources to be consumed over the planning period, Council will also consume non-financial resources, in particular human resources. A summary of Council’s anticipated human resources requirements for the 2015/16 year is shown below and further detail is included in Section 4.3.1 of this budget. A statement of Human Resources is included in Appendix A.
Forecast Budget Strategic resource Plan
2014/15 2015/16 2016/17 2017/18 2018/19
Staff expenditure $'000 $'000 $'000 $'000 $'000
Employee costs - Operating 18,611 19,699 21,015 21,846 22,646
Employee costs - Capital
Total staff expenditure 18,611 19,699 21,015 21,846 22,646
EFT EFT EFT EFT EFT
Staff numbers
Employees 205.0 207.7 207.7 207.7 207.7
Total staff numbers 205.0 207.7 207.7 207.7 207.7

PAGE 64 OF 72
9. Rating information
This section contains information on Council’s past and foreshadowed rating levels along with Council's rating structure and the impact of changes in property valuations. This section should be read in conjunction with Council’s Rating Strategy which is available on Council’s website.
9.1 Rating context In developing the Strategic Resource Plan (referred to in Section 8.), rates and charges were identified as an important source of revenue, accounting for 61.14% of the total revenue received by Council annually. Planning for future rate increases has therefore been an important component of the Strategic Resource Planning process. The level of required rates and charges has been considered in this context, with reference to Council's other sources of income and the planned expenditure on services and works to be undertaken for the Moira Shire community. However, it has also been necessary to balance the importance of rate revenue as a funding source with community sensitivity to increases, particularly changes in property valuations and subsequently rates for some properties in the municipality. The following table shows a comparison of the general rates for the year 2014/15 to 2018/19 against the CPI.
Year Moira Shire Council CPI
2014/15 5.5% 2.6%
2015/16 4.0% 2.6%
2016/17 2.6% 2.6%
2017/18 2.6% 2.6%
2018/19 2.6% 2.6%
Average increase 3.5% 2.6%
The table indicates the Council’s pro jected general rate increase is 0.9% higher than the average of the CPI.
9.2 Current year rates and charges
It is predicted that the 2015/16 operating position will be impacted by wages growth and reductions in government funding. Combined with proposed rate capping and the Commonwealth grant freeze it will therefore be necessary to achieve future revenue growth while containing costs in order to achieve an almost breakeven operating position by 2018/19 as set out in the Strategic Resource Plan. The $6.26 million contribution from operations toward capital investment for the 2015/16 year is also much less than the desired level and therefore, unless it can be increased, it will be difficult to maintain robust capital works programs in the future.
In order to achieve these objectives while maintaining service levels and a strong capital expenditure program, the general rate will increase by a modest 4.0%, the municipal charge by 4.0%, the environmental levy by 4.0%, the garbage and recycling charge by 4.0%, the organic waste charge (introduced in 2014/15) will not increase in 2015/16 but will be applied for the whole year. This will raise total rates and charges for 2015/16 of $33.25 million, including $0.34 million generated from supplementary rates.
The following table sets out future proposed increases in rates and charges and the total rates to be raised, based on the forecast financial position of Council as at 30 June 2015.

PAGE 65 OF 72
Ye
ar
Ge
ne
ral
Ra
te
Incre
as
e
%
Mu
nic
ipal R
ate
Incre
as
e %
Ga
rbag
e R
ate
Incre
as
e%
Re
cy
cli
ng
Rate
Incre
as
e %
Org
an
ic R
ate
Incre
as
e %
En
vir
on
me
nt
Rate
Incre
as
e %
To
tal R
ate
s R
ais
ed
$'0
00
2014/15 5.5 5.5 5.5 5.5 5.5 31,461
2015/16 4 4 4 4 4 33,254
2016/17 2.6 2.6 2.6 2.6 2.6 2.6 35,046
2017/18 2.6 2.6 2.6 2.6 2.6 2.6 36,753
2018/19 2.6 2.6 2.6 2.6 2.6 2.6 38,537
9.3 Rating Structure
Council has established a rating Structure which is comprised of three key elements. These are:
Property values, which form the central basis of rating under the Local Government Act 1989
A user pays component to reflect usage of cover some of the administrative costs of the Council
A fixed municipal charge per property to cover some of the administrative costs of the Council. Striking a proper balance between these elements provided equity in the distribution of the rate burden across residents. Council makes a further distinction within the property value component of rates based on the purpose for which the properties are used. Having reviewed the various valuation bases for determining the property value component of rates, Council has determined to apply a Capital Improved Value (CIV) basis on the grounds that it provided the most equitable distribution of rates across the municipality. There are currently no plans to change that basis, however Council does review its rating structure every four years. The existing rating structure is set on a differential rating strategy. These rates are structured in accordance with the requirements of Section 161 Differential Rates of the Act.
The following table summarises the rates to be determined for 2015/16 year. A more detailed analysis of the rates to be raised is contained in the appendices. Council has established a rating structure which is comprised of three key elements. These are: • Property values, which form the central basis of rating under the Local Government
Act 1989 • A 'user pays' component to reflect usage of certain services provided by
Council • A fixed municipal charge per property to cover some of the administrative costs of the
Council. Striking a proper balance between these elements provides equity in the distribution of the rate burden across residents.

PAGE 66 OF 72
Council makes a further distinction within the property value component of rates based on the purpose for which the property is used, that is, whether the property is used for residential or commercial purposes. This distinction is based on the concept that business should pay a fair and equitable contribution to rates, taking into account the benefits those commercial properties derive from the local community.
Having reviewed the various valuation bases for determining the property value component of rates, Council has determined to apply a Capital Improved Value (CIV) basis on the grounds that it provides the most equitable distribution of rates across the municipality. There are currently no plans to change that basis, but Council does review its rating structure every four years.
The existing rating structure comprises twelve differential rates. These rates are structured in accordance with the requirements of Section 161 ‘Differential Rates’ of the Act. Under the Cultural and Recreational Lands Act 1963, provision is made for a Council to levy the rate for recreational lands at “such amount as the municipal council thinks reasonable having regard to the services provided by the municipal council in relation to such lands and having regard to the benefit to the community derived from such recreational lands Council also levies a municipal, garbage, recycling, environmental and organic waste collection charges as allowed under the Act.
The following table summarises the rates to be determined for the 2015/16 year. A more detailed analysis of the rates to be raised is contained in Appendix B ‘Statutory Disclosures’.
Rate type
How applied
2014/15
2015/16
Total
Raised
$'000
Change
General Vacant
Cents in $ of CIV 0.7695 0.8003 1322 4%
General Building
Cents in $ of CIV 0.3848 0.4002 9665 4%
Farm Vacant Cents in $ of CIV 0.3848 0.4002 1079 4%
Farm Building Cents in $ of CIV 0.3848 0.4002 4216 4%
Commercial Vacant
Cents in $ of CIV 0.7695 0.8003 58 4%
Commercial Building
Cents in $ of CIV 0.5387 0.5602 1875 4%
Industrial Vacant
Cents in $ of CIV 0.7695 0.8003 43 4%
Industrial Building
Cents in $ of CIV 0.5387 0.5602 907 4%

PAGE 67 OF 72
Rate type
How applied
2014/15
2015/16
Total
Raised
$'000
Change
Rural Vacant Cents in $ of CIV 0.7695 0.8003 145 4%
Rural Building Cents in $ of CIV 0.3848 0.4002 1740 4%
Cultural & Recreational
Cents in $ of CIV 0.3729 0.3878 2 4%
DHS Elderly Cents in $ of CIV 0.1953 0.2031 10 4%
Municipal Charge $ per property $306 $318 5,128 4%
Garbage Service $ per property $99 $103 1,304 4%
Recycling Service $ per property $89 $93 1,141 4%
Environmental Levy $ per property $207 $215 758 4%
Organic Waste Service $ per property $97 $97 3,468 0%
In order to achieve these objectives the rates will increase by 4%. This will raise total rates and charges for 2015/16 of ($33.25 million) including ($0.34 million) generated from supplementary rates

PAGE 68 OF 72
10 Summary of Other Strategies
This section sets out the strategies that have been developed and incorporated into the Strategic Resource Plan.
10.1 Borrowings
In developing the Strategic Resource Plan (SRP) (see Section 8), Council has confirmed its commitment to continue a debt reduction program in line with its current repayment schedule. This has resulted in a reduction in debt servicing costs, but has meant that cash and investment reserves have been used as an alternate funding source to maintain robust capital works programs. The SRP includes the results of an analysis of Council’s debt position against both State averages and large council averages over a number of different indicators. It also shows the results of the ‘obligations’ indicators that are part of the prescribed financial reporting indicators. The outcome of the analysis highlighted that a debt of $5.58 million could be comfortably accommodated. For the 2015/16 year, Council has decided not take out any new borrowings to fund the capital works program and therefore, after making loan repayments of $0.89 million, will reduce its total borrowings to $5.58 million as at 30 June 2016. Council has no plans for further borrowings during the remaining years of the Council Plan. The following table sets out forecast borrowing levels based on the forecast financial position of Council as at 30 June 2015.
Year New Borrowings $'000
Principal Paid $'000
Interest Paid $'000
Balance 30-Jun$'000
2014/15 0 830 527 6,472
2015/16 0 892 465 5,579
2016/17 0 966 391 4,614
2017/18 0 1,041 316 3,572
2018/19 0 1,123 234 2,449

PAGE 69 OF 72
The table below shows information on borrowings specifically required by the Regulations
2014/15
$’000
2015/16
$’000
Total amount borrowed as at 30 June of the prior year 0 0
Total amount borrowed 0 0
Total amount projected to be redeemed 830 892
Total amount to be borrowed as at 30 June 0 0
The table below shows information on borrowings specifically required by the Regulations.
10.2 Infrastructure
The Council has developed an Infrastructure Strategy based on the knowledge provided by various Asset Management Plans, which sets out the capital expenditure requirements of Council for the next 10 years by class of asset, and is a key input to the SRP. It predicts infrastructure consumption, renewal needs and considers infrastructure needs to meet future community service expectations. The Strategy has been developed through a rigorous process of consultation and evaluation. The key aspects of the process are as follows:
Long term capital planning process which integrates with the Council Plan, Strategic Resource Plan and Annual Budget processes
Identification of capital projects through the preparation of asset management plans
Prioritisation of capital projects within classes on the basis of evaluation criteria
Methodology for allocating annual funding to classes of capital projects
Business Case template for officers to document capital project submissions.
A key objective of the Infrastructure Strategy is to maintain or renew Council’s existing assets at desired condition levels. If sufficient funds are not allocated to asset renewal then Council’s investment in those assets will reduce, along with the capacity to deliver services to the community
The graph below set out the Councils plan on funding Upgrade, Renewal and Expansion over the life of the current SRP.

PAGE 70 OF 72
At present, Council is similar to most municipalities in that it is presently unable to fully fund asset renewal requirements identified in the Infrastructure Strategy. While the Infrastructure Strategy is endeavouring to provide a sufficient level of annual funding to meet ongoing asset renewal needs, the above graph indicates that in later years the required asset renewal is increasing.
In updating the Infrastructure Strategy for the 2015/16 year, the following influences have had a significant impact:
$500,000 for Yarrawonga, Aerodrome to improve the access to Yarrawonga with a direct impact on tourism and business activities
$410,000 to renew the Levee Banks and Footpaths works in Nathalia; $1.6 million for the Cobram Library project to benefit all sections of the community and focusing
on the development of the younger generation
Availability of significant Federal funding for upgrade of roads

PAGE 71 OF 72
The following table summarises Council's forward outlook on capital expenditure including funding sources for the next four years.
Year
Total Summary of funding sources
Capital Asset sales Council
Borrowings
$’000 Program Grants Contribution and others Cash
$’000 $’000 $’000 $’000 $’000
2014/15 10,892 5,619 125 112 5,035 0
2015/16 11,571 4,525 157 631 6,258 0
2016/17 11,096 3,665 10 350 7,071 0
2017/18 11,535 3,965 10 400 7,160 0
2018/19 10,635 2,465 10 350 7,810 0
In addition to using cash generated from its annual operations, borrowings and external contributions such as government grants, Council has cash or investment reserves that are also used to fund a variety of capital projects. These reserves are either ‘statutory’ or ’discretionary’ cash reserves. Statutory reserves relate to cash and investments held by Council that must be expended on a specific purpose as directed by legislation or a funding body, and include contributions to car parking and open space. Discretionary cash reserves relate to those cash and investment balances that have been set aside by Council and can be used at Council’s discretion, even though they may be earmarked for a specific purpose
10.3 Service delivery
The key objectives in Council’s Strategic Resource Plan (referred to in Section 8.) which directly impact the future service delivery strategy are to maintain existing service levels and to achieve a breakeven operating result within five to six years. The Rating Information (see Section 9.) also refers to modest rate increases into the future approximating CPI. With these key objectives as a basis, a number of internal and external influences have been identified through discussions with management which will have a significant impact on the scope and level of services to be provided over the next four years.

PAGE 72 OF 72
The service delivery outcomes measured in financial terms are shown in the following table
Year Surplus (Deficit) for the year $'000
Adjusted Underlying Surplus (Deficit)
$'000
Net Service (Cost) $'000
2014/15 2,839 (3,217) (34,066)
2015/16 1,848 (3,665) (35,654)
2016/17 714 (3,511) (37,372)
2017/18 (750) (5,325) (38,701)
2018/19 4 (3,021) (39,923)
Service levels have been maintained throughout the four year period with operating surpluses forecast in years 2015/16 to 2016/17 as a result of significant capital grant revenue being received to fund the annual capital works program. T h e Y e a r 2017/18 i n d i c a t e s a d e f i c i t of ($0.75 million) with an improvement to break-even in 2018/19. Excluding the effects of items such as capital contributions, the adjusted underlying result is a reducing deficit over the four year period. The net cost of the services provided to the community increases from $34.06 million to $39.92 million over the four year period.

Appendix A - Financial Statements
This appendix presents information in regard to the financial statements and statements of human resources.
The appendix included the following budgeted information
Income Statement
Balance Sheet
Cash Flow Statement
Statement of changes in equity
Statement of capital works
Statement of human resources
:

Comprehensive Income Statement Current Year Adopted
For the four years ending 30 June 2019 Forecast Budget
2014/15 2015/16 2016/17 2017/18 2018/19
$’000 $’000 $’000 $’000 $’000
REVENUES
Revenue from Operating Activities
Rates Revenue 31,461 33,254 35,046 36,753 38,537
Special Rates - - - - -
Operating Grants 11,430 10,932 10,935 10,969 11,298
Capital Grants 5,596 4,525 3,485 1,845 1,850
Capital contributions 193 688 213 224 235
Contributions- cash 115 133 139 146 154
Contributions- non - monetary (Donated assets) 200 200 200 200 200
Reimbursements and Subsidies 60 63 65 66 68
User Charges 2,893 2,934 3,073 3,154 3,239
Statutory Fees and Fines 914 862 894 950 981
Revenue from Outside the Operating Activities - - - - -
Interest 360 350 364 379 394
Other Revenue (Refer Note 1) 448 366 514 446 491
Net Proceeds of Sale of Land Held for Resale 73 42 30 30 30
Net Gain on Disposal of Property, Plant &
Equipment 7 41 25 25 25
Share of Net Profit of Associated Entiry - - - - -
Previously Unrecognised Assets - - - - -
Total revenue 53,749 54,389 54,984 55,188 57,503
EXPENSES
Expenses from Ordinary Activities - - - - -
Employee Benefits 18,611 19,699 21,015 21,846 22,646
Materials & Consumables 11,230 11,003 11,040 11,206 11,608
External Contract Services 5,756 6,345 6,388 6,671 6,733
Utilities 992 967 1,001 1,036 1,073
Bad and Doubtful Debts 5 5 5 5 5
Depreciation 8,740 8,886 9,107 9,310 9,474
Other expenses (Refer Note 2) 4,400 4,459 4,590 4,741 4,896
Interest on Borrowings 527 465 391 316 234
Interest on Unwinding of Discount of Provisions 430 491 512 537 561
Increase in landfill provision - - - - -
Written Down Value of Infrastructure Replaced 200 200 200 250 250
Small Plant Written off - - - - -
Net Loss on Disposal of Property, Plant &
Equipment - - - - -
Fair value adjustment - - - - -
Share of Net Lossof Associated Entity 20 20 20 20 20
Total Expenses 50,910 52,541 54,270 55,938 57,499
Net Surplus / (Deficit) for the year 2,839 1,848 714 (750) 4
Strategic Resource Plan
Projections

Balance SheetCurrent
Year
Adopted
For the four years ending 30 June 2019Forecast Budget
2014/15 2015/16 2016/17 2017/18 2018/19
$’000 $’000 $’000 $’000 $’000
Current Assets
Cash Assets 14,670 13,658 12,350 9,618 8,287
Receivables 3,700 3,766 4,024 4,152 4,356
Inventory 424 438 450 461 473
Land held for Resale 231 441 472 502 532
Other 123 127 130 133 137
Total Current Assets 19,148 18,431 17,425 14,867 13,785
Non-Current Assets
Receivables 57 131 121 114 321
Property Plant and Equipment 499,930 501,806 503,427 505,282 506,034
Intangible Assets 910 910 910 910 910
Investments in Associate 629 609 589 569 549
Total Non-Current Assets 501,526 503,456 505,047 506,874 507,813
TOTAL ASSETS 520,674 521,886 522,472 521,741 521,598
Current Liabilities
Payables 2,800 2,905 2,932 3,029 3,039
Trusts 565 582 600 618 636
Interest Bearing Liabilities 892 966 1,041 1,123 988
Non-Interest Bearing Liabilities 60 60 - - -
Employee Benefits 3,781 4,198 4,613 5,044 5,491
Provision for Landfill Rehabilitation 1,003 970 1,011 1,060 1,108
Total Current Liabilities 9,101 9,682 10,198 10,874 11,262
Non-Current Liabilities
Trade and Other Payables - - - - -
Interest Bearing Liabilities 5,579 4,614 3,572 2,449 1,461
Non-Interest Bearing Liabilities 60 0 - - -
Employee Benefits 401 468 538 610 685
Provision for Landfill Rehabilitation 8,030 7,772 8,099 8,492 8,872
Total Non-Current Liabilities 14,070 12,853 12,209 11,552 11,018
TOTAL LIABILITIES 23,172 22,535 22,407 22,426 22,280
NET ASSETS 497,503 499,351 500,065 499,315 499,318
EQUITY
Accumulated Surplus 174,302 108,571 176,804 176,024 175,998
Statutory Reserves 1,311 1,341 1,371 1,401 1,431
Asset Revaluation Reserves 321,890 389,439 321,890 321,890 321,890
TOTAL EQUITY 497,503 499,351 500,065 499,315 499,318
Strategic Resource Plan
Projections

Statement of Changes in Equity
For the four years ending 30 June 2019
TotalAccumulated
Surplus
Revaluation
Reserve
Other
Reserves
$'000 $'000 $'000 $'000
2015/16
Balance at the beginning of the year 497,503 174,302 321,890 1,311
Adjustment on change in accounting policy - - - -
Comprehensive result 1,848 1,848 - -
Net asset revaluation increment (decrement) - (67,549) 67,549 -
Impairment losses on revalued assets - - - -
Transfer to reserves - - - -
Transfer from reserves - (30) - 30
Balance at the end of the financial year 499,351 108,571 389,439 1,341
2016/17
Balance at the beginning of the year 499,351 108,571 389,439 1,341
Adjustment on change in accounting policy - - - -
Comprehensive result 714 714 - -
Net asset revaluation increment (decrement) - 67,549 (67,549) -
Impairment losses on revalued assets - - - -
Transfer to reserves - - - -
Transfer from reserves - (30) - 30
Balance at the end of the financial year 500,065 176,804 321,890 1,371
2017/18
Balance at the beginning of the year 500,065 176,804 321,890 1,371
Adjustment on change in accounting policy - - - -
Comprehensive result (750) (750) - -
Net asset revaluation increment (decrement) - - - -
Impairment losses on revalued assets - - - -
Transfer to reserves - - - -
Transfer from reserves - (30) - 30
Balance at the end of the financial year 499,315 176,024 321,890 1,401
2018/19
Balance at the beginning of the year 499,315 176,024 321,890 1,401
Adjustment on change in accounting policy - - - -
Comprehensive result 4 4 - -
Net asset revaluation increment (decrement) - - - -
Impairment losses on revalued assets - - - -
Transfer to reserves - - - -
Transfer from reserves - (30) - 30
Balance at the end of the financial year 499,318 175,998 321,890 1,431

Statement of Cash Flows Current Year Adopted
For the four years ending 30 June 2019 Forecast Budget
2014/15 2015/16 2016/17 2017/18 2018/19
$’000 $’000 $’000 $’000 $’000
CASH FLOWS FROM OPERATING ACTIVITIES
Receipts from Ratepayers 31,234 33,062 34,921 36,661 38,193
Receipts from Grants 17,026 15,457 14,420 12,814 13,149
Contributions 308 820 353 370 389
Reimbursements and Subsidies 60 63 65 66 68
User Charges/Statutory Fees & Fines 3,731 3,829 3,832 4,071 4,149
Interest Received 360 350 364 379 394
Other Receipts 448 366 514 446 491
Proceeds from Sale of Land held for Resale 142 100 300 300 300
Net GST refund - - - - -
Payments to Employees (18,149) (19,215) (20,530) (21,343) (22,124)
Payments to Suppliers (17,987) (18,229) (18,417) (18,831) (19,419)
Interest paid (527) (465) (391) (316) (234)
Payments for Purchase of Land held for Resale (300) (300) (300) (300) (300)
Other payments (4,400) (4,459) (4,590) (4,741) (4,896)
NET CASH FLOWS FROM OPERATING ACTIVITIES11,944 11,379 10,539 9,576 10,159
CASHFLOWS FROM INVESTING ACTIVITIES
Proceeds from Sale of Fixed Assets 67 101 250 250 250
From Community Organisations - - - - -
Recoupment of Loans/Advances (15) 15 8 - -
Payments for Purchase of Fixed Assets (10,892) (11,571) (11,096) (11,535) (10,635)
NET CASHFLOWS FROM INVESTING ACTIVITIES (10,839) (11,456) (10,839) (11,285) (10,385)
CASH FLOWS FROM FINANCING ACTIVITIES
Repayment of Borrowings (830) (892) (966) (1,041) (1,123)
Repayment of Non-Interest Bearing Liabilities (60) (60) (60) - -
Increase/(decrease) of Trust Monies 16 17 17 18 19
Proceeds from Borrowings - - - - -
NET CASH FLOWS FROM FINANCING ACTIVITIES (873) (936) (1,008) (1,023) (1,105)
NET CHANGE IN CASH HELD 232 (1,012) (1,308) (2,732) (1,331)
Cash at Beginning of the Financial Year 14,438 14,670 13,658 12,350 9,618
CASH AT END OF FINANCIAL YEAR 14,670 13,658 12,350 9,618 8,287
Strategic Resource Plan
Projections

Statement of Capital Works Current Year Adopted
For the four years ending 30 June 2019Forecast Budget
2014/15 2015/16 2016/17 2017/18 2018/19
$’000 $’000 $’000 $’000 $’000
Property
Land - - 300 - -
Land Improvements 2,408 1,132 1,500 500 2,000
Total land 2,408 1,132 1,800 500 2,000
Buildings 1,281 2,315 500 2,000 400
Total property 3,690 3,447 2,300 2,500 2,400
Plant and equipment
Plant and equipment 801 957 835 535 535
Playground Equipment - 250 50 50 50
Furniture & Equipment 400 56 - - -
Total plant and equipment 1,201 1,263 885 585 585
Infrastructure
Bridges - 180 350 1,250 250
Drainage 525 380 600 500 500
Footpaths 80 325 200 200 200
Kerb and channel - 400 400 400 400
Other Assets 175 - 250 70 70
Pumps - - 150 50 150
Roads 5,220 5,576 5,961 5,980 6,080
Total infrastructure 6,000 6,861 7,911 8,450 7,650
Total capital works expenditure 10,892 11,571 11,096 11,535 10,635
Represented by:
Asset upgrade expenditure 3,447 2,351 1,740 2,290 1,840
Asset expansion expenditure 739 2,583 2,585 1,535 535
Asset renewal expenditure 6,706 6,637 6,771 7,710 8,260
Total capital works expenditure 10,892 11,571 11,096 11,535 10,635
Strategic Resource Plan
Projections

Statement of Human Resources Forecast Budget
For the four years ending 30 June 2019 2014/15 2015/16 2016/17 2017/18 2018/19
Staff expenditure $'000 $'000 $'000 $'000 $'000
Employee costs - Operating 18,611 19,699 21,015 21,846 22,646
Employee costs - Capital
Total staff expenditure 18,611 19,699 21,015 21,846 22,646
EFT EFT EFT EFT EFT
Staff numbers
Employees 205.0 207.7 207.7 207.7 207.7
Total staff numbers 205.0 207.7 207.7 207.7 207.7
Strategic resource Plan

Appendix B – Rates and Charges
This appendix presents information about rates and charges.

Rates and charges
1.1 The rate in the dollar to be levied as general rates under Section 158 of the Act for each type or class of land compared with the previous financial year
Type or class of land 2014/15 2015/16
cents/$CIV cents/$CIV Change
Vacant rate for rateable residential properties 0.7695 0.8003 4.0%
General rate for rateable residential properties 0.3848 0.4002 4.0%
Vacant rate for rateable farm properties 0.3848 0.4002 4.0%
General rate for rateable farm properties 0.3848 0.4002 4.0%
Vacant rate for rateable commercial properties 0.7695 0.8003 4.0%
General rate for rateable commercial properties 0.5387 0.5602 4.0%
Vacant rate for rateable industrial properties 0.7695 0.8003 4.0%
General rate for rateable industrial properties 0.5387 0.5602 4.0%
Vacant rate for rateable rural properties 0.7695 0.8003 4.0%
General rate for rateable rural properties 0.3848 0.4002 4.0%
Rate concession for rateable recreational properties
0.3729 0.3878 4.0%
DHS Elderly 0.1953 0.2031 4.0%
1.2 The estimated total amount to be raised by general rates in relation to each type or class of land, and the estimated total amount to be raised by general rates, compared with the previous financial year
Type or class of land 2014/15 2015/16
$ $ Change
Residential 10,372,244 10,986,688 5.9%
Farm 5,255,496 5,295,239 0.8%
Commercial 1,847,241 1,933,171 4.7%
Industrial 908,865 949,497 4.5%
Rural 1,719,556 1,885,268 9.6%
Recreational 1,518 1,578 4.0%
DHS Elderly 9,628 10,200 5.9%
Total amount to be raised by general rates 20,114,548 21,061,641 4.7%

1.3 The number of assessments in relation to each type or class of land, and the total number of assessments, compared with the previous financial year
Type or class of land 2014/15 2015/16
Number Number Change
Residential 10,828 10,882 0.5%
Farm 3,482 3,316 -4.8%
Commercial 1,043 1,033 -1.0%
Industrial 104 111 6.7%
Rural 1,582 1,707 7.9%
Recreational 1 1 0.0%
DHS Elderly 63 62 -1.6%
Total number of assessments 17,103 17,112 0.1%
1.4 The basis of valuation to be used is the Capital Improved Value (CIV) 1.5 The estimated total value of each type or class of land, and the estimated total value of land, compared with the previous financial year
Type or class of land 2014/15 2015/16
$ $ Change
Residential 2,541,353,800 2,580,151,300 1.5%
Farm 1,365,926,500 1,323,148,100 -3.1%
Commercial 339,640,300 341,990,000 0.7%
Industrial 166,589,000 167,212,000 0.4%
Rural 431,478,600 452,930,000 5.0%
Recreational 407,000 407,000 0.0%
DHS Elderly 4,931,000 5,022,000 1.8%
Total value of land 4,850,326,200 4,870,860,400 0.4%
1.6 The municipal charge under Section 159 of the Act compared with the previous financial year
Type of Charge
Per Rateable
Per Rateable
Change Property Property
2014/15 2015/16
$ $
Municipal 305.65 317.85 4.0%

1.7 The estimated total amount to be raised by municipal charges compared with the previous financial year
Type of Charge 2014/15 2015/16
$ $ Change
Municipal 4,960,908 5,128,382 3.4%
1.8 The rate or unit amount to be levied for each type of service rate or charge under Section 162 of the Act compared with the previous financial year
Type of Charge
Per Rateable
Per Rateable
Change Property Property
2014/15 2015/16
$ $
Garbage Service 98.65 102.60 4.0%
Recycling Service 88.95 92.50 4.0%
Organic Waste Service 97.20 97.20 0.0%
Environmental Levy 206.50 214.75 4.0%
Total 491.30 507.05 3.2%
1.9 The estimated total amount to be raised by each type of service rate or charge, and the estimated total amount to be raised by service rates and charges, compared with the previous financial year
Type of Charge 2014/15 2015/16
$ $ Change
Garbage Service 1,221,499 1,304,456 6.8%
Recycling Service 1,070,358 1,140,988 6.6%
Environmental Levy 3,276,464 3,467,998 5.8%
Organic Waste Service 881,820 758,160 -14.0%
Total 6,450,141 6,671,602 3.4%
1.10 The estimated total amount to be raised by all rates and charges compared with the previous financial year
2014/15 2015/16
$ $ Change
General Rates 20,114,548 21,061,641 4.7%
Municipal Charge 4,960,908 5,128,382 3.4%
Environmental Levy and Garbage and Recycling Service
6,450,141 6,671,602 3.4%
Rates and Charges 31,525,597 32,861,625 4.2%

1.11 Any significant changes that may affect the estimated amounts to be raised by rates and charges There are no known significant changes which may affect the estimated amounts to be raised by rates and charges. However, the total amount to be raised by rates and charges may be affected by: • The making of supplementary valuations (2015/16: estimated $340,000, 2014/15: $340,000)• The variation of returned levels of value (e.g. valuation appeals)• Changes in use of land such that rateable land becomes non-rateable land and vice versa• Changes in use of land such that residential land becomes business land and vice versa.
2. Differential rates
2.2 Rates to be levied
The rate and amount of rates payable in relation to land in each category of differential are:
• A general rate of 0.8003% (0.8003 cents in the dollar of CIV) for all rateableresidential vacant properties
• A general rate of 0.4002% (0.4002 cents in the dollar of CIV) for all rateableresidential building properties.
• A general rate of 0.4002% (0.4002 cents in the dollar of CIV) for all rateable farmvacant properties.
• A general rate of 0.4002% (0.4002 cents in the dollar of CIV) for all rateable farmbuilding properties.
• A general rate of 0.8003% (0.8003 cents in the dollar of CIV) for all rateablecommercial vacant properties.
• A general rate of 0.5602% (0.5602 cents in the dollar of CIV) for all rateablecommercial building properties.
• A general rate of 0.8003% (0.8003 cents in the dollar of CIV) for all rateable industrialvacant properties.
• A general rate of 0.5602% (0.5602 cents in the dollar of CIV) for all rateable industrialbuilding properties.
• A general rate of 0.8003% (0.8003 cents in the dollar of CIV) for all rateable ruralvacant properties.
• A general rate of 0.4002% (0.4002 cents in the dollar of CIV) for all rateable ruralbuilding properties.
• A general rate of 0.3878% (0.3878 cents in the dollar of CIV) for all rateable cultural &recreational properties.
• A general rate of 0.2031% (0.2031 cents in the dollar of CIV) for all rateable DHSElderly properties.
Each differential rate will be determined by multiplying the Capital Improved Value of rateable land (categorised by the characteristics described below) by the relevant percentages indicated above.
Council believes each differential rate will contribute to the equitable and efficient carrying out of council functions. Details of the objectives of each differential rate, the types of classes of land which are subject to each differential rate and the uses of each differential rate are set out below.

2.2 Commercial land
Commercial land is any land which is:
• Occupied for the principal purpose of carrying out the manufacture or production of, ortrade in, goods or services or
• Unoccupied but zoned commercial or industrial under the Moira Shire CouncilPlanning Scheme.
The objective of this differential rate is to ensure that all rateable land makes an equitable financial contribution to the cost of carrying out the functions of Council, including (but not limited to) the:
• Construction and maintenance of infrastructureassets
• Development and provision of health and communityservices
• Provision of general supportservices.
The types and classes of rateable land within this differential rate are those having the relevant characteristics described above.
The money raised by the differential rate will be applied to the items of expenditure described in the Budget by Council. The level of the rate for land in this category is considered to provide for an appropriate contribution to Council’s budgeted expenditure, having regard to the characteristics of the land.
The geographic location of the land within this differential rate is wherever it is located within the municipal district, without reference to ward boundaries.
The use of the land within this differential rate, in the case of improved land, is any use of land.
The characteristics of planning scheme zoning are applicable to the determination of vacant land which will be subject to the rate applicable to commercial land. The vacant land affected by this rate is that which is zoned commercial and/or industrial under the Moira Shire Council Planning Scheme. The classification of land which is improved will be determined by the occupation of that land, and have reference to the planning scheme zoning.
The types of buildings on the land within this differential rate are all buildings already constructed on the land or which will be constructed prior to the expiry of the 2015/16 financial year.

2.3 Residential land
Residential land is any land, which is:
• Occupied for the principal purpose of physically accommodatingpersons or
• Unoccupied but zoned residential under the Moira Shire Council Planning Scheme andwhich is not commercial land.
The objective of this differential rate is to ensure that all rateable land makes an equitable financial contribution to the cost of carrying out the functions of Council, including (but not limited to) the:
• Construction and maintenance of infrastructureassets
• Development and provision of health and communityservices
• Provision of general supportservices.
The types and classes of rateable land within this differential rate are those having the relevant characteristics described above.
The money raised by the differential rate will be applied to the items of expenditure described in the Budget by Council. The level of the rate for land in this category is considered to provide for an appropriate contribution to Council’s budgeted expenditure, having regard to the characteristics of the land.
The geographic location of the land within this differential rate is where it is located within the municipal district, without reference to ward boundaries.
The use of the land within this differential rate, in the case of improved land, is any use of land.
The characteristics of planning scheme zoning are applicable to the determination of vacant land which will be subject to the rate applicable to residential land. The vacant land affected by this rate is that which is zoned residential under the Victorian Local Council Planning Scheme. The classification of land which is improved will be determined by the occupation of that land, and have reference to the planning scheme zoning.
The types of buildings on the land within this differential rate are all buildings already on the land or which will be constructed prior to the expiry of the 2015/16 financial year.

Appendix C – Capital works program
This appendix presents a listing of the capital works that will be undertaken for the 2015/16
year. The capital works projects are grouped by class and included the following
New works for 2015/16
Works carried forward from 2014/15 year

Asset class Project Title Description
Asset
Category
Income / Funding
Source
Total Project
Budget
Total Project
Income
Nett Cost
to Council
Bridges Bridge Renewal Program
Remedial works on bridges as identified by the asset management bridge
inspection program. (Wrights Bridge, Hancocks Bridge, Tungamah-Peechelba
Road, footbridge Murray Valley Highway, Torgannah Road, Walshs Bridge) R $180,000 $180,000
Bridges Total $180,000 - $180,000
Buildings Automatic Doors, Library, Nathalia Installation of new automatic doors on the front entrance of the Library at Nathalia. U $10,000 $10,000
Car park, Maternal and Child Health
Centre, Yarrawonga
Construction of an undercover car park area at the Maternal and Child Health
Centre at Yarrawonga. U $15,000 $15,000
Disaster Recovery, Information
Technology
Relocation of the Disaster Recovery backup server IT facilities. The current
location suffers from poor connectivity and low speed. U $110,000 $110,000
Library, Cobram
Additional funding to provide a Library at Cobram. The total budget with this
funding will be $1,800,000. The funding is made up of $500,000 from Living
Libraries, $250,000 from Regional Development Victoria, $150,000 from the
Community and $900,000 from Council. (Includes $1M expenditure and $250,000
income rebudgetted from 2014/15) E
Community
Contribution $1,600,000 ($400,000) $1,200,000
Pool Heater Replacement, Numurkah
Aquatic Centre, Numurkah
Replacement of the heating unit in the pool hall. The unit supplies warm air to the
pool hall, and has a history of failing due to its age (20 years). R $100,000 $100,000
Public Halls Renewal Program
Renewal of Halls as per the condition audit. Renewal of floor surfaces at
Strathmerton, and Picola, together with painting of Picola and Lake Rowan Halls. R
Community
Contribution $100,000 ($7,000) $93,000
Public Toilets Renewal Program
Renewal works to the public toilets at Quinn Street, Numurkah, Tower Park,
Nathalia, and Rotary Park, Yarrawonga. Works will include replacement of
damaged fittings and painting. R $70,000 $70,000
Public Toilets, Quinn Street, Numurkah
Upgrade of Quinn Street, Numurkah Public Toilets to include all abilities access
facilities. U $15,000 $15,000
Compliance Works, Animal Pound,
Cobram
Works required within the domestic animal pound, at Cobram, to achieve
compliance with the Shelters and Pounds Code of Practice. U $60,000 $60,000
Electrical Audit Implementation Program
Implementation of the electrical audit undertaken on Council buildings in 2014/15.
Works will be undertaken in accordance with the recommendations of the Electrical
Audit U $50,000 $50,000
Immunisation Fridges, Cobram Service
Centre
Relocation of immunisation fridges at the Cobram Service Centre to ensure that
back up power is available. U $5,000 $5,000
Building Urgent Safety Works
Urgent Safety Works to address public safety and severe deterioration of buildings
used by the community. R $130,000 $130,000
Multi Purpose Building, Numurkah Regrade the stairs at the Multi purpose building at the Numurkah Showgrounds. U $50,000 $50,000
Buildings Total $2,315,000 ($407,000) $1,908,000
Computers &
telecommunications Aerial Photography GIS Imagery Acquisition of updated aerial photography for integration into the GIS system. U $50,000 $50,000
Telemetry, Generator, Cobram Service
Centre
Installation of an SMS module into the backup generator located at the Cobram
Service Centre. E $6,000 $6,000
Computers & telecommunications Total $56,000 - $56,000
Drainage Drainage Upgrade, Yarrawonga
Design of the first Stage of drainage upgrades recommended from the Yarrawonga
Drainage Study. U $150,000 $150,000
Capital Projects 2015/16

Asset class Project Title Description
Asset
Category
Income / Funding
Source
Total Project
Budget
Total Project
Income
Nett Cost
to Council
Capital Projects 2015/16
Drainage, Gemmel Street, Cobram
Excavation and disposal of vegetation and silt from the drainage dam located in the
industrial area off Karook Street, Cobram, to ensure it meets its design capacity
and performance. R $100,000 $100,000
Drainage, Northeast Retarding Basin,
Cobram
Excavation and disposal of vegetation and silt from the retarding basin located west
of Wondah Street, Cobram, to ensure that it meets its design capacity and
performance. R $120,000 $120,000
Drainage, Schubert Street, Cobram
Excavation and disposal of vegetation and silt from the drainage dam located in the
industrial area off Schubert Street, Cobram, to ensure it meets its design capacity
and performance. R $10,000 $10,000
Drainage Total $380,000 - $380,000
Footpaths and cycle
ways Footpath Renewal Program
Program to replace broken sections of footpath in accordance with asset condition
survey. R $65,000 $65,000
Footpath, Blake Street, Nathalia Reconstruction of the footpath in Blake Street, Nathalia. R $230,000 $230,000
Shared Path, Hogans Road, Yarrawonga
Construction of a temporary granitic sand path adjacent to Hogans Road,
Yarrawonga, from the Murray Valley Highway to Rosemary Court. E $30,000 $30,000
Footpaths and cycle ways Total $325,000 - $325,000
Kerb and Channel Kerb and Channel Replacement Program
Replacement of Kerb and Channel at various locations in accordance with the
Asset Management System and condition audits. R R2R Grant $400,000 ($400,000) -
Kerb and Channel Total $400,000 ($400,000) -
Land Improvements Renewal of Park Furniture Program
Renewal of park furniture that has reached the end of its life and is in poor
condition at the following parks; Barmah, Nathalia, Numurkah and Katunga. R $15,000 $15,000
Renewal, Levee Banks, Nathalia
Renew the capping layer of the levee bank for 300 metres adjoining the Broken
Creek, between the Ryans Road/Pearce Street intersection and Chapel Street/
Katamatite-Nathalia Road, Nathalia. R $180,000 $180,000
Landfill Various Works
Works to be undertaken primarily at the Landfill site in Cobram to ensure that the
operation is carried out in accordance with EPA requirements. U $70,000 $70,000
Upgrade Swimming Pools, Yarrawonga
and Nathalia
Application of a water proof paint surface to the swimming pools at the Yarrawonga
and Nathalia Swimming centres and removal and replantng of appropriate trees at
Nathalia Swimming Pool ($15,000) R $95,000 $95,000
Recreational Trail, Yarrawonga
Recreational trail from the Yarrawonga Town centre to Botts Road, along the
foreshore. Project to include, interpretive signage, solar lights, and exercise
equipment along the route. E
Open Space
Reserve Fund $50,000 ($50,000) -
Renewal Works, Cell 1 to 3 (Old Cells),
Cobram Landfill
Works to be undertaken on Old Cells that have been rehabilitated at the Landfill
site in Cobram to ensure that the operation is carried out in accordance with EPA
requirements. R $22,000 $22,000
Renewal Works, Landfill Site, Yarrawonga
Works to be undertaken on the rehabilitated Yarrawonga landfill site to ensure that
the site is managed in accordance with EPA requirements. R $20,000 $20,000
Caravan Park, Yarrawonga
Council contribution to upgrade of works and studies at the Yarrawonga Caravan
Park in partnership with the new lease holders. E $180,000 $180,000
Aerodrome, Yarrawonga
Works in accordance with recent CASA inspection and requirements. Widening of
taxiways and upgrade of runway 05/23. Grant applied for but not confirmed.
(Project rebudgetted from 2014/15, $500,000 expenditure and $400,000 income) U
Grants - applied
for $500,000 ($400,000) $100,000
Land Improvements Total $1,132,000 ($450,000) $682,000

Asset class Project Title Description
Asset
Category
Income / Funding
Source
Total Project
Budget
Total Project
Income
Nett Cost
to Council
Capital Projects 2015/16
Off street car parks Carpark, Witt Street, Yarrawonga Construction of an extension to the car park at Witt Street, Yarrawonga. U Car Park Reserve $110,000 ($110,000) -
Off street car parks Total $110,000 ($110,000) -
Plant, machinery &
equipment Heavy Plant – Replacement of Back Hoe
Replacement of the backhoe at the Numurkah Depot in accordance with the Plant
Replacement Program. R
Proceeds from
sale of plant $135,000 ($20,000) $115,000
Heavy Plant – Replacement of Mowers Replacement of four out-front mowers as per the plant replacement program. R
Proceeds from
sale of plant $115,000 ($32,000) $83,000
Plant Replacement, 3 cubic metre Tip
Truck
Replacement of a 3 cubic metre Tip Truck in accordance with the Plant
Replacement Program R
Proceeds from
sale of plant $100,000 ($12,000) $88,000
Plant Replacement, Dingo Replacement of plant, Dingo equivalent as per plant replacement program. R
Proceeds from
sale of plant $60,000 ($14,000) $46,000
Small Plant Replacement Program Replacement of small plant in accordance with the plant replacement program. R
Proceeds from
sale of plant $24,000 ($2,500) $21,500
Small Plant Replacement Programme
>$2,000.00
Replacement of small plant of value greater than $2000 in accordance with the
plant replacement program. R
Proceeds from
sale of plant $125,000 ($20,000) $105,000
Light Fleet Vehicle Replacement Program
Purchase of nine light fleet vehicles to replace vehicles at the end of lease period.
In accordance with the light fleet vehicle Strategy, adopted in 2014. R $350,000 $350,000
Trailer Mounted High Pressure Drain
Maintenance Unit
Nett lease cost, of a trailer mounted high pressure drain cleaning and maintenance
unit. The unit will be used to clean drains in accordance with a pro-active
maintenance schedule, and reduce Council's use of specialist Contractors. E $8,000 $8,000
Renewal Program, Aquatic Facilities
Implementation of a program developed after the 2014/15 condition audit to
undertake a preventative maintenance and renewal program within Council's
aquatic facilities. R $40,000 $40,000
Plant, machinery & equipment Total $957,000 ($100,500) $856,500
Playground
Equipment Playground Renewal Program Renewal of playground equipment in accordance with the asset condition audit. R $50,000 $50,000
All abilities Playground, Yarrawonga
Council contribution to the implementation (Construction Costs) of a new All
Abilities Playground at Yarrawonga. To be funded from the Open Space Reserve. E
Open Space
Reserve Fund $200,000 ($200,000) -
Playground Equipment Total $250,000 ($200,000) $50,000
Roads Bituminous Reseal program
Resealing of Council’s road network in accordance with the pavement condition
audit. R R2R Grant $1,400,000 ($1,200,000) $200,000
Intersection Upgrade, Numurkah Road,
Katunga
Intersection upgrade and re-alignment of the intersection of Numurkah Road,
Sandmount Road and Hendys Road, at Katunga. Works are to address the high
accident rate, and are dependant upon external funding. U
Grants -
opportunity
identified $600,000 ($600,000) -
Intersection Works, Botts Road/Murray
Valley Highway, Yarrawonga
Installation of turning lanes at the intersection of Botts Road and the Murray Valley
Highway at Yarrawonga, in accordance with the Yarrawonga Development plan. E
Developer
Contribution $350,000 ($170,617) $179,383
Pavement Stabilising Program
Stabilisation of damaged sealed road pavements undertaken in conjunction with
the resealing program. R $600,000 $600,000
Reconstruction, St James Road, Yundool
Reconstruction of a damaged section of St James Road between Benalla
Tocumwal Road and Yundool Road. R R2R Grant $550,000 ($275,000) $275,000
Resheeting, Gravel Road Network
Resheeting of gravel roads in accordance with the condition audits undertaken on
the gravel road network. R R2R Grant $1,000,000 ($1,000,000) -

Asset class Project Title Description
Asset
Category
Income / Funding
Source
Total Project
Budget
Total Project
Income
Nett Cost
to Council
Capital Projects 2015/16
Shire and Town Entrance Signage
Design and Installation of Highway entrance signs. Replacement of the signage
that visitors and others see as they approach the Shire of Moira. R $50,000 $50,000
Urban Dust Suppression Program
Provision of urban an dust suppression seal to the residential streets of Katunga
and Lake Rowan. E $185,000 $185,000
Widening, Naring road, Numurkah
Widening of Naring Road, Numurkah between Numurkah Road and Kinnairds
Road U R2R Grant $325,000 ($325,000) -
Traffic Safety Works, Moran Street, Picola
The Moran Street and Picola Nth Road, intersection has poor accident statistics.
Installation of islands and additional kerb will improve the intersection and address
all likely causes of intersection accidents. U
Grants - to be
sought $150,000 ($75,000) $75,000
LED Streetlight Replacement program Contribution to Council's commitment to replace street lights with LED luminaires. R $111,406 $111,406
Final Seals 2013/14 Urban Dust
Suppression Program
This program will place a final bituminous seal over the streets sealed in Barmah
as part of last year’s Urban Dust Suppression program. U $70,000 $70,000
Culvert Guard Fences, Inspection and
Renewal Program
Inspection of Culvert guard fences and staged replacement of those in poor
condition. R $75,000 $75,000
Roads Total $5,466,406 ($3,645,617) $1,820,789
Grand Total $11,571,406 ($5,313,117) $6,258,289
Asset classes are shown as; R-Renewal, U-Upgrade and E-Expansion or new assets created by implementation of the Capital program.

Appendix D Fees and Charges Schedule
This appendix presents the fees and charges of a statutory and non–statutory nature which will be charged in respect to various goods and services provided during the 2015/16 year.

2015/16 BUDGET REPORT FEES AND CHARGES SCHEDULE MOIRA SHIRE COUNCIL
Activity/Function Title of Fee or Charge GST
Statutory Cost
Recovery,
Full Cost
Recovery
or Subsidised
Fee or Charge
2014/15
Proposed
Fee or Charge
2015/16
% Change Comments
Municipal road or non arterial state road on which the maximum speed limit for vehicles at any
time is more than 50 kilometres per hour Fee Units = 45.0No
Statutory Cost
Recovery$595.80 $612.00 2.7%
Municipal road or non arterial state road on which the maximum speed limit for vehicles at any
time is not more than 50 kilometres per hour Fee Units = 20.0No
Statutory Cost
Recovery$264.80 $272.00 2.7%
Municipal Road or non arterial state road on which the maximum speed limit for vehicles at any
time is more than 50 kilometres per hour Fee Units = 25.0No
Statutory Cost
Recovery$331.00 $340.00 2.7%
Municipal road or non arterial state road on which the maximum speed limit for vehicles at any
time is not more than 50 kilometres per hour Fee Units = 5.0No
Statutory Cost
Recovery$66.20 $68.00 2.7%
Municipal Road or non arterial state road on which the maximum speed limit for vehicles at any
time is more than 50 kilometres per hour Fee Units = 11.5No
Statutory Cost
Recovery$152.30 $156.40 2.7%
Municipal road or non arterial state road on which the maximum speed limit for vehicles at any
time is not more than 50 kilometres per hour Fee Units =11.5No
Statutory Cost
Recovery$152.30 $156.40 2.7%
Municipal Road or non arterial state road on which the maximum speed limit for vehicles at any
time is more than 50 kilometres per hour Fee Units = 5.0No
Statutory Cost
Recovery$66.20 $68.00 2.7%
Municipal road or non arterial state road on which the maximum speed limit for vehicles at any
time is not more than 50 kilometres per hour Fee Units =5.0No
Statutory Cost
Recovery$66.20 $68.00 2.7%
Existing single pipeline crossing of a road NoFull Cost
Recovery$51.25 $52.60 2.6%
New single pipeline crossing of a road NoFull Cost
Recovery$51.25 $52.60 2.6%
Existing pipeline which runs longitudinally in the road reserve NoFull Cost
Recovery$102.50 $105.20 2.6%
New pipeline longitudinally in the road reserve (per 100m of pieline) NoFull Cost
Recovery$512.50 $525.90 2.6%
Title Search Title Search for Private Pipelines YesFull Cost
Recovery$27.50 $28.20 2.6%
Avdata Key Purchase of Avdata Key YesFull Cost
Recovery$33.00 $33.00 0%
WORKS WITHIN A ROAD RESERVE / ROAD OPENING PERMITS
Works, other than minor works
Minor works
Conducted on, or on
any part of the
roadway, shoulder or
pathway
Not conducted on, or
on any part of, the
roadway, shoulder or
pathway
Conducted on, or on
any part of the
roadway, shoulder or
pathway
Not conducted on, or
on any part of, the
roadway, shoulder or
pathway
Animal Control
One fee unit = $13.60. Fee units are in
accordance with the Monetary Units Act 2004.
Fees are not payable in respect of minor works
that do not require consent by Regulations.
PRIVATE PIPELINES
Pipelines are constructed as a Section 173 agreement under the provision of the Planning and Environment Act 1987. The annual rental is for the use of the roadway
ANIMAL CONTROL
AVDATA
Annual Licence Fees
1 of 20

2015/16 BUDGET REPORT FEES AND CHARGES SCHEDULE MOIRA SHIRE COUNCIL
Activity/Function Title of Fee or Charge GST
Statutory Cost
Recovery,
Full Cost
Recovery
or Subsidised
Fee or Charge
2014/15
Proposed
Fee or Charge
2015/16
% Change Comments
Domestic Animals
Act 1994Not Wearing Tags or Marker No
Statutory Cost
Recovery$74.00
2015/16 Statutory Fee
schedule is expected
to be published in the
later part of 2015
0%
Cat at large NoStatutory Cost
Recovery$74.00
2015/16 Statutory Fee
schedule is expected
to be published in the
later part of 2015
0%
Dog at large in day time NoStatutory Cost
Recovery$221.00
2015/16 Statutory Fee
schedule is expected
to be published in the
later part of 2015
0%
Dog at large at night time NoStatutory Cost
Recovery$295.00
2015/16 Statutory Fee
schedule is expected
to be published in the
later part of 2015
0%
Greyhound not muzzled or controlled No Statutory Cost
Recovery$221.00
2015/16 Statutory Fee
schedule is expected
to be published in the
later part of 2015
0%
Not complying with order to abate nuisance NoStatutory Cost
Recovery$221.00
2015/16 Statutory Fee
schedule is expected
to be published in the
later part of 2015
0%
Unregistered Animals No Statutory Cost
Recovery$295.00
2015/16 Statutory Fee
schedule is expected
to be published in the
later part of 2015
0%
Domestic Animal
BusinessRegistration (Administration) Fee No
Full Cost
Recovery$124.00
2015/16 Statutory Fee
schedule is expected
to be published in the
later part of 2015
0%
Sections 20,21,22, 23
and 32(1)
Infringements
Registration Fees
2 of 20

2015/16 BUDGET REPORT FEES AND CHARGES SCHEDULE MOIRA SHIRE COUNCIL
Activity/Function Title of Fee or Charge GST
Statutory Cost
Recovery,
Full Cost
Recovery
or Subsidised
Fee or Charge
2014/15
Proposed
Fee or Charge
2015/16
% Change Comments
Dog and Cat (Maximum Fee) - Natural No Statutory Cost
Recovery$75.00
2015/16 Statutory Fee
schedule is expected
to be published in the
later part of 2015
0%
Dog and Cat (Reduced Fee) - 3 months and over No Statutory Cost
Recovery$25.00
2015/16 Statutory Fee
schedule is expected
to be published in the
later part of 2015
0%
State Government Levy - Cat YesStatutory Cost
Recovery$2.00
2015/16 Statutory Fee
schedule is expected
to be published in the
later part of 2015
0%
State Government Levy - Dog YesStatutory Cost
Recovery$3.50
2015/16 Statutory Fee
schedule is expected
to be published in the
later part of 2015
0%
Replacement Tags Animal Replacement Tags NoFull Cost
Recovery$5.00 $5.00 0%
Cat Trap Hire Cat Trap Hire (Refundable Deposit)No Full Cost
Recovery$100.00 $100.00 0%
Refundable Deposit
Domestic Animals NoFull Cost
Recovery$108.00 $111.00 2.6%
Livestock 1-9 NoFull Cost
Recovery$321.00 $329.35 2.6%
Livestock 10-49 NoFull Cost
Recovery$670.00 $687.40 2.6%
Livestock 50 plus NoFull Cost
Recovery$1,005.00 $1,031.10 2.6%
Travelling Livestock Fee (Droving) per time with $1,000 bond to Council No Full Cost
Recovery$336.00 $344.70 2.6%
Grazing Permit NoFull Cost
Recovery$23.00 $23.60 2.6%
Applying for a Local
Law permitApplication for a Local Law permit (or if permit expires and renewal not sought prior to expiry) No
Full Cost
Recovery$50.00 $51.30 2.6%
COMMUNITY SAFETY & ENVIRONMENT LOCAL LAW
Pound Fees
Community Safety & Environment Local Law Permit Fees
Droving and Grazing of Livestock Fees
Dog & Cat
Registration
Release fee to Council plus $10 sustenance per
animal per day plus transport costs
As per Domestic Animals Act Pensioners, add
50% discount
3 of 20

2015/16 BUDGET REPORT FEES AND CHARGES SCHEDULE MOIRA SHIRE COUNCIL
Activity/Function Title of Fee or Charge GST
Statutory Cost
Recovery,
Full Cost
Recovery
or Subsidised
Fee or Charge
2014/15
Proposed
Fee or Charge
2015/16
% Change Comments
Street Stalls incl.
RafflesTrading of goods and services on a Footpath/Road Reserve permit No
Full Cost
Recovery$86.00 $88.20 2.6%
Fee for charities, not-for-profit organisations and
community groups may be waived
Application Fee NoFull Cost
Recovery$50.00 $51.30 2.6% Only applies for a new application
Up to 4 tables NoFull Cost
Recovery$106.00 $108.80 2.6%
Per table (in excess of 4 tables) NoFull Cost
Recovery$21.00 $21.55 2.6%
Temporary Screens (Flate Rate) NoFull Cost
Recovery$21.00 $21.55 2.6%
Advertising boards Moveable signs on Footpath/Road Reserve permit NoFull Cost
Recovery$53.00 $54.40 2.6%
Display of Goods on
Footpath/Road
Reserve
Display of Goods on Footpath/Road Reserve permit NoFull Cost
Recovery$133.00 $136.40 2.6%
Car Dealerships
(vehicles on nature
strip)
Car Dealerships (vehicles on nature strip) NoFull Cost
Recovery$127.00 $130.30 2.6%
Local Laws - Permits
Burning off Permits, Burning Off Residential, Recreation Vehicles, Advertising, Bill Posting,
Camping, Circuses, Keeping of Animals, Beehives, Bulk Rubbish Bins, Scavenging at Waste
Disposal Sites, Drainage Tapping
No Full Cost
Recovery$91.00 $93.40 2.6%
Road Safety Act Statutory fines NoStatutory Cost
Recovery
Variable from $89.00
to $148.00
Variable from $89.00
to $148.000% Rate set by Infringements Act in July each year
Council Parking fines - Time limits NoStatutory Cost
Recovery$50.00 $50.00 0% $50 maxium allowed under Road Safety Act
Litter Fines - small amount No Statutory Cost
Recovery$148.00
2015/16 Statutory Fee
schedule is expected
to be published in the
later part of 2015
0%
Litter Fines - large amount No Statutory Cost
Recovery$295.00
2015/16 Statutory Fee
schedule is expected
to be published in the
later part of 2015
0%
4012 - Act contrary to conditions imposed when using a municipal place or property No Full Cost
Recovery$200.00 $200.00 0% Cannot by adjusted under Sentencing Act
4001 - Behave in a boisterous/harmful manner NoFull Cost
Recovery$200.00 $200.00 0% Cannot by adjusted under Sentencing Act
4002 - Behave in a way which is detrimental to the municipal place or public asset No Full Cost
Recovery$200.00 $200.00 0% Cannot by adjusted under Sentencing Act
Parking
Infringements
Litter Fines
Tables & Chairs on
Footpath/Road
Reserve
Local Law Fines - Parking
Local Law Fines - Behaviour
Annual fee payable
Annual fee payable, plus $51 application fee
4 of 20

2015/16 BUDGET REPORT FEES AND CHARGES SCHEDULE MOIRA SHIRE COUNCIL
Activity/Function Title of Fee or Charge GST
Statutory Cost
Recovery,
Full Cost
Recovery
or Subsidised
Fee or Charge
2014/15
Proposed
Fee or Charge
2015/16
% Change Comments
4003- As an owner or occupier of land, did allow trees, plants or any other matter on that land
to cause damage, to ,or interfere with a municipal placeNo
Full Cost
Recovery$200.00 $200.00 0% Cannot by adjusted under Sentencing Act
4006- Did behave in a dangerous manner NoFull Cost
Recovery$200.00 $200.00 0% Cannot by adjusted under Sentencing Act
4008 - Did damage/destroy/write on/interface with/remove or affix anything from a municipal
building or structureNo
Full Cost
Recovery$200.00 $200.00 0% Cannot by adjusted under Sentencing Act
Discharge water onto road No Full Cost
Recovery$200.00 $200.00 0% Cannot by adjusted under Sentencing Act
Riding horses on reservations, public reserves and recreation grounds No Full Cost
Recovery$200.00 $200.00 0% Cannot by adjusted under Sentencing Act
Erecting or placing of signs and goods on footpath No Full Cost
Recovery$200.00 $200.00 0% Cannot by adjusted under Sentencing Act
Roadside trading No Full Cost
Recovery$200.00 $200.00 0% Cannot by adjusted under Sentencing Act
Locating goods for sale No Full Cost
Recovery$200.00 $200.00 0% Cannot by adjusted under Sentencing Act
Outdoor eating facilities No Full Cost
Recovery$200.00 $200.00 0% Cannot by adjusted under Sentencing Act
Street parties, street festivals and processions No Full Cost
Recovery$200.00 $200.00 0% Cannot by adjusted under Sentencing Act
Street collections No Full Cost
Recovery$200.00 $200.00 0% Cannot by adjusted under Sentencing Act
Burning off Permits, Burning Off Residential, Recreation Vehicles, Advertising, Bill Posting,
Camping, Circuses, Keeping of Animals, Beehives, Bulk Rubbish Bins, Scavenging at Waste
Disposal Sites, Drainage Tapping
No Full Cost
Recovery$200.00 $200.00 0% Cannot by adjusted under Sentencing Act
4017 - Consume alcohol in designated area No Full Cost
Recovery$200.00 $200.00 0% Cannot by adjusted under Sentencing Act
4021 - Consume/possess/control alcohol (in unsealed container) between 10pm and 8am
contrary to signsNo
Full Cost
Recovery$200.00 $200.00 0% Cannot by adjusted under Sentencing Act
4018 - Possess/control alcohol in unsealed container in designated area No Full Cost
Recovery$200.00 $200.00 0% Cannot by adjusted under Sentencing Act
4019 - Consume/possess/control alcohol (in unsealed container) contrary to signs NoFull Cost
Recovery$200.00 $200.00 0% Cannot by adjusted under Sentencing Act
4020 - Consume/possess/control alcohol (in unsealed container) between 10 pm and 8am in
designated areaNo
Full Cost
Recovery$200.00 $200.00 0% Cannot by adjusted under Sentencing Act
5001- Cause allow livestock to be driven on a road through or to a destination within the
Municipal district in convention of the local lawNo
Full Cost
Recovery$200.00 $200.00 0% Cannot by adjusted under Sentencing Act
5002 - Cause/allow livestock to graze on a road without a permit No Full Cost
Recovery$200.00 $200.00 0% Cannot by adjusted under Sentencing Act
Infringement Notice Offences and Codes - Livestock
Local Law Fines - Streets & Roads
Local Law - Fines
Infringement Notice Offences and Codes - Alcohol
5 of 20

2015/16 BUDGET REPORT FEES AND CHARGES SCHEDULE MOIRA SHIRE COUNCIL
Activity/Function Title of Fee or Charge GST
Statutory Cost
Recovery,
Full Cost
Recovery
or Subsidised
Fee or Charge
2014/15
Proposed
Fee or Charge
2015/16
% Change Comments
5003- Cause/allow livestock to be driven across/along a road from a property or part of a
property to another property in contravention of the local lawNo
Full Cost
Recovery$200.00 $200.00 0% Cannot by adjusted under Sentencing Act
5016 - Make false representation or declaration (orally or written) or intentionally omit relevant
information in an application for a permit or exemptionNo
Full Cost
Recovery$200.00 $200.00 0% Cannot by adjusted under Sentencing Act
5017 - Fail to comply with a "Notice to Comply" No Full Cost
Recovery$200.00 $200.00 0% Cannot by adjusted under Sentencing Act
Family Day Care - Administration Levy NoFull Cost
Recovery$10.00 $10.00 0% Per family per week
Immunisation - Purchase of vaccination by clients NoFull Cost
Recovery$60.00 $60.00 0% Per vaccine
Breast Pump Hire Fee YesFull Cost
Recovery$10.00 $10.00 0% Per hire per week
Library Fees
Yes on
Items
Sold
Town Hall (includes stage, portable stairs & dress circle) Yes Subsidised
$33.00 per hr
$110.00 - 4 hrs
$220.00 - 8 hrs
$330.00 - 12hrs (Max
fee)
$33.00 per hr
$110.00 - 4 hrs
$220.00 - 8 hrs
$330.00 - 12hrs (Max
fee)
0%
Council Chamber at Town Hall including access to kitchen facilities Yes Subsidised
$22.00 per hr
$55.00 - 4 hrs
$110.00 - 8 hrs
$165.00 - 12 hrs (Max
fee)
$22.00 per hr
$55.00 - 4 hrs
$110.00 - 8 hrs
$165.00 - 12 hrs (Max
fee)
0%
Yellowbox Meeting Room - Town Hall Yes Subsidised
$22.00 per hr
$55.00 - 4 hrs
$110.00 - 8 hrs
$165.00 - 12 hrs (Max
fee)
$22.00 per hr
$55.00 - 4 hrs
$110.00 - 8 hrs
$165.00 - 12 hrs (Max
fee)
0%
COMMUNITY SERVICES
Yarrawonga Town Hall and Community Hall
Infringement Notice Offences and Codes - False Statements
Infringement Notice Offences and Codes - Notice to Comply
Family and Children Services
Library Fees
PUBLIC VENUES FOR HIRE
Hire Charge
6 of 20

2015/16 BUDGET REPORT FEES AND CHARGES SCHEDULE MOIRA SHIRE COUNCIL
Activity/Function Title of Fee or Charge GST
Statutory Cost
Recovery,
Full Cost
Recovery
or Subsidised
Fee or Charge
2014/15
Proposed
Fee or Charge
2015/16
% Change Comments
Community Hall Yes Subsidised
$16.50 per hr
$55.00 - 4 hrs
$110.00 - 8 hrs
$165.00 - 12 hrs (Max
fee)
$16.50 per hr
$55.00 - 4 hrs
$110.00 - 8 hrs
$165.00 - 12 hrs (Max
fee)
0%
Community Hall - Kitchen Yes Subsidised
$16.50 per hr
$55.00 - 4 hrs
$110.00 - 8 hrs
$165.00 - 12 hrs (Max
fee)
$16.50 per hr
$55.00 - 4 hrs
$110.00 - 8 hrs
$165.00 - 12 hrs (Max
fee)
0%
Portable Building Yes Subsidised $11.00 per hr $11.00 per hr 0%
Rehearsals Yes Subsidised$11.00 per hr
(Max. 4 hrs)
$11.00 per hr
(Max. 4 hrs)0%
Tables and Chairs Yes Subsidised
$1.00 per table per
day of hire. No fees for
chairs
$1.00 per table per
day of hire. No fees
for chairs
0%
Set up Town Hall Yes Subsidised$55.00 - 4 hrs
$110.00 thereafter
$55.00 - 4 hrs
$110.00 there after0%
Set up Community Hall Yes Subsidised$27.50 - 4hrs
$55.00 there after
$27.50 - 4hrs
$55.00 there after0%
Set up or Clean up required by Council NoFull Cost
Recovery$45 per hour $45 per hour 0% Deducted from Bond
Town Hall NoFull Cost
Recovery$250.00 $250.00 0%
Community Hall NoFull Cost
Recovery$250.00 $250.00 0%
Community Hall Kitchen NoFull Cost
Recovery$250.00 $250.00 0%
Portable Building NoFull Cost
Recovery$250.00 $250.00 0%
More than One Area NoFull Cost
Recovery$400.00 $400.00 0%
Main Hall includes Stage, Foyer & Kitchen Yes Subsidised
$33.00 per hr
$110.00 - 4 hrs
$220.00 - 8 hrs
$330.00 - 12 hrs (Max
fee)
$33.00 per hr
$110.00 - 4 hrs
$220.00 - 8 hrs
$330.00 - 12 hrs (Max
fee)
0%
Council Chambers Yes Subsidised
$33.00 per hr
$110.00 - 4 hrs
$220.00 - 8 hrs
$330.00 - 12 hrs (Max
fee)
$33.00 per hr
$110.00 - 4 hrs
$220.00 - 8 hrs
$330.00 - 12 hrs (Max
fee)
0%
Bonds
Hire Charge
Cobram Civic Centre
Hire Charge
Set Up Fees
7 of 20

2015/16 BUDGET REPORT FEES AND CHARGES SCHEDULE MOIRA SHIRE COUNCIL
Activity/Function Title of Fee or Charge GST
Statutory Cost
Recovery,
Full Cost
Recovery
or Subsidised
Fee or Charge
2014/15
Proposed
Fee or Charge
2015/16
% Change Comments
Commercial Kitchen Yes Subsidised
$16.50 per hr
$55.00 - 4 hrs
$110.00 - 8 hrs
$165.00 - 12 hrs (Max
fee)
$16.50 per hr
$55.00 - 4 hrs
$110.00 - 8 hrs
$165.00 - 12 hrs (Max
fee)
0%
Rehearsals Yes Subsidised$11.00 per hr
(Max. 4 hrs)
$11.00 per hr
(Max. 4 hrs)0%
Tables & Chairs NoFull Cost
Recovery
$1.00 per table per
day of hire. No fees for
chairs
$1.00 per table per
day of hire. No fees
for chairs
0%
PA System Hire NoFull Cost
Recovery$50 per function $50 per function 0%
All Areas Yes Subsidised$55.00 1/2 day
$110.00 thereafter
$55.00 1/2 day
$110.00 thereafter0%
Set up or Clean up required by Council NoFull Cost
Recovery$45 per hour $45 per hour 0% Deducted from Bond
Main Hall NoFull Cost
Recovery$250.00 $250.00 0%
Council Chambers NoFull Cost
Recovery$250.00 $250.00 0%
Commercial Kitchen NoFull Cost
Recovery$250.00 $250.00 0%
More than One Area NoFull Cost
Recovery$400.00 $400.00 0%
PA System NoFull Cost
Recovery$100.00 $100.00 0%
Presidents Room including access to Kitchen Facilities Yes Subsidised
$22.00 per hr
$55.00 - 4 hrs
$110.00 - 8 hrs
$165.00 - 12 hrs (Max
fee)
Council Chambers including access to Kitchen Facilities Yes Subsidised
$16.50 per hr
$55.00 - 4 hrs
$110.00 - 8 hrs
$165.00 - 12 hrs (Max
fee)
Presidents Room and Council Chambers including access to Kitchen Facilities Yes Subsidised
$33.00 per hr
$110.00 - 4 hrs
$220.00 - 8 hrs
$330.00 - 12 hrs (Max
fee)
Set Up Fees Set up or Clean up required by Council NoFull Cost
Recovery$45 per hour Deducted from Bond
Hire Charge
Bonds
Set Up Fees
Hire Charge AV System for Council use only
Numurkah Service Centre
8 of 20

2015/16 BUDGET REPORT FEES AND CHARGES SCHEDULE MOIRA SHIRE COUNCIL
Activity/Function Title of Fee or Charge GST
Statutory Cost
Recovery,
Full Cost
Recovery
or Subsidised
Fee or Charge
2014/15
Proposed
Fee or Charge
2015/16
% Change Comments
Presidents Room NoFull Cost
Recovery$100.00
Council Chambers NoFull Cost
Recovery$100.00
More than One Area NoFull Cost
Recovery$150.00
Security Deposit Security Deposit on Keys No Full Cost
Recovery$50.00 $50.00 0% Refundable deposit
Land information Certificate NoStatutory Cost
Recovery$20.00 $20.00 0%
Land Information Certificate (Two day turnaround) NoFull Cost
Recovery$30.00 $30.00 0% Two day turnaround fee
Land information Certificates Priority NoFull Cost
Recovery$55.00 $55.00 0% Subject to increase by related authorities
Land Title Certificate YesFull Cost
RecoveryFrom $30.00 to $66.00
From $30.00 to
$66.000%
Fee for private land title search. Cost varies
depending on information required
Multiple Properties Search YesFull Cost
Recovery$35.00 $35.00 0% Dependant on privacy provisions
Reprint Rate Notice YesFull Cost
Recovery$10.00 $10.00 0%
Cheque/Direct Debit Dishonour NoFull Cost
Recovery$20.00 $20.00 0%
Cheque Dishonour - Australia Post NoFull Cost
Recovery$20.00 $20.00 0%
Use of landClass 1 - Use only (use of land other than Single Dwelling per lot). Further Fee applies if
advertisement is required. Also refer regulation 8B No
Statutory Cost
Recovery$502.00
2015/16 Statutory Fee
schedule is expected
to be published in the
later part of 2015
Miscellaneous
Bonds
Planning Permit Application Fees
Planning and Environment Fees Regulations Act 2000 Sec 2. As Authorised under Sec47 96A, 198 and 203 of
the Planning and Environment Act 1989
PLANNING FEES
PLANNING AND BUILDING FEES
REVENUE & PROPERTY MANAGEMENT
9 of 20

2015/16 BUDGET REPORT FEES AND CHARGES SCHEDULE MOIRA SHIRE COUNCIL
Activity/Function Title of Fee or Charge GST
Statutory Cost
Recovery,
Full Cost
Recovery
or Subsidised
Fee or Charge
2014/15
Proposed
Fee or Charge
2015/16
% Change Comments
Class 2 - Dwelling and ancillary: (a) Develop Land for a Single Dwelling; or (b) Use and
Develop Land for a Single Dwelling; or (c) Undertake Ancillary Development to the Use of the
Land for a Single Dwelling; per Lot with cost of development in the application being more than
$10,000 to $100,000 per Lot. Other than subdivision. Further Fee applies if advertisement is
required.
NoStatutory Cost
Recovery$239.00
2015/16 Statutory Fee
schedule is expected
to be published in the
later part of 2015
Class 3 - Dwelling and ancillary: (a) Develop Land for a Single Dwelling; or (b) Use and
Develop Land for a Single Dwelling; or (c) Undertake Ancillary Development to the Use of the
Land for a Single Dwelling; per Lot with cost of development in the application being equal or
more than $100,001 per lot. Other than Subdivision. Further Fee applies if Advertising is
required.
NoStatutory Cost
Recovery$490.00
2015/16 Statutory Fee
schedule is expected
to be published in the
later part of 2015
Class 4 - Development <$10.000: Develop Land with the cost of development in the
application being less than $10,000. Other than subdivision and other than undertake Ancillary
development to the use of the land for a single dwelling per lot. Further Fee applies if
advertisement is required.
NoStatutory Cost
Recovery$102.00
2015/16 Statutory Fee
schedule is expected
to be published in the
later part of 2015
Class 5 - Development $10,000 - $250,000: Develop Land with the cost of development in the
applicationmore than than $10,000 to$250.000. Other than subdivision and Class 2 or 3.
Further Fee applies if advertisement is required. Also refer regulation 8B
NoStatutory Cost
Recovery$604.00
2015/16 Statutory Fee
schedule is expected
to be published in the
later part of 2015
Class 6 - Development $250,000 - $500,000. Other than subdivision and Class 3. Further Fee
applies if advertisement is required. Also refer regulation 8B No
Statutory Cost
Recovery$707.00
2015/16 Statutory Fee
schedule is expected
to be published in the
later part of 2015
Class 7 - Development $500,000 - $1,000,000. Other than subdivision and Class 3. Further
Fee applies if advertisement is required. Also refer regulation 8B No
Statutory Cost
Recovery$815.00
2015/16 Statutory Fee
schedule is expected
to be published in the
later part of 2015
Class 8 - Development $1,000,000 - $7,000,000. Other than subdivision and Class 3. Further
Fee applies if advertisement is required. Also refer regulation 8B No
Statutory Cost
Recovery$1,153.00
2015/16 Statutory Fee
schedule is expected
to be published in the
later part of 2015
Class 9 - Development $7M - $10M. Other than subdivision and Class 3. Further Fee applies if
advertisement is required. Also refer regulation 8B No
Statutory Cost
Recovery$4,837.00
2015/16 Statutory Fee
schedule is expected
to be published in the
later part of 2015
Class 10 - Development $10M - $50M. Other than subdivision and Class 3. Further Fee
applies if advertisement is required. Also refer regulation 8B No
Statutory Cost
Recovery$8,064.00
2015/16 Statutory Fee
schedule is expected
to be published in the
later part of 2015
Development of Land
Single Dwelling
10 of 20

2015/16 BUDGET REPORT FEES AND CHARGES SCHEDULE MOIRA SHIRE COUNCIL
Activity/Function Title of Fee or Charge GST
Statutory Cost
Recovery,
Full Cost
Recovery
or Subsidised
Fee or Charge
2014/15
Proposed
Fee or Charge
2015/16
% Change Comments
Class 11 - Development $50M +. Other than subdivision and Class 3. Further Fee applies if
advertisement is required. Also refer regulation 8B No
Statutory Cost
Recovery$16,130.00
2015/16 Statutory Fee
schedule is expected
to be published in the
later part of 2015
Class 12 - Subdivide an existing building (excise). Further Fee applies if advertisement is
required. Also refer regulation 8B No
Statutory Cost
Recovery$386.00
2015/16 Statutory Fee
schedule is expected
to be published in the
later part of 2015
Class 13 - Subdivide into two lots other than Class 12. Further Fee applies if advertisement is
required. Also refer regulation 8B No
Statutory Cost
Recovery$386.00
2015/16 Statutory Fee
schedule is expected
to be published in the
later part of 2015
Class 14 - Realign boundaries or consolidate land. Further Fee applies if advertisement is
required. Also refer regulation 8B No
Statutory Cost
Recovery$386.00
2015/16 Statutory Fee
schedule is expected
to be published in the
later part of 2015
Class 15 - Subdivide into three or more lots other than Class 12-13-14. Further Fee applies if
advertisement is required. Also refer regulation 8B No
Statutory Cost
Recovery$781.00
2015/16 Statutory Fee
schedule is expected
to be published in the
later part of 2015
Class 16 - Remove a restriction on existing lawful development. Further Fee applies if
advertisement is required. Also refer regulation 8B No
Statutory Cost
Recovery$249.00
2015/16 Statutory Fee
schedule is expected
to be published in the
later part of 2015
Class 17- Create or remove a Right of way and Create, vary or remove a restriction other than
Class 16. Further Fee applies if advertisement is required. Also refer regulation 8B No
Statutory Cost
Recovery$541.00
2015/16 Statutory Fee
schedule is expected
to be published in the
later part of 2015
Class 18- Create, vary or remove easement or a condition in the nature of the easement other
than Class 17. Further Fee applies if advertisement is required. Also refer regulation 8B No
Statutory Cost
Recovery$404.00
2015/16 Statutory Fee
schedule is expected
to be published in the
later part of 2015
Whole Farm Plan Whole Farm Plans Also refer regulation 8B NoStatutory Cost
Recovery$302.00
2015/16 Statutory Fee
schedule is expected
to be published in the
later part of 2015
Development of Land
Subdivision
11 of 20

2015/16 BUDGET REPORT FEES AND CHARGES SCHEDULE MOIRA SHIRE COUNCIL
Activity/Function Title of Fee or Charge GST
Statutory Cost
Recovery,
Full Cost
Recovery
or Subsidised
Fee or Charge
2014/15
Proposed
Fee or Charge
2015/16
% Change Comments
Amend an application for a permit after notice has been given for every class of application
(other than a class 4 application) set out in the table in regulation 7. Further Fee applies if
advertisement is required.
NoStatutory Cost
Recovery$102.00
2015/16 Statutory Fee
schedule is expected
to be published in the
later part of 2015
Amend an application to amend a permit after notice has been given for every class of
application (other than a class 5 application) set out in the table in regulation 8B. Further Fee
applies if advertisement is required.
NoStatutory Cost
Recovery$102.00
2015/16 Statutory Fee
schedule is expected
to be published in the
later part of 2015
Class 1 - Permit Amendment Change of Use - An application to amend a permit to use land if
that amendment is to change the use for which the land may be used. Further Fee applies if
advertisement is required.
NoStatutory Cost
Recovery$502.00
2015/16 Statutory Fee
schedule is expected
to be published in the
later part of 2015
Class 2 - Permit Amendment Items of Permit - An application to amend a permit (other than a
permit to develop land or to use and develop land for a single dwelling per lot or to undertake
development ancillary to the use of the land for a single dwelling per lot ) to (a) change
statement of what permit allows or; (b) change conditions or; (c) any way not provided in the
regulation. Further Fee applies if advertisement is required.
NoStatutory Cost
Recovery$502.00
2015/16 Statutory Fee
schedule is expected
to be published in the
later part of 2015
Permit Amendment Single Dwelling <$10.000 Other than Class 3-4-5 NoStatutory Cost
Recovery$0.00
2015/16 Statutory Fee
schedule is expected
to be published in the
later part of 2015
Class 3 - Permit Amendment Single Dwelling >$10.000 and <$100.000 - An application to
amend a permit (other than a permit to subdivide land) to (a) develop land or to (b) use and
develop land for a single dwelling per lot or; (c) undertake development ancillary to the use of
the land for a single dwelling per lot if the estimated cost of the variation is not less than
$10.000 and not more than $100.000. Further Fee applies if advertisement is required.
No Statutory Cost
Recovery$239.00
2015/16 Statutory Fee
schedule is expected
to be published in the
later part of 2015
Class 4 - Permit Amendment Single Dwelling >$100.000 - An application to amend a permit (
other than a permit to subdivide land) to (a) develop land or to (b) use and develop land for a
single dwelling per lot if the estimated cost of any additional development to be permitted by
the amendment is more than $100,000. Further Fee applies if advertisement is required.
NoStatutory Cost
Recovery$490.00
2015/16 Statutory Fee
schedule is expected
to be published in the
later part of 2015
Class 5 - Permit Amendment Total < and equal $10.000 - An application to amend a permit to
develop land if the estimated cost by the amendment is less than $10.000, other than (a) a
permit to undertake development ancillary to the use of the land for a single dwelling per lot
where the total estimated cost of the development originally permitted and the additional
development by the amendment is less than $10.000 or; (b) subdivision. Further Fee applies if
advertisement is required. Also refer proposed regulation 11B
NoStatutory Cost
Recovery$102.00
2015/16 Statutory Fee
schedule is expected
to be published in the
later part of 2015
Amend Application
Amend Permit
12 of 20

2015/16 BUDGET REPORT FEES AND CHARGES SCHEDULE MOIRA SHIRE COUNCIL
Activity/Function Title of Fee or Charge GST
Statutory Cost
Recovery,
Full Cost
Recovery
or Subsidised
Fee or Charge
2014/15
Proposed
Fee or Charge
2015/16
% Change Comments
Class 6 - Permit Amendment Total >$10.000 to $250.000 - An application other than a class 3
application or a class 4 application to amend a permit if the estimated cost of any additional
development to be permitted by the amendment is more than $10,000 and not more than
$250,000. Further Fee applies if advertisement is required. Also refer regulation 11B
NoStatutory Cost
Recovery$604.00
2015/16 Statutory Fee
schedule is expected
to be published in the
later part of 2015
Class 7 - Permit Amendment Total >$250.000 to $500.000 - An application other than a class
4 application to amend a permit if the estimated cost of any additional development to be
permitted by the amendment is more than $250,000 and not more than $500,000. Further Fee
applies if advertisement is required. Also refer proposed regulation 11B
No Statutory Cost
Recovery$707.00
2015/16 Statutory Fee
schedule is expected
to be published in the
later part of 2015
Class 8 - Permit Amendment Total >$500.000 - An application other than a class 4 application
to amend a permit if the estimated cost of any additional development to be permitted by the
amendment is more than $500,000. Further Fee applies if advertisement is required. Also refer
proposed regulation 11B
No Statutory Cost
Recovery$815.00
2015/16 Statutory Fee
schedule is expected
to be published in the
later part of 2015
Amend Subdivision
Class 9 - Permit Amendment Subdivision - An application to amend a permit to; (a) Subdivide
an existing building; or (b) subdivide land into two lots; or (b) effect a realignment of a common
boundary between lots or to consolidate two or more lots. Further Fee applies if advertisement
is required. Also refer regulation 8B
No Statutory Cost
Recovery$386.00
2015/16 Statutory Fee
schedule is expected
to be published in the
later part of 2015
Search Fee Search Fee for Planning Permits and Subdivisions (per property) No Subsidised $63.00 $63.00 0%
Extension Permit Extension of time for planning permit No Subsidised $120.00 $120.00 0%
Secondary Plan Amendment endorsed plans NoStatutory Cost
Recovery$50.00 $50.00 0%
Secondary Consent NoStatutory Cost
Recovery$50.00 $50.00 0%
Compliance
CertificateCertificates of Compliance No
Statutory Cost
Recovery$147.00
2015/16 Statutory Fee
schedule is expected
to be published in the
later part of 2015
Satisfaction Satisfaction Matters NoStatutory Cost
Recovery$102.00
2015/16 Statutory Fee
schedule is expected
to be published in the
later part of 2015
Administration Fee YesFull Cost
Recovery$62.00 $63.00 2%
Individual Notices YesFull Cost
Recovery$4.20 $4.20 0%
Notice posted on site YesFull Cost
Recovery$56.00 $57.00 2%
Advertising Applications
Amend Permit
13 of 20

2015/16 BUDGET REPORT FEES AND CHARGES SCHEDULE MOIRA SHIRE COUNCIL
Activity/Function Title of Fee or Charge GST
Statutory Cost
Recovery,
Full Cost
Recovery
or Subsidised
Fee or Charge
2014/15
Proposed
Fee or Charge
2015/16
% Change Comments
Notice in newspaper YesFull Cost
Recovery
As quoted by media
outlet
As quoted by media
outlet
On application NoStatutory Cost
Recovery$798.00
2015/16 Statutory Fee
schedule is expected
to be published in the
later part of 2015
To consider submissions NoStatutory Cost
Recovery$798.00
2015/16 Statutory Fee
schedule is expected
to be published in the
later part of 2015
Adopt an amendment NoStatutory Cost
Recovery$524.00
2015/16 Statutory Fee
schedule is expected
to be published in the
later part of 2015
Approve an amendment NoStatutory Cost
Recovery$798.00
2015/16 Statutory Fee
schedule is expected
to be published in the
later part of 2015
To certify a Plan of Subdivision NoStatutory Cost
Recovery
$100.00 + $20.00 per
lot created
2015/16 Statutory Fee
schedule is expected
to be published in the
later part of 2015
To certify any other application NoStatutory Cost
Recovery$100.00
2015/16 Statutory Fee
schedule is expected
to be published in the
later part of 2015
Supervision of works NoStatutory Cost
Recovery
Max is 2.5% of
estimated cost of
construction of works
(value)
2015/16 Statutory Fee
schedule is expected
to be published in the
later part of 2015
Subdivision Plan Checking (checking engineering plan provided) NoStatutory Cost
Recovery
Max is 0.75% of
estimated cost of
construction of works
(value)
2015/16 Statutory Fee
schedule is expected
to be published in the
later part of 2015
Subdivision (Permit and Certification) Fees Regulations 2000
Amendments to Planning Scheme (VCAT)
14 of 20

2015/16 BUDGET REPORT FEES AND CHARGES SCHEDULE MOIRA SHIRE COUNCIL
Activity/Function Title of Fee or Charge GST
Statutory Cost
Recovery,
Full Cost
Recovery
or Subsidised
Fee or Charge
2014/15
Proposed
Fee or Charge
2015/16
% Change Comments
To prepare an engineering plan by Council on behalf of applicant NoStatutory Cost
Recovery
Max is 3.5% of
estimated cost of
works proposed on
plan
2015/16 Statutory Fee
schedule is expected
to be published in the
later part of 2015
Cobram Average Cost of Parking bays" provision of parking spaces in lieu of provision of actual spaces No Subsidised $6,500.00 $6,500.00 0%Cobram Car Parking Precinct
Plan - Moira Planning Scheme
Yarrawonga Average Cost of Parking bays" provision of parking spaces in lieu of provision of actual spaces No Subsidised $8,060.00 $8,060.00 0%Yarrawonga Car Parking Precinct Plan - Moira
Planning Scheme
Other All locations except for Yarrawonga and Cobram No Subsidised By Negotiation By Negotiation
Payment in lieu of providing land for Public Open Space (Residential Subdivision) NoStatutory Cost
Recovery
5% of the unimproved
value of land
2015/16 Statutory Fee
schedule is expected
to be published in the
later part of 2015
Extensions/Alterations YesFull Cost
Recovery
Cost/240 (Min
$600.00)
Cost/240 (Min
$600.00)varies
New Dwellings YesFull Cost
Recovery
Cost/240 (Min
$800.00)
Cost/240 (Min
$800.00)varies
New Dwellings Out of Shire YesFull Cost
RecoveryTo be Quoted To be Quoted varies Fee may vary with distance, by negotiation.
Minor works, Garages, Carports and In-Ground Pools. YesFull Cost
Recovery$310.00 $318.00 2.6%
All inspections included. Does not include
statutory fees for lodgement or building levy.
Class 10 Out Buildings and Farm Buildings - cost in excess of $25,000 YesFull Cost
Recovery$0.00 $500.00 New
Demolitions/Removals (Domestic) YesFull Cost
Recovery$310.00 $318.00 2.6%
All inspections included. Does not include
statutory fees for lodgement or building levy.
Minor works, Above-Ground Swimming Pools YesFull Cost
Recovery$150.00 $153.90 2.6%
All inspections included. Does not include
statutory fees for lodgement or building levy. No
longer includes In-Ground Pools (refer above)
Pool Fence Compliance Certificates YesFull Cost
Recovery$130.00 $133.00 2.6%
Restumps YesFull Cost
Recovery$310.00 $318.00 2.6%
All inspections included. Does not include
statutory fees for lodgement or building levy.
BUILDING FEES
Public Open Space Contributions
Building Applications and Building Permits on Domestic Works
Car Parking Contributions
All inspections included. Fee considered to be
competitive . Does not include statutory fees for
lodgement or building levy.
15 of 20

2015/16 BUDGET REPORT FEES AND CHARGES SCHEDULE MOIRA SHIRE COUNCIL
Activity/Function Title of Fee or Charge GST
Statutory Cost
Recovery,
Full Cost
Recovery
or Subsidised
Fee or Charge
2014/15
Proposed
Fee or Charge
2015/16
% Change Comments
Additional Inspections YesFull Cost
Recovery$135.00 $138.50 2.6% Minimum per inspection
Retrieving Building Files from archives YesFull Cost
Recovery$50.00 $51.30 2.6%
Council Report & Consent NoStatutory Cost
RecoveryNot yet set
2015/16 Statutory Fee
schedule is expected
to be published in the
later part of 2015
Inspection may be required, subject to variation
Amendment to approved plans YesFull Cost
Recovery
$150.00 minor
$250.00 major
$150.00 minor
$250.00 major
Owner/Builder inspection 137B YesFull Cost
Recovery
Class 1's $350.00
Class 10's $175.00
Class 1's $350.00
Class 10's $175.00
Demolition Report & Consent No Statutory Cost
RecoveryNot yet set
2015/16 Statutory Fee
schedule is expected
to be published in the
later part of 2015
Bond for re-erection of dwellings NoStatutory Cost
Recovery$5,000.00
2015/16 Statutory Fee
schedule is expected
to be published in the
later part of 2015
Liquor Licence measuring YesFull Cost
Recovery$100 per hour $100 per hour 0%
Maximum fee payable for report and consent for storm water drainage discharge point NoStatutory Cost
RecoveryNot yet set
2015/16 Statutory Fee
schedule is expected
to be published in the
later part of 2015
Place of Public Entertainment (POPE) permit YesFull Cost
Recovery$200.00 $205.20 2.6%
Asset Protection application fee NoFull Cost
Recovery$60.00 $61.50 2.6%
Minor Commercial Works (i.e.) re-classifications, signs etc YesFull Cost
Recovery$300.00 $307.80 2.6%
Minor Commercial Works (i.e.) Shop Fronts, Awnings, etc YesFull Cost
Recovery$300.00 $307.80 2.6%
Up to $50,000 YesFull Cost
Recovery$650.00 minimum $650.00 minimum 0.0%
$50,001 - $100,000 YesFull Cost
Recovery$1,200.00 minimum $1,200.00 minimum 0.0%
$100,001- $150,000 YesFull Cost
Recovery$1,700.00 minimum $1,700.00 minimum 0.0%
Building Applications and Building Permits on Commercial Works
The Municipal building surveyor will have regard
to the size and complexity of the project when
estimating fees
16 of 20

2015/16 BUDGET REPORT FEES AND CHARGES SCHEDULE MOIRA SHIRE COUNCIL
Activity/Function Title of Fee or Charge GST
Statutory Cost
Recovery,
Full Cost
Recovery
or Subsidised
Fee or Charge
2014/15
Proposed
Fee or Charge
2015/16
% Change Comments
$150,001 + YesFull Cost
Recoveryquoted quoted
Building Certificates No Statutory Cost
RecoveryNot yet set
2015/16 Statutory Fee
schedule is expected
to be published in the
later part of 2015
Building Lodgement Fees NoStatutory Cost
RecoveryNot yet set
2015/16 Statutory Fee
schedule is expected
to be published in the
later part of 2015
That the municipal building surveyor be authorised from time to time to vary the fees due to competitive market forces
Class 4 Low Risk N/A Subsidised Nil NilStable pre packaged food and community
sausage sizzles
Class 3 Medium Risk YesFull Cost
Recovery$273.00 $280.00 2.6%
Class 2 Medium to High Risk YesFull Cost
Recovery$512.00 $525.30 2.6%
Class 1 High Risk YesFull Cost
Recovery$512.00 $525.30 2.6%
Transfer and Registration Fees YesFull Cost
Recovery
Based on 50% annual
registration fee
Based on 50% annual
registration fee0%
Pre-purchase inspections YesFull Cost
Recovery
Based on 50% annual
registration fee
Based on 50% annual
registration fee0%
High Risk Food Community groups and sporting clubs selling food YesFull Cost
Recovery$77.00 $79.00 2.6%
Prescribed Accommodation Premises YesFull Cost
Recovery$186.00 $190.80 2.6%
Hairdressing YesFull Cost
Recovery$117.00 $120.00 2.6%
Registration Fee Structure
Food Act
ENVIRONMENTAL HEALTH
Public Health and
Food Act
Public Health &
Wellbeing Act
The Municipal building surveyor will have regard
to the size and complexity of the project when
estimating fees
17 of 20

2015/16 BUDGET REPORT FEES AND CHARGES SCHEDULE MOIRA SHIRE COUNCIL
Activity/Function Title of Fee or Charge GST
Statutory Cost
Recovery,
Full Cost
Recovery
or Subsidised
Fee or Charge
2014/15
Proposed
Fee or Charge
2015/16
% Change Comments
Warning letter YesFull Cost
RecoveryNew Charge $50.00 0%
Failure to heed Warning letter YesFull Cost
RecoveryNew Charge $350.00 0%
Residential
Tenancies ActCaravan Parks No
Statutory Cost
RecoveryPrice on application Price on application
System Compliance
ReportFee for report Yes
Full Cost
Recovery$228.00 $234.00 2.6%
Permit To Install Fee for a new septic tank YesFull Cost
Recovery$680.00 $698.00 2.6%
Permit to Alter Fee for permit to alter YesFull Cost
Recovery$430.00 $441.00 2.6%
Additional Site
InspectionsMore than the three mandatory Yes
Full Cost
Recovery$184.00 $188.80 2.6%
Septic Tank
InfringementBreaches of legislation No
Statutory Cost
Recovery
Prescribed Penalty
Units
Prescribed Penalty
Units0%
Caddy/ Basket Replacement Caddy/ Basket YesFull Cost
RecoveryNew Charge $6.00 N/A
Replacement or additional bags - 150 bags per roll YesFull Cost
RecoveryNew Charge $8.65 N/A
Replacement or additional bags - flat pack 50 bags YesFull Cost
RecoveryNew Charge $3.25 N/A
Residents per m3 Yes Subsidised $36.00 $36.00 0%
Commercial / Non-resident per m3 YesFull Cost
Recovery$87.00 $95.00 9.2%
Commercial - Internal - source internal to Shire per tonne (Cobram Landfill) YesFull Cost
Recovery$193.60 $215.00 11.1%
Commercial - External - source external to Shire source per tonne YesFull Cost
Recovery$300.00 $330.00 10.0%
General Waste
Eco Recycle Best
Practice. EPA Act
1970
Compostable Bags
KERBSIDE ORGANIC SERVICE CHARGES
Public Health &
Wellbeing Act
Moving towards full cost recovery including future
liability. Increased cost of EPA compliance
requirements.
SEPTIC TANKS
WASTE DISPOSAL CHARGES (TIP FEES)
18 of 20

2015/16 BUDGET REPORT FEES AND CHARGES SCHEDULE MOIRA SHIRE COUNCIL
Activity/Function Title of Fee or Charge GST
Statutory Cost
Recovery,
Full Cost
Recovery
or Subsidised
Fee or Charge
2014/15
Proposed
Fee or Charge
2015/16
% Change Comments
Trailer Hire YesFull Cost
RecoveryNew Charge $10.00 N/A
Flat Rate trailer hire. Exemptions apply to not-for-
profit community groups
240lt Green bin YesFull Cost
RecoveryNew Charge $2.65 per bin N/A
240lt Organic bin - including food YesFull Cost
RecoveryNew Charge $3.75 per bin N/A
240lt Recycle Bin Yes Subsidised New Charge Free N/A
No charge only applies to uncontaminated
recycle material. Exemptions apply to not-for-
profit community groups.
240lt Waste Bin YesFull Cost
RecoveryNew Charge $8.65 per bin N/A
Exemptions apply to not-for-profit community
groups
Commingle Recyclables Yes SubsidisedResidents free,
Commercial $8.50m3
Residents free,
Commercial $8.50m30%
Green Waste Yes SubsidisedResidents $11.00m3
Commercial $16.00m3
Residents $11.00m3
Commercial
$16.00m3
0%
Processed untreated timber (not including chip board) YesFull Cost
RecoveryNew Charge
Residents $15.00m3
Commercial
$20.00m3
Domestic Gas Bottles per bottle Yes Subsidised $13.00 $13.00 0% Residential and Commercial
Concrete (per metre) YesFull Cost
Recovery$32.00 $32.00 0%
Plasterboard (per metre) YesFull Cost
Recovery$29.00 $32.00 10.3%
Scrap Steel - White goods, car bodies, car batteries N/A Subsidised Free FreeResidential and Commercial, car bodies
accepted at site operators discretion
Silage wrap N/A SubsidisedFree (if in Plasback
Bag)
Free (if in Plasback
Bag)
E-Waste YesFull Cost
RecoveryFree $2 through to $10 N/A No-longer under stewardship program
Chemical Drums/Containers (Triple Rinsed) N/A Subsidised Free Free
Plastic Chemical Containers
(non Drum Muster) per drumYes Subsidised $6.50 $6.50 0%
Contaminated Oil Yes Subsidised $3.50 $3.50 0%
Clean Oil N/A Subsidised Free Free
Mattresses YesFull Cost
Recovery
$12 Single
$16 Double
$12 Single
$16 Double0%
Resource Recovery items Yes Subsidised Free Unit price $1 N/A Some items will continue to be free
Motor cycle Yes Subsidised $6.00 $6.00 0%
Recycling
Public Place
Recycling Trailer
TyresResidential and Commercial
Exemptions apply to not-for-profit community
groups
19 of 20

2015/16 BUDGET REPORT FEES AND CHARGES SCHEDULE MOIRA SHIRE COUNCIL
Activity/Function Title of Fee or Charge GST
Statutory Cost
Recovery,
Full Cost
Recovery
or Subsidised
Fee or Charge
2014/15
Proposed
Fee or Charge
2015/16
% Change Comments
Car Yes Subsidised $8.25 $8.25 0%
Light Truck Yes Subsidised $14.50 $14.50 0%
Truck Yes Subsidised $25.00 $25.00 0%
Tractor Yes Subsidised $85.00 $85.00 0%
Earthmover N/A Not accepted Not accepted
Light vehicle YesFull Cost
Recovery$10.00 $10.00 0%
Heavy vehicle including B Doubles YesFull Cost
Recovery$20.00 $20.00 0%
Gross & Tare all vehicles YesFull Cost
Recovery$27.00 $27.00 0%
TyresResidential and Commercial
Weigh Bridge
20 of 20

Postal: PO Box 578, Cobram Vic 3643
Phone: (03) 5871 9222
NRS: 133 677 (National Relay Service)
OFFICE LOCATIONS
Main Administration Centre Municipal Service Centre 44 Station Street, Cobram Victoria 100 Belmore Street, Yarrawonga Victoria
CUSTOMER SERVICE AGENCIES
Barmah Forest Heritage and Education Centre Numurkah Visitor Information Centre
73 Blake Street, Nathalia Victoria 99 Melville Street, Numurkah Victoria
INFORMATION AGENCIES
Barmah Post Office Strathmerton Post Office
Katamatite Post Office Tungamah Post Office
Katunga Post Office Wunghnu Post Office
CONTACTING MOIRA SHIRE COUNCILDX: DX 37801
Facsimile: (03) 5872 1567
Email: [email protected]
Website: www.moira.vic.gov.au
Related Documents


