Page 1 Pulse Sequence Design Made Easier… Module 4 1 Gregory L. Wheeler, BSRT(R)(MR) MRI Consultant [email protected] 2 Pulse Sequence Design Made Easier… A pulse sequence is a timing diagram designed with a series of RF pulses, gradients switching, and signal readout used in MR image formation. 3

Module 4 Pulse Sequence Design Made Easier 2016.ppt …€¦ · MRI Consultant [email protected] 2 Pulse Sequence Design Made Easier ... Parameter Acronyms ETE ETL or Turbo Factor
Jun 05, 2018
Welcome message from author
This document is posted to help you gain knowledge. Please leave a comment to let me know what you think about it! Share it to your friends and learn new things together.
Transcript

Page 1
Pulse Sequence Design Made
Easier…Module 4
1
Gregory L. Wheeler, BSRT(R)(MR)
MRI Consultant
2
Pulse Sequence Design Made Easier…
� A pulse sequence is a timing diagram designed with a series of RF pulses, gradients switching, and signal readout used in MR image formation.
3
Page 2
Pulse sequence components
� Pulse Sequences generally have the following characteristics:
� An RF line characterizing RF Pulse applications
� Gradients switching to encode the volume for spatial localization
� Signal reception used to create MR image
4
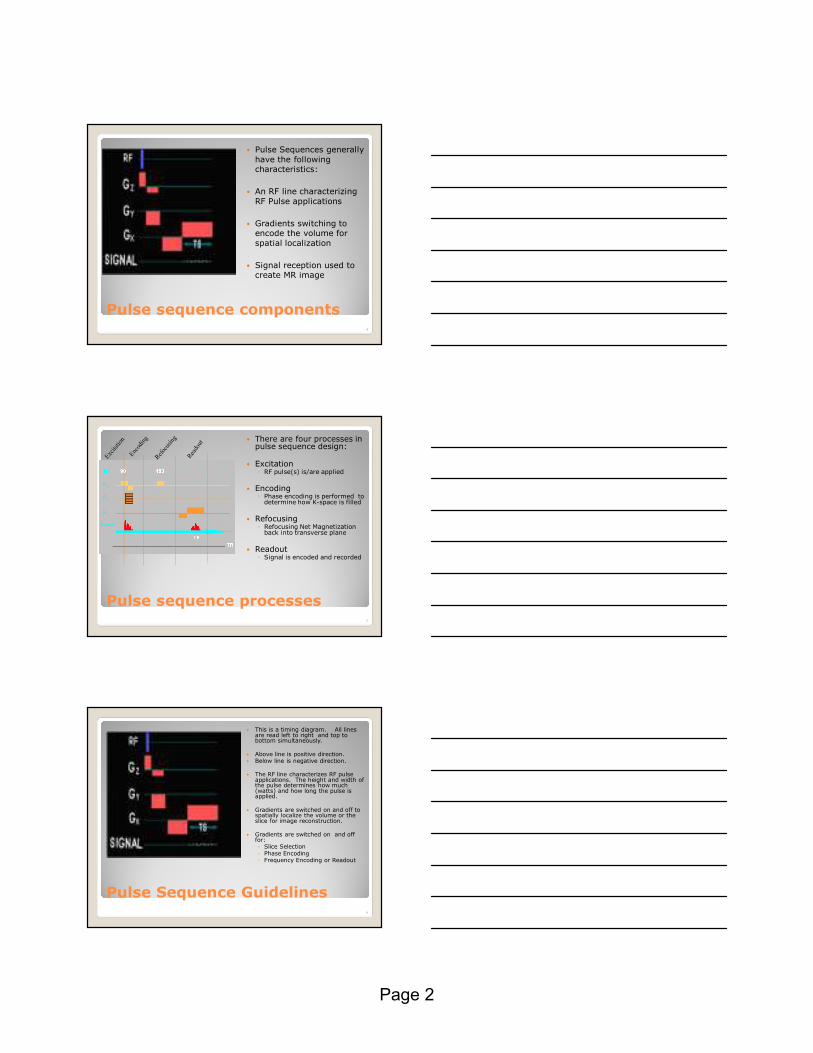
Pulse sequence processes
� There are four processes in pulse sequence design:
� Excitation ◦ RF pulse(s) is/are applied
� Encoding◦ Phase encoding is performed to
determine how K-space is filled
� Refocusing◦ Refocusing Net Magnetization
back into transverse plane
� Readout◦ Signal is encoded and recorded
5
Pulse Sequence Guidelines
� This is a timing diagram. All lines are read left to right and top to bottom simultaneously.
� Above line is positive direction.� Below line is negative direction.
� The RF line characterizes RF pulse applications. The height and width of the pulse determines how much (watts) and how long the pulse is applied.
� Gradients are switched on and off to spatially localize the volume or the slice for image reconstruction.
� Gradients are switched on and off for:◦ Slice Selection◦ Phase Encoding ◦ Frequency Encoding or Readout
6
Page 3
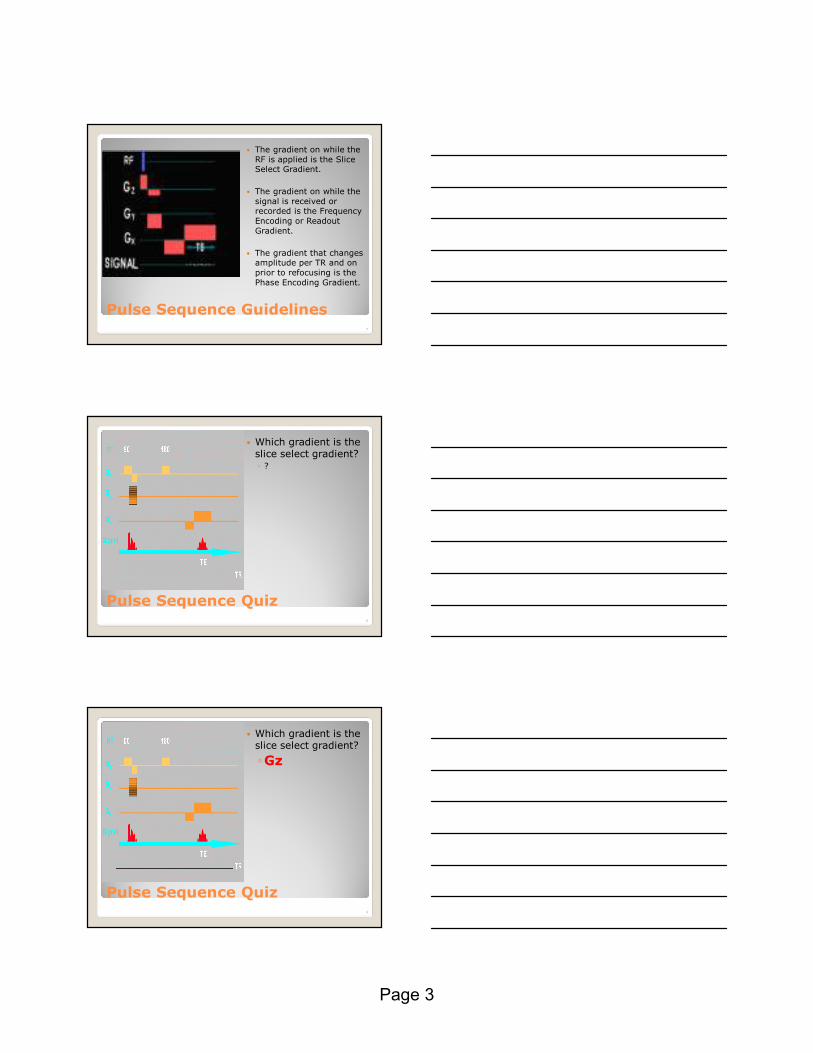
Pulse Sequence Guidelines
� The gradient on while the RF is applied is the Slice Select Gradient.
� The gradient on while the signal is received or recorded is the Frequency Encoding or Readout Gradient.
� The gradient that changes amplitude per TR and on prior to refocusing is the Phase Encoding Gradient.
7
Pulse Sequence Quiz
� Which gradient is the slice select gradient?◦ ?
8
Pulse Sequence Quiz
� Which gradient is the slice select gradient?
◦Gz
9

Page 4
10
Pulse Sequence Quiz
� Which gradient is the slice select gradient?◦ Gz
◦ Which gradient is the phase encoding gradient?
◦ ?
10
1111
Pulse Sequence Quiz
� Which gradient is the slice select gradient?◦ Gz
◦ Which gradient is the phase encoding gradient?
◦Gy
11
121212
Pulse Sequence Quiz
� Which gradient is the slice select gradient?
◦ Gz
◦ Which gradient is the phase encoding gradient?
◦ Gy
◦ Which gradient is the frequency encoding gradient?
◦ ?
12

Page 5
13131313
Pulse Sequence Quiz
� Which gradient is the slice select gradient?
◦ Gz
◦ Which gradient is the phase encoding gradient?
◦ Gy
◦ Which gradient is the frequency encoding gradient?
◦Gx
13
14
15
What slice orientation will the images created from this pulse sequence have?

Page 6
1616
What slice orientation will the images created from this pulse sequence have? AXIALS
(Gz - is the slice select gradient)
More on Phase Encoding…
� Phase encoding is performed to provide spatial localization and to guide k-space filling.
� What do you notice about the phase encoding gradient?
17
18
Phase amplitude changes every TR

Page 7
19Each amplitude designates another line in k-space
2020What do you notice about the signal as gradient changes?
2121
• Signal gets stronger with low amplitude gradients (shallow).
• The signal gets weaker with high amplitude gradients (steeper).
21

Page 8
� Outer lines of K-space, use high amplitude gradients which yield low signal return.
� Center lines of K-space use low amplitude gradients which yield high signal return.
� Outer lines reconstructed yield spatial resolution.
� Center lines reconstructed yield signal (S/N) and contrast.
22
K-Space Filling23
Frequency Encoding
High Spatial Resolution
High S/N and Contrast
High Spatial Resolution
24

Page 9
Conventional Pulse Sequences
� There are three conventional pulse sequence designs.
◦Spin Echo◦Gradient Recalled Echo◦Inversion Recovery
25
Spin Echo Pulse Sequence (SE)
� Spin Echo pulse sequences begin with a 90° RF pulse followed by at least one 180°RF pulse.
� Produces T1-, T2-, and PD-wt. type tissue contrast
26
SE T1-weighted
� Image parameters
Short TR - contrast
Short TE - signal
� Image Contrast
Bright Fat - short T1
Dark CSF - long T1

Page 10
SE Double Echo Proton Density
� Image Parameters
Long TR - signal
Short TE - signal
� Image Contrast
Bright or Gray Fat
Gray CSF
� Contrast based on proton concentration
SE Double Echo T2-weighted
� Image Parameters
Long TR - signal
Long TE - contrast
� Image Contrast
Dark Fat – short T2
Bright CSF – Long T2
Conventional Spin Echo Diagram
30
Gpe
Gro
Gss
RF
echo90°
180° 180°
echo
TE1
TE2
90°
TR
Page 11
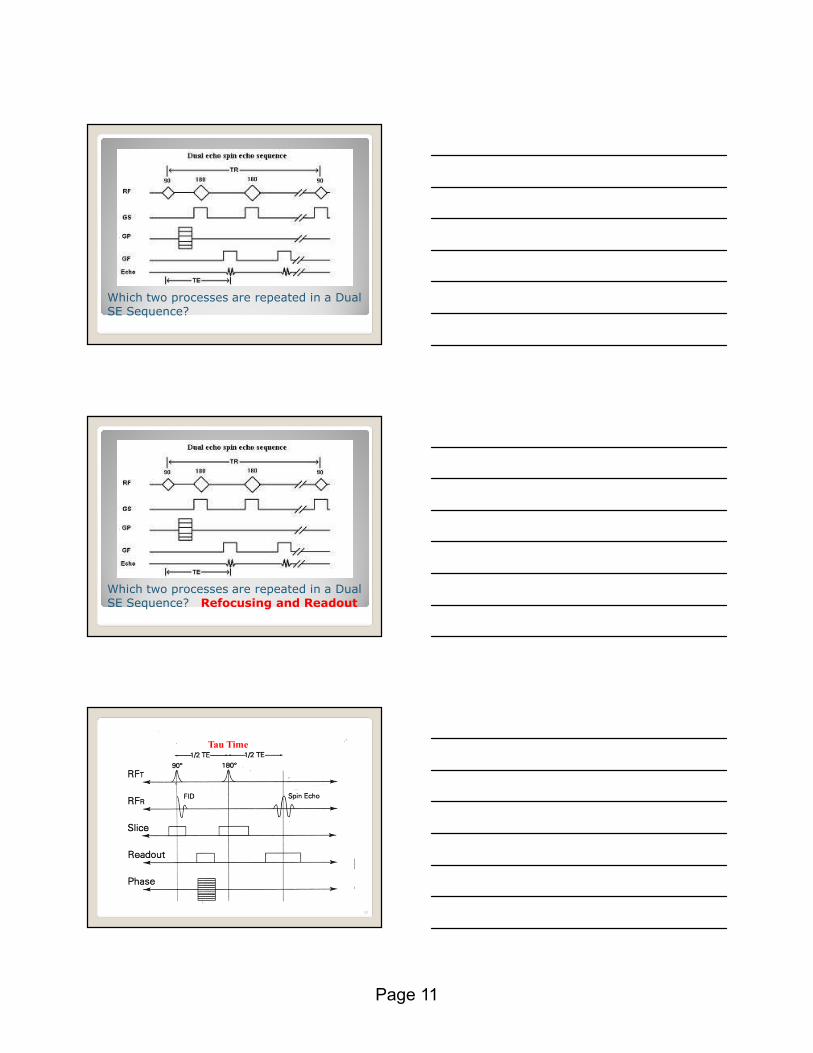
Which two processes are repeated in a Dual SE Sequence?
Which two processes are repeated in a Dual SE Sequence? Refocusing and Readout
33
Tau Time

Page 12
34
Effects of the 1800 Pulse
� eliminates signal loss due to field inhomogeneities
� eliminates signal loss due to susceptibility effects
� eliminates signal loss due to water/fat dephasing
� all signal decay is caused by T2 relaxation only
35
Spin Echo Parameters that manipulate Tissue Characteristics
Spin Echo Parameters
T1 is TR Dependent
PD is TR and TE Dependent
T2 is TE Dependent
36

Page 13
2DFT Scan Time Formula
ST = TR(msec) x Npe x NEX /60,000(msec)
ST: Scan time in minutesNpe: Number of phase stepsNEX: Number of acquisitions, NAQ, NEX, NSA
37
38
38
Multi Echo Spin Echo
echo 2
RF
signal
readout
phase
slice
1801801801800000909090900000 1801801801800000
echo 1
only 1 phase
encode
per TR
39
R F
90° 180° echo 180° echo
192
•
•
•
4
3
2
1
192
•
•
•
4
3
2
1
Frequency Encoding Frequency Encoding
Page 14
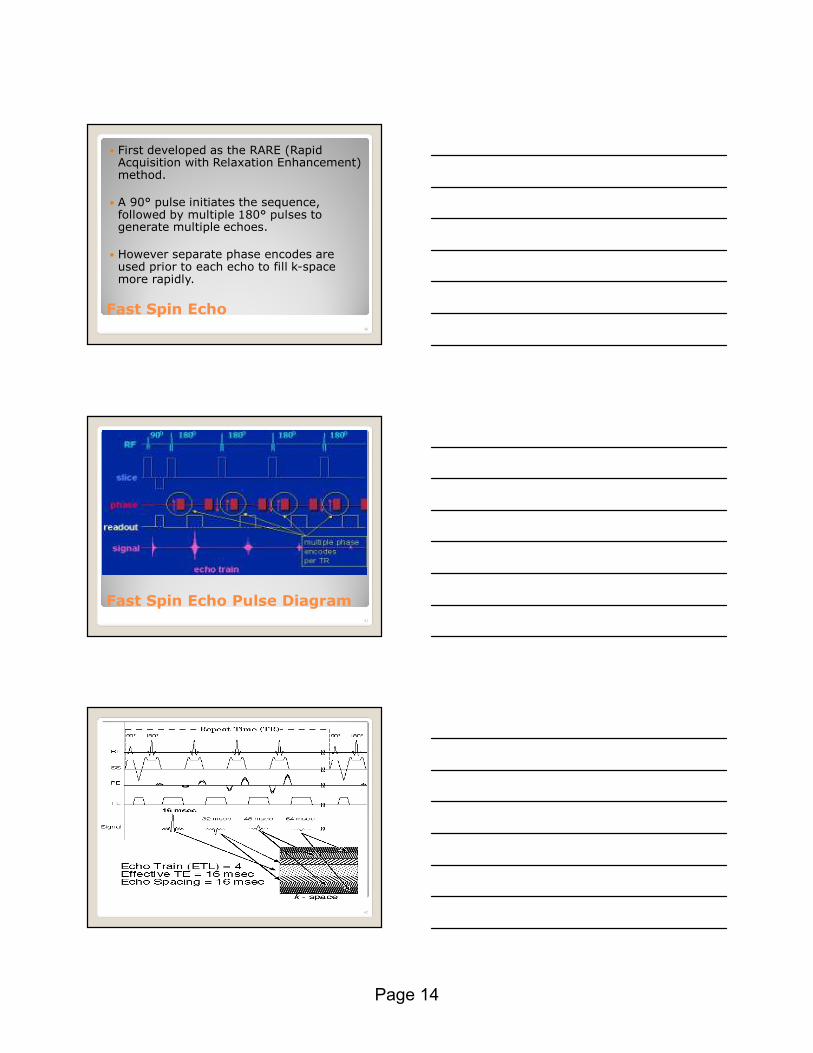
Fast Spin Echo
� First developed as the RARE (Rapid Acquisition with Relaxation Enhancement) method.
� A 90° pulse initiates the sequence, followed by multiple 180° pulses to generate multiple echoes.
� However separate phase encodes are used prior to each echo to fill k-space more rapidly.
40
Fast Spin Echo Pulse Diagram41
42

Page 15
Fast Imaging Parameters
Parameter Acronyms
� ETE
� ETL or Turbo Factor
� ETS
Terminology
� Effective TE◦ The TE placed in
portion of k-space with greatest impact on signal.
� Echo Train Length◦ Number of Echoes
acquired per TR
� Echo Train Spacing◦ Time (msec) between
echoes in Echo Train
43
Fast Imaging Parameters
� ETE◦ Selectable and determines TE in center of k-space.
◦ Therefore determines image contrast.
� ETL◦ Selectable and determines number of echoes acquired per TR.
◦ Determines how fast sequence is run; higher the ETL the shorter the scan time.
◦ Higher ETL reduce time for slices.
� ETS◦ Not selectable; higher spacing leads to blurriness.
44
� Optimal TR is 2000 – 4000msec ◦ or longer so magnetization fully recovers.
◦ Longer TR’s allow more signal and slices.
� Shorter TR (<2000msec) image not T2-weighted even though CSF is bright. ◦ Too much T1 contrast added to the image.
� ETE time is long >80msec. ◦ Longer ETE’s are allowed due to longer TR (signal)
Fast or Turbo SE Guidelines

Page 16
Single Shot FSE concept
� Single shot FSE or TSE acquires 53% of k-space and reconstructs in Half-Fourier algorithm to achieve final resolution.
� Allows T2-wt studies with reduced motion artifacts and low susceptibility.
� Adaptable for breath hold exams and uncooperative patients.
46
Fast Imaging Scan Time Formula
47
Scan Time = TR(msec) x Npe x NEX
(Minutes) 60,000(msec) x ETL
SE & FSE Contrast Parameter Guidelines
TE TR WEIGHTING
short short T1
long long T2
short long Proton density
48

Page 17
Vendor Terminology
� Spin Echo
All vendors use Spin Echo designation
� Fast Imaging T2Siemens: Turbo Spin Echo
GE: Fast Spin Echo
Hitachi: Fast Spin Echo
Philips: Turbo Spin Echo
Picker: Fast Spin Echo
Toshiba: Fast Spin Echo
� Single Shot SESiemens: HASTE
GE: SSFSE
Hitachi: SSFSE
Philips: SSTSE
Picker: EXPRESS
Toshiba: FASE
� FSE w/90°Flip-BackSiemens: RESTORE
GE: FRFSE
Hitachi: Driven Equilibrium
Philips: DRIVE
Toshiba: FSE T2 puls
49
50
Inversion Recovery Sequence51

Page 18
Inversion Spin Echo Diagram52
� Inversion Recovery pulse sequences are highly sensitive to differences in T1 values of tissues.
� Especially useful where T1 values are similar.
� The primary contrast control mechanism is TI.
53
Inversion Recovery
� TI, Time of Inversion, is the length of time net magnetization is allowed to recover before starting the 90° RF pulse (Spin Echo).
� STIR, Short TI or Tau Inversion Recovery, sequences are created by shortening the TI time to 69% of T1 relaxation of fat for fat suppression.
� FLAIR, Fluid Attenuated Inversion Recovery, sequences are created by lengthening the TI time to 69% of T1 relaxation of water for water suppression.
54

Page 19
Inversion Recovery
� The effect of inverting the magnetization vector by the 180° RF pulse allows for the tissues dynamic range to be increased.
� The magnitude of magnetization M is a function of time after a 180° pulse.
� Magnetization starts negative (-Z), passes through zero at t = .69 T1 and recovers completely by t = 5T1.
55
Null Point – Suppression Point
� Suppression occurs at the tissue’s NULL POINT.
� Null point is the point at which net magnetization crosses the transverse plane.
� The Null point is approximately 69% of
the T1 of the tissue to be suppressed.
56
57
Null Points
Page 20
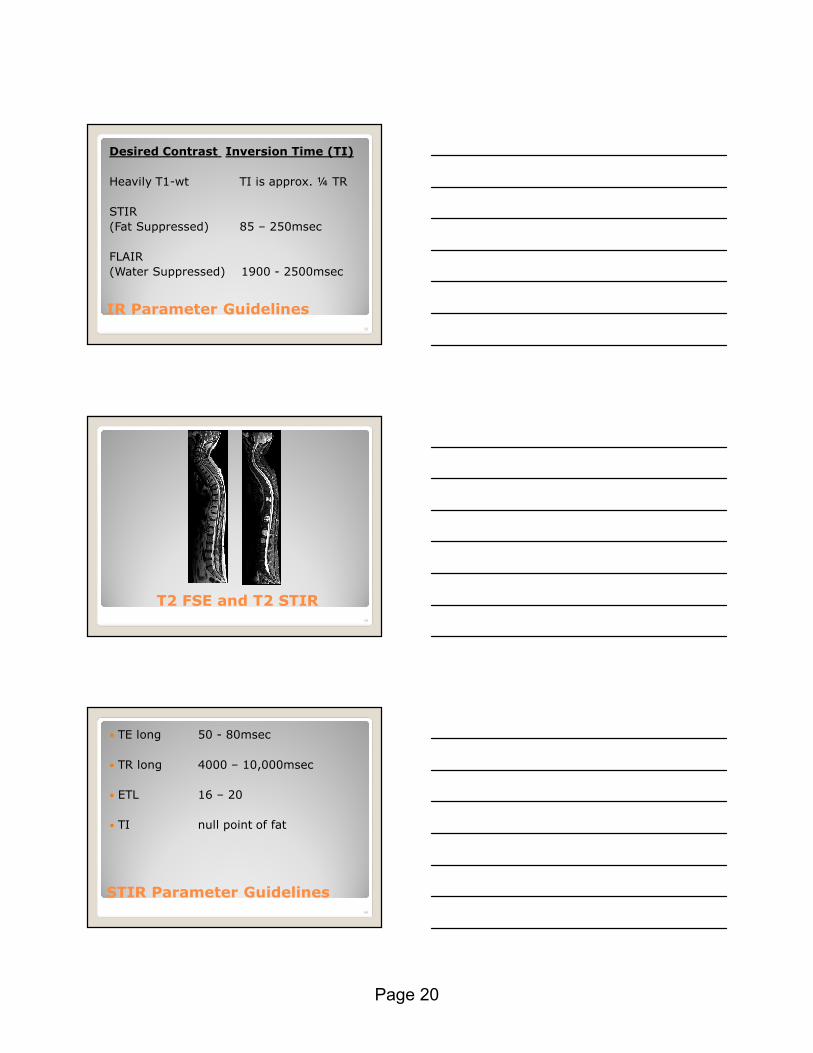
IR Parameter Guidelines
Desired Contrast Inversion Time (TI)
Heavily T1-wt TI is approx. ¼ TR
STIR
(Fat Suppressed) 85 – 250msec
FLAIR
(Water Suppressed) 1900 - 2500msec
58
T2 FSE and T2 STIR59
STIR Parameter Guidelines
� TE long 50 - 80msec
� TR long 4000 – 10,000msec
� ETL 16 – 20
� TI null point of fat
60

Page 21
STIR Imaging Guidelines
� STIR should not be used with contrast because STIR will suppress both the fat and the contrast.
� Useful in MSK imaging – normal bone is fatty marrow – bone bruises and fractures are clearly seen.
61
STIR Images - MSK62
Fluid Attenuated IR
� Helps visualize stroke.
� Helps in determining Multiple Sclerosis
� Achieves suppression of CSF.
63

Page 22
Fluid Attenuated IR Parameters
• Long TE, Long TR, Long ETL
• TI/TAU time of 1700 - 3200msec
(depending on magnetic field strength)
• Used in brain and cord imaging – see
periventricular and cord lesions more clearly
64
FLAIR Axial Brain65
66
Page 23
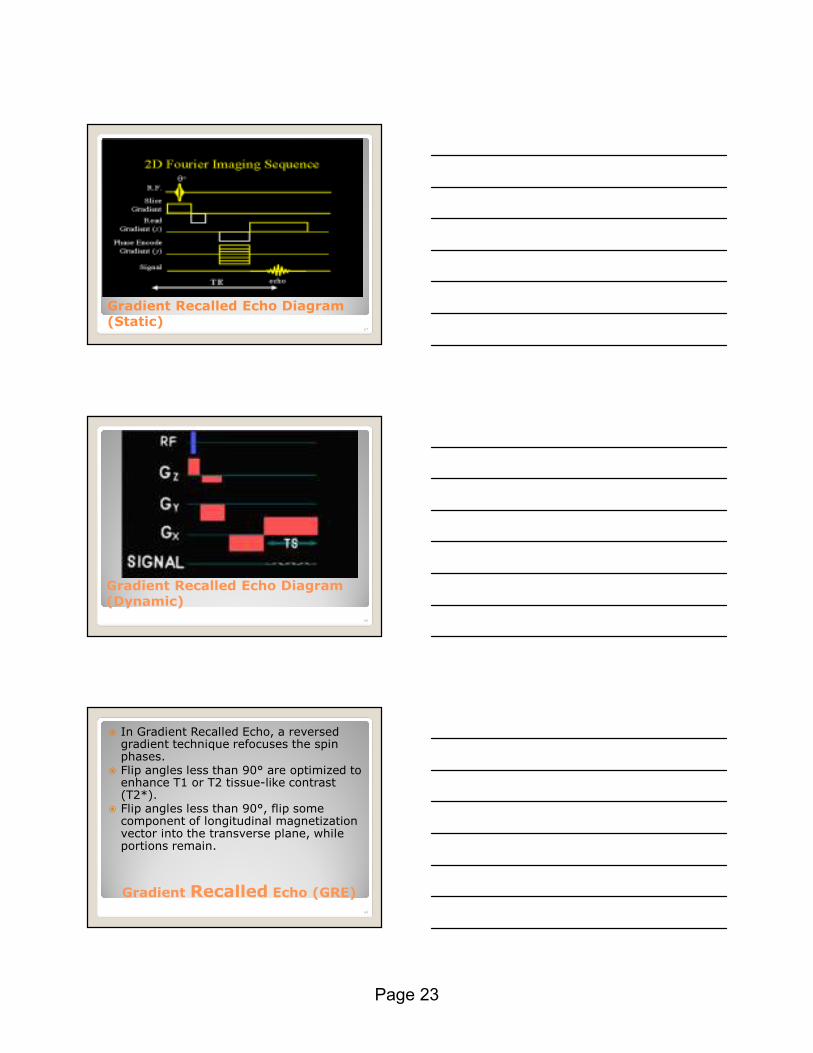
Gradient Recalled Echo Diagram (Static)
67
Gradient Recalled Echo Diagram (Dynamic)
68
Gradient Recalled Echo (GRE)
� In Gradient Recalled Echo, a reversed gradient technique refocuses the spin phases.
� Flip angles less than 90° are optimized to enhance T1 or T2 tissue-like contrast (T2*).
� Flip angles less than 90°, flip some component of longitudinal magnetization vector into the transverse plane, while portions remain.
69

Page 24
70
Gradient Echo sequences show a wide range of variations compared to the Spin Echo and Inversion Recovery sequences.
Gradient Reversal
� The major benefit is the use of the gradients to refocus the net magnetization instead of an RF pulse.
� A gradient reversal in the readout direction is used to create the echo.
� Spins will either speed up or slow down pending the gradient influence.
� This is different from the 180° RF pulse which flips the spins for refocusing.
71
72
The spins are refocused by reversing the speed of the spins rather than flipping them over to the other side of the x-y plane as occurs with the spin echo sequence.
Magnetic susceptibility artifacts are more pronounced on gradient echo sequences.

Page 25
Magnetic Susceptibility� Magnetic susceptibility, caused by
protons of one tissue precessing faster than the protons of an adjacent tissue, is exaggerated due to the affect the spins have on each other while under the influence of the reversed gradient.
73
Gradient Recalled Echo (GRE)
� The MR signal returned is due primarily to T1 longitudinal magnetization.
� The MR signal returned is also due to faster T2 relaxation rates due to field inhomogeneities.
� The information is therefore T2* information, which is T2 relaxation due to magnetic field inhomogeneities as well as tissue characteristics.
74
Flip Angles
short FA T2*-weighted
medium FA PD-weighted
long FA T1-weighted
75

Page 26
Flip Angles control GRE Contrast
Flip Angle Degree Range Contrast
Short 1 - 35° T2*
Medium 36 - 59° PD
Long 60 - 90° T1
76
Gradient Recalled Echo
� Spoiled GRE Incoherent◦ aka SPGR, FLASH, T1-FFE
◦ Uses gradients or RF to spoil or destroy accumulated transverse coherence
◦ maximizes T1 contrast
77
Gradient Recalled Echo
� Refocused GRE Coherent◦ Aka FISP, GRASS, FFE, Rephased SARGE
◦ Uses RF or gradients to refocus accumulated transverse magnetization
◦ Maximizes T2 Contrast
78
Page 27
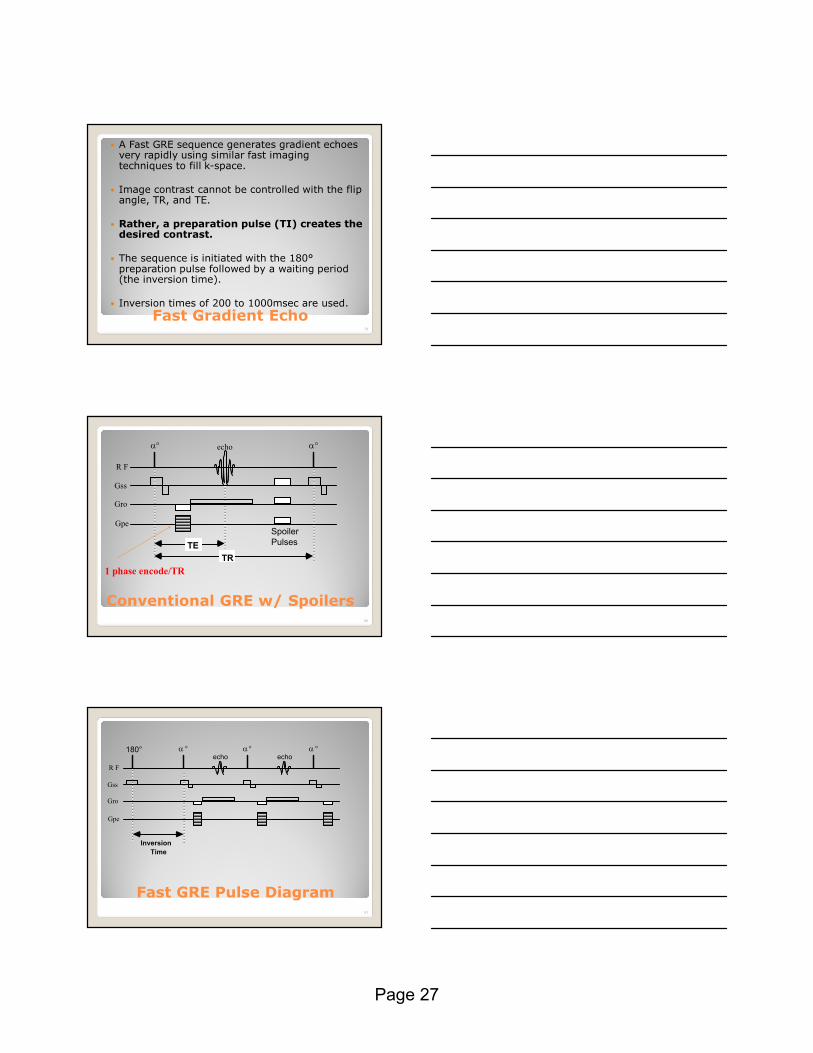
Fast Gradient Echo
� A Fast GRE sequence generates gradient echoes very rapidly using similar fast imaging techniques to fill k-space.
� Image contrast cannot be controlled with the flip angle, TR, and TE.
� Rather, a preparation pulse (TI) creates the desired contrast.
� The sequence is initiated with the 180°preparation pulse followed by a waiting period (the inversion time).
� Inversion times of 200 to 1000msec are used.
79
Conventional GRE w/ Spoilers80
R F
Gss
Gpe
Gro
° echoα °α
TR
TE
Spoiler
Pulses
1 phase encode/TR
Fast GRE Pulse Diagram81
R F
Gss
Gpe
Gro
°α
Inversion
Time
180°echo
°αecho
°α
Page 28
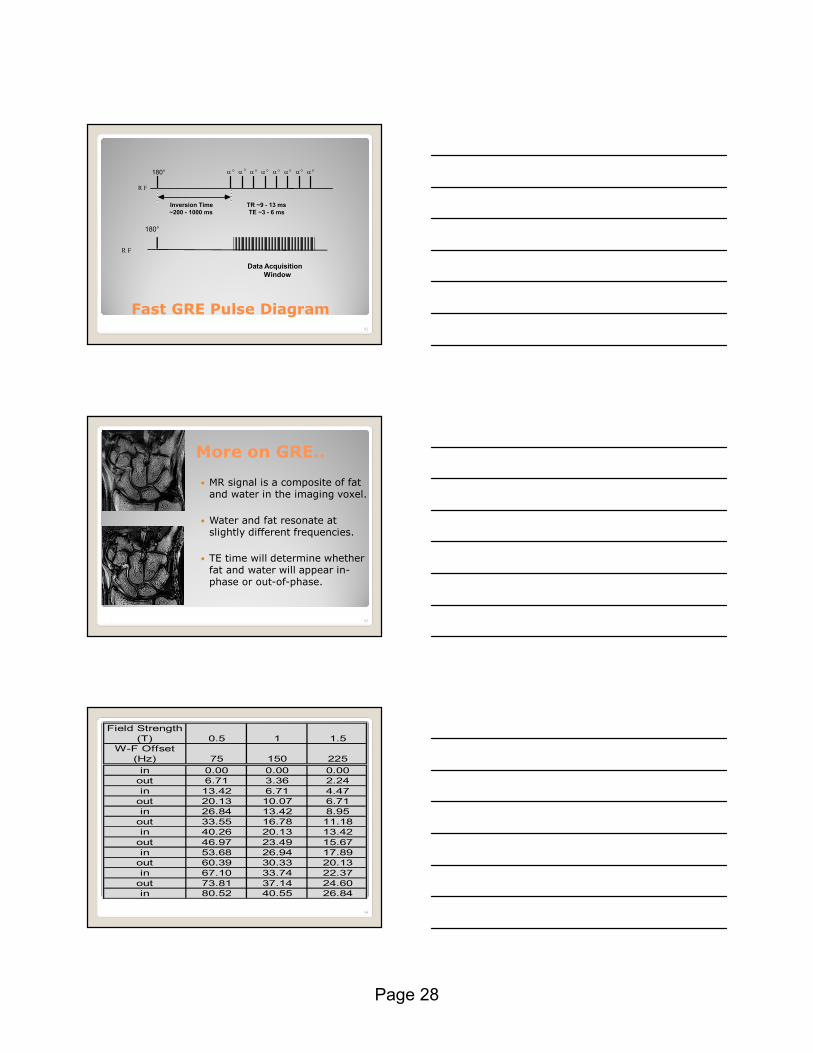
Fast GRE Pulse Diagram82
R F
°α
Inversion Time
~200 - 1000 ms
180° °α °α°α °α °α°α α °
TR ~9 - 13 ms
TE ~3 - 6 ms
R F
180°
Data Acquisition
Window
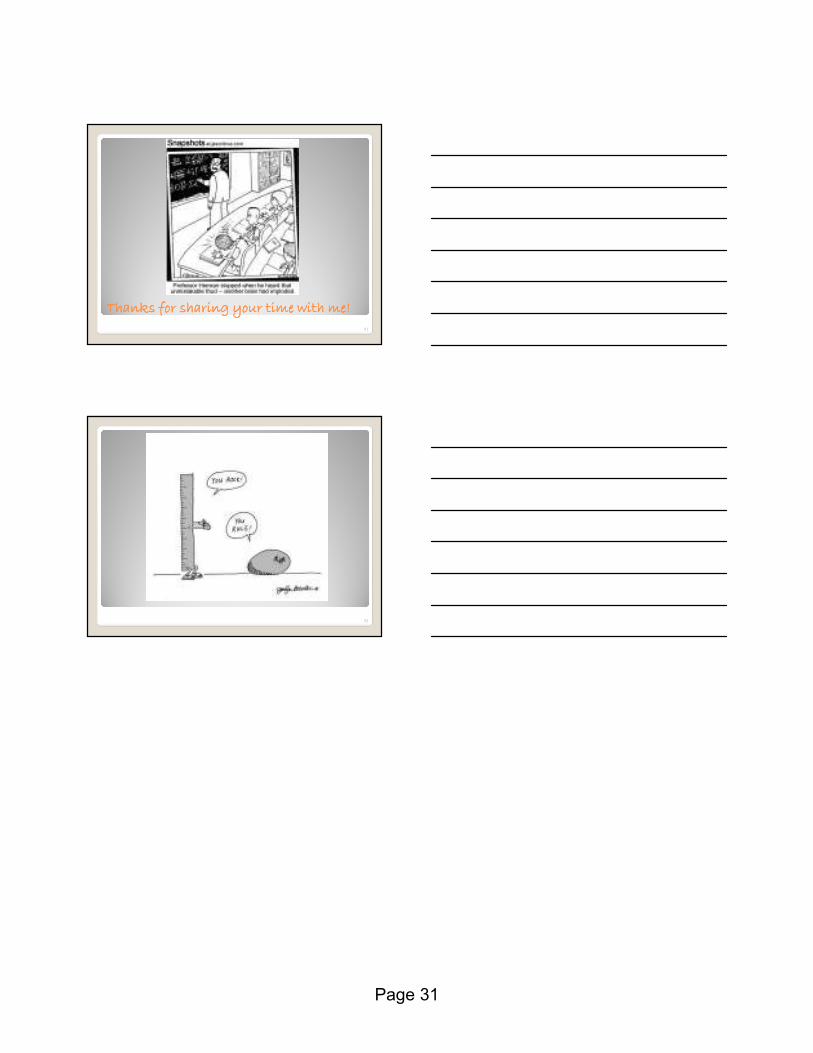
More on GRE..
� MR signal is a composite of fat and water in the imaging voxel.
� Water and fat resonate at slightly different frequencies.
� TE time will determine whether fat and water will appear in-phase or out-of-phase.
83
84
Field Strength
(T) 0.5 1 1.5
W-F Offset
(Hz) 75 150 225
in 0.00 0.00 0.00
out 6.71 3.36 2.24
in 13.42 6.71 4.47
out 20.13 10.07 6.71
in 26.84 13.42 8.95
out 33.55 16.78 11.18
in 40.26 20.13 13.42
out 46.97 23.49 15.67
in 53.68 26.94 17.89
out 60.39 30.33 20.13
in 67.10 33.74 22.37
out 73.81 37.14 24.60
in 80.52 40.55 26.84

Page 29
85
Field Strength
(T) 0.5 1 1.5
W-F Offset
(Hz) 75 150 225
in 0.00 0.00 0.00
out 6.71 3.36 2.24
in 13.42 6.71 4.47
out 20.13 10.07 6.71
in 26.84 13.42 8.95
out 33.55 16.78 11.18
in 40.26 20.13 13.42
out 46.97 23.49 15.67
in 53.68 26.94 17.89
out 60.39 30.33 20.13
in 67.10 33.74 22.37
out 73.81 37.14 24.60
in 80.52 40.55 26.84
� Frequency difference in ppm◦ Fat frequency minus water frequency divided by the water frequency equals the frequency difference.
◦ This difference is about 3.3 - 3.5ppm.
� Frequency difference in hertz ◦ Multiply 3.5ppm by the imaging system’s operating frequency.
86frequency
SI Fat water
Quiz� Determine the frequency difference
between fat and water at 3.0T?
� Hints:◦ To find the operating frequency you must use the Larmor equation ώ = γ x β
◦ Multiply 3.5ppm by the imaging system’s operating frequency to find the frequency difference.
87

Page 30
Fat/Water difference in hertz
Answer:
1st: Larmor Equation: ώ = γ x β
ώ = 42.58mHz x 3.0T
ώ = 127.74 mHz
2nd: 3.5ppm x operating frequency
3.5ppm x 127.74mHz = 447 Hz @3.0T
0.35T 14.90 mHz x 3.5ppm = 52.1 Hz
1.5T 63.86 mHz x 3.5ppm = 223 Hz
88
89
In-phase
Out of Phase
Gradient Echo Vendor Acronyms
Sequence Siemens GE Philips Hitachi Toshiba Picker
Spoiled GE FLASH SPGR T1-FFE RSSG FE T1 Fast
Coherent GE FISP GRASS FFE Re-SARGE FE
SSFP TrueFISP FIESTA T2-FFE SARGE True SSFP CE Fast
UltraFast TurboFLASH FastSPGR TFE RGE Fast GE RF Fast
UltraFast 3D MPRAGE 3D FastSPGR 3DTFE MPRAGE
90
Page 31
Thanks for sharing your time with me!Thanks for sharing your time with me!Thanks for sharing your time with me!Thanks for sharing your time with me!91
92
Related Documents