Eurostat THE CONTRACTOR IS ACTING UNDER A FRAMEWORK CONTRACT CONCLUDED WITH THE COMMISSION Module 2. Statistical learning Example 2

Welcome message from author
This document is posted to help you gain knowledge. Please leave a comment to let me know what you think about it! Share it to your friends and learn new things together.
Transcript

Eurostat
THE CONTRACTOR IS ACTING UNDER A FRAMEWORK CONTRACT CONCLUDED WITH THE COMMISSION
Module 2. Statistical learning
Example 2

Eurostat
2
First steps with R
Example: data of example 1. Recall
• Regression Tree for classification.
• Basics
• Pruning
• Cross Validation
• Regression Tree for prediction.
• Bagging
• Random forest
• Boosting
Eurostat
3
First steps with R
Example: data of example 1. Recall
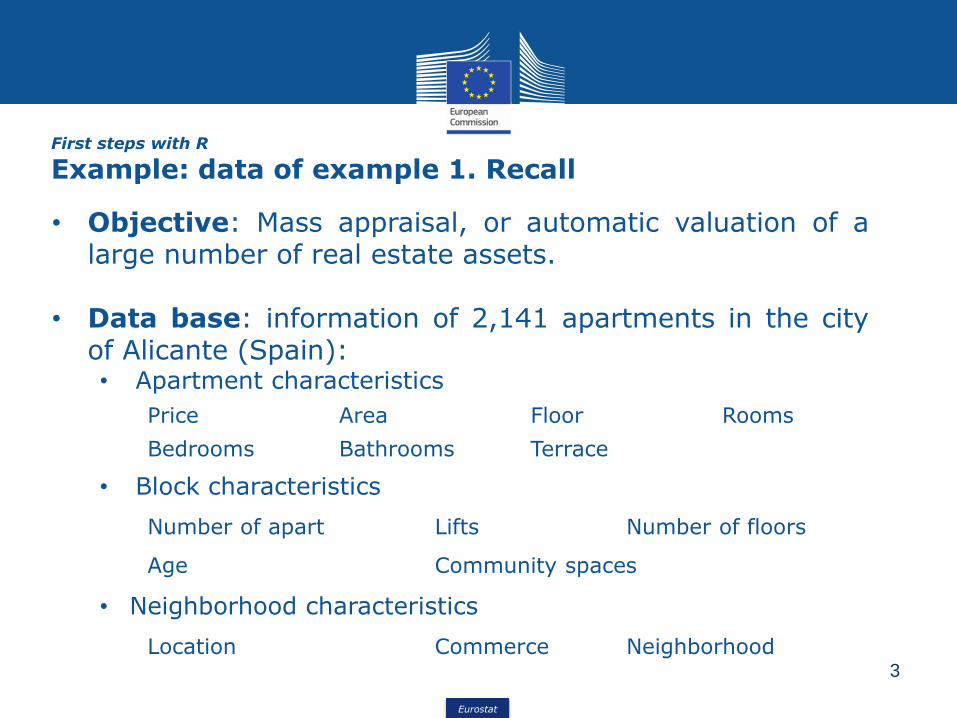
• Objective: Mass appraisal, or automatic valuation of alarge number of real estate assets.
• Data base: information of 2,141 apartments in the cityof Alicante (Spain):• Apartment characteristics
Price Area Floor Rooms
Bedrooms Bathrooms Terrace
• Block characteristics
Number of apart Lifts Number of floors
Age Community spaces
• Neighborhood characteristics
Location Commerce Neighborhood
Eurostat
4
First steps with R
Example 2: Descriptive
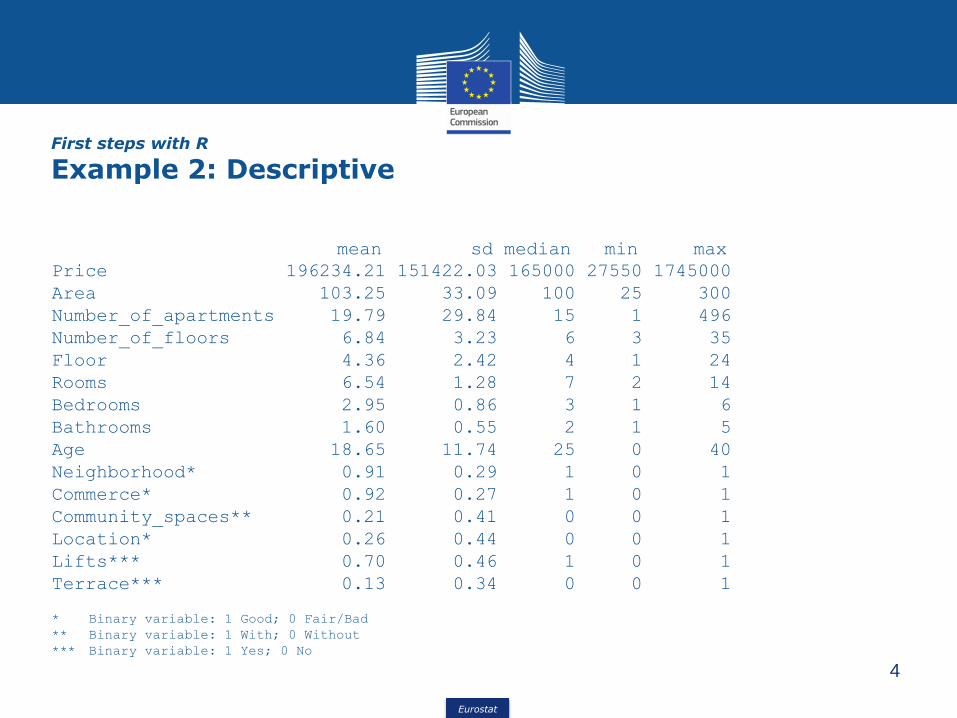
mean sd median min max
Price 196234.21 151422.03 165000 27550 1745000
Area 103.25 33.09 100 25 300
Number_of_apartments 19.79 29.84 15 1 496
Number_of_floors 6.84 3.23 6 3 35
Floor 4.36 2.42 4 1 24
Rooms 6.54 1.28 7 2 14
Bedrooms 2.95 0.86 3 1 6
Bathrooms 1.60 0.55 2 1 5
Age 18.65 11.74 25 0 40
Neighborhood* 0.91 0.29 1 0 1
Commerce* 0.92 0.27 1 0 1
Community_spaces** 0.21 0.41 0 0 1
Location* 0.26 0.44 0 0 1
Lifts*** 0.70 0.46 1 0 1
Terrace*** 0.13 0.34 0 0 1
* Binary variable: 1 Good; 0 Fair/Bad
** Binary variable: 1 With; 0 Without
*** Binary variable: 1 Yes; 0 No

Eurostat
5
First steps with R
Example 2: Regression Tree Approach
• Data set: 2,141 apartments in Alicante, Spain.• 1,070 observation in the training set• 1,071 observation in the test set
• Ten-fold cross-validation

Eurostat
6
First steps with R
Example 2: Regression Tree
• 10 terminal nodes• 5 variables
• Lifts• Area• Neighborhood,• Number of floors• Number of apartments
• Error in training data 9,2% • Error in test data 9,8%
Predicion is theaverage log price
in the node

Eurostat
7
First steps with R
Example 2: Regression Tree – Tree pruning (Cross-
Validation)
Optimalnumber of
nodes

Eurostat
8
First steps with R
Example 2: Regression Tree - Cross-validation
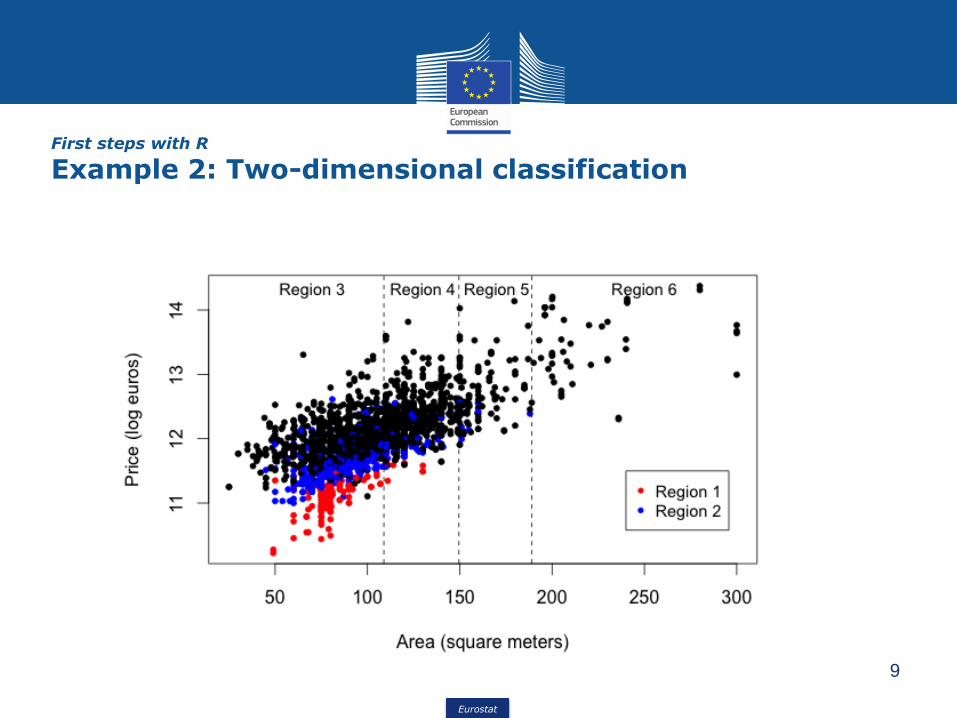
Region 1(73.800 €)
Region 2(115.800 €)
Region 3(166.000 €)
Region 5(334.400 €)Region 4
(224.100 €)
Region 6(680.100 €)
• 6 terminal nodes• 3 variables
• Lifts,• Neighborhood• Area
• Error on training data 10,7% • Error test data 10,7%
Eurostat
9
First steps with R
Example 2: Two-dimensional classification
Eurostat
10
First steps with R
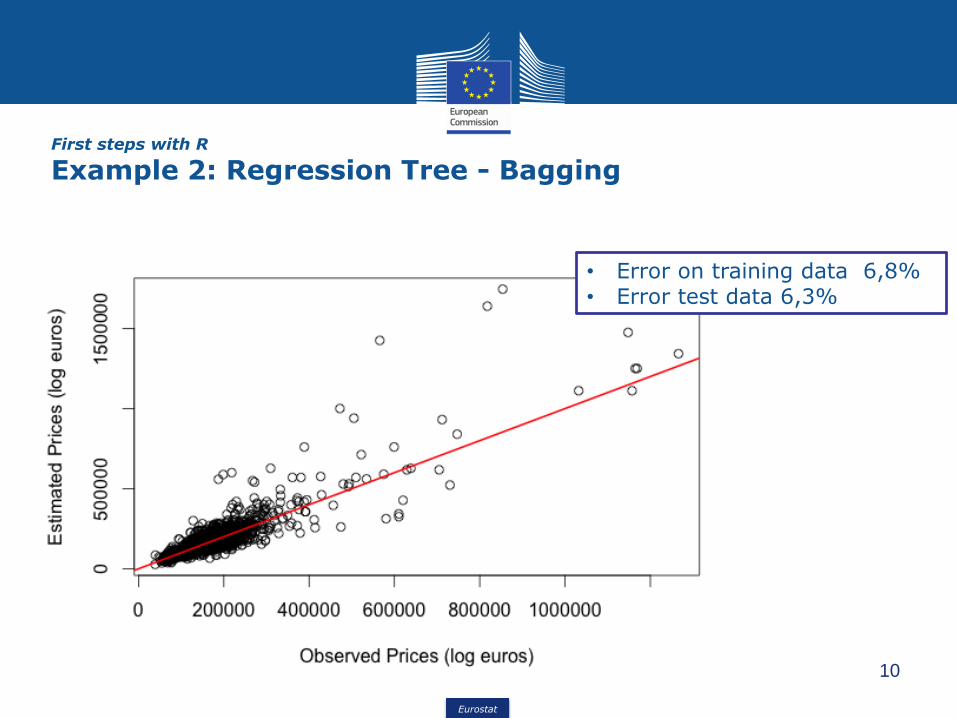
Example 2: Regression Tree - Bagging
• Error on training data 6,8% • Error test data 6,3%
Eurostat
11
First steps with R
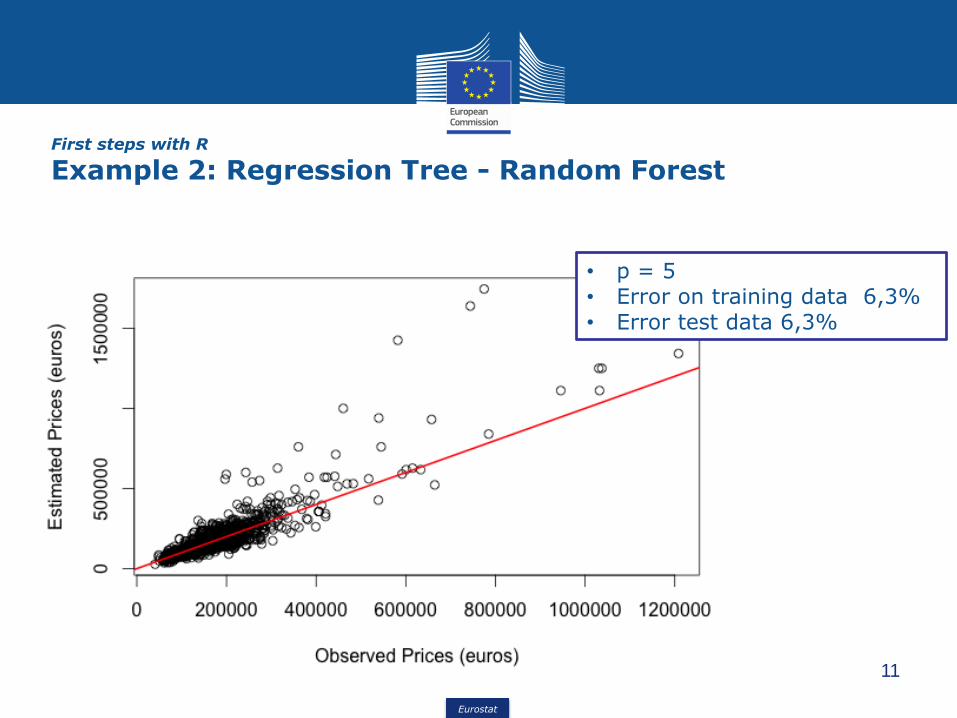
Example 2: Regression Tree - Random Forest
• p = 5• Error on training data 6,3% • Error test data 6,3%

Eurostat
12
First steps with R
Example 2: Regression Tree - Random Forest

Eurostat
13
First steps with R
Example 2: Regression Tree - Boosting
• depth = 3• Error on training data 6,6% • Error test data 6,8%

Eurostat
14
First steps with R
Example 2: Regression Tree - Boosting

Eurostat
15
First steps with R
Example 2: R code#-------------------------------------------------------------------------------
#
# Mass Appraisal of Residential Real Estate Using Regression Trees
#
#-------------------------------------------------------------------------------
# library
library(tree)
library(randomForest)
library(gbm)
#-------------------------------------------------------------------------------
#
#
#
#-------------------------------------------------------------------------------
# Read data
#-------------------------------------------------------------------------------
# Lectura de datos
apartments<-read.table('Alicante.csv',header=TRUE,sep=';',dec='.',
colClasses=c(rep('double',15)))

Eurostat
16
First steps with R
Example 2: R code#-------------------------------------------------------------------------------
# ANALYSIS (DEP. VAR LOG(PRICE))
#-------------------------------------------------------------------------------
#tree.apartments <- tree(log(Price)~.,apartments)
#summary(tree.apartments)
#plot(tree.apartments)
#text(tree.apartments,pretty=0)
#tree.apartments
#-------------------------------------------------------------------------------
# VALIDATION TEST (package tree requiered)
#-------------------------------------------------------------------------------
set.seed(1)
train <- sample(1:nrow(apartments), nrow(apartments)/2)
apartments.test <- apartments[-train,]
tree.apartments.train <- tree(log(Price)~.,apartments,subset=train)
summary(tree.apartments.train)
layout(1)
plot(tree.apartments.train)
text(tree.apartments.train,pretty=0)
tree.apartments.train
yhat.all <- predict(tree.apartments.train,newdata=apartments.test)
mean((yhat.all - log(apartments.test$Price))^2)

Eurostat
17
First steps with R
Example 2: R code#-------------------------------------------------------------------------------
# CROSS VALIDATION
#-------------------------------------------------------------------------------
set.seed(2)
cv.apartments <- cv.tree(tree.apartments.train)
cv.apartments
par(mfrow=c(1,2))
plot(cv.apartments$size,cv.apartments$dev,type="b",
xlab='Terminal Nodes',ylab='Deviation')
points(cv.apartments$size[4],cv.apartments$dev[4],pch=19, col='red',)
plot(cv.apartments$k,cv.apartments$dev,type="b",
xlab='Parameter alpha',ylab='Deviation')
layout(1)
prune.apartments <- prune.tree(tree.apartments.train,best=6)
plot(prune.apartments)
text(prune.apartments,pretty=0)
prune.apartments
yhat.prune <- predict(prune.apartments,newdata=apartments[train,])
mean((yhat.prune - log(apartments$Price[train]))^2)
yhat.prune <- predict(prune.apartments,newdata=apartments.test)
mean((yhat.prune - log(apartments.test$Price))^2)

Eurostat
18
First steps with R
Example 2: R code#-------------------------------------------------------------------------------
# GRAPH
#-------------------------------------------------------------------------------
colour <- rep('Black',nrow(apartments))
colour[apartments$Lifts==0 & apartments$Neighborhood==0] <- 'Red'
colour[apartments$Lifts==0 & apartments$Neighborhood==1] <- 'Blue'
plot(apartments$Area,log(apartments$Price),pch=20,
xlab='Area (square meters)',ylab='Price (log euros)',col=colour)
abline(v=189,lty=2)
abline(v=149.5,,lty=2)
abline(v=108.9,,lty=2)
text(x=250,y=14.3,'Region 6',cex=.9)
text(x=170,y=14.3,'Region 5',cex=.9)
text(x=130,y=14.3,'Region 4',cex=.9)
text(x=70,y=14.3,'Region 3',cex=.9)
legend(x=240,y=11.5,
legend=c('Region 1','Region 2'),col=c('red','blue'),pch=20,cex=.9)

Eurostat
19
First steps with R
Example 2: R code#-------------------------------------------------------------------------------
# BAGGING (package ramdomForest requiered)
#-------------------------------------------------------------------------------
set.seed(1)
bag.apartments <- randomForest(log(Price)~.,data=apartments,subset=train,
mtry=14,importance=TRUE,ntree=500)
bag.apartments
yhat.bag <- predict(bag.apartments,newdata=apartments.test)
plot(exp(yhat.bag), apartments.test$Price,
ylab='Estimated Prices (euros)',
xlab='Observed Prices (euros)')
abline(0,1,col='red',lwd=2)
mean((yhat.bag-log(apartments.test$Price))^2)

Eurostat
20
First steps with R
Example 2: R code#-------------------------------------------------------------------------------
# BOOSTING (package gbm requiered)
#-------------------------------------------------------------------------------
set.seed(1)
boost.apartments <- gbm(log(Price)~.,data=apartments[train,],distribution="gaussian",
n.trees=5000,interaction.depth=3,shrinkage=0.001)
layout(1)
summary(boost.apartments)
par(mar=c(5,10,4,2))
barplot(summary(boost.apartments)$rel.inf, horiz=TRUE,
names.arg=summary(boost.apartments)$var,
xlab='Importance',las=1)
par(mar=c(5,4,4,2))
par(mfrow=c(1,2))
plot(boost.apartments,i="Area")
plot(boost.apartments,i="Lifts")
yhat.boost <- predict(boost.apartments,newdata=apartments[train,],n.trees=5000)
mean((yhat.boost-log(apartments$Price[train]))^2)
yhat.boost <- predict(boost.apartments,newdata=apartments.test,n.trees=5000)
mean((yhat.boost-log(apartments.test$Price))^2)

Eurostat
21
First steps with R
Example 2: R code
layout(1)
plot(exp(yhat.boost), apartments.test$Price,
ylab='Estimated Prices (euros)',
xlab='Observed Prices (euros)')
abline(0,1,col='red',lwd=2)
Related Documents