MODULE 1 : PICTOGRAPHY ANKUR CLUB

MODULE 1 : PICTOGRAPHY ANKUR CLUB. What is Pictography? A pictograph is a type of graph that uses pictures to tell how many items are being counted.
Dec 17, 2015
Welcome message from author
This document is posted to help you gain knowledge. Please leave a comment to let me know what you think about it! Share it to your friends and learn new things together.
Transcript

MODULE 1 : PICTOGRAPHY
ANKUR CLUB
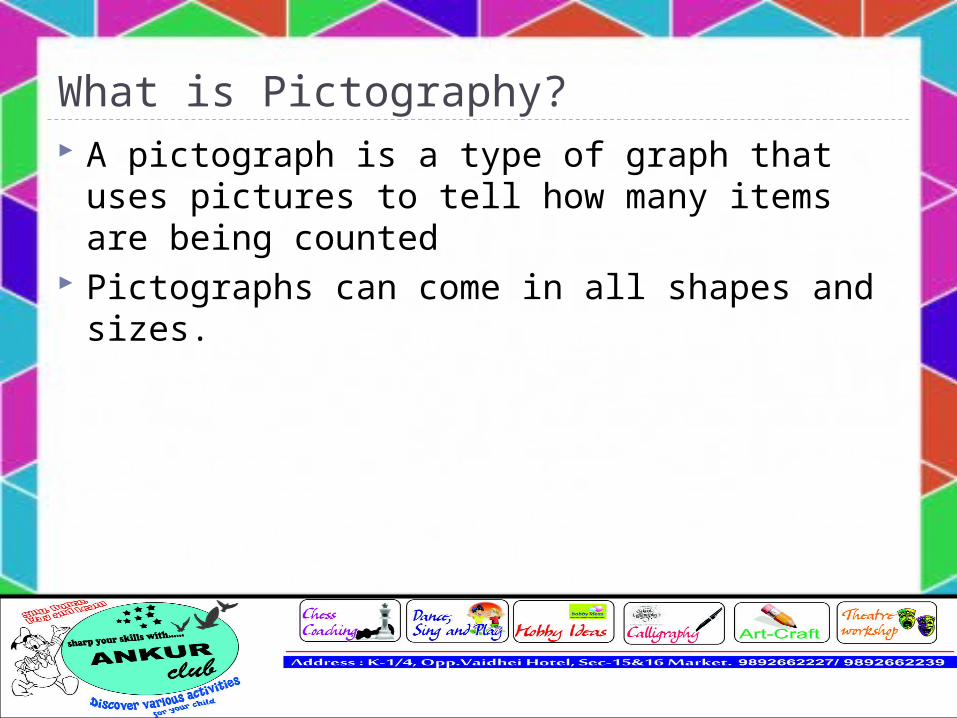
What is Pictography? A pictograph is a type of graph that uses
pictures to tell how many items are being counted
Pictographs can come in all shapes and sizes.

More about pictography! Made up of pictures which are used to
represent numbers Like bar graphs, they are used to compare
data. Very eye-catching and often used in
newspapers and magazines.

In the next two slides, you will find two very interesting PICTOGRAPHS :
The first pictograph gives pictures of animals to identify them quickly.
The next picture shows the colour whose names are given right beside.
Q. Try to count each item in both the pictographs

PICTOGRAPHY : EXAMPLE 1 :
Cat
Dog
Horse
Hamster
Turtle

PICTOGRAPHY : EXAMPLE 2 :
Red
Green
Blue
Orange
Pink
Red
Green
Blue
Orange
Pink
Total Chart

PICTOGRAPHY : EXAMPLE 3:
Fall
Winter
Spring
Summer
= 2
In the picture below, each leaf is assigned value 2. Try to count the number of leaves in each season!
= 2

PICTOGRAPHY- OLDEST WRITING
The oldest writing was pictographic, meaning that the sign for an object was written to resemble the object itself;

Let’s practiceLet’s create a pictograph to represent the following question:
How many hours a day do you spend watching television?
Related Documents