Journal of Bioenergetics and Biomembranes, Vol. 23, No. 6, 1991 Modification of Transplasma Membrane Oxidoreduction by SV40 Transformation of 3T3 Cells Hans Löw, ~ Frederick L. Crane, 2 Carin Grebing, ~ Monica Isaksson, ~ Annika Lindgren, ~ and Iris L. Sun 2 Received October 24, 1990; revised February 26, 1991 Abstract Transformation of 3T3 cells by SV40 virus changes the properties of the transplasma rnembrane electron transport activity which can be assayed by reduction of external ferric salts, After 42 h of culture and before the growth rate is maximum, the transformed cells have a much slower rate of ferric reduction. The change in aetivity is expressed both by change in Km and Vma x for ferricyanide reduction. The change in activity is not based on surface charge effect or on tight coupling to proton release or on intracellular NADH concentration. With transformation by SV40 virus infection the expression of transferrin receptors increases, which correlates with greater diferric transferrin stimulation of the rate of ferric ammonium citrate reduction in transformed SV40-3T3 cells than in 3T3 cells. Key Words: Transferrin receptor; diferric transferrin; 3T3 cells; transfor- marion; iron reduction; plasma membrane. Introducfion Ferricyanide, diferric transferrin, and other external electron acceptors stimulate the serum-free growth of a variety of transformed cells or of immortalized cells supplemented with other growth factors (Kay and Ellem, 1986; Sun et al., 1984a, 1985; Crane et al., 1987, 1990a; Waranimman et al., 1986, Wenner et al., 1988; Garcia-Cafiero 1988). The reduction of the exter- nal oxidants by cells activates specific tyrosine kinases (Low et al., 1990), increases calcium uptake (Löw et al., 1985), increases internal pH (Toole- Simms 1988), induces expression ofc myc and c fos oncogenes (Wenner et al., 1988, Wenner and Cutry, 1990), and decreases the NADH/NAD ratio (Navas et al., 1988). These activities have been associated with stimulation of ~Department of Endocrinology, Karolinska Institute, S-104 01 Stockholm, Sweden. 2Department of Biological Science, Purdue University, West Lafayette, Indiana 47907. 903 o145-479x/91/12oo-o9o35o6,5o/o © 1991Plenum Publishing Corporation

Welcome message from author
This document is posted to help you gain knowledge. Please leave a comment to let me know what you think about it! Share it to your friends and learn new things together.
Transcript
Journal o f Bioenergetics and Biomembranes, Vol. 23, No. 6, 1991
Modification of Transplasma Membrane Oxidoreduction by SV40 Transformation of 3T3 Cells
Hans Löw, ~ Frederick L. Crane, 2 Carin Grebing, ~ Monica Isaksson, ~ Annika Lindgren, ~ and Iris L. Sun 2
Received October 24, 1990; revised February 26, 1991
Abstract
Transformation of 3T3 cells by SV40 virus changes the properties of the transplasma rnembrane electron transport activity which can be assayed by reduction of external ferric salts, After 42 h of culture and before the growth rate is maximum, the transformed cells have a much slower rate of ferric reduction. The change in aetivity is expressed both by change in K m and Vma x for ferricyanide reduction. The change in activity is not based on surface charge effect or on tight coupling to proton release or on intracellular NADH concentration. With transformation by SV40 virus infection the expression of transferrin receptors increases, which correlates with greater diferric transferrin stimulation of the rate of ferric ammonium citrate reduction in transformed SV40-3T3 cells than in 3T3 cells.
Key Words: Transferrin receptor; diferric transferrin; 3T3 cells; transfor- marion; iron reduction; plasma membrane.
Introducfion
Ferricyanide, diferric transferrin, and other external electron acceptors stimulate the serum-free growth of a variety of transformed cells or of immortalized cells supplemented with other growth factors (Kay and Ellem, 1986; Sun et al., 1984a, 1985; Crane et al., 1987, 1990a; Waranimman et al., 1986, Wenner et al., 1988; Garcia-Cafiero 1988). The reduction of the exter- nal oxidants by cells activates specific tyrosine kinases (Low et al., 1990), increases calcium uptake (Löw et al., 1985), increases internal pH (Toole- Simms 1988), induces expression ofc myc and c fos oncogenes (Wenner et al., 1988, Wenner and Cutry, 1990), and decreases the NADH/NAD ratio (Navas et al., 1988). These activities have been associated with stimulation of
~Department of Endocrinology, Karolinska Institute, S-104 01 Stockholm, Sweden. 2Department of Biological Science, Purdue University, West Lafayette, Indiana 47907.
903 o145-479x/91/12oo-o9o35o6,5o/o © 1991 Plenum Publishing Corporation
904 Löw et aL
cell proliferation, so the plasma membrane electron transport system can be part of the total mechanism by which cell growth is activated or increased. It has been proposed that the electron transport system is an NADH oxidase oriented in a transplasma membrane position which is stimulated by diferric transferrin (Morré and Crane, 1990). This type of unique NADH oxidase activity has been demonstrated in isolated plasma membranes (Sun et al., 1987; Morré and Brightman, 1991; Thorstensen and Aisen, 1990).
Transformation of rat liver and pineal cells with a temperature-sensitive Simian virus 40 (SV40) has been found to change the activity of the trans- plasma membrane electron transport as measured by ferricyanide reduction by intact cells (Sun et al., 1983, 1986a, b, 1988a, b). The cells with the transformed phenotype have lower activity, and the activity which they show is more sensitive to inhibition by the antitumor drug adriamycin (Sun et al., 1983, 1986b; Crane et al., 1985). SV40 transformation, on the other hand, makes transmembrane electron transport less inhibited by retinoic acid (Sun et al,, 1988b; Sun and Crane, 1990).
A drawback to the studies with the temperature-sensitive mutant of SV40 is that the cells taust be maintained at two different temperatures (33 and 40 °) to express the transformed and nontransformed phenotypes. In this paper we examine the effects of SV40 on transplasma membrane ferricyanide reduction by comparison of activity in Swiss 3T3 mouse fibroblasts and SV40 transformed 3T3 cells. In addition, we examine the effects of SV40 transfor- mation on the reduction of ferric ammonium citrate and diferric transferrin stimulation of that reduction as measured by formation of the ferrous bathophenanthroline disulfonate (BPS) chelate at the cell surface and examine how the activity is related to expression of the transferrin receptor (Löw et al., 1986, 1987).
Methods
Cell Culture
3T3 Swiss mouse embryo fibroblasts and SV40 transformed 3T3 cells (Flow Laboratories Inc.) were maintained in monolayer cultures in NUNC's plastic tissue culture bottles. The stock cultures were grown in a humidified atmosphere of 5% CO2 in Dulbecco's modification of Eagles medium (DMEM) supplemented with 10% fetal bovine serum, 50 units of benzyl- penicillin per ml, and 50 #g of streptomycin per ml.
The cells were removed from the dish for transfer by treatment with 0.05% trypsin in a salt solution containing 0.02% EDTA (Flow Lab., Inc.). The cells were subcultured once a week. Cells used for experimental purpose were removed by trypsin, suspended in DMEM with 10% fetal bovine serum
Transformation of 3T3 Cells by SV40 905
to inactivate the trypsin, and then washed in the buffer to be used in the experiment (Vogt and Dulbecco, 1970).
Redox Assays. Two different assay procedures are used. The direct spectrophotometric assay which is best for observation of initial rapid rates, and the assay based on measurement of formed ferrocyanide after removal of cells by centrifugation, which allows longer-term assay without possible interference by cellular cytochromes.
Ferricyanide reduction was assayed by incubation of trypsinized cells with 0.2 mM ferricyanide. The incubation medium was a salt solution with 150mM NaC1, 5mM KC1, 0.6mM Na2HPO4, 0.6mM Na2HPO4, and 25 mM Tris(hydroxymethyl)aminomethane (Trizma Base) (pH 7.4). Aliquots of the suspension were taken out during 20min for removal of cells, and ferrocyanide in the supernatant was assayed as described in Clark et al. (1981).
Direct spectrophotometric assay of ferricyanide reduction in the presence of cells (Sun et al., 1984b) was carried out in a dual-beam spectrophotometer at 37°C reading 420 nm absorption using 500 nm as the reference wavelength; 0.2mM ferricyanide was used for each assay. An extinction coefficient of 1.0 c m - 1 mM-~ was used. The rate of ferricyanide reduction is proportional to the amount of cells used up to 20 million cells per ml.
The reduction of diferric transferrin or ferric ammonium citrate was determined by formation of the ferrous bathophenanthroline disulfonate complex measured at 535-600nm with the dual-beam spectrophotometer (Löw et al., 1987). The cells were suspended in a saline solution, 130mM NaC1, 5 mM KC1, 1 mM MgC12, and 2 mM CaC12 in 10 mM Hepes buffer (pH 7.4) in a total volume of 2.5 ml containing 15/~M bathophenanthroline disulfonate, 7.5 #M ferric ammonium citrate, 3.4-42 #M diferric transferrin, and 0.75 to 2.0 x 10⁶ cells. All reactions were at 37 °. Extinction coefficient difference at the wavelengths used was 17.1 cm l mM-~.
Transferrin was iron saturated according to the following procedure: 100 mg of human apotransferrin (Sigma) was dissolved in 9.8 ml of a saline solution, 130mM NaCI, 5mM KCI, 1 mM MgCI2, and 2mM CaC12 in 10mM Hepes buffer (pH 7.4); then 0.1 ml of 100mM NaHCOB was added together with 0.1 ml 26mM ferroammoniumsulfate in water followed by incubation for 1 h at room temperature. The transferrin was dialyzed over- night, with two changes, against the saline-Hepes buffer at 4°C (Karin and Mintz, 1981).
The iron saturation was controlled with spectrophotometric analysis at 465 nm.
The occurrence of nonspecifically bound iron was controUed by ascorbate reduction in the presence of bathophenanthroline disulfonate at pH7.4, which forms a complex with a high absorbance at 535 nm with any divalent
906 Löw et aL
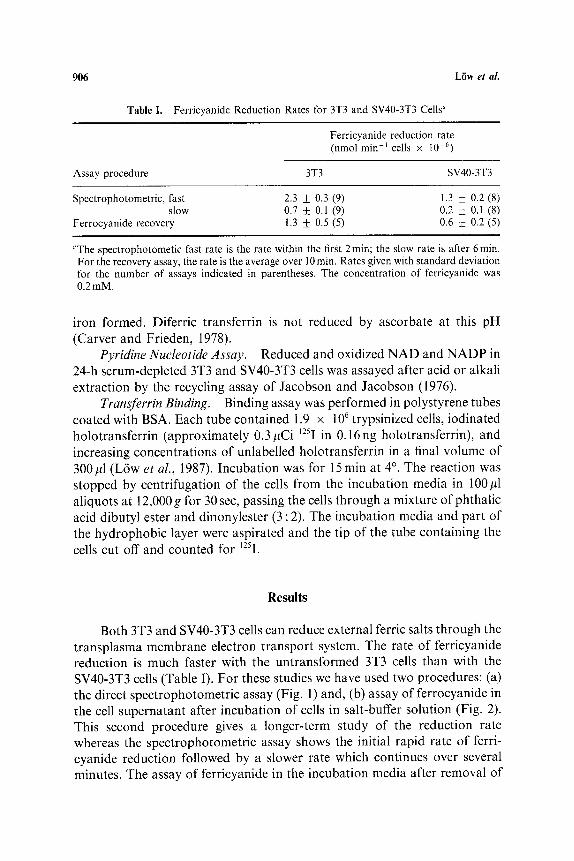
Table I. Ferricyanide Reduction Rates for 3T3 and SV40-3T3 CelW'
Ferricyanide reduction rate (nmol min -~ cells x 10 6)
Assay procedure 3T3 SV40-3T3
Spectrophotometric, fast 2.3 _+ 0.3 (9) 1.3 -- 0.2 (8) slow 0.7 _+ 0.1 (9) 0.2 + 0.1 (8)
Ferrocyanide recovery 1.3 + 0.5 (5) 0.6 + 0.2 (5)
"The spectrophotometic fast rate is the rate within the first 2 min; the slow rate is after 6 min. For the recovery assay, the rate is the average over 10 min. Rates given with standard deviation for the number of assays indicated in parentheses. The concentration of ferricyanide was 0.2mM.
iron formed. Diferric transferrin is not reduced by ascorbate at this pH (Carver and Frieden, 1978).
Pyridine Nucleotide Assay. Reduced and oxidized NAD and NADP in 24-h serum-depleted 3T3 and SV40-3T3 cells was assayed after acid or alkali extraction by the recycling assay of Jacobson and Jacobson (1976).
Transferrin Binding. Binding assay was performed in polystyrene tubes coated with BSA. Each tube contained 1.9 x 10⁶ trypsinized cells, iodinated holotransferrin (approximately 0.3#Ci ~2»I in 0.16ng holotransferrin), and increasing concentrations of unlabelled holotransferrin in a final volume of 300#1 (Löw et al., 1987). Incubation was for 15min at 4 °. The reaction was stopped by centrifugation of the cells from the incubation media in 100#1 aliquots at 12,000 g for 30 sec, passing the cells through a mixture of phthalic acid dibutyl ester and dinonylester (3 : 2). The incubation media and part of the hydrophobic layer were aspirated and the tip of the tube containing the cells cut oft and counted for 125I.
Results
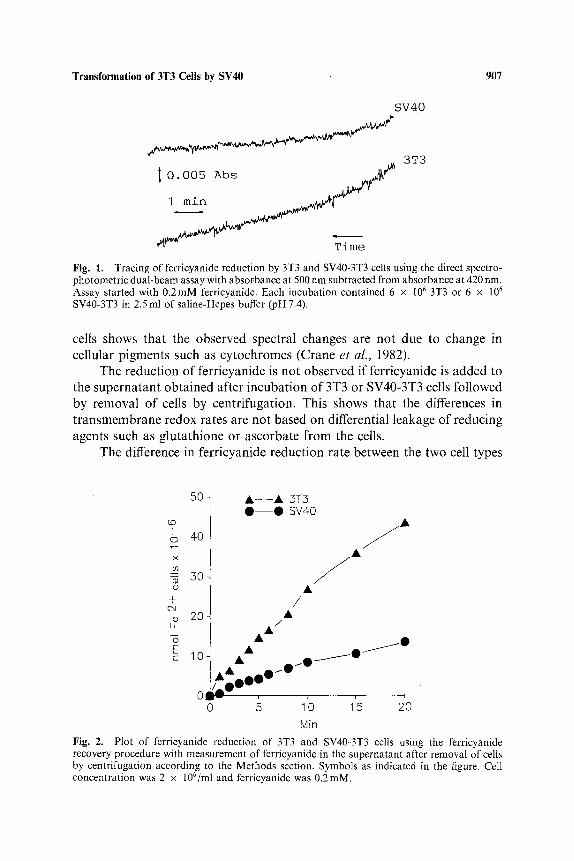
Both 3T3 and SV40-3T3 cells can reduce external ferric salts through the transplasma membrane electron transport system. The rate of ferricyanide reduction is much faster with the untransformed 3T3 cells than with the SV40-3T3 cells (Table I). For these studies we have used two procedures: (a) the direct spectrophotometric assay (Fig. 1) and, (b) assay of ferrocyanide in the cell supernatant after incubation of cells in salt-buffer solution (Fig. 2). This second procedure gives a longer-term study of the reduction rate whereas the spectrophotometric assay shows the initial rapid rate of ferri- cyanide reduction followed by a slower rate which continues over several minutes. The assay of ferricyanide in the incubation media after removal of
Transformation of 3T3 Cells by SV40 907
SV40
3T3 I 0.005 Abs , . /
. o 1 ~ ~ . ~v; i Time Fig. 1. Tracing of ferricyanide reduction by 3T3 and SV40-3T3 cells using the direct spectro- photometric dual-beam assay with absorbance at 500 nm subtracted from absorbance at 420 nm. Assay started with 0.2mM ferricyanide. Each incubation contained 6 x 10⁶ 3T3 or 6 x 10⁶ SV40-3T3 in 2.5 ml of saline-Hepes buffer (pH 7.4).
cells shows tha t the observed spectral changes are no t due to change in cel lular p igments such as cy tochromes (Crane et al., 1982).
The reduct ion o f fer r icyanide is no t observed if fer r icyanide is a d d e d to the supe rna tan t ob ta ined after incuba t ion o f 3T3 or SV40-3T3 cells fol lowed by removal o f cells by centr i fugat ion. This shows tha t the differences in
t r a n s m e m b r a n e redox rates are not based on differential leakage of reducing agents such as g lu ta th ione or a scorba te t 'rom the cells.
The difference in fer r icyanide reduct ion rate between the two cell types
50
CO I o 40
x
5O
A - - & 5T5 0 - - 0 SV40
/ - o /A +
20 / A
A A c • ~ / 0 10 • O / w
A A 0 ~ 0 ~ 0 / ~ 0 o ° °
0 5 1'0 1;5 2'0 Min
Fig. 2. Plot of ferricyanide reduction of 3T3 and SV40-3T3 cells using the ferricyanide recovery procedure with measurement of ferricyanide in the supernatant after removal of cells by centrifugation according to the Methods section. Symbols as indicated in the figure. Cell concentration was 2 x 10⁶/tal and ferricyanide was 0.2mM.
908 Löw et al.
~D [ O
x
O
r-
E @
O
E c
4 7 • 5T5
/ • sv4o
2 '
I~ T/] / ' ~
i w
0 f o,o oi~ 0:2 o:s o'.,~ ols
mM FERRICYAN[DE
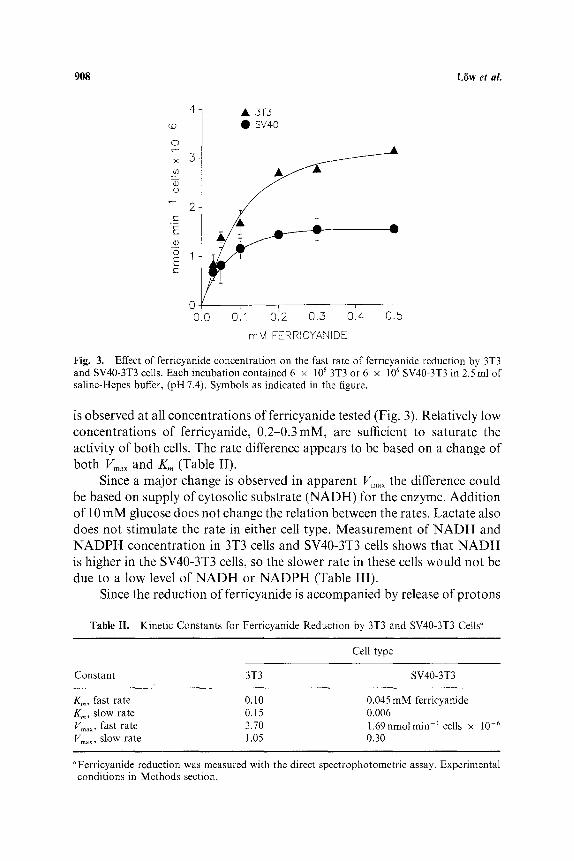
Fig. 3. Effect of ferricyanide concentration on the fast rate of ferricyanide reduction by 3T3 and SV40-3T3 cells. Each incubation contained 6 x 10⁶ 3T3 or 6 x 10⁶ SV40-3T3 in 2.5ml of saline-Hepes buffer, (pH 7.4). Symbols as indicated in the figure.
is observed at all concentrations of ferricyanide tested (Fig. 3). Relatively low concentrations of ferricyanide, 0.2-0.3mM, are sufficient to saturate the activity of both cells. The rate difference appears to be based on a change of both Vma x and Km (Table II).
Since a major change is observed in apparent Vmax the difference could be based on supply of cytosolic substrate (NADH) for the enzyme. Addition of 10 mM glucose does not change the relation between the rates. Lactate also does not stimulate the rate in either cell type. Measurement of N A D H and N ADP H concentration in 3T3 cells and SV40-3T3 cells shows that N A D H is higher in the SV40-3T3 cells, so the slower rate in these cells would not be due to a low level of N A D H or NADPH (Table III).
Since the reduction of ferricyanide is accompanied by release of protons
Table II. Kinetic Constants for Ferricyanide Reduction by 3T3 and SV40-3T3 Cells «
Cell type
Constant 3T3 SV40-3T3
Km, fast rate 0.10 0.045 mM ferricyanide Km, slow rate 0.15 0.006 Vmax, fast rate 3.70 1 .69nmolmin 1 cells x 10 6 Vmax, slow rate 1.05 0.30
"Ferricyanide reduction was measured with the direct spectrophotometric assay. Experimental conditions in Methods section.
Transformation of 3T3 Cells by SV40 909
Table III. Pyridine Nucleotide Content (nmol/mg Protein) of 24-h Serum-Depleted 3T3 and SV40-3T3 Cells ~
Cell types
Pyridine nucleotide 3T3 SV40-3T3
NAD + 1.3 _+ 0.3 (4) 2.6 + 0.6 (4) NADH 0.18 -- 0.07 (4) 0.35 _+ 0.12 (4) N A D P + 0.13 + .06 (4) 0.31 + 0.17 (4) NADPH 0.27 ± 0.11 (4) 0.50 _+ .07 (4)
ùConditions according to Jacobson and Jacobson (1976).
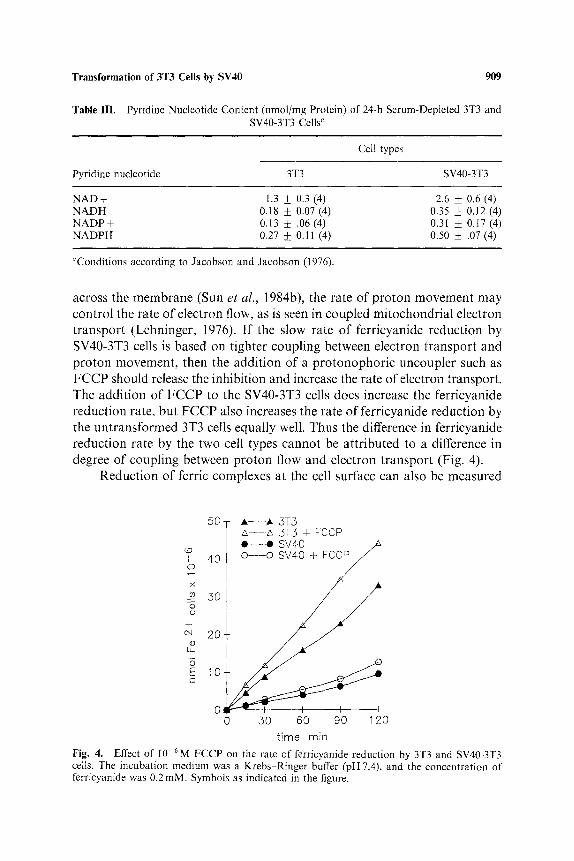
across the membrane (Sun et al., 1984b), the rate of proton movement may control the rate of electron flow, as is seen in coupled mitochondrial electron transport (Lehninger, 1976). If the slow rate of ferricyanide reduction by SV40-3T3 cells is based on tighter coupling between electron transport and proton movernent, then the addition of a protonophoric uncoupler such as F C C P should release the inhibition and increase the rate of electron transport. The addition of FCCP to the SV40-3T3 cells does increase the ferricyanide reduction rate, hut FCCP also increases the rate of ferricyanide reduction by the untransformed 3T3 cells equally well. Thus the difference in ferricyanide reduction rate by the two cell types cannot be attributed to a difference in degree of coupling between proton flow and electron transport (Fig. 4).
Reduction of ferric complexes at the cell surface can also be measured
50-
I 40- CD
x
30 . o
+ cq 20-
© L~
õ 10.
A - - A 3T5 Z~- -A 3T3 + FCCP e- -O SV40 p / ~ O - - O SV40 + FCC
1 30 60 90 120
t ime min
Fig. 4. Effect of 10-6M FCCP on the rate of ferricyanide reduction by 3T3 and SV40-3T3 cells. The incubation medium was a Krebs-Ringer buffer (pH 7.4), and the concentration of ferrJcyanide was 0.2 mM. Symbols as indicated in the figure.
910 Löw et al.
2.5
cO
I 2.o O
x
01 1.5 O
7 ~.o r -
0.5 r -
0.0
A - - & äTä A - - A äT5 + FAC O - - O SV40 O - - O SV40 + FAC A u
~~~o~ ©-
Z 1 '0 2'0 5'0
BM Diferric transferrin
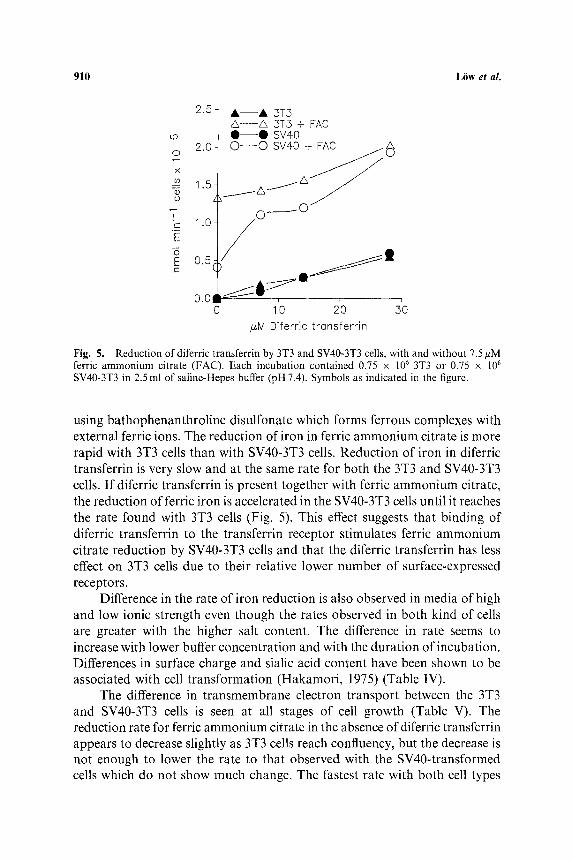
Fig. 5. Reduction of diferric transferrin by 3T3 and SV40-3T3 cells, with and without 7.5 ffM ferric ammonium citrate (FAC). Each incubation contained 0.75 x 10 6 3T3 or 0.75 x 10 6
SV40-3T3 in 2.5 ml of saline-Hepes buffer (pH 7.4). Symbols as indicated in the figure.
using bathophenanthroline disulfonate which forms ferrous complexes with external ferric ions. The reduction of iron in ferric ammonium citrate is more rapid with 3T3 cells than with SV40-3T3 cells. Reduction of iron in diferric transferrin is very slow and at the same rate for both the 3T3 and SV40-3T3 cells. I f diferric transferrin is present together with ferric ammonium citrate, the reduction of ferric iron is accelerated in the SV40-3T3 cells until it reaches the rate found with 3T3 cells (Fig. 5). This effect suggests that binding of diferric transferrin to the transferrin receptor stimulates ferric ammonium citrate reduction by SV40-3T3 cells and that the diferric transferrin has less effect on 3T3 cells due to their relative lower number of surface-expressed receptors.
Difference in the rate of iron reduction is also observed in media of high and low ionic strength even though the rates observed in both kind of cells are greater with the higher salt content. The difference in rate seems to increase with lower buffer concentration and with the duration of incubation. Differences in surface charge and sialic acid content have been shown to be associated with cell transformation (Hakamori , 1975) (Table IV).
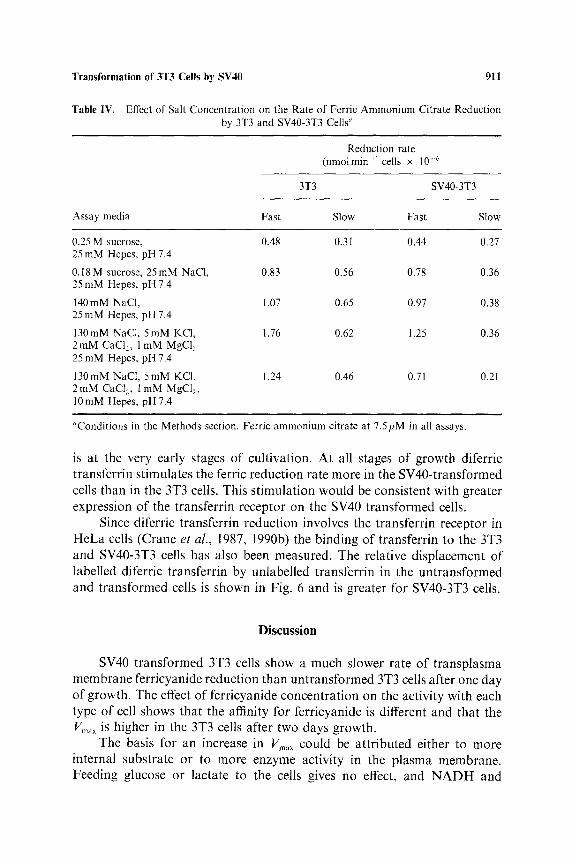
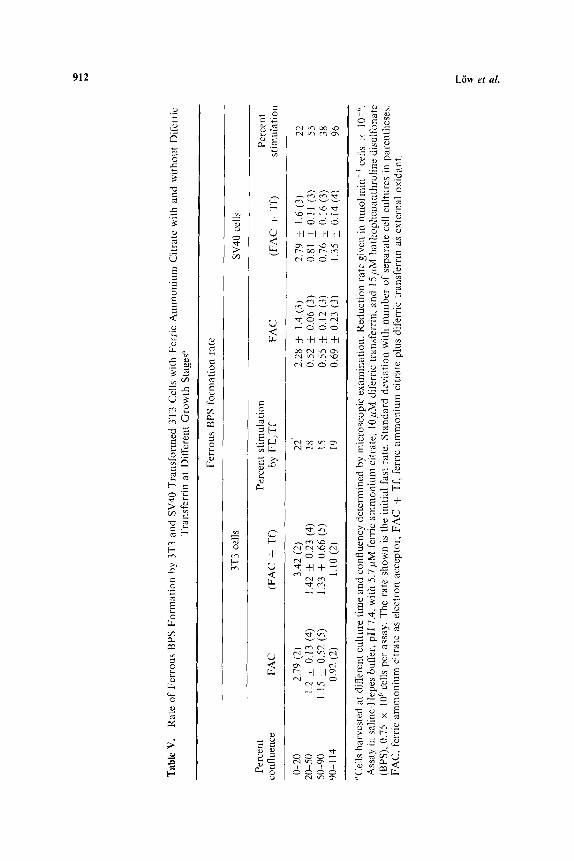
The difference in transmembrane electron transport between the 3T3 and SV40-3T3 cells is seen at all stages of cell growth (Table V). The reduction rate for ferric ammonium citrate in the absence of diferric transferrin appears to decrease slightly as 3T3 cells reach confluency, but the decrease is not enough to lower the rate to that observed with the SV40-transformed cells which do not show much change. The fastest rate with both cell types
Transformation of 3T3 Cells by SV40 911
Table IV. Effect of Salt Concentration on the Rate of Ferric Ammonium Citrate Reduction by 3T3 and SV40-3T3 Cells «
Reduction rate (nmolmin-' cells x 10 . 6
3T3 SV40-3T3
Assay media Fast Slow Fast Slow
0.25 M sucrose, 0.48 0.31 0.44 0.27 25 mM Hepes, pH 7.4
0.18 M sucrose, 25 mM NaC1, 0.83 0.56 0.78 0.36 25 mM Hepes, pH 7.4
140mM NaCI, 1.07 0.65 0.97 0.38 25 mM Hepes, pH 7.4
130mM NaC1, 5mM KC1, 1.76 0.62 1.25 0.36 2 mM CaC12, l mM MgC12 25 mM Hepes, pH 7.4
130mM NaCI, 5mM KC1, 1.24 0.46 0.71 0.21 2 mM CaC1, 1 mM MgCI2, l0 mM Hepes, pH 7.4
«'Conditions in the Methods section. Ferric ammonium citrate at 7.5/~M in all assays.
is at the very early stages of cultivation. At all stages of growth diferric transferrin stimulates the ferric reduction rate more in the SV40-transformed cells than in the 3T3 cells. This stimulation would be consistent with greater expression of the transferrin receptor on the SV40 transformed cells.
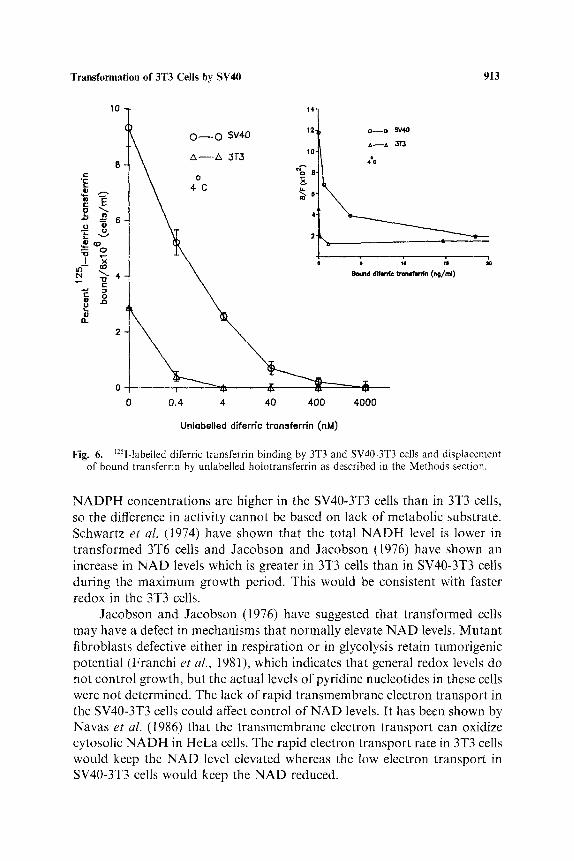
Since diferric transferrin reduction involves the transferrin receptor in HeLa cells (Crane et al., 1987, 1990b) the binding of transferrin to the 3T3 and SV40-3T3 cells has also been measured. The relative displacement of labelled diferric transferrin by unlabelled transferrin in the untransformed and transformed cells is shown in Fig. 6 and is greater for SV40-3T3 cells.
Discuss ion
SV40 transformed 3T3 cells show a much slower rate of transplasma membrane ferricyanide reduction than untransformed 3T3 cells after one day of growth. The effect of ferricyanide concentration on the activity with each type of cell shows that the affinity for ferricyanide is different and that the Vmùx is higher in the 3T3 cells after two days growth.
The basis for an increase in Vmax could be attributed either to more internal substrate or to more enzyme activity in the plasma membrane. Feeding glucose or lactate to the cells gives no effect, and N A D H and
9 1 2 L ö w et al.
ùc
o
©
<
~a .~
e- o ù ~
o
r , .
é ,
2
+1 ÷1 +1 +1 <
<
~- 4-] +1 +1 +1
ù"q d d d
~ d c S ~
m c..l m ~
P-:. +1 +1 t " l C.,I t~.3 ~
t~,l ~ ~~ " ,
e~
~ + <
<
ù ~,
~."2
.o
ù ..., , - , ~ " ~ :ü
E .~ P-- ~ ü
:ü..u
e j
a~
e ~
0
~~ ~..~
Transformation of 3T3 Celis by SV40 913
10 14 1 ~ , _ ~ 121L o - - o b'~/40
0 - - 0 ~v4u T
s \ zx--A 3r3 '011 ..o
i \ o ' t \ e i l e 1 |
z£B} 4 ~ ~,ùù,ù°,~ù,ùùù ¢ù,/ùù)
g. 2
0 .a 0 0.4 4 40 400 4000
Unlabelled d[ferric transferrin (nM)
Fig. 6. ~2»I-labelled diferric transferrin binding by 3T3 and SV40-3T3 cells and displacement of bound transferrin by unlabelled holotransferrin as described in the Methods section.
N A D P H concentrations are higher in the SV40-3T3 cells than in 3T3 cells, so the difference in activity cannot be based on lack of metabolic substrate. Schwartz et al. (1974) have shown that the total N A D H level is lower in transformed 3T6 cells and Jacobson and Jacobson (1976) have shown an increase in NAD levels which is greater in 3T3 cells than in SV40-3T3 cells during the maximum growth period. This would be consistent with faster redox in the 3T3 cells.
Jacobson and Jacobson (1976) have suggested that transformed cells may have a defect in mechanisms that normally elevate NAD levels. Mutant fibroblasts defective either in respiration or in glycolysis retain tumorigenic potential (Franchi et al., 1981), which indicates that general redox levels do not control growth, but the actual levels of pyridine nucleotides in these cells were not determined. The lack of rapid transmembrane electron transport in the SV40-3T3 cells could affect control of NAD levels. It has been shown by Navas et aI. (1986) that the transmembrane electron transport can oxidize cytosolic NADH in HeLa cells. The rapid electron transport rate in 3T3 cells would keep the NAD level elevated whereas the low electron transport in SV40-3T3 cells would keep the NAD reduced.
914 Löw et aL
The results with SV40 transformation of 3T3 cells are similar to the effects of SV40 transformation with pineal cells since both the Km and Vma~ for ferricyanide are changed in the pineal cells (Sun et al., 1986b). Since the transformation in pineal cells infected with the SV40 mutant is temperature dependent, it was not possible in those studies to evaluate effects based on the difference in temperature. For the 3T3 cells the difference in activity is not based on temperature differences.
Addition of the protonophore FCCP to the eells will allow free exchange ofprotons across the plasma membrane (Mitchell, 1976). It may also increase the formation of ADP by uncoupling the mitochondrial ATP synthesis. The stimulation with FCCP is observed with both types of cells, so the difference in ferricyanide reduction rate cannot be attributed to selective restriction of proton flow in the transformed eells. The aetual increase observed with both cell types could be based on an increase of glycolysis to increase cytosolic NADH because of increased ADP. A lack of tight coupling between electron transport and proton release is consistent with the evidence from other cells that the proton release is through the Na +/H + antiport instead of through protonation of electron carriers (Sun et al., 1988a; Carcia-Cafiero et al., 1987).
The difference in transmembrane reduction of ferric salts by the 3T3 cells is shown not to be based on increased excretion of a reducing agent (e.g., ascorbic acid) during the incubation. It is also not based on a difference in negative charge density on the transformed cells caused, for example, by increased levels of sialic acid on these cells. Changes in glycolipid and glycoprotein on cell surfaces during transformation are weil known (Hakamori, 1975), but the difference in oxidoreduction rate does not appear to primarily depend on surface charge. The increased rate with 140 mM NaC1 can be based on activation of the Na+/H + antiport (Sun et al., 1988a; Garcia-Cafiero et al., 1987).
The most likely agent for expression of SV40 effects at the plasma membrane is the large T antigen. Five percent of the large T antigen is found inserted across the plasma membrane and "its presence in the membrane is necessary for transformation (Butel and Jarvis, 1986; Rinke and Deppert, 1989). The presence of the large T protein in the membrane may also affect electron transport function.
Evidence that diferrie transferrin can act as a natural electron acceptor for the transplasma membrane redox system in HeLa cells has been presented (Löw et al., 1987; Crane et al., 1987, 1990b). Transferrin is recognized as a growth stimulator for many cells (Hutchings and Sato, 1978; Barnes and Sato, 1980), and it has been proposed that this growth stimulation can be based on its function as a carrier for iron uptake (May and Cuatrecasas, 1985; Young et al., 1979; Basset et al., 1986; Hamilton et al., 1979; Taetle
Transformation of 3T3 Cells by SV40 915
et al,, 1983; Ekbom et al., 1983; Crane et al., 1985). It has been proposed that transferrin may also stimulate growth by acting as an external electron acceptor (Crane et al., 1987; Ellem and Kay, 1983; Sun et al., 1984a; Crane et al., 1990b). The rates of diferric transferrin reduction by 3T3 and SV40- 3T3 cells are similar in contrast to the rauch lower ferricyanide and ferric ammonium citrate reduction by SV40-3T3 cells.
We have presented evidence that the diferric transferrin reduction by HeLa cells is dependent on the transferrin receptor and is strongly inhibited by antibodies to the transferrin receptor (Löw et al., 1986, 1987; Crane et al.,
1990b). It has previously been shown that transferrin receptor expression at the cell surface is correlated to cell proliferation (Larrick and Cresswell, 1979; May and Cuatrecasas, 1985). The increased transferrin binding which we observe on the SV40-transformed 3T3 cells is consistent with the growth stimulation in transformed cells and can account for the observation that the 3T3 and SV40-3T3 cells have the same rate of transferrin reduction even though the transformed cells have a rauch lower rate of t ransmembrane electron transport to ferricyanide. It appears that transferrin receptor avail- ability on the SV40-3T3 cells permits greater activation of iron reduction by diferric transferrin whereas diferric transferrin has less effect on iron reduction by 3T3 cells.
Acknowledgments
This work was supported by the Swedish Medical Research Council and the U.S. National Institutes of Health CA 36761 and G M K6-21839 (FLC).
References
Basset, P., Quesneau, Y., and Zwiller, J. (1986). Cancer Res. 46, 1644-1647. Barnes, D., and Sato, G. (1980). Cell 22, 649-655. Butel, J. S., and Jarvis, D. L. (1986). Biochim. Biophys. Acta 865, 171-185. Carver, F. J., and Frieden, E. (1978) Biochemistry 17, 167-172. Clark, M. G., Partick. E. J., Patten, G. S., Crane, F. L., Löw, H., and Grebing, C. (1981).
Biochem. J. 200, 565-572. Crane, F. L., Roberts, H., Linnane, A. W., and Löw, H, (1982). J. Bioenerg. Biomembr. 14,
191-205. Crane, F. L., Sun, I. L., Clark, M. G., Grebing, C., and Löw, H. (1985). Biochim. Biophys. Acta
8il, 233-264. Crane, F. L., Löw, H., Sun, I. L., Navas, P., and Morré, D. J. (1987). In Redox Functions of the
Eukaryotic Plasma Membranes (Ramirez, J., ed.), Publ. Office Consejo Superior Investi- gaciones Cientificas, Madrid, pp. 1-17.
Crane, F. L., Löw, H., Sun, I. L., and Isaksson, M. (1990a). In Oxidoreduction at the Plasma Membrane." Relation to Growth and Transport (Crane, F. L., Morré, D. J., and Löw, H., eds.), CRC Press, Boca Raton, pp. 141-170.
916 Löw et al.
Crane, F. L., Löw, H., Sun, 1. L., Morré, D. J., and Faulk, W. P. (1990b). In Growth Factors: From Genes to Clinical Application (Sara, V., Hall, K., and Löw, H., eds.), Raven Press, New York, pp. 129-139.
Ellem, K. A. O., and Kay, G. F. (1983). Biochem. Biophys. Res. Commun. 112, 183 190. Ekbom, P., Thesleff, 1., Letho, V.-P., and Virtanen, I. (1983). lnl. J. Cancer 31, 111-117. Franchi, A., Silvestre, P., and Pouyssegur, J. (1981). Int. J. Cancer Res. 27, 819-827. Garcia-Cafiero, R. (1988). In Plasma Membrane Oxidoredu«tases in Control of Anirnal and Plant
Growth (Crane, F. L., Morré, D. J., and Löw, H., eds.), Plenum, New York, pp. 27-36. Garcia-Cafiero, R., Diaz Gil, J. J., and Guerra, M. A. (1987). In Redox Function of the
Eukaryotic Plasma Membrane (Ramirez, J. M., ed.), Publ. Office Consejo Superior Investi- gaciones Cientificas, Madrid, pp. 41-47.
Hakamori, S. I. (1975). Biochim. Biophys. Acta 417, 55-89. Hamilton, I., Wada, A. G., and Sussman, H. H. (1979). Pro«. Natl. Acad. Sci. USA 76,
6406-64 l 0. Hutchings, S. E., and Sato, G. H. (1978). Proc. Natl. Acad. Sci. USA 75, 901-904. Jacobson, E. L., and Jacobson, M. K. (1976). Arch. Biochem. Biophys. 175, 627-634. Karin, M., and Mintz, B. (1981). J. Biol. Chem. 78, 3245-3252. Kay, G. F., and Ellem, K. A. O. (1986). J. Cellular Physiol. 126, 275-284. Larrick, J. W., and Cresswell, P. (1979). J. Supramol. Struct. !1, 579-586. Lehninger, A. L. (1976). The Mitochondrion, Benjamin, N.Y. Löw, H., Crane, F. L., Partick, E. J., and Clark, M. J. (1985). Biochim. Biophys. Acta 844,
142-148. Löw, H., Sun, I. L., Navas, P., Grebing, C., Crane, F. L., and Morré, D. J. (1986) Bio«hem.
Biophys. Communs. 139, 1117-1123. Löw, H., Grebing, C., Lindgren, A., Tally, M., Sun, I. L., and Crane, F. L. (1987). J. Bioenerg.
Biomembr. 19, 535-550. Low, P. S., Geahlin, R. L., Mehler, E., and Harrison, M. (1990). Biomed. Biochem. Acta 49,
135-140. May, W. S., Jr., and Cuatrecasas, P, (1985). J. Membr. Biol. 88, 205-215. Mitchell, P. (1976). Biochem. Soc. Trans. 4, 399-430. Morré, D. J., and Brightman, A. (199l). J. Bioenerg. Biomembr. 23, 469-489. Morré, D. J., and Crane, F. L. (1990). In Oxidoreduction at the Plasma Membrane: Relation to
Growth and Transport. (Crane, F. L., Morré, D. J., and Löw, H., eds.), CRC Press, Boca Raton, pp. 67-84.
Navas, P., Sun, I. L., Morré, D. J., and Crane, F. L. (1986). Biochem. Bioph)s. Res. Commun. 135, 110 115.
Navas, P., Sun, I. L., Morré, D. J., and Crane, F. L. (1988). In Plasma Membrane Oxidoreductases in Control of Animal and Plant Growth, (Crane, F. L., Morré, D. J., and Löw, H., eds.), Plenum Press, New York, pp. 339-348.
Rinke, Y., and Deppert, W. (1989). Virology 170, 424-432. Schwartz, J. P., Passonneau, J. V., Johnson, G. S., and Pastan, 1. (1974). J. Biol. Chem. 249,
4138-4143. Sun, I. L., and Crane, F. L. (1990). In Oxidoreduetion at the Plasma Membrane: Relation to
Growth and Transport (Crane, F. L., Morré, D. J., and Löw, H., eds.), CRC Press, Boca Raton, pp. 257-280.
Sun, I. L., Crane, F. L., Chou, J. Y., Löw, H., and Grebing, C. (1983). Biochem. Biophys. Res. Commun. 116, 210-216.
Sun, I. L., Crane, F. L., Löw, H., and Grebing, C. (1984a), Biochem. Biophys. Res. Commun. 125, 649-654.
Sun, I. L., Crane, F. L., Gebing, C., and Löw, H. (1984b). J. Bioenerg. Biomembr. 16, 583-595. Sun, I. L., Crane, F. L., Grebing, C., and Löw, H. (I985). Exp. Cell Res. 156, 528-536. Sun, I. L., Navas, P., Crane, F. L., Chou, J. Y., and Löw, H. (1986a). J. Bioenerg. Biomembr.
18, 471-486. Sun, I. L., Crane, F. L., and Chou, J. Y. (1986b). Biochim. Biophys. Acta 886, 327-336. Sun, I. L., Navas, P., Crane, F. L., Morré, D. J., and Löw, H. (1987). J. Biol. Chem. 262,
15915-15921.
Transformation of 3T3 Cells by SV40 917
Sun, I. L., Toole-Simms, W,, Crane, F. L., Morré, D. J., Löw, H., and Chou, J. Y. (1988a). Biochim. Biophys. Acta 938, 17-23.
Sun, I. L., Toole-Simms, W., Crane, F. L., Morré, D. J., Löw, H., and Chou, J. Y. (1988b). J. Bioenerg. Biomembr. 20, 383-391.
Taetle, R., Honeysett, J. M., and Trowbridge, I. (1983). Int. J. Cancer 32, 343-349. Thorstensen, K., and Aisen, P. (1990). Biochim. Biopkys. Acta 1052, 29-35. Toole-Simms, W. (1988). Regulation of Proton Release by HeLa Cells by Ferric Reductase,
PhD Thesis, Purdue University, West Lafayette, Indiana. Vogt, M., and Dulbecco, R. (1970). Proc, Natl. Acad. Sci. USA 46, 365-370. Waranimman, P., Sun, I. L., and Crane, F. L. (1986). Proc. Indiana Acad. Sei. 95, 137-144. Wenner, C. E., and Curry, A. F. (1990). In Oxidoreduction at the Plasma Membrane: Relation
to Growth and Transport. (Crane, F. L., Morré, D. J., and Löw, H., eds.), CRC Press, Boca Raton, pp. 131-140.
Wenner, C. E., Cutry, A., Kinniburgh, A., Tomei, L. D., and Leister, K. J. (lC%). In Plasma Membrane Oxidoreductases in Control of Animal and Plant Growth, (Crane. F. L., Mo~ré, D. J., and Löw, H., eds.), Plenum Press, New York, pp. 7-16.
Young, D. V., Cox, F. W., Chipman, S., and Hartman, S. C. (1979). Exp. CellRes. 118, 410-414.
Related Documents


