MODERNIZATION OF AGRICULTURE AND ECONOMIC DEVELOPMENT The Indian Experience Baku/ H. Dholakia and Ravendra H. Dholakia (Indian Institute of Management, Ahmedabad, India) Introduction The world has witnessed spectacular in- creases in agricultural output during the twentieth century, particularly in its latter half. This achievement is mainly ascribed to the improved agricultural practices leading to higher productivity of land and labour. The contribution of extensive cultivation has not been significant of late. Bringing more land area under agriculture is becom- ing more and more difficult in most coun- tries. Since prosperous agriculture is con- sidered to be the most crucial base for economic development particularly in the less developed countries (LDCs), the only viable option for them is to continue to enhance the productivity of land and labour in agriculture. Increased productivity in agriculture has been achieved in several parts of the world mainly by modernizing agriculture. Modernization consists largely of using improved seeds, modern farm machinery such as tractors, harvesters, thresh- ers, etc., chemical fertilizers and pesticides in an optimal combination with water. The present study proposes to examine the role of modernization of agriculture in the over- all economic development of the LDCs. It addresses itself to the following specific questions: (a) What is the role of agriculture in the economic growth of LDCs? (b) What is the impact of moderniza tion of agriculture on the produc tivity growth? (c) What role can the governments in LDCs play to promote moderniza tion of agriculture? In the next section, we examine the first of the above-mentioned questions with the help of data for the period of 1965-87 on selected 43 developing countries. Since the next two questions require detailed investi- gation with a lot more statistical evidence to support the arguments, an indepth study of the Indian experience focussing on aspects is presented. The third section deals with brought to you by CORE View metadata, citation and similar papers at core.ac.uk provided by Research Papers in Economics

Welcome message from author
This document is posted to help you gain knowledge. Please leave a comment to let me know what you think about it! Share it to your friends and learn new things together.
Transcript
MODERNIZATION OF AGRICULTURE AND ECONOMIC DEVELOPMENT
The Indian Experience
Baku/ H. Dholakia and Ravendra H. Dholakia
(Indian Institute of Management, Ahmedabad, India)
Introduction
The world has witnessed spectacular in-creases in agricultural output during the twentieth century, particularly in its latter half. This achievement is mainly ascribed to the improved agricultural practices leading to higher productivity of land and labour. The contribution of extensive cultivation has not been significant of late. Bringing more land area under agriculture is becom-ing more and more difficult in most coun-tries. Since prosperous agriculture is con-sidered to be the most crucial base for economic development particularly in the less developed countries (LDCs), the only viable option for them is to continue to enhance the productivity of land and labour in agriculture. Increased productivity in agriculture has been achieved in several parts of the world mainly by modernizing agriculture. Modernization consists largely of using improved seeds, modern farm machinery such as tractors, harvesters, thresh-ers, etc., chemical fertilizers and pesticides in an optimal combination with water. The
present study proposes to examine the role of modernization of agriculture in the over-all economic development of the LDCs. It addresses itself to the following specific questions:
(a) What is the role of agriculture in the economic growth of LDCs?
(b) What is the impact of moderniza tion of agriculture on the produc tivity growth?
(c) What role can the governments in LDCs play to promote moderniza tion of agriculture?
In the next section, we examine the first of the above-mentioned questions with the help of data for the period of 1965-87 on selected 43 developing countries. Since the next two questions require detailed investi-gation with a lot more statistical evidence to support the arguments, an indepth study of the Indian experience focussing on aspects is presented. The third section deals with
brought to you by COREView metadata, citation and similar papers at core.ac.uk
provided by Research Papers in Economics
the process of modernization of Indian agri-culture in terms of a few acknowledged indicators like use of improved seeds, fertil-izers, etc. In the fourth section, detailed estimation of the contribution of factor inputs vis-a-vis total factor productivity growth in the Indian agriculture is attempted for different sub-periods carefully selected to delineate various phases of moderniza-tion of agriculture. The fifth section is, then, devoted to the discussion of the role of government in promoting modernization in Indian agriculture. Some lessons for the modernization of agriculture in LDCs from the Indian experience are drawn in the con-cluding section.
Role of Agriculture in Economic Growth of LDCs
Agriculture is a predominant activity in most developing countries. As economic growth and development take place, impor-tance of agriculture tends to decline accord-ing to the famous hypothesis. The declining share of agriculture is, however, a slow phenomenon and is felt only over a rela-tively long time horizon. The implication is that growth of total income exceeds that of agricultural income over a long time.
In an international cross-sectional perspec-tive, the role of agriculture in economic growth is generally examined by consider-ing the extent to which agricultural growth explains variations in the growth of total income among different countries. The growth of total income in a country is basically an average of the growth of in-come originating in agriculture, industry and service sectors. In order to estimate the
relative importance of these three broad sectors in explaining the variations in the growth of total income, the following multiple regression is run:
GY = ao+a,GA+^G,+a.,0,+U .... (1)
where G represents annual trend rate of growth; subscripts Y, A, I and S represent total GDP, GDP in agriculture, GDP in industry and GDP in services, respectively; U is a randon error term and a's are the parameters to be estimated.
» Equation (1) is estimated by using the cross section data on the trend rates of growth of GDP by sectors, available from the World Development Report 1989 for the selected developing countries (see Appendix 1). The regression is run for two time periods: (a) 1965-80 and (b) 1980-87. The choice of the year 1980 is again dictated by the ready availability of data on trend rates of growth by sectors. The results of the two regres-sions are:
(a) For the period 1965-80:
GT = -0.3787 + 0.5064GA + 0.2187G,+0.4160GS
t-values: (-1.869)(9.889) (8.973)(9.192) R-square = 0.9597; R-bar-square = 0.9566 F-statistic (3,39) = 309.597
(b) For the period 1980-87:
GY = 0.2456+0.1677GA
\i—u inm
+0.4687G,+0.2243GS
t-values: (1.085)(2.401) (10.136X3.365) R-square = 0.9070 R-bar-square = 0.8999 F-statistic (3,39)= 126.834.
The results of this exercise are quite inter-esting. Both the equations are statistically highly significant. They clearly show the importance of the growth of agricultural income in determining the variations in the growth of total GDP in developing coun-tries. The growth of incomes in all the three broad sectors are individually significant in both the periods in explaining the growth variation across countries. Agriculture, however, is the most dominating sector during the period 1965-80, whereas it is the industrial sector which dominates the scene during the eighties. The results of the two regression equations imply that the contri-bution of the growth of agricultural income to the growth of total income on the margin has fallen considerably from 44.4% during 1965-80 to 19.5% during 1980-87 (2). As against this, the marginal contribution of the growth of industrial income has gone up from 19.2% during 1965-80 to 54.5% during 1980-87. These trends, however, have to be interpreted in the context of the overall growth trends over the two sub-periods. Table I presents the summary trends in the overall and sectoral growth rates in the selected 43 LDCs.
It can be readily seen from Table I that out of 43 countries considered here, 35 coun-tries experienced a decline in their trend rates of growth over the two sub-periods.
Out of these 35 countries, 10 countries experienced increase in the growth of agri-cultural incomes, whereas only 5 and 2 countries experienced increased growth of income in industry and services, respec-tively. Thus, in the overall context of the retardation of the growth of GDP in the LDCs, industry and services seem to have contributed much more than agriculture. This is reflected in the declining marginal contribution of agriculture and increasing contribution of industry in our regressions.
Some Aspects of Modernization of Indian Agriculture
Since the inception of National Economic Planning in India in 1951, sustained efforts have been made by the planners to acceler-ate the pace of agricultural development in the economy. However, the main emphasis during the early stages of planning was on broadening the industrial base through rapid development of basic and capital goods industries. It was only in mid-Sixties, when the economy suffered a major setback due to two consecutive years of drought, that a shift in the development strategy focussing on rapid agricultural development became necessary. In fact, the impact of two con-secutive drought years (1965-66 amd 1966-67) was so severe that it almost nullified the effect of more than a decade of agricultural development and in its aftermath brought about a severe industrial recession. As a result, planners were forced to have a 'plan holiday' for a period of three years from 1966 to 1969. It was during this period that a new strategy of agricultural development focusing on modernization of agriculture
and improvement in farm productivity was launched. This strategy for modernization of agriculture, widely referred to as the 'Green Revolution', has been pursued vig-orously in Indian economy since 1967. The term 'Green Revolution' indicates a package for modernization of agriculture consisting of "large scale application of modern sci-ence and technology to agriculture'' involv-ing "extensive and intensive use of im-proved production technology and high yielding varieties of seeds" (CSSC, 1974). Stated briefly, the main components of the Green Revolution technology are the intro-duction of high yielding varieties of seeds for several major crops, creation and utili-zation of energized well irrigation and lift irrigation facilities, use of high doses of fertilizers and pesticides, and extensive use of farm machinery directed at improving farm productivity.
To examine some aspects of modernization of Indian agriculture, it would be useful to divide the post-Independence period into two sub-periods: (a) the period of planned economic development preceding Green Revolution (1950-51 to 1966-67); and (b) the period of Green Revolution from 1966-67 to 1988-89, the latest year for which the relevant data are available. Moreover, since there has been a significant acceleration in the overall rate of economic growth in Indian economy during the Eighties, we may further divide the period of Green Revolution into two sub-periods: 1966-67 to 1980-81 and 1980-81 to 1988-89. The basic data on the relevant aspects on Indian agriculture relating to the four benchmark years, viz., 1950-51,1966-67,1980-81 and 1988-89, are presented in Appendix 2, while
some indicators of extent of modernization in Indian agriculture derived from these data are presented in Table 2.
It is evident from the information given in Appendix 2 that the period of Green Revo-lution was marked by spectacular increases in the area under high yielding varieties (HYV), extent of fertilizer use and extent of irrigation. Thus, during the period 1966-67 and 1988-89, the area under HYV increased from less than two million ha. to more than 62 million ha., the extent of fertilizer use increased from around one million tonnes to 11 million tonnes, theextent of irrigation in-creased from less than 27 million ha. to around 60 million ha., the number of trac-tors increased from 54 thousand to 1,205 thousand and the extent of double cropping increased from 15% to 25% of net area sown. By 1988-89, more than one-third of the gross cropped area was covered by irrigation and use of HYV, while the aver-age dose of fertilizer had increases from less than 7 kg. per ha. in 1966-67 to more than 62 kg. per ha. Such large scale moderniza-tion of agriculture led to significant im-provements in the productivity of land as well as labour. Land productivity, which had increased at an average rate of only 0.8% per annum during the pre-Green Revo-lution period, increased at an average rate of 2.5% per annum during the subsequent period. Similarly, labour productivity, which had been more or less stagnant till 1966-67, increased at an average rate of 1.12% per annum during 1966-67 to 1988-89. The period of Green Revolution was also marked by a significant increase in capital invest-ment in agriculture, with the capital invest-ment per ha. increasing at an average rate of
1OOO
2.9% per annum during 1966-67 to 1988-89, as compared to the average growth rate of 1.7% observed during the earlier period.
Impact of Modernization on Productivity Growth
On the basis of an analysis of various indicators presented above, we can identify three distinct phases of development of Indian agriculture. Phase I consists of the period from 1950-51 to 1966-67, which was marked by a significant increase in the net area brought under cultivation through a sustained process of land reclamation and land improvements. This period was marked by only marginal improvements in labour and land productivity and a decline in capi-tal productivity. By the end of the Sixties, most of the existing potential for expansion of net area available for cultivation was already tapped and it was evident that the future growth of agriculture would have to depend more and more on non-land re-sources. The period from 1966-67 to 1980-81 represents Phase II of agricultural devel-opment, which was marked by widespread modernization of agriculture coupled with a significant increase in capital investment. In fact, during this period the gross capital formation as a proportion of gross domestic product in agriculture increased sharply to more than 9% from the average level of around 6% observed during the pre-Green Revolution period. The period after 1980-81 represents Phase III, which is marked by simultaneous and significant improvements in the productivity of land, labour and capital. During the Eighties, the average annual growth rate of land productivity has been 3.1%, of labour productivity 1.9%
and capital productivity around 1%. During this period there has been a significant im-provement in the utilization of the basic infrastructure and growth potential created during the earlier phase of modernization. Thus, for instance, it has been observed in the latest issue of Economic Survey (Gov-ernment of India, March 1990) that, in the years 1986-87 and 1987-88, the achieve-ment in the utilization of irrigation potential was more than the targetted level of utiliza-tion.
Having examined the impact of moderniza-tion of agriculture on partial factor produc-tivity, we may now examine its impact on total factor productivity. The growth of partial factor productivity (such as labour productivity or land productivity) indicates the combined effect of changes in factors of production and technical progress. To esti-mate the pure effect of technological change, it is necessary to eliminate the effect of changes in factors by constructing total factor input (TFI) as a weighted average of the three factors inputs, viz., land, labour and capital. The total factor productivity (TFP), which is generally used as a broad indicator of the extent of technical pro-gress, is then derived as the difference be-tween the NDP in agriculture and the TFI.
Our estimates of the growth rates of total factor input and total factor productivity in Indian agriculture are presented in Table 3, while the estimated break-up of the overall growth rate of agriculture in terms of the specific contributions made by various sources is given in Table 4. It is evident from Table 3 that there has been a marginal decline in the growth rate of labour input
and a significant decline in the growth rate of land input during the period 1966-67 to 1988-89. However, the growth of capital input shows a marked acceleration during the sub-period 1966-80 followed by a decel-eration during the Eighties. Recent studies by Patnaik (1987), Rath (1989) and Shetty (1990) have analyzed this phenomenon of deceleration in the growth of ag-ricultural investment during the Eighties. The main conclusion emerging from these studies is that private investment in agriculture is affected by public sector investment in agriculture and the growth of the latter has declined steadily during the Eighties.
The observed trends in the growth of indi-vidual factor inputs have resulted in a de-cline in growth of the aggregate supply of factor inputs to agriculture especially dur-ing the Eighties. The average growth rate of total factor input has declined from 1.55% during the pre-1966-67 period to 1.47% during the subsequent period and further to 1.20% in the period after 1980-81. As against this, the growth of NDP in agricul-ture has accelerated significantly during the post-Green Revolution period as compared to the earlier period. The average growth rate of net agricultural output (NDP) in-creased sharply from 1.72% during pre-1967 period to 2.36% during the subse-quent period and further to 3.27% during the Eighties. This phenomenon of a signifi-cant acceleration in the growth of agricul-tural production during the Eighties has been analyzed in a recent study of Mahen-dradev (1987) based on detailed state level data on the growth of food grains produc-tion. The general conclusion emerging from Mahendradev's study is that the Eighties
have witnessed a significant increase in the growth of food grains production in many states including the hitherto low growth states such as Rajasthan, Madhaya Pradesh and West Bengal, and that this acceleration in the growth of production could be attrib-uted to the spread of bio-chemical technol-ogy to these states during the first half of the Eighties. It may be mentioned here that this study covers the period up to 1984-85 and there has been a significant increase in the level of food grains production in almost all the states during the subsequent period (1984-85 to 1988-89).
Mahendradev's study has also examined the relationship between growth and instability of agriculture and its conclusion is that during the last two decades the degree of instability has declined significantly in both high growth states as well as low growth states, which indicates a negative rather than a positive relationship between growth rates and the degree of instability. Thus, the Indian experience of agricultural growth does not support the hypothesis of high rates of growth causing high instability. In fact, the ability of agriculture to withstand the adverse effects of successive run of poor monsoons for three years culminating in the severe drought of 1987-88, without experi-encing any major reduction in food grains production, clearly indicates that the Indian agriculture had acquired a remarkable de-gree of resilience during the Eighties. This has been achieved partly by the spread of modern technology and partly on account of the protective benefits of irrigation. A re-cent study by Dhawan (1987) shows that the output elasticity with respect to rainfall declines from 1.6 in low rainfall states and
1.0 in medium rainfall states without irriga-tion to the levels of 0.2 and 0.5, respec-tively, with irrigation. Thus, the accelera-tion in the growth of agricultural production brought about by the Green Revolution has actually reduced the degree of instability ex-perienced by Indian agriculture and thereby made it less dependent on the weather conditions.
Given the significant acceleration in the growth of net agricultural output and the simultaneous deceleration in the growth of total factor input, it is hardly surprising to observe that the post-Green Revolution pe-riod witnessed a phenomenal increase in the growth of total factor productivity in the agricultural sector. It is interesting to note that during the pre-Green Revolution period TFP was almost stagnant, its average growth rate being only 0.17%. As against this, the average annual growth rate of TFP increased to about 0.9% during the period 1966-67 to 1980-81, and it went up to 2.05% during the period 1980-81 to 1988-89. Thus, the modernization of Indian agri-culture during the period of Green Revolu-tion has succeeded in bringing about major technological transformation as indicated by the high and rising growth rate of TFP in the agricultural sector.
The contribution made by growth of TFP to the overall growth of Indian agriculture can be seen from the analysis of sources of growth presented in Table 4. During the pre-1967 period, more than 90% of the growth of agricultural NDP was contrib-uted by the growth of total factor input, while the growth of TFP accounted for less than 10%. This position has changed dra-
matically during the period 1966-67 to 1988-89 with growth of TFI accounting for 51% and growth of TFP accounting for 49% of the growth of net agricultural out-put. In fact, during the Eighties, growth of TFP has accounted for 63 % of the growth of net output, and, as a result, despite a decline in the growth of TFI, the overall growth of agricultural NDP has shown a significant increase.
It is interesting to examine the impact of ac-celerated growth of TFP in the agricultural sector on the growth of the economy in general and agricultural sector in particular. According to our estimates, if the growth of TFP in agriculture had occurred at the same rate during the post-1967 period as in the pre-1967 period, the level of real NDP in agriculture in the year 1988-89 would have been lower by about 122.3 billion rupees, which indicates adecline of 21.9% over the level actually achieved. The direct impact of the lower level of agricultural NDP on the overall NDP would have been to reduce its level in 1988-89 by 9.3%. This would have resulted in a decline in the growth rate of the economy as a whole from the observed level of 4.3% per annum to 3.9% per annum during the period 1966-67 to 1988-89. More specifically, the significant acceleration in the overall economic growth experienced by the Indian economy during the Eighties would have been considerably reduced if the total factor productivity in agriculture had not shown a remarkable acceleration during this period. If the growth of TFP in agricul-ture during the period 1980-81 to 1988-89 would have been at the same rate as during the pre-1967 period, the overall growth rate of the economy during this period would
have declined from the observed level of 5.5% per annum to 4.9% per annum. Thus, the acceleration in the TFP growth in agri-culture has made a significant contribution to the acceleration in the overall growth of the economy during the Eighties.
Role of Government in Modernization of Agriculture
Government intervention for the develop-ment of the agricultural sector is a common feature in most LDCs. In India, the govern-ment has played a major role in promoting agricultural development in general and its modernization in particular. Of the various aspects of government intervention in In-dian agriculture, the following two aspects deserve special mention: (a) direct interven-tion in the market mechanism through price support/procurement policy; and (b) sub-sidization of major agricultural inputs.
The Indian government follows adminis-tered price policy in respect of several agri-cultural commodities by fixing their pro-curement/support prices. The government announces the procurement or minimum support price for each season for each crop and also arranges for the corresponding pro-curement or price support operations through public, cooperative and other state-designated agencies. In fixing the agricul-tural prices, various factors such as the cost of agricultural inputs, trends in market prices, inter-crop price parity, etc. are taken into account. It is now well recognized that the government's price policy has played a crucial role in protecting the farmers from market uncertainties and it has also been instrumental in encouraging the adoption of
high yielding varieties which has contri-buted to the speeding up of the process of modernization.
Information on the trends in the minimum support/procurement prices of selected ag-ricultural commodities in India is provided in Table 5. It is evident that the minimum support prices announced by the govern-ment for various agricultural commodities have increased significantly during the period 1980-81 to 1988-89. It is interesting to observe that the government intervention in the form of administered prices has not been at the cost of economic efficiency. In a recent study, Gulati (1989) has shown that investment programmes aimed at increas-ing the production of wheat, rice and cotton had high economic rates of return during the Eighties.
The strategy of modernizing agriculture is likely to succeed only to the extent to which the individual farmers actually use modern agricultural inputs. In India the govern-ment, therefore, adopted the policy of providing a wide range of incentives to the farmers in the form of specific subsidies on modern agricultural inputs. Thus, the sub-sidies have been provided to the farmers to encourage the use of chemical fertilizers, irrigation facilities, electricity and also to avail credit facilities. Ashok Gulati (1989a) has estimated the magnitude of different types of subsidies enjoyed by the farmers during the period of the Eighties. Table 6 brings out the trends in input subsidies in Indian agriculture. It can be seen from this table that each of the four major types of input subsidies has increased significantly during the period 1980-81 to 1986-87.
Total input subsidies increased from the
level of 64.1 billion rupees in 1980-81 to 127.2 billion rupees in 1986-87. In relative terms, total input subsidies represent 15% of NDP in agriculture in 1980-81 and this proportion has risen to 17% by 1986-87. Thus, the rapid pace of modernization of Indian agriculture has been sustained to a considerable extent by a significant subsidi-zation of agricultural inputs.
Lessons from the Indian Experience
Based on the above analysis of the Indian ex-perience of modernizing agriculture, the following conclusions may be drawn:
1. Modernization of agriculture leads to an increase in the total factor productivity in agriculture.
2. Higher the pace of modernization, higher is the growth of TFP in ag riculture.
3. Acceleration in TFP more than compensates for the deceleration in factor inputs, especially land, and thereby leads to acceleration of the output of agriculture. Whether the emergence of a major thrust for modernization of Indian agriculture at a time when the expansion of net area sown almost petered off, was a mere coincidence or a likely se quence in the process of agricultural development that could recur in other LDCs is a question requiring indepth research.
4. The early stages of modernization requires significant stepping up of investment in agriculture. Gross capital formation as a proportion of net domestic product in agriculture has to rise considerably as this appears to be the precondition of modernization.
5. Modernization of agriculture leads to resilience of agriculture and makes it less sensitive to weather conditions and fluctuations in rainfall.
6. Since the success of modernization depends on the farmers switching over to modern inputs, the govern ment is required to intervene primarily in the form of ensuring remunerative prices of crops and providing direct incentives for the use of modern inputs.
At this stage, it is important to recognize • that modernization of agriculture has sig-nificant implications on the balance of payments (BOP) of the country. In as much as LDCs are unlikely to be self-sufficient in the production of fertilizers, pesticides and farm machinery, modernization of agricul-ture would necessarily have a high degree of import intensity which would put severe strain on the county's BOP. In the Indian case, however, adverse impact of moderni-zation of agriculture on BOP has been mitigated largely on account of the highly diversified industrial base thanks to the 15 years of planned development that pre-ceded the advent of the Green Revolution in
the country. In fact, Indian industry could (a) meet the growing demand of modern agri-cultural inputs to a large extent, especially after the mid-Seventies. Thus, the precondition for successful modernization of agriculture imposed by the BOP considerations is that the country should have either (i) a reasonably sound industrial base or (ii) readily available export market for its agricultural products. India meets the first of these conditions but not so much the second. But an LDC not having an industrial base but assured of export markets for its agricul-tural products can still overcome the BOP (b) problem in modernizing agriculture.
Another significant impact of moderniza-tion of agriculture on BOP is through the reduction of the import bill over time. The Indian modernization of agriculture has been of an import substituting nature, espe-cially during the frequently occurring drought years. The average import bill on food grains during the drought years in India has declined significantly since the mid-Sixties. This is the major advantage of moderniza-tion of agriculture. It brings food security and food self-sufficiency in the country, so that the scarce foreign exchange can be spared for more productive developmental needs of the economy.
The Indian experiment of modernizing agri-culture had the primary objective of step- (c) ping up the growth of agricultural production and of making the country self-reliant in food grains. To a large extent this objective is achieved. However, some of the other effects of the Green Revolution that should be considered are:
Employment effect of the new technology is positive on the balance (Chadha & Khurana, 1989; Basant, 1987). Studies in this field have shown that the structure of employment tends to shift in favour of hired labour and against the family labour. Similarly, the seasonal fluctuation in the farm employment also tends to decline with modernization of agriculture. (Basant, 1987).
The spread of new farm technology is always uneven in terms of regions and crops leading to im-balances in the initial period (Mruthyunjaya and Kumar, (1989). The Indian experience shows that the initial breakthrough in the technology is limited to one or two crops and one or two regions. The causes for this could be in terms of (i) location of infrastructure, (ii) farmers' attitudes f depending inter alia on socio-cultural environment and (iii) weather-related factors. If these problems are tackled carefully and systematically in the short run, the goals of balance could then be achieved in the long run.
The Green Revolution in India has a serious effect on the inequalities in the distribution of income, land and assets in the rural area. Where-as Dhanagare (1987) and SatyaPaul (1989) argue that the new agricul-tural technology has adverse effects
-
on land distribution and income disparity among farm families, Chadha and Khurana (1989) find empirical support to "dispel the belief that gains of rapid economic growth in general and agricultural transformation in particular, wher-ever achieved, have not perco-lated to the poor." They found that fast and sustained growth led to percolation of the gains to the poor in the case of Punjab. However, in the case of slow and unsteady growth, as in Bihar, such gains by-passed the poor. Thus, the inequality and poverty alleviating effects of the agricultural moderni-zation seem to be related to the intensity of the process.
REFERENCES
1. Basant Rakesh (1987): "Agricul tural Technology and Employment in India: A Survey of Recent Research," Economic and Political Weekly, Vol.22, No.32, August 8.
2. Bhalla, G.S. and Tyagi, D.S. (1989): "Patterns in Indian Agri cultural Development: A District Level Study," New Delhi: Institute for Studies in Industrial Develop ment.
3. Chadha, O.K. and Khurana, M.R. (1989): "Backward Agriculture, Unrewarded Labour and Economic Depreviation: Bihar's Contrast
with Punjab," Economic and Political Weekly, Vol.24, No.47, November 25.
CSSC (1974): "Green Revolution: The Unfinished Task," Calcutta: Minerva Associates.
Dhanagare, D.N. (1987): "Green Revolution and Social Inequalities in Rural India," Economic and Political Weekly, Vol. 22, Nos.19-21, Annual Number, May.
Dhawan, B.D. (1987): "How Stable is India Irrigated Agricul-ture?" Economic and Political Weekly, Vol.22, No.39, September 26.
Gulati, Ashok (1989): "Structure of Effective Incentives in Indian Ag-riculture: Some Policy Implica-ations," Economic and Political Weekly, Vol.24, No. 39, Septem-ber 30.
_______________ (1989a): "Input Subsidies in Indian Agriculture: A State-wise Analysis," Economic and Political Weekly, Vol.24, No.25, June 24.
Mahendradev, S. (1987): "Growth and Instability in Food Grains Production: An Inter-State Analysis," Economic and Political Weekly, Vol.22, No.39, September 26.
Marrh 1QQ7 FARM * RTISTNF.SS
10. Mruthyunjaya and Kumar, P. (1989): "Crop Economics and Cropping Pattern Changes," Economic and Political Weekly, Vol.24, Nos.51-52, December 23-30.
11. Patnaik, Prabhat (1987): "Recent Growth Experience of the Indian Economy: Some Comments," Economic and Political Weekly, Annual Number, Vol.22, Nos. 19-21, May.
12. Rath, Nilakantha (1989): "Agri cultural Growth and Investment in India," Journal of Indian
School of Political Economy, Political Economy, Vol.1, No.l, January-June.
13. Satya, Paul (1989): "Green Revo-lution and Income Distribution Among Farm Families in Haruama. 1969-70 tp 1982-83," Economic and Political Weekly, Vol.24, Nos. 51-52, December 23-30.
14 Shetty, S.L. (1990): "Investment in Agriculture - Brief Review of Recent Trends," Economic and Political Weekly, Vol.25, Nos. 7 & 8, February 17-24.
CAD1U Jt, UTTSTWBSS 10 March 1992
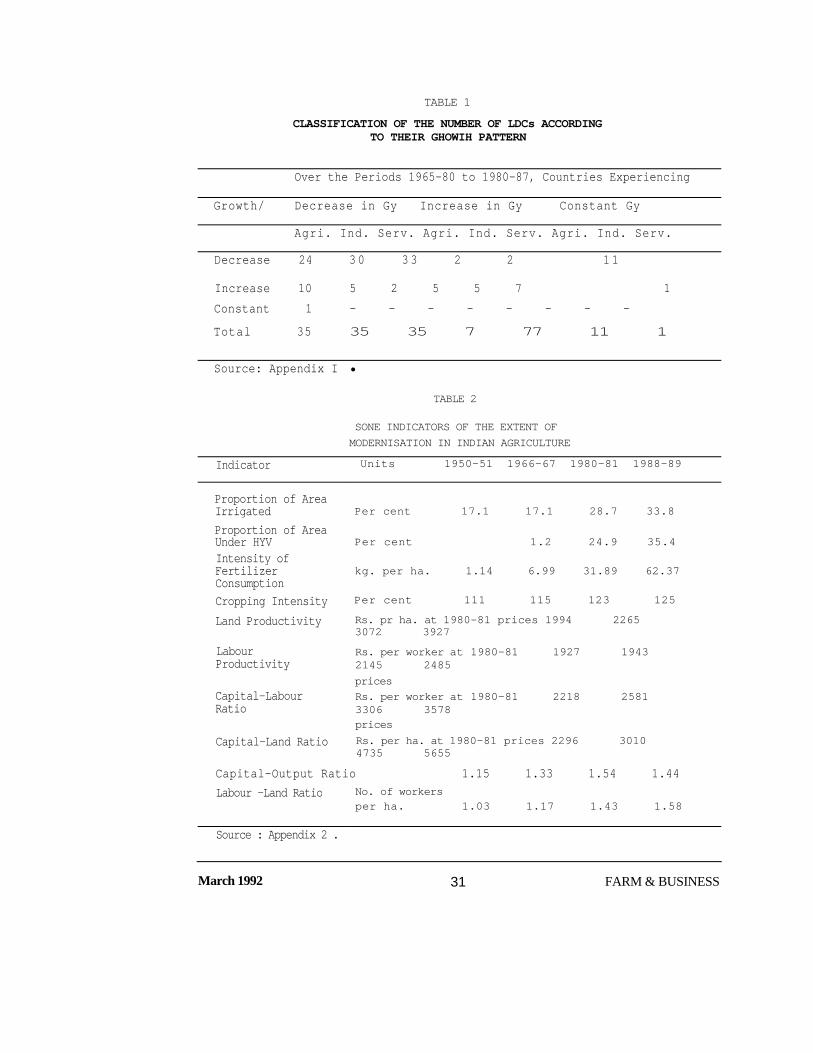
TABLE 1
CLASSIFICATION OF THE NUMBER OF LDCs ACCORDING TO THEIR GHOWIH PATTERN
Over the Periods 1965-80 to 1980-87, Countries Experiencing
Growth/ Decrease in Gy Increase in Gy Constant Gy
Agri. Ind. Serv. Agri. Ind. Serv. Agri. Ind. Serv.
Decrease 24 3 0 3 3 2 2 1 1
Increase 10 5 2 5 5 7 1 Constant 1 - - - - - - - -
Total 35 35 35 7 77 11 1
Source: Appendix I •
TABLE 2
SONE INDICATORS OF THE EXTENT OF MODERNISATION IN INDIAN AGRICULTURE
Indicator Units 1950-51 1966-67 1980-81 1988-89
Proportion of Area Irrigated Per cent 17.1 17.1 28.7 33.8 Proportion of Area Under HYV Per cent 1.2 24.9 35.4 Intensity of Fertilizer Consumption
kg. per ha. 1.14 6.99 31.89 62.37
Cropping Intensity Per cent 111 115 123 125 Land Productivity Rs. pr ha. at 1980-81 prices 1994 2265
3072 3927 Labour Productivity
Rs. per worker at 1980-81 1927 1943 2145 2485
prices Capital-Labour Ratio
Rs. per worker at 1980-81 2218 2581 3306 3578
prices Capital-Land Ratio Rs. per ha. at 1980-81 prices 2296 3010
4735 5655 Capital-Output Ratio 1.15 1.33 1.54 1.44 Labour -Land Ratio No. of workers
per ha. 1.03 1.17 1.43 1.58
Source : Appendix 2 .
March 1992 31 FARM & BUSINESS
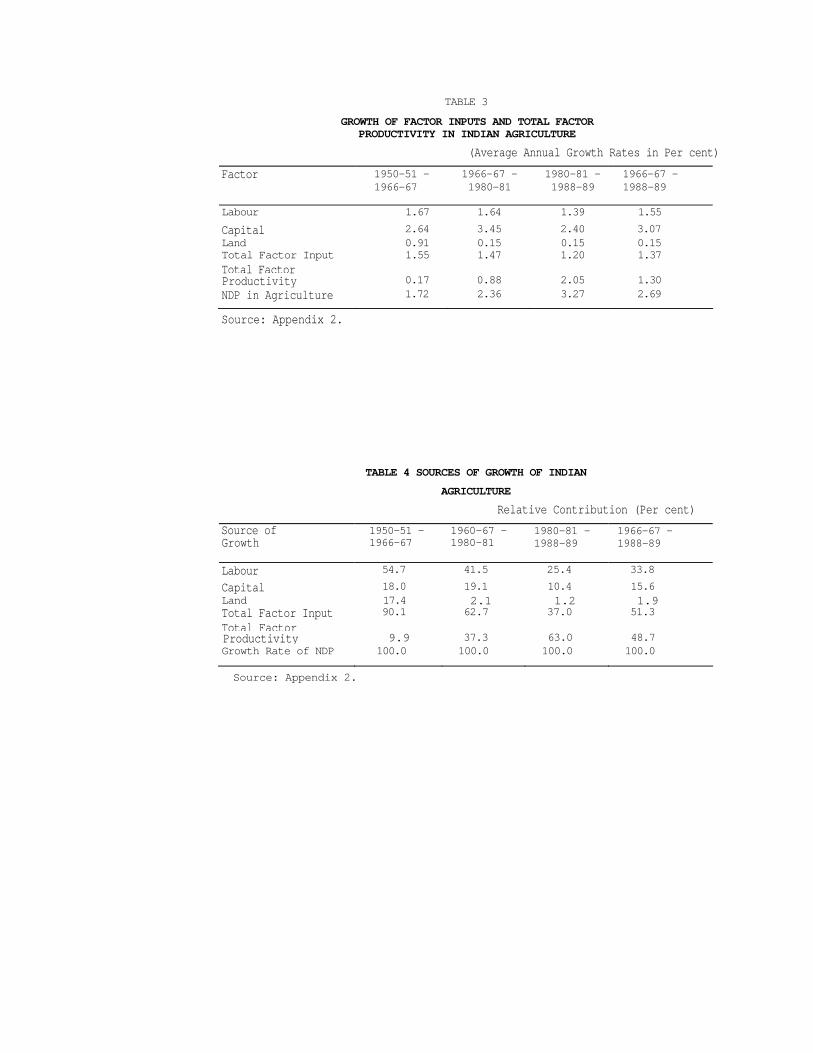
TABLE 3 GROWTH OF FACTOR INPUTS AND TOTAL FACTOR
PRODUCTIVITY IN INDIAN AGRICULTURE (Average Annual Growth Rates in Per cent)
Factor 1950-51 -1966-67
1966-67 -1980-81
1980-81 -1988-89
1966-67 -1988-89
Labour 1.67 1.64 1.39 1.55 Capital 2.64 3.45 2.40 3.07 Land 0.91 0.15 0.15 0.15Total Factor Input 1.55 1.47 1.20 1.37 Total Factor Productivity 0.17 0.88 2.05 1.30 NDP in Agriculture 1.72 2.36 3.27 2.69
Source: Appendix 2.
TABLE 4 SOURCES OF GROWTH OF INDIAN
AGRICULTURE Relative Contribution (Per cent)
Source of Growth
1950-51 -1966-67
1960-67 -1980-81
1980-81 -1988-89
1966-67 -1988-89
Labour 54.7 41.5 25.4 33.8 Capital 18.0 19.1 10.4 15.6 Land 17.4 2.1 1.2 1.9Total Factor Input 90.1 62.7 37.0 51.3 Total FactorProductivity 9.9 37.3 63.0 48.7 Growth Rate of NDP 100.0 100.0 100.0 100.0
Source: Appendix 2.
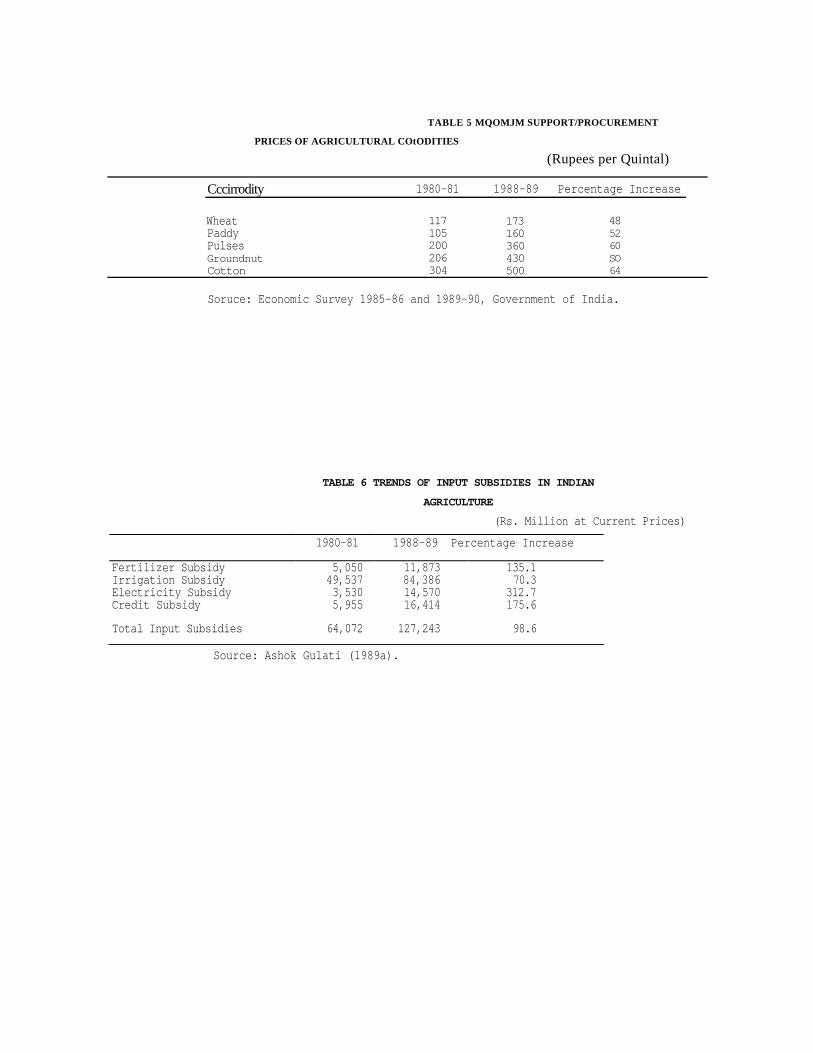
TABLE 5 MQOMJM SUPPORT/PROCUREMENT
PRICES OF AGRICULTURAL COtODITIES (Rupees per Quintal)
Cccirrodity 1980-81 1988-89 Percentage Increase
Wheat Paddy Pulses Groundnut Cotton
117 105 200 206 304
173 160 360 430 500
48 52 60 SO 64
Soruce: Economic Survey 1985-86 and 1989-90, Government of India.
TABLE 6 TRENDS OF INPUT SUBSIDIES IN INDIAN
AGRICULTURE (Rs. Million at Current Prices)
1980-81 1988-89 Percentage Increase
Fertilizer Subsidy Irrigation Subsidy Electricity Subsidy Credit Subsidy
5,050 49,537 3,530 5,955
11,873 84,386 14,570 16,414
135.1 70.3
312.7 175.6
Total Input Subsidies 64,072 127,243 98.6
Source: Ashok Gulati (1989a).
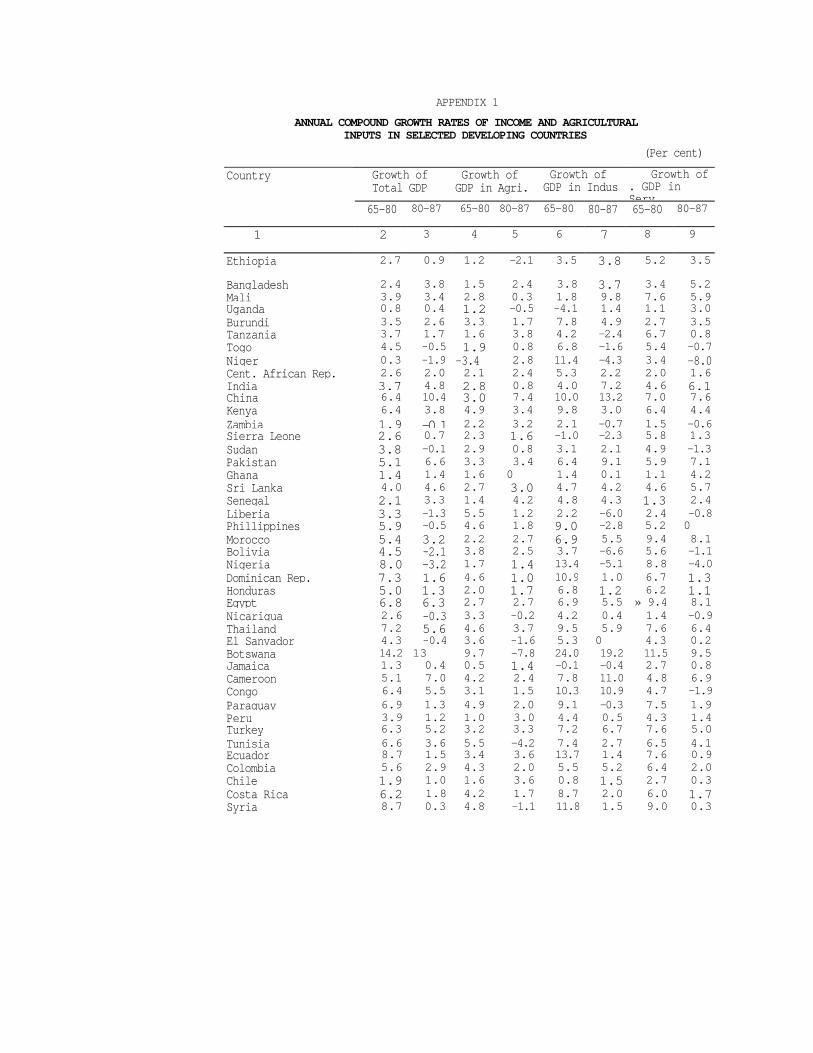
APPENDIX 1 ANNUAL COMPOUND GROWTH RATES OF INCOME AND AGRICULTURAL
INPUTS IN SELECTED DEVELOPING COUNTRIES (Per cent)
Growth of Total GDP
Growth of GDP in Agri.
Growth of GDP in Indus
Growth of . GDP in Serv
Country
65-80 80-87 65-80 80-87 65-80 80-87 65-80 80-87
1 2 3 4 5 6 7 8 9
Ethiopia 2.7 0.9 1.2 -2.1 3.5 3.8 5.2 3.5
Bangladesh 2.4 3.8 1.5 2.4 3.8 3.7 3.4 5.2Mali 3.9 3.4 2.8 0.3 1.8 9.8 7.6 5.9Uganda 0.8 0.4 1.2 -0.5 -4.1 1.4 1.1 3.0Burundi 3.5 2.6 3.3 1.7 7.8 4.9 2.7 3.5Tanzania 3.7 1.7 1.6 3.8 4.2 -2.4 6.7 0.8Togo 4.5 -0.5 1.9 0.8 6.8 -1.6 5.4 -0.7Niger 0.3 -1.9 -3.4 2.8 11.4 -4.3 3.4 -8.0Cent. African Rep. 2.6 2.0 2.1 2.4 5.3 2.2 2.0 1.6India 3.7 4.8 2.8 0.8 4.0 7.2 4.6 6.1China 6.4 10.4 3.0 7.4 10.0 13.2 7.0 7.6Kenya 6.4 3.8 4.9 3.4 9.8 3.0 6.4 4.4Zambia 1.9 -0.1 2.2 3.2 2.1 -0.7 1.5 -0.6Sierra Leone 2.6 0.7 2.3 1.6 -1.0 -2.3 5.8 1.3Sudan 3.8 -0.1 2.9 0.8 3.1 2.1 4.9 -1.3Pakistan 5.1 6.6 3.3 3.4 6.4 9.1 5.9 7.1Ghana 1.4 1.4 1.6 0 1.4 0.1 1.1 4.2Sri Lanka 4.0 4.6 2.7 3.0 4.7 4.2 4.6 5.7Senegal 2.1 3.3 1.4 4.2 4.8 4.3 1.3 2.4Liberia 3.3 -1.3 5.5 1.2 2.2 -6.0 2.4 -0.8Phillippines 5.9 -0.5 4.6 1.8 9.0 -2.8 5.2 0Morocco 5.4 3.2 2.2 2.7 6.9 5.5 9.4 8.1Bolivia 4.5 -2.1 3.8 2.5 3.7 -6.6 5.6 -1.1Nigeria 8.0 -3.2 1.7 1.4 13.4 -5.1 8.8 -4.0Dominican Rep. 7.3 1.6 4.6 1.0 10.9 1.0 6.7 1.3Honduras 5.0 1.3 2.0 1.7 6.8 1.2 6.2 1.1Egypt 6.8 6.3 2.7 2.7 6.9 5.5 » 9.4 8.1Nicarigua 2.6 -0.3 3.3 -0.2 4.2 0.4 1.4 -0.9Thailand 7.2 5.6 4.6 3.7 9.5 5.9 7.6 6.4El Sanvador 4.3 -0.4 3.6 -1.6 5.3 0 4.3 0.2Botswana 14.2 13 9.7 -7.8 24.0 19.2 11.5 9.5Jamaica 1.3 0.4 0.5 1.4 -0.1 -0.4 2.7 0.8Cameroon 5.1 7.0 4.2 2.4 7.8 11.0 4.8 6.9Congo 6.4 5.5 3.1 1.5 10.3 10.9 4.7 -1.9Paraguay 6.9 1.3 4.9 2.0 9.1 -0.3 7.5 1.9Peru 3.9 1.2 1.0 3.0 4.4 0.5 4.3 1.4Turkey 6.3 5.2 3.2 3.3 7.2 6.7 7.6 5.0Tunisia 6.6 3.6 5.5 -4.2 7.4 2.7 6.5 4.1Ecuador 8.7 1.5 3.4 3.6 13.7 1.4 7.6 0.9Colombia 5.6 2.9 4.3 2.0 5.5 5.2 6.4 2.0Chile 1.9 1.0 1.6 3.6 0.8 1.5 2.7 0.3Costa Rica 6.2 1.8 4.2 1.7 8.7 2.0 6.0 1.7Syria 8.7 0.3 4.8 -1.1 11.8 1.5 9.0 0.3
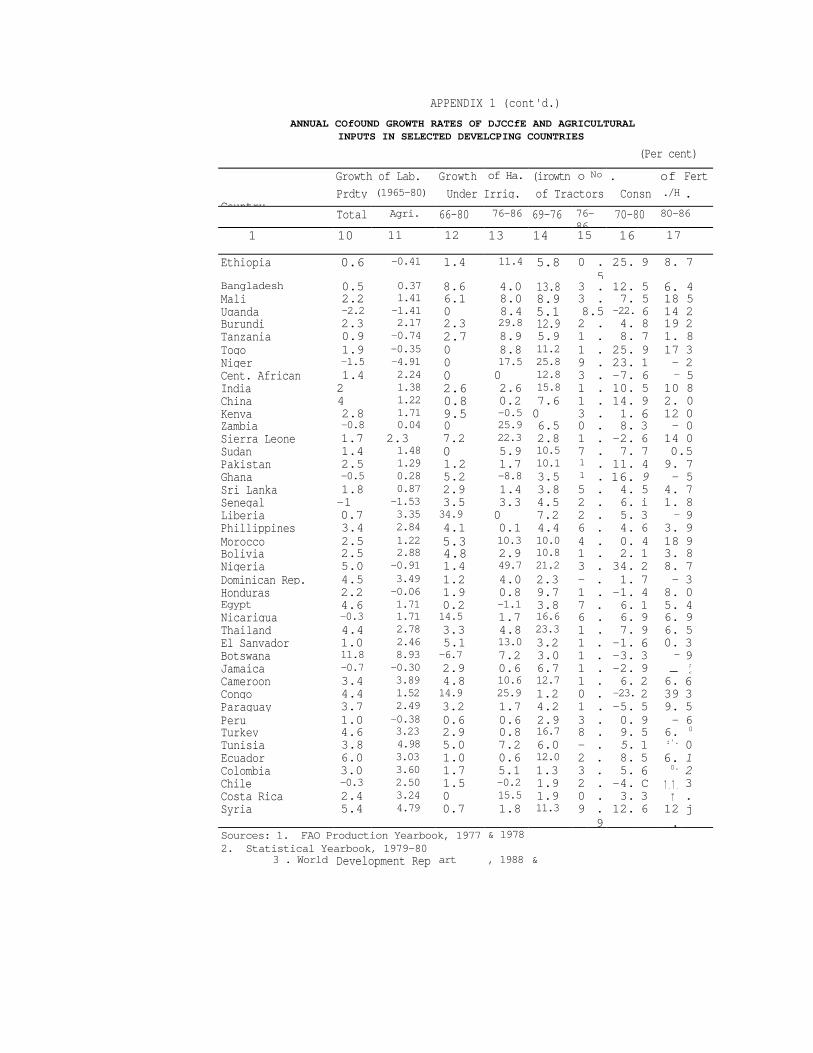
APPENDIX 1 (cont'd.) ANNUAL COfOUND GROWTH RATES OF DJCCfE AND AGRICULTURAL
INPUTS IN SELECTED DEVELCPING COUNTRIES (Per cent)
Growth of Lab. Growth of Ha. (irowtn of
No . of Fert Prdty (1965-80) Under Irrig. of Tractors Consn ./H .Country Total Agri. 66-80 76-86 69-76 76-
8670-80 80-86
1 10 11 12 13 14 15 16 17
Ethiopia 0.6 -0.41 1.4 11.4 5.8 0 .5
25. 9 8. 7
Bangladesh 0.5 0.37 8.6 4.0 13.8 3 . 12. 5 6. 4Mali 2.2 1.41 6.1 8.0 8.9 3 . 7. 5 18 5Uganda -2.2 -1.41 0 8.4 5.1 8.5 -22. 6 14 2Burundi 2.3 2.17 2.3 29.8 12.9 2 . 4. 8 19 2Tanzania 0.9 -0.74 2.7 8.9 5.9 1 . 8. 7 1. 8Togo 1.9 -0.35 0 8.8 11.2 1 . 25. 9 17 3Niger -1.5 -4.91 0 17.5 25.8 9 . 23. 1 - 2Cent. African 1.4 2.24 0 0 12.8 3 . -7. 6 - 5India 2 1.38 2.6 2.6 15.8 1 . 10. 5 10 8China 4 1.22 0.8 0.2 7.6 1 . 14. 9 2. 0Kenya 2.8 1.71 9.5 -0.5 0 3 . 1. 6 12 0Zambia -0.8 0.04 0 25.9 6.5 0 . 8. 3 - 0Sierra Leone 1.7 2.3 7.2 22.3 2.8 1 . -2. 6 14 0Sudan 1.4 1.48 0 5.9 10.5 7 . 7. 7 0.5Pakistan 2.5 1.29 1.2 1.7 10.1 1 . 11. 4 9. 7Ghana -0.5 0.28 5.2 -8.8 3.5 1 . 16. 9 - 5Sri Lanka 1.8 0.87 2.9 1.4 3.8 5 . 4. 5 4. 7Senegal -1 -1.53 3.5 3.3 4.5 2 . 6. i 1. 8Liberia 0.7 3.35 34.9 0 7.2 2 . 5. 3 - 9Phillippines 3.4 2.84 4.1 0.1 4.4 6 . 4. 6 3. 9Morocco 2.5 1.22 5.3 10.3 10.0 4 . 0. 4 18 9Bolivia 2.5 2.88 4.8 2.9 10.8 1 . 2. 1 3. 8Nigeria 5.0 -0.91 1.4 49.7 21.2 3 . 34. 2 8. 7Dominican Rep. 4.5 3.49 1.2 4.0 2.3 - . 1. 7 - 3Honduras 2.2 -0.06 1.9 0.8 9.7 1 . -1. 4 8. 0Egypt 4.6 1.71 0.2 -1.1 3.8 7 . 6. 1 5. 4Nicarigua -0.3 1.71 14.5 1.7 16.6 6 . 6. 9 6. 9Thailand 4.4 2.78 3.3 4.8 23.3 1 . 7. 9 6. 5El Sanvador 1.0 2.46 5.1 13.0 3.2 1 . -1. 6 0. 3Botswana 11.8 8.93 -6.7 7.2 3.0 1 . -3. 3 - 9Jamaica -0.7 -0.30 2.9 0.6 6.7 1 . -2. 9 - ;
<
Cameroon 3.4 3.89 4.8 10.6 12.7 1 . 6. 2 6. 6Congo 4.4 1.52 14.9 25.9 1.2 0 . -23. 2 39 3Paraguay 3.7 2.49 3.2 1.7 4.2 1 . -5. 5 9. 5Peru 1.0 -0.38 0.6 0.6 2.9 3 . 0. 9 - 6Turkey 4.6 3.23 2.9 0.8 16.7 8 . 9. 5 6. 0 Tunisia 3.8 4.98 5.0 7.2 6.0 - . 5. 1 :'. 0Ecuador 6.0 3.03 1.0 0.6 12.0 2 . 8. 5 6. 1Colombia 3.0 3.60 1.7 5.1 1.3 3 . 5. 6 0. 2Chile -0.3 2.50 1.5 -0.2 1.9 2 . -4. C 1.1. 3Costa Rica 2.4 3.24 0 15.5 1.9 0 . 3. 3 I . .Syria 5.4 4.79 0.7 1.8 11.3 9 .
9 12. 6 12
.j
Sources: 1. FAO Production Yearbook, 1977 2. Statistical Yearbook, 1979-80
& 1978
3 . World Development Rep art , 1988 &
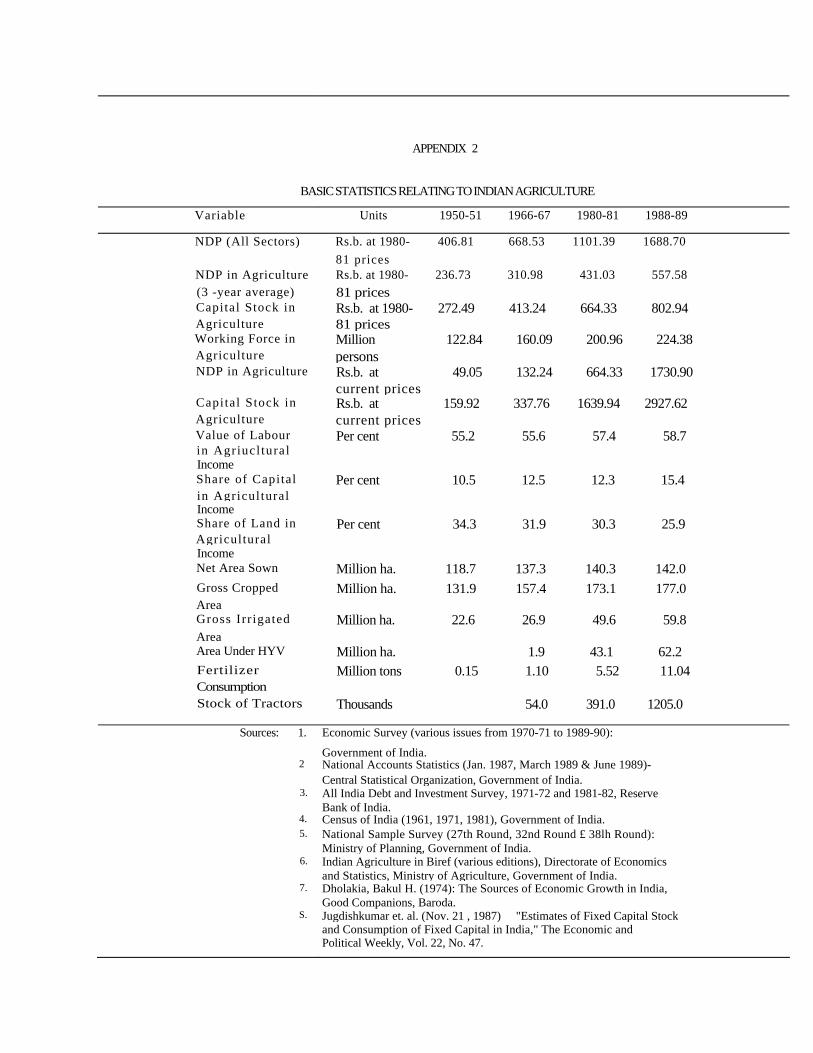
APPENDIX 2
BASIC STATISTICS RELATING TO INDIAN AGRICULTURE
Variable Units 1950-51 1966-67 1980-81 1988-89
NDP (All Sectors) Rs.b. at 1980- 406.81 668.53 1101.39 1688.70 81 prices
NDP in Agriculture Rs.b. at 1980- 236.73 310.98 431.03 557.58 (3 -year average) 81 prices Capital Stock in Rs.b. at 1980- 272.49 413.24 664.33 802.94 Agriculture 81 pricesWorking Force in Million 122.84 160.09 200.96 224.38 Agriculture personsNDP in Agriculture Rs.b. at 49.05 132.24 664.33 1730.90
current pricesCapital Stock in Rs.b. at 159.92 337.76 1639.94 2927.62 Agriculture current prices Value of Labour Per cent 55.2 55.6 57.4 58.7in Agriucl tural Income Share of Capital Per cent 10.5 12.5 12.3 15.4 in Agricultural Income Share of Land in Per cent 34.3 31.9 30.3 25.9 Agricultural Income Net Area Sown Million ha. 118.7 137.3 140.3 142.0 Gross Cropped Million ha. 131.9 157.4 173.1 177.0 Area Gross Irr igated Million ha. 22.6 26.9 49.6 59.8 Area Area Under HYV Million ha. 1.9 43.1 62.2 Fertilizer Million tons 0.15 1.10 5.52 11.04 Consumption Stock of Tractors Thousands 54.0 391.0 1205.0
Sources: 1. Economic Survey (various issues from 1970-71 to 1989-90): Government of India.
2 National Accounts Statistics (Jan. 1987, March 1989 & June 1989)- Central Statistical Organization, Government of India.
3. All India Debt and Investment Survey, 1971-72 and 1981-82, Reserve Bank of India.
4. Census of India (1961, 1971, 1981), Government of India. 5. National Sample Survey (27th Round, 32nd Round £ 38lh Round):
Ministry of Planning, Government of India.6. Indian Agriculture in Biref (various editions), Directorate of Economics
and Statistics, Ministry of Agriculture, Government of India. 7. Dholakia, Bakul H. (1974): The Sources of Economic Growth in India,
Good Companions, Baroda.S. Jugdishkumar et. al. (Nov. 21 , 1987) "Estimates of Fixed Capital Stock
and Consumption of Fixed Capital in India," The Economic and Political Weekly, Vol. 22, No. 47.
Related Documents