PERSPECTIVES ON MODERN ECONOMY Edited by AIZHAN KHOICH ALİ EREN ALPER AHMET ARİF EREN

Welcome message from author
This document is posted to help you gain knowledge. Please leave a comment to let me know what you think about it! Share it to your friends and learn new things together.
Transcript

PERSPECTIVES ON
MODERN ECONOMY
Edited byAIZHAN KHOICHALİ EREN ALPERAHMET ARİF EREN
PERS
PECT
IVES
ON
MODE
RN E
CONO
MY
Edited by
Aizhan Khoich
Ali Eren Alper
Ahme
t Arif Eren

PERSPECTIVES ON MODERN ECONOMY
Edited ByAizhan KhoichAli Eren AlperAhmet Arif Eren

PERSPECTIVES ON MODERN ECONOMY Edited by: Aizhan Khoich, Ali Eren Alper, Ahmet Arif Eren
IJOPECLondon ijopec.co.uk IstanbulPUBLICATION
IJOPEC Publication Limited60 Westmeade Close Cheshunt, Waltham Cross HertfordshireEN7 6JR London
www.ijopec.co.ukE-Mail: [email protected]: (+44) 73 875 2361 (UK)(+90) 488 217 4007 (Turkey)
Perspectives on Modern Economy First Edition, September 2020IJOPEC Publication No: 2020/11
ISBN: 978-1-913809-02-7
No part of this book may be reproduced, stored in a retrieval system, transmitted in any form or by any means electronically without author’s permission. No responsibility is accepted for the accuracy of information contained in the text, illustrations or advertisements. The opinions expressed in these chapters are not necessarily those of the editors or publisher.
A catalogue record for this book is available from Nielsen Book Data, British Library and Google Books. The publishing responsibilities of the chapters in this book belong to the authors.
Printed in London.
Composer & Cover DesignIJOPEC Publication
Cover photo credit by Ahmet Arif Eren

3
CONTENTS
SECTION I LABOUR MARKET
1. UNEMPLOYMENT: THEORETICAL EXPLANATIONS ..................................9Gürçem ÖZAYTÜRK
2. ESTIMATION OF THE NAIRU WITHIN THE FRAMEWORK OF THE BRICS COUNTRIES AND TURKEY ............................................................27Ayberk Nuri BERKMAN
3. THE RELATIONSHIP BETWEEN ECONOMIC COMPLEXITY AND UNEMPLOYMENT RATE ......................................................................................43İbrahim OZAYTURK
4. LABOR MARKET REGULATIONS AND UNEMPLOYMENT ......................61Özlem ÖZTÜRK ÇETENAK
5. THE DYNAMIC EFFECT OF GLOBALIZATION ON UNEMPLOYMENT RATES IN DEVELOPING COUNTRIES ...........................81Faruk MİKE
SECTION II EXCHANGE RATE
6. GLOBAL COMPETITION AND EXCHANGE RATE DETERMINATION .. 101Yelda Bugay TEKGÜL
7. LOGISTICS-TRADE PERFORMANCE NEXUS: EVIDENCE FROM A LARGE SAMPLE OF COUNTRIES ..................................................................117Özge DEMİRAL, Mehmet DEMİRAL
8. ESTIMATION OF RELATIONSHIP BETWEEN INFLATION, FOREIGN EXCHANGE RATES AND OIL PRICES IN TURKEY .....................135Bige Küçükefe
9. REVISITING EXCHANGE RATE DYNAMICS FOR TURKEY.....................147Bilgin BARİ
10. THE FUTURE OF MONETARY UNION IN THE EUROPEAN UNION ... 167Hasan Memiş, Hülya Derya

4
CONTENTS
11. INTERNATIONAL OUTSOURCING AND THE CHARACTERISTICS OF FIRMS: EVIDENCE FROM THE TURKISH MANUFACTURING FIRMS ....... 181Almıla BURGAÇ ÇİL
SECTION III ECONOMIC POLICY
12. IS COVID-19 THE NEW BLACK SWAN OF THE FINANCIAL MARKETS? ON THE LINKAGE BETWEEN COVID-19 AND STOCK MARKETS ............. 201Fatma MUMCU KÜÇÜKÇAYLI, Gönül YÜCE AKINCI
13. THE EFFECT OF ECONOMIC POLICY UNCERTAINTY ON PORTFOLIO INVESTMENT ASSETS AND LIABILITIES ...............................215Sevilay KUCUKSAKARYA
14. FINANCIAL LITERACY AND DIGITAL COMPETENCE COULD PREDICT FINANCIAL RISK TOLERANCE: A RESEARCH STUDY IN TURKEY .....................................................................225Çağrı HAMURCU
15. THE PLACE AND FUTURE OF ISLAMIC BANKING IN THE GERMAN BANKING SYSTEM ...................................................................241Hatice Elanur Kaplan
16. THE ROLE OF IFRS AND AUDITING IN CORPORATE GOVERNANCE ............................................................................257Mehmet Nuri SALUR
SECTION IV MARKETING AND CONSUMER THEORY
17. REGIONAL DYNAMICS OF PARTNER VIOLENCE AGAINST WOMEN IN TURKEY: AN ECONOMIC PERSPECTIVE ................................277Hakan ULUCAN
18. THE ROLE OF CONSUMER PERCEPTIONS OF SOCIAL RESPONSIBILITY PROJECTS ON CONSUMER-BASED BRAND EQUITY: AN EXAMPLE OF A LARGE-SCALE COMPANY ..............................297Murat Çakırkaya
19. POLITICAL MARKETING PROCESS AND USE OF SOCIAL MEDIA .....315Sevilay USLU DİVANOĞLU, Resul ÇELİK
20. EFFECTS OF THE CHANGE IN EXCHANGE RATES AND INTEREST RATES ON NON-PERFORMING LOANS: THE CASE OF TURKEY .............333Mustafa UYSAL

PERSPECTIVES ON MODERN ECONOMY
Aizhan KHOICH, Ali Eren ALPER, Ahmet Arif EREN
5
21. THE INDEPENDENT DUMMY VARIABLE MODELS DEALING WITH CHANGES IN PARAMETERS OF A CONSUMPTION FUNCTION ........................................................................347Zeynep OZTURK
22. COVID-19 AND ITS REFLECTION TO CONSUMER BEHAVIOR .........365Sevilay USLU DİVANOĞLU, Resul ÇELİK
SECTION V PUBLIC FINANCE
23. GOVERNMENT REVENUES AND EXPENDITURES NEXUS: NEW EVIDENCE FROM GIIPS COUNTRIES ..................................................383Fatih AKÇAY, Sevinç YARAŞIR TÜLÜMCE
24. FORCE MAJEURE AND ITS EFFECTS IN LINE WITH JUDICAL DECISIONS ..............................................................................401Lecturer Gazi SONKUR
25. FOREIGN DEBTS AND AIDS: A THEORETICAL RESEARCH IN TERMS OF REASONS AND TYPES .........................................413Hasan TÜRKAL
26. AN ANALYSIS OF SOCIAL INTERACTION AND SOCIAL MULTIPLIER: JUSTICE SERVICES IN TURKEY ...............................431Sevilay Ece GÜMÜŞ ÖZUYAR
SECTION VI ECONOMICS OF ENERGY AND HEALTH
27. TESTING THE POLLUTION HAVEN HYPOTHESIS FOR DEVELOPING COUNTRIES: ECOLOGICAL FOOTPRINT APPROACH ....453Ali Eren ALPER, F. Özlem ALPER
ENERGY CONSUMPTION, CO2 EMISSIONS, AND GDP IN TURKEY .......... 471Nilüfer KAYA KANLI
SECTION VII HISTORY OF ECONOMIC THOUGHT
29. NURSE TURNOVER AND ITS COSTS ........................................................487Sibel Meler, Şükrü Anıl Toygar
30. EFFECT OF NURSES’ USE OF TECHNOLOGY ON HOSPITAL COSTS ...............................................................................................505Fadime Ulupınar, Şükrü Anıl Toygar

6
31. DOES 19TH-CENTURY FRANCE EXPLAIN LÉON WALRAS? ...................521Hüsnü Bilir, Vural Başaran
32. SOCIAL CAPITAL APPROACH IN INSTITUTIONAL ECONOMICS .....541Zehra Doğan Çalışkan
33. CHAYANOV’S AGRICULTURAL PRODUCTION MODEL: AN OVERVIEW ......................................................................................................549Cumali Bozpinar
34. ÖMER LÜTFI BARKAN IN TURKISH HISTORY OF ECONOMICS: HIS PHILOSOPHY AND METHODOLOGY .....................................................559Aslıhan Nakiboğlu, Sevgül Işık
CONTENTS

SECTION ILABOUR MARKET


9
1UNEMPLOYMENT: THEORETICAL EXPLANATIONSGürçem ÖZAYTÜRK1
Introduction
The theory of economics concentrates on capitalism in terms of both its subject and its historical development. The leading role in the functioning of capital-ism belongs to the labor market. Therefore, in economic theory, the labor mar-ket has been a central issue in the discussions between all economic thought cur-rents. Unemployment, which is a phenomenon belonging to the labor market; It remains important because it points out the inefficiency of efficient resource allocation, which is the basic issue of economic theory, and it stands out with its social and political consequences. In this context, the theoretical explanation of the phenomenon of unemployment has a fundamental role in shaping and de-fending economic policies.
Unemployment, especially with the 1929 world economic crisis, is one of the lead-ing problems in the world. The period after the Second World War from 1945 to 1970 called the golden age, and it was identified with political stability, economic growth, full employment and strong social security, which were the basis of mac-roeconomic policies, social policies and labor market regulations. However, after 1970, the model based on political stability, economic growth, full employment, strong social security and national solidarity has undergone a radical change and the historical compromise between capital and labor has been shaken. Achieving the objectives of full employment, social protection and reduction of inequality has become difficult and perhaps far from being the target. Undoubtedly, the oil crises of the 1970’s played a major role in the closure of the so-called golden age. While the unexpected rapid increase in oil prices created a widespread economic recession, rising production costs and interest rates caused financial crises and employment-unemployment phenomena became the main economic and social
1 Asistant Professor, Nigde Ömer Halisdemir University, Turkey

10
UNEMPLOYMENT: THEORETICAL EXPLANATIONS
Gürçem ÖZAYTÜRK
problems. Globalization of capital markets after 1980 and intensified interna-tional competition, accelerated technological development, decrease in low and medium skilled manufacturing industry jobs, production and investment level, distribution of investments to earth and population increase triggered the dete-rioration of labor market (Ferrera, Hemerijck, & Rhodes, 2001). In addition to these macro factors, factors such as lack of qualifications, education policies that cannot meet the demands of the business world, productivity level, inadequacies of public employment institutions, institutional structure in the labor market, and increasing input prices can be counted.
In this context, the importance of understanding the phenomenon of unemploy-ment is increasing. The aim of this study; In order to better understand the phe-nomenon of unemployment, to deal with unemployment within a theoretical framework. For this reason, the types of unemployment are mentioned in terms of establishing the conceptual framework of unemployment. Afterwards, the phe-nomenon of unemployment has been discussed in the economic approaches and views that have been continuing from the classical to the present day, which is the beginning of modern economics in terms of establishing the theoretical framework.
1. Conceptual Framework
The lack of detailed knowledge of the types of unemployment prevents the correct diagnosis of the problem of unemployment (Sherraden, 1985). However, there are many different unemployment classifications in the literature. Especially in 2002, the World Bank’s changing policies and criticisms about unemployment rates, many unemployment concepts and definitions have emerged as a result of renewing unemployment rates and definitions. The first of these is classified ac-cording to the periods of unemployment as “short-term unemployment” and “long-term unemployment”. Short-term unemployment; it is a type of unem-ployment that occurs due to the lack of knowledge in real life and lack of knowl-edge of labor in the real world where there is no complete information, and lack of knowledge about the capabilities of the labor force for employers (Helfgott, 1980). Long-term unemployment is unemployment for twelve months or more. In developed countries where the division of labor and specialization is used more effectively, there is a short-term unemployment due to lack of demand. How-ever, in developing countries, there is a longer term unemployment due to struc-tural and conjunctural factors.

PERSPECTIVES ON MODERN ECONOMY
Aizhan KHOICH, Ali Eren ALPER, Ahmet Arif EREN
11
The second classification is divided into two groups as “voluntary unemploy-ment” and adi voluntary unemployment bağlı depending on the desire to work. Voluntary unemployment; is the absence of a job because a higher wage than the current one is required or better job conditions are sought than the exist-ing one. Voluntary unemployment is not fully recognized as a real form of un-employment. Because it is thought that such unemployed people will find a job immediately if they consent to work under the current conditions. The volun-tary unemployment, which is another unemployment classification depending on the willingness to work, is not considered as a type of unemployment by Clas-sic economists. According to the classics, all unemployed are voluntary unem-ployed. As a natural consequence of this idea, classical-liberal economists have argued that workers will never be unemployed if they are willing to work as low as necessary. However, according to the Keynesian approach, voluntary unem-ployment; Although the labor force has the willingness and ability to work at the current wage level in the market and is ready to supply his labor, it is the situa-tion that he cannot find a job due to lack of labor demand. Structural, friction, technological, cyclical and hidden unemployment are classified as non-voluntary unemployment. The reason for such unemployment is insufficient demand, in-sufficient production capacity, cyclical fluctuations, structural problems or insuffi-cient capital equipment. Whatever the cause, this kind of unemployment cannot be remedied only by measures taken by the workers, for example by the willing-ness of workers to work for less wages. The problem must be solved considering the whole economy (Aren, 2008).
Structural unemployment under the non-voluntary unemployment classification; it occurs when the quality of vacant jobs does not match the qualifications and skills of job seekers, open jobs and job seekers are in different places and existing jobs and professions disappear with technological developments (Biçerli, 2007). More precisely, economic actors who cannot adapt to rapidly changing world markets lose their share in the market. If these actors cannot make the necessary transformation, they will not be able to survive. The type of unemployment that emerged during this transformation process is structural unemployment (Hart, 1990). Standing (1983) summarizes the factors that cause this type of unemploy-ment in seven articles. These substances are change in industrial structures, inade-quacy of qualifications, geographical obstacles, demographic changes, institutional rigidities, unemployment ability and capital-restructuring unemployment (Stand-ing, 1983). As can be seen, structural unemployment is basically divided into two

12
UNEMPLOYMENT: THEORETICAL EXPLANATIONS
Gürçem ÖZAYTÜRK
categories as occupational and geographical. However, it should be noted that structural unemployment increases during periods of zero or very low unemploy-ment, while structural unemployment decreases during periods of economic crisis where occupational and geographical mobility tend to rise (Flückiger et al., 1986).
Another type of voluntary unemployment is cyclical unemployment. It is called unemployment in periods of alternating growth and contraction in economies. The labor market has a dynamic structure in which continuous inflows and ex-its occur. It is the employee and employer side that causes labor mobility in the market. If the flow of information in the labor market was complete, the em-ployee leaving one job would not lose time in the transition to another; But in real life the transition from one job to another takes time and causes unemploy-ment. This unemployment is called frictional unemployment (Biçerli, 2007). In a healthy functioning economy, frictional unemployment, which is the most ap-propriate distribution of labor in various production lines and thus a mobility of labor required for productive work, is an expected phenomenon at the level of 1-2% on average even if full employment in the economy is concerned. Pigou says: “There is such a minimum that unemployment cannot go down from it” (Dirimtekin, 1981).
According to Schumpeter, various innovations create new jobs instead of man-powering jobs. New products, new production methods and new markets emerge with innovations. As a result, the labor force will start producing new materi-als, wage levels will rise and unemployment will decrease (Mouhammed, 2011). However, there is a substitution relationship between labor and capital, the two most important factors of production. In parallel with the advancement of tech-nology, the workforce can be replaced by machinery and more efficient methods can be adopted. In short, in this type of unemployment, which occurs with the use of new inventions in the production process and the substitution of labor by machinery, the labor force is unable to adapt to new technologies and becomes unemployed. Of course, this depends on the substitution of the machine on la-bor on the one hand, and on the other hand, the knowledge of the workers on the other (Unay, 1996).
Another type of unemployment that should be considered is natural unemploy-ment. This type of unemployment, which is considered normal in almost all economies, arises from the inability to completely eliminate unemployment in

PERSPECTIVES ON MODERN ECONOMY
Aizhan KHOICH, Ali Eren ALPER, Ahmet Arif EREN
13
an economy due to the natural course of labor markets. Natural unemployment is the sum of frictional and structural unemployment. From this point of view, natural unemployment represents the long-term minimum level of unemploy-ment in an economy (Berber, 2013). The reason for this unemployment is a nat-ural reason in economies. Therefore, it is more accurate to mention high employ-ment rather than full employment in the economy. The natural unemployment put forward by M. Friedman and S. E. Phelps is the minimum unemployment or full employment unemployment limit that cannot be melted by economic pol-icies, leading to inflation when attempted to be melted. In other words, it is the lowest unemployment rate that can be sustained without increasing inflation or the unemployment rate where the current national income is at the level of po-tential (full employment) national income. Friedman argued that the inverse re-lationship between the inflation curve and the unemployment rate of the Philips curve was only short-term, and that the expected level of inflation and the cur-rent inflation level in the long run were a steep line that could be shown at the natural unemployment rate of the Long-Term Philips Curve and that inflation would not rise (Layard & Nickell, 1997). This unemployment rate, which does not accelerate inflation, is called NAIRU. In particular, many economists sym-pathetic to Keynesianism have chosen to use the concept of NAIRU (Non In-flanotary Rate of Unemployment) instead of natural rate in long-term unem-ployment debates. NIRU, which was first used by Modigliani and Papademos (1975) as the rate at which inflation is expected to decrease during the period of unemployment above inflation, was then presented by James Tobin (1980) to NAIRU and thus used in the definitions of natural unemployment rate estima-tion. There are others, such as Ball and Mankiw (2002), who think that NAIRU is a synonym for natural unemployment, as well as King (1999). According to King (1999), the natural unemployment rate defines a real equilibrium deter-mined by the structural characteristics of labor and product markets and is in-dependent of inflation. However, NAIRU is influenced both by structural char-acteristics and by the gradual adaptation of the economy to previous economic shocks that determine the course of inflation. Carlin and Soskice (1990) point to another distinction between these two concepts. This difference comes from micro foundations. While Friedman’s natural rate is a concept that cleanses the market, NAIRU is an unemployment rate that will create consistency between the target real wages of workers, labor productivity and the possible real wages determined by the size of the firm’s mark-up. In the following years, the increase in unemployment and the equilibrium rates at the same time have led some new

14
UNEMPLOYMENT: THEORETICAL EXPLANATIONS
Gürçem ÖZAYTÜRK
Keynesian economists to examine a second explanation that allows aggregate de-mand to affect the natural rate (or NAIRU). Firstly, Phelps (1972) proposed the Hysteresis theory, which includes the idea that the natural ratio depends on the history of the equilibrium ratio.
2. Theoretical Framework
The views of economic approaches on unemployment constitute the theoreti-cal framework of unemployment. Therefore, the contribution of economic ap-proaches plays an important role in revealing the phenomenon of unemployment in the economy. With the period of Mercantilism, when systematic ideas started, discourses on unemployment were put forward. The important development re-garding unemployment before mercantilism is the adoption of the ‘Poor Law’ in England in 1535 (Boyer, 1990). According to the mercantilists who ruled be-tween the years 1500-1800, unemployment is not seen among the problems to be experienced due to population growth. Physiocrats, which emerged as a reac-tion to mercantilists, lay the foundations of voluntary unemployment today with the phenomenon they call ‘labor freedom’.
In the classical approach, it is accepted that there is only voluntary unemploy-ment in the economy within the framework of Say law, which states that ‘each supply creates its own demand’. Unemployment was not seen as a problem, as the economy was in full employment and wages and prices were flexible. In 1929, the most important negative cyclical fluctuation, the massive depression in the world, despite the fact that the classics could not explain unemployment, led to a loss of confidence in this approach. Thereupon Keynes, in his work ‘General Theory of Employment, Interest and Money’ argued that the economy cannot come to equilibrium as the classics claim and that full employment cannot al-ways be achieved. Accordingly, due to lack of effective demand, there is no full employment in the economy and there is underemployment. Since wages and prices are strict, there may be a voluntary unemployment. After these assumptions, especially Second World War, oil crises and global economic crises, unemploy-ment has become an increasingly serious problem for economies. In this process, many theories were put forward in the axis of Classical and Keynesian approaches and the subject was discussed. Within the classical approach; neo-classics, mon-etarists, new classical economists, real conjuncture movements, and supply-side economists have assumed that wages and prices are constantly cleared and that if

PERSPECTIVES ON MODERN ECONOMY
Aizhan KHOICH, Ali Eren ALPER, Ahmet Arif EREN
15
there are no market failures and no intervention in the market, there will be no unemployment. On the other hand, in the Keynesian approach, with the basic assumption that there is no full employment and wages and prices are particu-larly downward, it has been suggested that unemployment cannot be solved by itself without external intervention and the subject has been addressed in vari-ous aspects by the explanations brought by structuralist school and new keynes-ian people. In Marxism, which is one of the heteredox economic views apart from the dominant economic views, unemployment while it is seen as a natu-ral consequence of capitalist system and mechanization, it is accepted as a prob-lem in the theories of cyclical fluctuation due to political reasons during election periods. Within this framework, it is seen that each approach to the emergence of unemployment, its causes and solution proposals are the opinions developed from its own point of view.
2.1. Unemployment in Classical and Neo Classical Economics
The classics base their assumptions on the free market economy by stating that the prices of goods, services, labor and money are flexible. According to the par-ties of this approach, some problems and problems can be seen in economics. The reason for this is that free competition does not work well, but the way out of this situation is free competition. The invisible hand in the economy is capable of providing both price fluctuations and full employment. In other words; flexible upward and downward prices and wages will help ensure and maintain full em-ployment. Namely; when wages exceed equilibrium wages, labor demand will de-cline, so labor supply in the labor market will exceed labor demand. In this case, since the demand for labor is lower than the labor supply, the wage level will de-crease due to the competition between the components of the labor supply. While the demand for workers increases against the low wage level, it will be observed that those who do not want to work at this wage level will withdraw from the labor market. In this case, it is accepted that labor supply and demand in the la-bor market will come to a balance and full employment level will be achieved. In short, unemployment in the short term disappears as a result of wages being flex-ible, returning to the level that clears the market. The economy is at full employ-ment level. The balance therefore represents full employment, reflecting a volume of employment in which the positions the employers want to offer are equalized simultaneously with the amount that workers agree to work at the current wages (Tobin, 1972). Therefore, strong trade unions negotiating wages above balance,

16
UNEMPLOYMENT: THEORETICAL EXPLANATIONS
Gürçem ÖZAYTÜRK
laws that establish a minimum wage limit for employees, practices such as when workers and firms often avoid nominal wage cuts for psychological costs (sticky wages / negative wage elasticities), impede the natural functioning of the market and create unemployment (Solow, 1980).
According to classical economics, unemployment is the result of a voluntary choice in all circumstances except for bad luck. Unemployment should always be voluntary as long as there are alternative activities in the current economy. In this situation, all unemployment has irregular elements because nobody prefers bad luck instead of good. However, there are voluntary elements in all unem-ployment because one can always choose to be willing to work even if the con-ditions of work are bad (Lucas, 1978). Neoclassical unemployment theory also contains propositions close to classical unemployment theory. According to neo-classicals, the functioning of the labor market leads to unemployment. This the-ory considers unemployment to be temporary and voluntary.
2.2. Marxist Theory
In this theory, there is no generally accepted idea about labor markets and thus unemployment. However, it is recognized that unemployment stemmed from the economic system itself. Accordingly, unemployment is caused by deprivation of self-employment and mechanized substitution of the labor force as the current economic system leads to capital accumulation (Robinson, 1941). In this con-text, unemployment in Marxist economics based on labor value theory consists of two main reasons. The first is the idle workforce that emerges with the mech-anization of production. Technology creates unemployment. The other is that, depending on the number of unemployed, the capitalist has difficulty in finding jobs due to the increasing demand for qualified labor. As the number of work-force seeking increases, wages fall, and therefore qualified people are willing to start at lower wage levels. In this case, the chance of finding a job is reduced if the unskilled labor accepts the low wage level. It is understood that unemploy-ment in Marxist economics is a natural consequence of the internal contradic-tion of capitalism (Ataman, 1998). It seems that both types of unemployment are actually involuntary. The spiral of unemployment stemming from the struc-ture of capitalism is a voluntary situation for workers.

PERSPECTIVES ON MODERN ECONOMY
Aizhan KHOICH, Ali Eren ALPER, Ahmet Arif EREN
17
2.3. Unemployment in Keynesian Economics
The classical approach was insufficient explaining the Great Depression in 1929. This situation brought new theories and explanations. The rise of Keynes’ the-ory coincided with the most troublesome period of capitalism. Capitalism rap-idly monopolized all of Marx’s predictions, the income gap between classes grew, and the growing crisis of overproduction brought about a great misery. In an en-vironment where unemployment is above 20 percent, the situation has reached a level that cannot be explained by the concept of voluntary unemployment, in which classical economists prefer not to work against the current market wages of individuals (Eaton, 2009). In such an environment, Keynes’ problem is not to explain temporary deviations from full employment, but to explain that full em-ployment is a rare and short-term phenomenon (Meltzer, 1988).
Keynes begins General Theory by pointing to two assumptions of classical eco-nomics. First, Classical Theory assumes wage equal to the marginal yield of la-bor. This indicates that the labor market results are on the labor demand curve. Second, the Classical Theory assumes that the benefit of wage in a data employ-ment volume is equal to the marginal labor of the employment volume. This means that the labor market results rejected by Keynes are on the labor supply curve. The rejection is that it will raise the possibility of voluntary unemployment (Snowdon & Vane, 1997). In other words, even in a non-stagnant economy (full employment), it is inevitable that some of the sources of employment will remain idle and voluntary unemployment will occur (Mankiw, 1990). This theoretical index of unemployment can be expressed in a more comprehensible arrangement as a state of absence of employment although it will be accepted and sought at the current wage level and working conditions (Keynes, 1973). This definition is now accepted as the definition of open unemployment.
So if Keynes’s discourses are taken in general; Unlike the classics, wages are not flexible. In the economy, for some reason, wages are inferior and therefore there is voluntary unemployment. Since there is a close relationship between labor supply and demand and supply and demand of goods, deviation from a balance in the goods market can cause unemployment by affecting the labor market (Törüner & Lordoğlu, 1991). All this shows that; The classical theory was a highly devel-oped, comprehensive recession and unemployment theory, eliminated by a move by Keynes (Skousen, 2003).

18
UNEMPLOYMENT: THEORETICAL EXPLANATIONS
Gürçem ÖZAYTÜRK
2.4. Monetarist Vision
The proposals of the Keynesian approach were accepted by most groups until the 1970s. As a result of the policies pursued, budget deficits that cannot be pre-vented have arisen and the policies implemented to eliminate these deficits have revealed the phenomenon of chronic inflation. Inflation and unemployment, which started in the 1960s and gained momentum, became a problem for many countries’ economies. The crisis, which started in 1970s with the decline in pro-duction and profitability especially in developed countries, gained an international character in a short time. With this development, economic growth slowed down and unemployment and inflation continued to increase. During this period, crit-icism against the Keynesian approach began to increase. The strongest criticism of Keynesianism came from the monetarists led by Milton Friedman, a professor of economics at the University of Chicago (Sloman, 2004).
According to the monetarists, unemployment is explained by the existence of a natural unemployment rate that can be seen in the economy even if it is full em-ployment. In the face of Keynesian underemployment analysis, Monetarists ar-gue that underemployment can only be a short-term phenomenon, and that in the long term, the labor market will come to a point where equilibrium will be eliminated. Unlike the classical, the equilibrium of the labor market is defined as the natural unemployment rate, not as full employment in the Monetarists (Friedman, 1977).
Friedman’s natural rate is the level at which a lower unemployment would put pressure on the rise in real wages (Friedman, 1968). According to him, the nat-ural unemployment rate is a balance determined by all real conditions affecting labor demand and supply (Ekelund & Hebert, 1997). Despite a policy of achiev-ing unemployment below the natural rate, unemployment will return to its nat-ural rate, even if it decreases in the short term, with a higher nominal wage in the long term (Hoover, 1988). Here, the deviation from the natural unemploy-ment rate in the short-term occurs as a result of short-term expectation errors of decision-making units (Fischer, 1977). In short, the natural unemployment rate is not cyclical and is a result of the structural characteristics of the economy.

PERSPECTIVES ON MODERN ECONOMY
Aizhan KHOICH, Ali Eren ALPER, Ahmet Arif EREN
19
2.5. New Approaches Explaining Unemployment
Following Keynes, economists were divided into two main camps. These are Keynesian economists and Neoclassical economists. The debate between the two schools on the question of whether the economy can automatically achieve full employment has continued for a long time (Branson, 1979; Hansen, 1951). One of the key questions here is: How much can the supply and demand fluctuations in the labor market be overcome by price and quantity adjustment in the discus-sion of flexibility? In other words, do wages change so fast that they can elimi-nate imbalances in the labor market? (d’IRIBARNE, 1990).
In the 1970s, criticisms of the Keynesian view that their theories were not based on micro-foundations brought the New Classical school to the forefront. Accord-ingly, it is stated that prices and wages are determined by the conditions that clean the market, it is costly for the decision units to obtain full information, but the authorities on money have full information. The fact that the decision-making units have rational expectations causes the changes in monetary policies to have no effect on the economy. Therefore, only surprise changes in the monetary au-thority’s policies affect unemployment (Barro, 1997).
In the new classical view, labor demand is the function of the current real wage and labor supply is the function of the expected real wage. The average monetary wage is constantly changing in order to establish the balance in the labor mar-ket and the balance in the labor market is not the only one. In other words, em-ployment and real wage balance are affected by both current and expected price levels, which affect real wages. In this case, the difference between the current real wage and the expected real wage will cause an imbalance in the labor mar-ket. The emergence of an imbalance problem in the labor market has been the main point that differentiates the new classics from the classics. However, the rea-sons explaining this imbalance are similar to the classical theory. According to the new classical view, just as in the classical view, a fluctuation in real wages arising from the difference between the expected and the actual is a result of incomplete information in the market. Is unemployment, which will arise as a result of this imbalance, a voluntary unemployment problem, as in the classics? The answer to this question is not very clear (Ataman, 1998).
In the 1980s, new classical economists developed the Real Business Cycle theory as a result of the failure of expansionary monetary policies to solve the stagnation

20
UNEMPLOYMENT: THEORETICAL EXPLANATIONS
Gürçem ÖZAYTÜRK
prevailing in Europe despite the policies that adopted the classical view. Proponents of this view believe that the markets are constantly cleared to adapt to changes in wages and prices in labor markets and other markets, and that changes in labor supply and demand explain fluctuations in the level of unemployment (Green-wald & Stiglitz, 1993). Accordingly, large random fluctuations in the rate of tech-nological development and supply-side shocks to which the production function is exposed cause rational individuals to change their labor supply and consump-tion decisions due to the change in relative prices, resulting in fluctuations in to-tal production and employment. This development has greatly increased interest in the supply side of macroeconomics (Snowdon & Vane, 1997).
The lifting of the boundary between voluntary unemployment and involuntary unemployment is the end point of the new classical approach. However, the main point to be explained is the factors that prevent wages from falling. This is the topic of the New Keynesian school. The New Keynesian School, which emerged against the New Classics in the 1980s, primarily investigated wage and price ri-gidity based on maximization behavior and rational expectations (Gordan, 1990). The New Keynesian do not agree with the new classical explanations of insta-bility, but share two methodological propositions of the new classics. First; mac-roeconomic propositions require microeconomic foundations. Latter; macroeco-nomic models are best regulated within the overall balance system. According to Greenwald and Stiglitz (1993), real business cycle theorists adopt full informa-tion, full competition and zero transaction costs. Problems with asymmetric in-formation, heterogeneous units and imperfect and incomplete markets are not as-sumed. The main characteristic of the new Keynesian approach is that it is aware of the importance of all real world shortcomings (Stiglitz, 2000).
In explaining unemployment, the new Keynesian view accepts the Keynesian view as the assumption of the rigidities of wages to fall, but stresses that this assump-tion needs to be explained. This explanation requires an answer to the following question. Why do the reluctant unemployed oppose falling wages? The answers to this question are included in the wage rigidity models. In these models, effec-tive wage theory, insider-outsiders and implicit contract models are the main ap-proaches. These approaches are:
PERSPECTIVES ON MODERN ECONOMY
Aizhan KHOICH, Ali Eren ALPER, Ahmet Arif EREN
21
According to effective wage theory, firms do not reduce wages even in the event of permanent unemployment. Reducing real wages is not of interest to firms, be-cause workers’ productivity is not independent of wages. In other words, if firms reduce wages, they know that negativities such as decrease in labor productivity, weakness of loyalty to work and firm, increase of labor turnover and dismissal will occur. Therefore, they do not go to reduce wages (Mankiw, 1990). The natural consequence of this is the emergence of a permanent unemployment in the market.
According to the insider-outsiders model, workers at work are insiders and out-siders are idle workers. This model is the power of insiders to determine wage and employment decisions, at least in part. This power of the insider emerges as a re-sult of labor turnover costs (Vetter & Andersen, 1994). These costs; labor market review, advertising and research, negotiation of labor conditions, compulsory dis-missal and legal costs. This also includes the training needs of new workers. Exact substitution of trained domestic workers and untrained workers is not possible (Greenwald & Stiglitz, 1993). Insiders react to the replacement of new workers with lower wages, and productivity is negatively affected. On the other hand, the recruitment of new workers poses both a cost of education and negativity result-ing from labor turnover (Gordon, 1990). Because of all this, firms do not want to bear the risks of employing new workers by giving them lower wages. This re-sults in the labor market not being completely cleaned up. The insider-outsiders theory and the effective wage theory provide different explanations of non-formal unemployment. Since the amount of voluntary unemployment depends on what firms want to give and what workers can get, these theories match and comple-ment each other (Lindbeck & Snower, 1987). The implicit contract theory ex-plains what dominates the labor market, which shapes the ‘economic glue tutan that holds workers and firms together in the long run. Because firms try to main-tain the loyalty of workers and engage in unwritten agreements with their work-ers. This provides each worker with assurances about the terms of the agreement of the working relationship under various working conditions. Under these cir-cumstances, the level of wages does not only apply to payment for labor. In ad-dition, it acts as an insurance against the risk of variable income against shocks (Snowdon & Vane, 1997). In short, the theory is based on the assumptions that there is non-asymmetric information between firms and employees and that the parties will mutually comply with the provisions of the contract (Ricard, 1993).

22
UNEMPLOYMENT: THEORETICAL EXPLANATIONS
Gürçem ÖZAYTÜRK
Finally, another explanation of the New Keynesian about labor markets is the Hysteria Effect. According to this hypothesis, if the current unemployment rate is reduced by expansionary policies, the natural unemployment rate will decrease; because the natural unemployment rate will follow the path of the current un-employment rate (Snowdon, Vane, & Wynarczyk, 1996). Inflation due to the expansionary policy implemented will disappear after the economy settles at a lower unemployment rate.
Conclusion
According to Malinvaud (1990), the labor market consists of a very complex set of facts. This market occurs at the intersection of a series of individual behav-iors affected by changes in economic life. It is not always easy to define all possi-ble decisions and the consequences of these decisions, and these definitions can-not be fully explained by economic concepts. Certainly there is a need for such an analysis that an analysis that includes many features of the labor market that economic models do not take into consideration and which can show the inter-action between different factors only helps to understand this contradictory phe-nomenon. This is the only way to understand. In short; For an accurate analysis of labor markets, a vivid and constantly restructured relationship must be estab-lished between a specific theoretical framework that will define structural features and concrete social formations that will give color and texture to this framework. However, the first way to achieve this is to understand the concept of unemploy-ment very well theoretically. The second important point is that all schools of economics deal with this concept and the differences of meaning attributed to it. In this respect, the subject is theoretically handled with the types of unemploy-ment. Then, the concepts of voluntary unemployment and involuntary unem-ployment of economic schools were questioned again. It is seen that the classical / neoclassical or Keynesian theories that have been known to date are insuffi-cient in explaining the unemployment problem that is being experienced today and changing economic and social conditions have led to new approaches. An important part of today’s unemployment is structural and long-term, explained by these new approaches.

PERSPECTIVES ON MODERN ECONOMY
Aizhan KHOICH, Ali Eren ALPER, Ahmet Arif EREN
23
References
Aren, S. (2008). İstihdam Para ve İktisadi Politika. 13. Baskı, Ankara, İmge Kitabevi Yayınları.
Ataman, B. C. (1998). İşsizlik Sorununa Yeni Yaklaşımlar. Ankara Üniversitesi SBF Der., C.53, S.1, 79-72.
Ball, L., & Mankiw, N. G. (2002). The NAIRU in theory and practice. Journal of economic Perspectives, 16(4), 115-136.
Barro, J., R. (1977). Unanticipated Money Growth and Unemployment in the United States. The American Economic Review, Vol.67(2), 101-115.
Berber, M. (2013). Makro İktisat. 1.Baskı, Bursa, Ekin Yayınları.
Biçerli, M., K. (2007). Çalışma Ekonomisi, İstanbul, Beta Basım A.Ş.
Boyer G. (1990). An Economic History Of The English Poor Law. Cambridge University Press.
Branson, W. H. (1979). Macroeconomic theory and policy. (No. 04; HB171. 5, B73 1979.).
Carlin, W., & Soskice, D. (1990). Macroeconomics and the wage bargain (Vol. 99). Oxford: Oxford University Press.
D’Iribarne, P. (1990). Le Chômage Paradoxal, Paris, Ed. PUF.
Dirimtekin, H. (1981). Makro İktisat. Eskişehir, Bizim Kitabevi.
Eaton, J. (2009). Keynes’e Karşı Marx. Evrensel Basım Yayın.
Ekelund, R. B., & Hebert, R., F. (1997). A History of Economic Theory and Method. The McGraw-Hill Companies.
Ferrera, M., Hemerijck, A., & Rhodes, M. (2001). The Future of the European ‘Social Model’ in the Global Economy. Journal of Comparative Pol-icy Analysis: Research and Practice, Volume: 3, 163-190.
Fischer, S. (1977). Long Term Contracts Rational Expectations and The Op-timal Money Supply Rule. Journal of Political Economy, Vol.85(1), 191- 205.
Flückiger, Y., Schönenberger, A., & Zarinnejadan, M. (1986). Measuring Dif-ferent Types of Unemployment in Switzerland. Swiss Society of Eco-nomics and Statistics, 122(1), 17-35.

24
UNEMPLOYMENT: THEORETICAL EXPLANATIONS
Gürçem ÖZAYTÜRK
Friedman, M. (1968). The Role of Monetary Policy. The American Economic Review, Vol.58(1), 1-17.
Friedman, M. (1977). Nobel Lecture: Inflation and Unemployment. Journal of Political Economy, Vol. 85, No. 3, 451-472.
Gordon, J., R. (1990). What is New Keynesian Economics?. Journal of Econom-ic Literature, Vol. 28, No. 3, 1115-1171.
Green, B., & Stiglitz, J. (1993). New and Old Keynesians. The Journal of Eco-nomic Perspectives, Vol.7(1), 23-44.
Hansen, A. H. (1951). Business cycles and national income.
Hart, P., E. (1990). Types of Structural unemployment in The United King-dom. International Labour Review, 129(2), 213-228.
Helfgott, R., B. (1980). Labour Economics. New York, Random House Press.
Hoover, K., D. (1988). The New Classical Macroeconomics: A Spectial Inquiry. Oxford: Basil Blackwell.
Keynes, J., M. (1973). The general theory of employment, interest and Money. The Royal Economic Society.
King, M. (1999). Monetary policy and the labour market. Bank of England. Quarterly Bulletin, 39(1), 90.
Layard, R., & Nickell, S. (1997). Labour Market Institiutions and Economic Performance. Oxford Univ Inst. of Economics&Statistics Discussion Paper Series, Oxford, 3029-3084.
Lindbeck, A., & Snower, J., D. (1987). Efficiency wages versus insider and outsiders. European Economic Review, 31, 407-416.
Lucas, R. E. (1995). Unemployment policy. In Essential Readings in Economics. Palgrave, London.
Malinvaud, E. (1990). What do we mean by explaining high unemployment?. Structural Change and Economic Dynamics, 1(1), 15-26.
Mankiw, N., G. (1990). A Quick Refresher Couse in Macroeconomics. Journal of Economic Literature, Vol: 28, No: 4,1645-1660.
Meltzer, A., H. (1988). Keynes’s Monetary Theory A Different İnterpretation. Cambridge. Cambridge: University Press.
PERSPECTIVES ON MODERN ECONOMY
Aizhan KHOICH, Ali Eren ALPER, Ahmet Arif EREN
25
Modigliani, F., & Papademos, L. (1975). Targets for monetary policy in the coming year. Brookings Papers on Economic Activity, (1), 141-165.
Mouhammed, A. H. (2011). Veblen’s Theory of Unemployment and Public Policies. International Research Journal of Finance & Economics, 70, 217-226.
Pattanaik P., Tadenuma, K., Xu Y., & Naoki, Y. (2008). Rational Choice And Social Welfare Theory And Application. Berlin, Springer Press.
Phelps, E., S. (1972). Inflation policy and unemployment theory.
Ricard, P. (1993). Wages and Unemployment, A study in nonWalrasian Macroeco-nomics. Cambridge University Press.
Robinson, J. (1941). Marx on Unemployment. The Economic Journal, Vol. 51, No.202/203, 234-248.
Sherraden, M., W. (1985). Chronic Unemployment: A Social Work Perspec-tive. Social Work, 30(5), 403-408.
Skousen, M. (2003). Modern İktisadın İnşası. çev. M. Acar vd., Ankara: Liberte.
Sloman, J. (2004). İktisat Makro. Çeviren: Ahmet Çakmak, İstanbul, Bilim Teknik Yayınevi.
Snowdon, B, Vane, H., R. (1997), Reflections on the Development of Modern Macroeconomics içinde (der. Snowdon, Brian ve Vane, Howard R.), Edwar Elgar,U.K.
Snowdon, B., Vane, H., & Wynarczyk, P. (1996). A Modern Guide to Mac-roeconomics. 3rd Ed., United Kingdom, Edward Elgar Publishing Company.
Solow, R., M. (1980). On Theories of Unemployment. American Economic Re-view, Vol. 70, No. 1.
Standing, G. (1983). The Notion of Structural Unemployment. International Labour Review, 122(2), 137-150.
Stiglitz, J., E. (2000). The contributions of the economics of information to twentieth century economics. The quarterly journal of economics, 115(4), 1441-1478.
Tobin, J. (1972). Inflation and Unemployment. American Economic Review, Vol.62, 1-17.

26
UNEMPLOYMENT: THEORETICAL EXPLANATIONS
Gürçem ÖZAYTÜRK
Tobin, J. (1980). Stabilization policy after ten years. Brookings Papers on Eco-nomic Activity, 1, 19-72.
Törüner, M., & Lordoğlu, K. (1991). Çalışma Ekonomisi. İstanbul: Beta Yayın-ları. 1. Baskı.
Unay, C. (1996). Makro Ekonomi. Ekin Kitabevi, 6. Baskı, Bursa.
Vetter, H., & Andersen, T., M. (1994). Do turnover costs protect insiders?. The economic journal, 104(422), 124-130.

27
2ESTIMATION OF THE NAIRU WITHIN THE FRAMEWORK OF THE BRICS COUNTRIES AND TURKEYAyberk Nuri BERKMAN1
Introduction
The concept of NAIRU was first coined as the Non-Inflationary Rate of Unem-ployment (NIRU) by Modigliani and Papademos (1975) and later referred to as the Non-Accelerating Inflation Rate of Unemployment by Tobin (1980). The NAIRU, as a useful instrument for policy-makers, represents an unemployment rate that is consistent with stability, so that it does not accelerate inflation. In this context, deviations in the NAIRU reveals the measure of inflationary pres-sure and can be used to calculate the output gap. High levels of the NAIRU may indicate the weakness of the labor market as well as an indicator of the cyclical component of unemployment. Therefore, economists assume significance in es-timating the NAIRU. The NAIRU is different but similar to the natural rate of unemployment (NRU) proposed by Friedman (1968) and Phelps (1967). In some studies, both concepts were interchangeably used in the same sense, in particular, the Monetarists suggested that NAIRU was a different version of the NRU. On the other hand, other economists who criticized the Keynesian and the Mone-tarists such as Tobin (1997) stated that the NRU and the NAIRU were two dis-tinctly different concepts. The NAIRU had been the locus of interest in the de-velopment of macroeconomic policies along with the recent economic crisis and global developments. Nonetheless, the rapid decline in output levels observed in some countries and the rise in unemployment rates boosted the debate on wage and price inflation.
NAIRU estimates can also provide enlightening information on uncovering the causes of the plunge in potential output rates. NAIRU estimates can also be
1 Asst. Prof Dr., Niğde Ömer Halisdemir University, FEAS

28
ESTIMATION OF THE NAIRU WITHIN THE FRAMEWORK OF THE BRICS COUNTRIES AND TURKEY
Ayberk Nuri BERKMAN
considered as the unemployment rate that does not accelerate inflation, resulting in a stable inflation rate (Debelle and Vickery, 1998). When the unemployment rate is below NAIRU, there would be an increase in pressure on the inflation rate in the economy, on the contrary, and when the unemployment rate is higher than NAIRU, there would be downward pressure on the inflation rate. From this per-spective, NAIRU is the unemployment rate that keeps inflation constant in the economy. It can also be asserted that NAIRU has a natural speed limit for eco-nomic activity. In other words, NAIRU measures a country’s sustainable produc-tion capacity. If an economy grows faster than the resources it owns since it is al-lowed, the price pressure in the economy would result in the acceleration of the inflation rate sooner or later (Altig and Gomme, 1998). Central monetary banks should be able to predict future inflation accurately as monetary policy imple-mented to ensure price stability affects inflation with a delay. The NAIRU has been the subject of many studies in the academic literature as one of the signs reflecting the inflationary pressure in the economy (Estrella and Mishkin, 1999). There are different accepted approaches and methodologies for the NAIRU esti-mates. Upon evaluating these approaches as a whole, it is seen that the structural vector autoregressive model (SVAR) has advantages over other methods and ad-ditional information provided to researchers.
Developing policy suggestions to reduce unemployment, which has become a crit-ical macroeconomic problem for all economies globally, is among the main ob-jectives of policymakers. Therefore, many theoretical and empirical research stud-ies on unemployment issues are conducted within the discipline of Economics and solution strategies are developed based on the results achieved. Considering the theoretical economic explanations regarding unemployment, three basic ap-proaches can be mentioned pertaining to the path unemployment has followed over time. These are unemployment hysteresis hypothesis, natural rate hypothe-sis, and structural approach. The high level of persistence observed in the unem-ployment rates of developed countries following the first petroleum shock led to a lively debate on which theory could better explain the behavior of unemploy-ment rates. The natural rate hypothesis of Friedman (1968) suggested that unem-ployment rates move around an equilibrium level that defines static oscillations. Initially, this ratio was considered to be fixed and exogenous in practice due to the lack of theories that explain the determination of the natural rate. Recent de-velopments have also begun to include structural factors which explain the dis-crepancies among economies over time. In the second approach, known as the

PERSPECTIVES ON MODERN ECONOMY
Aizhan KHOICH, Ali Eren ALPER, Ahmet Arif EREN
29
structural perspective, most of the unemployment shocks are considered tempo-rary, but it is generally stated that the natural unemployment rate is constantly changing and is also affected by changes in structural factors. As a result, the un-employment series follows a stationary process if structural breaks are allowed (Fosten and Ghoshray, 2011). The third approach, known as the unemployment hysteresis, was developed by Blanchard and Summers (1986), suggesting that the impacts of unemployment or labor market shocks are permanent. In this study, which of these three approaches mentioned for 5 BRICS countries is tried to be determined by the Lagrange Multiplier (LM) unit root tests that allow structural breaks. Therefore, individual LM unit root tests developed by Lee and Strazicich (2003) along with the panel LM unit root tests of Im et al. (2010) are utilized. Because when the related literature is analyzed, it is seen that LM unit root tests are generally used in the time-series dimension and are not handled in the panel dimension. The panel LM unit root test recommended by Im et al. (2010) is used in this study. This study consists of four sections. The first section focuses on the estimation and theoretical basis of the NAIRU and the findings of rele-vant studies in the literature. The second section describes the NAIRU estimation methods and the NAIRU estimations for the BRICS countries and Turkey. The third section involves the findings obtained from the performed analyses. Con-sequently, the final section includes conclusions and evaluations.
I. Theoretical Framework
There are three basic approaches to the path unemployment has followed through-out time. The first one is the “natural unemployment rate” or “unemployment rate that does not accelerate inflation” (NAIRU) hypothesis, which defines un-employment dynamics as a process that having mean-reverting tendency as a re-sult of shock and is therefore associated with a stable inflation rate. According to the hysteresis hypothesis defined as “the high dependence of current period in-flation on past period inflation”, shocks have a permanent impact on unemploy-ment. Therefore, the hysteresis hypothesis suggests that the unemployment se-ries is not stationary, does not have a mean-reverting tendency. In the structural approach suggested by Phelps (1994), it is stated that most shocks for unem-ployment are temporary and these shocks are generally associated with recessions that lead to changes in the level of natural unemployment. It is also emphasized that the natural rate is endogenous. For this reason, the structural approach states

30
ESTIMATION OF THE NAIRU WITHIN THE FRAMEWORK OF THE BRICS COUNTRIES AND TURKEY
Ayberk Nuri BERKMAN
that the unemployment series follows a stationary process with structural breaks (O’Shaughnessy, 2011).
These theoretical approaches can be explained more broadly as follows. In the nat-ural rate hypothesis, there is only one long-term equilibrium for unemployment rates, and therefore the Phillips curve is in the form of a straight line. Shocks have a temporary impact. For this reason, the NAIRU hypothesis mentions that the degree of integration (d) of the unemployment series ranges between 0 and 0.5 (Marques et al., 2017). In the second approach, the hysteresis hypothesis, unem-ployment dynamics are considered as a nonstationary process that does not have a mean-reverting tendency. Another concept that is confused with the concept of hysteresis is called “persistence”. Here, rigidities in the market slow down the rate of mean-reverting unemployment (Ener and Arica, 2011). Therefore, as mentioned by O’Shaughnessy (2011) and Logeay and Tober (2006), it is essential to distin-guish between hysteresis and persistence. Persistence refers to the mean-reverting tendency of the series, albeit slowly. If the unemployment hysteresis hypothesis is rejected, shocks merely cause temporary deviations around an average value or a deterministic trend. When these explanations are expressed using an econometric terminology, it is seen that the time-series features or integration degrees of the unemployment series loom large. In short, the hysteresis hypothesis mentions that the unemployment series is dependent on past values and that shocks constantly influence unemployment. As for the causes of unemployment hysteresis, there are many explanations in the literature. The most basic of these is the “insiders-out-siders” model of Blanchard and Summers (1986). In this approach, the negative demand shock, which increases unemployment, excludes workers (outsiders) who do not have the right to choose from the labor market and causes them to lose their bargaining power to other workers (insiders) working in the labor market. If the insiders give zero weight to the outsiders in wage bargaining, this leads to continuous increases in the unemployment rate. Because the insiders set a wage level that enables their own employment to continue, while the outsiders remain unemployed because they cannot put downward pressure on wages. Furthermore, many reasons can be put forward that are not based on the degree of unioniza-tion of the economy that explains the hysteresis effect. In the case of hysteresis, the high unemployment rate becomes a problem that cannot be solved without government intervention. Therefore, if the unemployment hysteresis hypothesis is correct, active government policies that tackle unemployment are necessary, especially during recession periods (Gustavsson and Österholm,2007; Chang et

PERSPECTIVES ON MODERN ECONOMY
Aizhan KHOICH, Ali Eren ALPER, Ahmet Arif EREN
31
al., 2005). In other words, where the hysteria hypothesis is confirmed, macroe-conomic policies will have a constant influence on unemployment.
However, if the natural rate approach or structural approaches are valid, there will be no need for government interventions as the unemployment series will have a mean-reverting tendency after a while. In line with these explanations, the pres-ence or absence of an unemployment hysteresis is crucial also for policymakers.
II. Literature Review
Upon examining the literature, NAIRU estimation methods can be classified un-der three groups in general. These include structural models based on the Phil-lips curve, completely statistical methods such as unobserved component mod-els (UCM) based on the trend estimate of the measured unemployment rate and Hodrick Prescott Filtering methods, and reduced-form models such as the Struc-tural VAR models and Elmeskov method. Although statistics methods are very easy to apply, the selection of the correction parameter is not objective and it is not based on any economic theory. In structural models based on the Phillips equation, the NAIRU can be estimated using the information on both inflation and unemployment. Upon considering this point of view, economic interpretable estimates are obtained by using structural models. On the other hand, the single equation Phillips equation cannot give much information about the uncertainty in NAIRU, because a single equation cannot accurately describe the combined movements observed in inflation and unemployment. Therefore, in this study, the Structural VAR model, in which inflation and unemployment interact and can determine each other, was used in the estimation of NAIRU. With the SVAR approach, some important studies have been conducted in the international liter-ature for NAIRU. Yavan (1997) estimated the NAIRU over the period from 1969 to 1995 for Turkey. The proposed method for the NAIRU estimation takes place in three stages. In the first stage, the study estimated two long-term equilibrium models using the unemployment rate, whereas the study used the unemployment change in the dynamic inflation and wage increase model in the second stage. In the third stage, the NAIRU is only obtained as a function of structural factors. The findings of the study suggested that the NAIRU over the period from 1990 to 1994 did not change significantly over the years and was around 4%. Bildir-ici (1999) utilized four different methods in estimating NAIRU for Turkey us-ing TSI unemployment data and tested the determined NAIRU and the Phillips

32
ESTIMATION OF THE NAIRU WITHIN THE FRAMEWORK OF THE BRICS COUNTRIES AND TURKEY
Ayberk Nuri BERKMAN
curve. These methods include Nickell and Jackman’s (1991) NAIRU estimation, HP filter method, Elmeskov’s (1993) method, and NIRU approach. NAIRU, es-timated by the first method, was found to be 18.4 and 21.6; 7.93 and 7.08 in the second method, 8.01 and 6.29 in the third method, and 7.88 and 5.68 in the fourth method in 1990 and in 1996, respectively. To test the Phillips curve, the output of the first methods was used. Groenewold and Hagger (2000) esti-mated the natural unemployment rate over the period of 1978-1997 with quar-terly data using a two-variable structural VAR model. In the study, it was as-sumed that the natural unemployment rate represented the NAIRU. In the early 1990s, they associated the rapid increase in the real unemployment rate with the Hysteresis effect. They concluded that the natural unemployment rate influ-enced the actual unemployment rate. Estrada, Hernando, and Salido (2000) cal-culated the NAIRU estimation for the Spanish economy with the Phillips curve-based SVAR approach. The important distinction in their study is to obtain safe point estimates for NAIRU. According to the findings of the study, a rapid in-crease was observed in NAIRU over the period of 1981-1985, the rate of in-crease slowed in the following cycle and then closely followed the observed un-employment rate. The NAIRU estimate for Spain in 1999 was approximately 14%. In Laubach (2001), NAIRU was considered as an invisible stochastic pro-cess and was estimated for the G7 countries from the Phillips curve using state-space models. Unlike other studies, unemployment was examined in a separate model. The unemployment gap was examined through an autoregressive process. According to the findings of the study, due to the uncertainty in NAIRU, the Phillips curve probably cannot accurately explain the joint movement in unem-ployment and inflation. In Hjelm (2003), using the annual data of the period 1950-2001, NAIRU obtained the output gap and structural budget balance es-timation with the same model SVAR approach for the Swedish economy. This study improved Apel and Jansson (1999a and 1999b) to observe the NAIRU and output gap in the same model with the unobserved components method and in-cluded the structural budget balance to the model. The NAIRU projection of 2004 for the Swedish economy was estimated at 3.8% with the dummy variable defined for years, whereas there was an excessive change in the unemployment rate and 4.3% without dummy variable. Hogan and Zhao (2006) is the expan-sion of Laubach (2001) along with the SVAR approach. In the study, they made the NAIRU estimate for the US economy using the SVAR approach, assuming that inflation and unemployment rates reacted to each other. With the SVAR ap-proach, they estimated core inflation and NAIRU simultaneously. The findings

PERSPECTIVES ON MODERN ECONOMY
Aizhan KHOICH, Ali Eren ALPER, Ahmet Arif EREN
33
suggested that the NAIRU declined rapidly towards the end of the 1990s and the long-run vertical Phillips curve shifted backward. In Kaya and Yavan (2007), the Phillips equation, which contains the expectations that form the basis of NAIRU, was estimated using two-stage least squares with the lagged values of exchange rates, interests, and wages as independent variables. This approach enables the Phillips equation to be defined as the reduced equation of a structural model in which exchange rates, interests, and wages are among the endogenous variables. It has a more flexible structure than the methods based on the standard produc-tion function. In the study, the NAIRU estimation was conducted using the quar-terly data obtained over the period between 1988-2006. NAIRU estimates were around 8% and 6.5% between the first quarters of 1991-1994 and between 8% and 10% for the first quarters of 2000-2005. Yaşar (2008) estimated the NAIRU series with quarterly and annual data over the period between 1991-2006 and ap-plied HP filter with Elmeskov (1993) method based on the production function method. With annual data, it is observed that NAIRU decreased from 8.5% to 8% between 1991-1994 and increased from approximately 8% to 10% over the period from 2000 to 2005. In the findings section of the study, it is stated that the annual and quarterly estimates contain similar results. In Kalbasi and Ash-tary (2011), the impacts of monetary policy on the NAIRU in the Iranian econ-omy were examined via the SVAR approach. In the findings of the study, it was concluded that monetary policy had minor impacts on the NAIRU and unem-ployment rate due to various deficiencies in the labor market. With the SVAR approach, the NAIRU estimate was around 12.5% in 2010. There is very com-prehensive literature on unemployment approaches. Since the aim e of the study is not to make a wide literature review in theoretical scope, only the basic stud-ies that are considered important are included here. Upon examining the related literature, it can be seen that the unemployment hysteresis was tested with unit root tests. However, the obtained results vary depending on the performed unit root test, the selected country sample, and the time interval. In this regard, the studies can be categorized according to the type of unit root tests used as follows.
The first group of studies used unit root tests based on standard time-series anal-ysis. For instance, Blanchard and Summers (1986) considered a masterpiece in the unemployment hysteresis literature, using unit root tests of the DF and ADF (Dickey and Fuller, 1979; 1981), over the period of 1953-1984 for France, Ger-many, the UK and the USA. The authors concluded that there was an unem-ployment hysteresis for all countries except for the USA. Stockhammer and Sturn

34
ESTIMATION OF THE NAIRU WITHIN THE FRAMEWORK OF THE BRICS COUNTRIES AND TURKEY
Ayberk Nuri BERKMAN
(2011) found that there were strong hysteresis effects for Australia and Canada, and weak hysteresis effects for most European countries and Japan, using various unit root tests, especially the ADF for 16 OECD countries. The results achieved for the USA strongly rejected the hysteresis hypothesis. Another study in this group is Gomes and Silva (2008). The study, which tested the unemployment hysteresis for Austria with unit root tests developed by Dickey-Fuller (1979) and Stock-Watson (1986), obtained results confirming the hysteresis effect.
The studies in the second group use unit root tests based on time-series anal-ysis, which takes into account the structural breaks. For example, Arestis and Mariscal (1999) tested the unemployment hysteresis hypothesis for 26 OECD countries performing unit root tests allowing two breaks. The obtained results revealed no unemployment hysteresis for 22 countries. Arestis and Mariscal (2000) examined the unemployment hysteresis hypothesis in 22 OECD coun-tries. Obtained results asserted that the unit root hypothesis was rejected for 9 countries, not for 10 countries, and evidence for possible trend stagnation was obtained for 3 countries.
The studies in the third group include traditional panel unit root tests that do not take into account structural breaks. For example, Sephton (2009) examined the unemployment hysteresis via individual and panel LM unit root tests for the 50 states and the Colombian Region. Obtained results provided evidence to sup-port the unemployment hysteresis for most states in the USA. Lee et al. (2010) investigated the unemployment hysteresis for 9 East Asian countries with a panel LM unit root test. Findings supported the hysteresis effect.
The studies in the fourth and last group deal with the subject with nonlinear tech-niques and integration analyses with breaks. Craigwell et al. (2011) tested the un-employment hysteresis for a group of Central European countries, with unit root tests (Lee and Strazicich, 2003; Kapetanios, 2003) that take into account struc-tural breaks, linear externality, and integration with breaks. The obtained results revealed that the hysteresis was valid. Lee (2010) investigated the unemployment hysteresis for 29 OECD countries using the nonlinear unit root test. The findings supported the natural unemployment rate hypothesis for 23 OECD countries.

PERSPECTIVES ON MODERN ECONOMY
Aizhan KHOICH, Ali Eren ALPER, Ahmet Arif EREN
35
III. BRICS Countries
Brazil
Brazil is the largest and most diverse industrial center in Latin America and the Caribbean region. Brazil has worldwide comparative advantages in the produc-tions of agricultural products (coffee, soy, sugarcane, cocoa, rice, cocoa, corn, or-ange, cotton, wheat, tobacco), live animal products (meat, chicken meat), wood products (paper, pulp), metal products (iron-steel and aluminum) and leather. Although it is seen among the top 20 exporting countries, it cannot be said that Brazil has reached its current position in the world economy easily. Brazil has encountered many economic problems such as high inflation and income ine-quality but managed to survive those periods with sound macroeconomic pol-icy implementations during the 1990s. Today, it is mentioned among the major economies in the world.
Russia
In recent years, Russia continues to strengthen its economy with the increase in its effectiveness in foreign policy, the commercial agreements made and the con-tribution of international associations to which it is a member. Russia, one of the world’s leading countries in petroleum and natural gas exports, sells primar-ily missile systems which have reached large figures in total. The country, one of the world’s leading economies, is the second-largest petroleum producer in the world after Saudi Arabia. Russia also has half of the coal reserves in the world. While Russia tries to strengthen the functioning of the market economy, it also pursues protectionist policies.
India
India ranks 7th in the world with a surface area of 3,287,590 km² and ranks 2nd with a population of approximately 1 billion 250 million. India has been also the second-fastest-growing country following China in recent years. Especially the eco-nomic growth and development trend, which has been achieved in recent years, has attracted the attention of countries to India. In terms of the GNP values, In-dia is the 5th economy in the world following the EU, the USA, China, and Ja-pan. Nevertheless, despite the great economic potential of India, there are also dif-ficulties arising from having a large population. On the other hand, a significant

36
ESTIMATION OF THE NAIRU WITHIN THE FRAMEWORK OF THE BRICS COUNTRIES AND TURKEY
Ayberk Nuri BERKMAN
portion of the population of India still does not have access to basic utility services such as water and electricity. Moreover, in compliance with the rapid economic growth, foreign debt is rising as well as the current account deficit. Another prob-lem with growth is that increased prosperity cannot be distributed equally. Rural areas cannot get enough shares from economic development. Poverty makes its existence felt like the most important problem in the economy. On the contrary, approximately 300 million-percentiles have middle- and upper-middle incomes.
China
The reform process that began in China by 1978 with the rapid liberalization in the agricultural sector and continued throughout the 1980s with the reform of the industrial sector. Market-oriented reforms and outward policies underpin China’s eye-catching economic performance. China’s foreign trade statistics re-veal the magnitude of China’s benefits from the globalization process and indi-cate that China may be the world’s largest exporter in the near future if the cur-rent trends are sustained. In this context, China’s membership of the World Trade Organization in 2001 and pro-private sector amendments made in the Consti-tution in 2004 indicate the Chinese government’s determination to maintain a competitive market economy.
South Africa
Upon considering the change that the South African economy has undergone since the 1970s, one of the most important issues encountered is unemploy-ment. In South Africa, which has the strongest and disciplined union movement in the African continent, unions play an active role in the labor market and em-ployment policies in the country. In South Africa, which is the largest economy of the African continent in terms of economic power and development level, the industry and mining-based market economy are in force. Nonetheless, South Af-rica is the country with the highest income inequality in the world (WDI, 2014). With its rich mineral resources and croplands, it is seen that the South African economy, which is dominated by the mining and agriculture sector, has changed significantly in the last forty years and the secondary sectors have become more dominant in the economy.

PERSPECTIVES ON MODERN ECONOMY
Aizhan KHOICH, Ali Eren ALPER, Ahmet Arif EREN
37
IV. Methodology
Unit root tests are used to differentiate between the theories that explicate the be-havior of unemployment rates. The hysteresis hypothesis is formulated as a unit root process. The disapproval of the null hypothesis in the unit root test sup-ports the natural rate hypothesis if the structural breaks are excluded in the spec-ification, and the structuralist approach if the structural breaks are not excluded (Romero-Avila and Usabiaga, 2008).
It is known that traditional unit root tests (such as ADF) based on time-series analysis have very low power in small samples against the alternative of station-arity. Two different approaches have been developed to solve this problem. The first approach is to use panel unit root tests that take into account both the time dimension and the cross-section size of the data. The second approach is to in-clude the structural breaks proposed by Perron (1989) in the unit root test. If there are structural breaks and they are not modeled, the results are likely to be false, whether or not the null hypothesis involves stationarity.
In this regard, following Perron, the researchers realized that structural breaks should also be taken into consideration. For example, Zivot and Andrews (1992) proposed a unit root test (ZA test) that takes into account the only endoge-nously determined break. Later on, Lumsdaine and Papell (1997) improved the ZA test to allow two breaks in level and slope (LP test). On the other hand, Lee and Strazicich (2003) suggested that in case of breaks and unit root, the same re-sult occurs as in single-break tests. In this study, based on the explanations men-tioned, both structural breaks and panel data are used. Therefore, Lee and Stra-zicich (2003) and Im et al. (2005, 2010) LM (Lagrange Multiplier) unit root tests developed are applied.
V. Empirical Findings
The number of lagged extended terms in this study is determined to start from a maximum of 8 (k = 8). Accordingly, the 1.645 asymptotic normal value at the level of 10% is compared with the t-statistic of the last lagged term with the first difference. After determining the optimal k, breaks are determined at which the endogenous two breaks LM t-test statistics are minimum. In this way, every prob-able combinations of 2 breakpoints are examined during the interval of [0.1T, 0.9T]. Here, T denotes the sample size. However, in the analysis of unemployment

38
ESTIMATI ON OF THE NAIRU WITHIN THE FRAMEWORK OF THE BRICS COUNTRIES AND TURKEY
Ayberk Nuri BERKMAN
hysteresis, only the constant is included in the deterministic elements of the model used, while the trend is excluded and only level breaks are taken into account. As stated by Cameraro et al. (2008), it must be noticed that the disapproval of the hysteresis hypothesis in relation to the deterministic specification of the tests in-di cates that the unemployment rate follows a stable path around the natural rate. Therefore, the authors in question argue that the most appropriate deterministic specification in the test of unemployment hysteresis is the specification contain-ing the fixed term. Because, if the trend is included, the specification will dis-guise the fact that the unemployment rate may indicate a long transition between changing natural rates. In addition, Cameraro et al. (2008) also stated that it is not appropriate to include trends by looking at the graphs of the unemployment series of countries. In this study, the results of both Model A, which allows only level breaking, and Model C, which allows breaking at level and slope are given for comparison purposes. Nevertheless, based on the results of Model A, infer-ences are made based on the studies in the mentioned article (Lee et al., 2009; Lee et al., 2010). Moreover, individual and panel LM unit root tests, which did not take structural breaks into consideration to compare first, were also applied and their results are presented in Table 1.
Upon taking structural breaks into consideration, the SP test indicates the exist-ence of the natural unemployment rate for all countries.

PERSPECTIVES ON MODERN ECONOMY
Aizhan KHOICH, Ali Eren ALPER, Ahmet Arif EREN
39
At the level of the unemployment series that allowed two breaks, the unemploy-ment series were determined to be stationary. The panel LM test, which allows merely two-level breaks at level, revealed that the structural approach is valid. Upon considering the dates of the breaks, it can be seen that the first break oc-curred in the period covering the first and second petroleum crises (1972-1982). It is noteworthy that the second break occurred following the year 1990. The 1990-1992 Gulf War, the 1997-98 Asian Crisis, the 1998-99 Russian Crisis, which were experienced in this period, have led to significant breakdowns at the level of the unemployment series of BRICS countries. Table 3 provides the

40
ESTIMATION OF THE NAIRU WITHIN THE FRAMEWORK OF THE BRICS COUNTRIES AND TURKEY
Ayberk Nuri BERKMAN
estimation results of Model C, which allows two breaks at both level and slope. It is concluded that there is no unemployment hysteresis for all BRICS coun-tries, if breaks are allowed at both the level and the slope of the unemployment series. In addition, the panel LM test rejects the hysteresis null hypothesis at all levels of significance for the BRICS panel.
Conclusion
As a result, the results of Model C indicate results that support the structural ap-proach for the BRICS country panel, while Model A supports the hysteresis ap-proach. However, based on the relevant literature, it is necessary to rely on the results, as Model A has a more accurate specification to test the hysteresis hy-pothesis. Therefore, it can be said that the unemployment series are not under the influence of hysteresis for the majority of BRICS countries in the sample. But panel LM tests, which provide results for the entire BRICS panel, support the structural approach. The point that should not be forgotten here is that the null hypothesis that all series contains a unit root, as suggested by Karlsson and Lothgren (2000), can only be rejected because there are only a few stationary se-ries. Therefore, rather than the results of panel LM tests, it is essential to rely on the results of individual LM tests. However, the results of Model C, which al-lows two breaks both at the level and the slope of the unemployment series, pro-vided evidence to support the structural approach both on country and panel basis. Consequently, based on the results of Model A, it can be said that the hys-teresis effect is not valid for all BRICS countries in the sample. This reveals that the unemployment data of BRICS countries contain a unit root, do not have mean-reverting tendency and shocks in the labor market have permanent impacts on the unemployment series.
References
Altig, D., & Gomme, P. (1998). In Search of the NAIRU. Economic Commen-tary, (May 1, 1998).
Apel, M., & Jansson, P. (1999). System estimates of potential output and the NAIRU. Empirical economics, 24(3), 373-388.
Bildirici, M. (1999). Türkiye Ekonomisi İçin NAIRU Ölçüm Denemesi. İktisat İşletme ve Finans, 14(157), 65-82.

PERSPECTIVES ON MODERN ECONOMY
Aizhan KHOICH, Ali Eren ALPER, Ahmet Arif EREN
41
Chang, T., Lee, K. C., Nieh, C. C., & Wei, C. C. (2005). An empirical note on testing hysteresis in unemployment for ten European countries: panel SURADF approach. Applied Economics Letters, 12(14), 881-886.
Craigwell, R., Mathouraparsad, S., & Maurin, A. (2011). Unemployment Hys-teresis in the English-Speaking Caribbean: evidence from non-lin-ear models.
Debelle, G., & Vickery, J. (1998). Is the Phillips curve a curve? Some evidence and implications for Australia. Economic Record, 74(227), 384-398.
Ener, M., & Arica, F. (2011). Is there hysteresis in unemployment in OECD countries? Evidence from panel unit root test with structural breaks. Chinese Business Review, 10(4).
Estrada García, A., Hernando Castellet, I., & López Salido, J. D. (2000). Meas-uring the NAIRU in the Spanish Economy. Banco de España. Servi-cio de Estudios.
Estrella, A., & Mishkin, F. S. (1999). Rethinking the Role of NAIRU in mone-tary policy: implications of model formulation and uncertainty. In Monetary Policy Rules (pp. 405-436). University of Chicago Press.
Fosten, J., & Ghoshray, A. (2011). Dynamic persistence in the unemployment rate of OECD countries. Economic Modelling, 28(3), 948-954.
Furuoka, F. (2014). Are unemployment rates stationary in Asia-Pacific coun-tries? New findings from the Fourier ADF test. Economic re-search-Ekonomska istraživanja, 27(1), 34-45.
Gomes, F., & da Silva, C. G. (2008). Hysteresis vs. natural rate of unemploy-ment in Brazil and Chile. Applied Economics Letters, 15(1), 53-56.
Gustavsson, M., & Österholm, P. (2007). Does unemployment hysteresis equal employment hysteresis?. Economic Record, 83(261), 159-173.
Hjelm G. (2003). Simultaneous Determination of NAIRU, Output Gaps, and Structural Budget Balances: Swedish Evidence. The National Insti-tute of Economic Research, Working Paper, (81).Konjunkturin-stitutet.
Hogan, V. & Zhao, H. (2006). Measuring the NAIRU – A Structural VAR Approach. UCD Centre For Economıc Research Working Paper, Dublin: WP06/17.

42
ESTIMATION OF THE NAIRU WITHIN THE FRAMEWORK OF THE BRICS COUNTRIES AND TURKEY
Ayberk Nuri BERKMAN
Kalbasi N. & Ashtary, M. (2011). Non-Accelerating Inflation Rate of Unem-ployment (NAIRU) in Iran. International Business & Economics Research Journal, 10(11), 63-70.
Kaya, Y. T., & Yavan, Z. A. (2007). Türkiye Ekonomisi Potansiyel Çıktı Tah-mininde Üretim Fonksiyonu Yaklaşımı ve Mevcut İstatistiksel Yak-laşımlar ile Karşılaştırılması. In Economic Research Forum Research Paper Series (No. 07-03).
Laubach, T. (2001). Measuring the NAIRU: evidence from seven economies. Review of economics and statistics, 83(2), 218-231
Logeay, C., & Tober, S. (2006). Hysteresis and the NAIRU in the Euro Area. Scottish Journal of Political Economy, 53(4), 409-429.
Marques, A. M., Lima, G. T., & Troster, V. (2017). Unemployment persistence in OECD countries after the Great Recession. Economic Modelling, 64, 105-116.
O’Shaughnessy, T. (2011). Hysteresis in unemployment. Oxford Review of Eco-nomic Policy, 27(2), 312-337.
Sephton, P. S. (2009). Persistence in US state unemployment rates. Southern Economic Journal, 76(2), 458-466.
Stockhammer, E., & Sturn, S. (2011). The impact of monetary policy on un-employment hysteresis. Applied Economics, 44(21), 2743-2756
Yaşar, P. (2008). Alternatif Hâsıla Açığı Tahmin Yöntemleri ve Phillips Eğrisi: Türkiye Üzerine Bir Çalışma, Yayınlanmamış Uzmanlık Tezi, An-kara: DPT Yayın No: 2768.
Yavan, Z. A. (1997). Türkiye’de İşsizlik: Yapısal ve Yapısal Olmayan Özellikleri, TÜSİAD Tartışma Tebliğleri Dizisi-1, İstanbul: TUSİAD-T/97, 10-218.

43
3THE RELATIONSHIP BETWEEN ECONOMIC COMPLEXITY AND UNEMPLOYMENT RATEİbrahim OZAYTURK1
Introduction
Studies in economics in recent years show that economic growth and unem-ployment are indirectly related to the economic complexity index of countries. In terms of their current production structures, these countries produce and ex-port labor-intensive products with low income elasticity. However, the increas-ing of value-added of these products to the national economy is quite low. In ad-dition, since these sectors have limited knowledge, skills and productivity levels, the spread effects to other sectors remain still very low. In this respect, it can be foreseen that the countries that have a plan to transform their production struc-ture from low-yield products to high-yield products will grow faster compared to the countries that do not perform structural transformation. (Hausmann et al., 2007). According to the classical foreign trade theory, structural transformation emerges as a result of comparative advantage. According to Heckscher-Ohlin’s the-ory, the factor density of the country is the determinant of the structural trans-formation (Hausmann & Klinger, 2009). According to these theories, it does not matter what is produced or exported to overseas counties. It is more impor-tant how much products are produced and how much money or returns has got from products. In other words, it is more important for countries what kind of content they are sold out for other countries rather than how much product is produced and how much product is sold out (Rodrik, 2006). Therefore, the in-dex of economic complexity, which is known as an indicator of the efficiency of a country’s output and the high content of its information content, is at the fore-front for countries that produce advanced technology and higher product diversity.
1 Nigde Omer Halisdemir University, Turkey

44
THE RELATIONSHIP BETWEEN ECONOMIC COMPLEXITY AND UNEMPLOYMENT RATE
İbrahim OZAYTURK
The aim of this study is to explain the effects of the economic complexity index which shows how much technological content the economy can produce and the relationship with unemployment rate through export. In this respect, first of all, economic complexity index, how this index is calculated and the commodity groups subject to trade of this index will be emphasized. Afterwards, similar studies will be included and the last section will be related to export and unemployment.
Economic Complexity Index (Eci)
In the mercantilist period, the precious metals such as gold and silver were kept in the country and the land came to the forefront with the Physiocrats and the importance of trade with the classics caused the free trade to progress with the industrial revolution. It can be said that the industrial revolution has played an ignorant role in the importance of foreign trade. Besides, it is known that the history of the modern economy which started with Adam Smith and the spe-cialization of the countries that started with David Ricardo will be reason of in-creasing of the country’s trade and the economic development over time. Towards the end of the 20th century, trade volumes between countries have started to in-crease and getting better. In parallel with the developments in communication and transportation technologies, it is becoming more evident that only the pro-duction factors and final goods produced by countries do not contribute much to the national economies after a certain point. With this point, the importance thing for the countries have become generally what they produced and how much knowledge and experience they used for their production rather than finding a place in trade world and the excess amount of the products they produced. These contributions have enabled the product to become a sophisticated product and to be subject to more convenient international trade, economic and social de-velopment of the countries, and as a result, going down of unemployment rates.
With these all thing, a new sentence emerges for international trade literature which is sophisticated product. The sophistication of the products means that the products produced with using more knowledge and skills. Hasumann et al. (2006) started to calculate the values of using knowledge and skills in the related products by using the method that they called economic complexity and they put forward with the first scientific article in 2007 about economics complexity. Under the leadership of Richard Hausmann and César Hidalgo (2011), the At-las of Economic Complexity, prepared at the Harvard International Development

PERSPECTIVES ON MODERN ECONOMY
Aizhan KHOICH, Ali Eren ALPER, Ahmet Arif EREN
45
Center, aimed to measure the accumulation of knowledge in the production pro-cess of countries. In this context, Economic Complexity Index (ECI) was prepared with 129 countries and knowledge in production is categorized on the basis of a society’s ability to produce certain products, experience and general knowledge. In the atlas; it is stated that countries with high number of ECI value have long years of knowledge in producing diversified and complex products and also tech-nical knowledge obtained from production. One measure of knowledge in so-ciety is the products it produces. The acquired knowledge and innovations pro-vide these countries with a sustainable growth potential. The more knowledge the country has about the production process, the higher its per capita income is expected to be. According to this report; the most complex products, chemi-cals and machinery; the least complex products are raw materials, also called pri-mary goods, and simple agricultural products. Hausmann and Hidalgo (2009) put forward this index and information about the complex products are defined by themselves as follows. It is the order of values that show the compositions of the productive productions of the countries and reveal the knowledge and skills in these products. In addition to this definition by the creators of the index, Saleh et al. (2017) tried to make a definition by trying to find answers to the question of how much information is used in an economy. According to them, the eco-nomic complexity measures the amount of information that can be obtained in the economy and accordingly can be determined in economic growth.
Likewise, in the general definition of economic complexity, it is a title that ex-plains to us how much information and technology a country uses in its prod-ucts. It enables countries that can produce high-tech products and have the ca-pacity and competence to produce these products, by using these advantages and also they can sell their products with higher added value within the inter-national commercial network to which they are connected. It is seen that the countries with high economic complexity index are more advantageous in the international trade network compared to the countries with low index in related products, and thus they can sell their products at higher prices easily, rather than engaging in international competition. At this point, countries’ investments in technology and knowledge can contribute positively to the strengthening and development of their foreign trade and economic structures. In addition, eco-nomic complexity is defined as indirectly measuring average productive infor-mation distributed to individuals and institutions of a country. In other words, complex economies are countries that can combine large amounts of productive

46
THE RELATIONSHIP BETWEEN ECONOMIC COMPLEXITY AND UNEMPLOYMENT RATE
İbrahim OZAYTURK
knowledge to produce sophisticated products. In contrast, simple economies can only produce less diverse and simple products based on limited produc-tive knowledge. Unfortunately, productive information is not directly capable of being produced. Therefore, we can measure economic complexity indirectly from the products made by countries. The reason of that economic complexity emerges and embodies the products that a country can produce. Moreover, the economic complexity index, which shows the product diversity and informa-tion intensity in the export compositions of the countries, is an important in-dicator to show that countries can exist in international competition and make this competition sustainable (Şeker, 2019).
The most general definition that can be made on the basis of all these definitions is as follows; countries with high economic complexity index in international trade are more advantageous in terms of exports compared to other countries with low economic complexity index. Similar to David Ricardo’s comparative superiority theory, which takes Adam Smith’s theory of absolute superiority one step further, it is found that a country produces higher yields and income than products pro-duced that such products are related to exports by using information and tech-nology. Again, with a similar idea to that of Ricardo’s theory, it is a fact that the production of products that use less information and technology will not provide much advantage, and therefore the production will not bring any benefit and pro-duction can be a waste of resources. For this reason, it is obvious that it would make more sense to import cheap way rather than production. It is not known whether economic complexity was predicted by Hausmann and Hidalgo (2009), but it is a fact that it covers a huge research gap. Hidalgo and Hausmann (2009) also based their explanations on the concept of economic complexity on Smith’s idea of division of labor and specialization. Based on Adam Smith’s view that the specialization of economic agents in different areas would increase economic ef-ficiency, the authors reminded that the boundaries of the division of labor were determined by the market and that the division of labor and specialization could be achieved more easily, the development and prosperity depended on the com-plexity of numerous individual activities affecting the economy.
From this point of view, the authors make a distinction between “complex” and “simple” economies (Hausmann et al. 2018). Complex economies are econo-mies that are able to combine large interrelated information through large hu-man networks to produce a variety of knowledge-intensive products. Simple

PERSPECTIVES ON MODERN ECONOMY
Aizhan KHOICH, Ali Eren ALPER, Ahmet Arif EREN
47
economies, on the other hand, are economies that have more productive knowl-edge and produce simple products that require a smaller network of interaction. Knowledge, skilled labor and other production factors used in the production process can only be used in the production of close and similar goods. (Arıcıoğlu, Coşkun & Tuncer, 2017). The more diverse and unorthodox products a country produces, the more export markets are expected to be competitive in high val-ue-added products. So, the economic complexity is really important. If the eco-nomic complexity index reflects the level of knowledge and production of the countries, the economic complexity index is expected to be linked to the wealth level of the countries. In addition, there is a strong relationship between the ECI and GDP per capita. Strikingly, as the only information used in calculating the economic complexity index, the ways in which products are made with relative superiority are tried. According to the complexity approach, the level of knowl-edge established in a society is not based on the total knowledge level of individ-uals. Rather, it depends on the diversity of knowledge among individuals and on the ability to exchange this variety of information. This occurs in a complex in-teraction network, and in complex structures the total value is greater than the sum of the individual characteristics. This is what distinguishes modern society from traditional society. What is characteristic of modern societies is not the fact that everyone has more information, but the ability to collectively use the large volume of information that everyone has a small part of. In this sense, economic complexity is also closely related to the welfare levels of countries. Countries with a higher level of economic complexity tend to grow at a data-income level faster than countries with a much lower level of economic complexity. In this sense, eco-nomic complexity is more than a sign or expression of prosperity, it is the driv-ing force. (Hausmann et al., 2018). As the calculation of economics complex-ity could find easily on some sources, it may be useful to give an index covering the past 5 years and covering 5 countries. Table 1 gives us the 5 countries with the highest economic complexity index and the production efficiency of these countries. As it is known, the export figures of the countries with high economic complexity rates are also increasing. This brings down the unemployment rate.

48
THE RELATIONSHIP BETWEEN ECONOMIC COMPLEXITY AND UNEMPLOYMENT RATE
İbrahim OZAYTURK
Table 1: 5 Countries with the highest ECI from 2013 to 2017
2013 2014 2015 2016 2017
1 Japan 2,37352 2,31842 2,29751 2,27406 2,30938
2 Switzerland 2,05181 1,99456 2,15805 2,22117 2,24386
3 Germany 1,84608 1,81367 2,09809 2,08459 2,07537
4 Singapore 1,71717 1,71171 1.746 1,79973 1,86534
5 Sweden 1,75214 1,6459 1,92429 1,86277 1,80773
Source: The Observatory of Economic Complexity, https://atlas.media.mit.edu/en/rankings/country/
In the literature review, it is seen that there are different studies on economic complexity and the relationship with unemployment is handled in different as-pects. The studies and the results can be listed as follows. The definition made by Adam et al. (2019) is called the economic complexity index which is used to measure the amount of information and technology usage in the products that countries produced in general terms. To explain this situation, they are based on electronic products produced by countries. In this study, it is concluded that pro-ducing highly sophisticated products brings less unemployment and positively af-fects employment in another sentence.
Another study which was conducted to establish the theoretical infrastructure of economic complexity was tried to reach the relationship between economic complexity and unemployment by using growth data. The first of these studies is Hausmann et al. (2011) belongs to Atlas of Economic Complexity. In the rel-evant study, all countries included in the data set are included in the model. As a result of the study, it was concluded that economic complexity contributed posi-tively to growth and as a result there was a negative relationship with unemploy-ment. Another study was conducted by Poncet and Waldemar (2013). In this study, the effect of economic complexity of 200 Chinese cities on growth is ex-amined. As a result of the study covering the years 1997-2009, it concluded that economic complexity had a positive effect on unemployment, in other words, it decreased the unemployment rates. Bhorat et al. (2019) investigated the relation-ship between economic complexity and unemployment rate and discussed the case from South Africa. They concluded that economic complexity had a posi-tive effect on the increase of the labor force in this country in the long term and that this was the result of economic growth.

PERSPECTIVES ON MODERN ECONOMY
Aizhan KHOICH, Ali Eren ALPER, Ahmet Arif EREN
49
Ann Bartel et al. (2007) approached the subject from a slightly different angle and examined the effects of information technologies on productivity increase. They looked at the effect of producing more technological products on productivity, increase in production and increase in product quality. As a result of the research, they concluded that producing more technological products is an increase in the quantity and quality of the product produced and therefore the reason for pre-ferring the product. McMillan et al. (2014) tried to explain the increase in pro-ductivity by taking into consideration the redirection of the workforce from less productive to more productive sectors. As a result of the study involving Latin American, African and Asian countries, it was concluded that Latin American and African countries failed to direct their labor force to productive sectors, while Asian countries overcame the situation and achieved an increase in productivity.
Hidalgo (2009), has made a research that was between 1962-2000 and the sam-ple countries were Brazil, Indonesia, Turkey, Thailand, South Korea, Singapore and China. By the result that South Korea, Singapore and China have increased their economic complexity. However, Brazil, Indonesia and Turkey, has not yet reached the desired level concluded that the structure of production to the man-ufacture of sophisticated products even though they are in that situation, al-though the change effort. However, although Brazil, Indonesia and Turkey, have increased their efforts in building production for international market, sophisti-cated product has not yet reached the desired level for the production. Hartmann et al. (2018), on the other hand, attributed income injustice to economic com-plexity. The findings provide information about the production of the income of an economy and the distribution of this income in a fair way. It concludes that the countries above the economic complexity index are in the lower ranks of the unjust distribution of income.
Economic Complexity And Unemployment Rate
The increase in the economic complexity that described in the previous sec-tions is an important factor that increases the competitiveness and demand ra-tio of the products produced in a country for international markets. Increasing of complexity is due to the using of higher technology in the products that is produced. Recently, countries have gained importance in research and develop-ment in order to be forever in international trade. High-tech products that re-sult from this kind of research and development enable countries to find a place

50
THE RELATIONSHIP BETWEEN ECONOMIC COMPLEXITY AND UNEMPLOYMENT RATE
İbrahim OZAYTURK
in international competition. On the other hand, in order to talk about the ef-fects of economic complexity on the labor market or on unemployment, it will be useful to define unemployment in general terms. There are different types of definitions of unemployment from different economic schools. Although these definitions are similar to each other within the framework of their general prin-ciples, they can be distinguished by being bound to a number of conditions. In terms of dictionary, unemployment is the person who does not have a job to work for a wage at a certain date. However, according to some authors, a person must be actively looking for a job in order to be accepted as unemployed. According to some authors, in order for a person to be accepted as unemployed, a person should not only be looking for a job but also be capable and capable of doing that job. According to the Keynesian view, unemployment is the excess of labor resulting from the failure of coordination of the market economy. On the other hand, according to the classical view, unemployment is the job search process in which people involved in production work strive for a better employer-worker meeting. Unemployment, which is actually a social problem, can arise for a va-riety of reasons, and manifests itself in a variety of ways. In countries with high economic complexity index, producing high-tech products can have different ef-fects on different labor market.
Producing high-tech products affects to countries both labor markets positively and negatively, in other words, producing high-tech products can be considered as advantageous and disadvantageous for the labor force. These advantages could be emerged different ways for counties and provide several advantages for coun-tries employment rates. Since the product produced with the high economic index is expected to be in high demand in foreign markets, it is expected that new production sites will be created, new business lines will be formed in re-lated products and more investments will be made in these business lines. These business lines create new labor requirements for the products subject to export and increase the demand for related product of labor. Therefore, additional em-ployment provided by countries with high economic complexity index for each product produced using information and technology will reduce the unemploy-ment rate of the country concerned and create new labor force. If information and technology are used effectively for each product produced, this will create new employment for each sector and increase the need for labor in the relevant sector. This need for labor will be covered by a trained labor force and will help to bring down the unemployment rate in the country. In addition, the need for

PERSPECTIVES ON MODERN ECONOMY
Aizhan KHOICH, Ali Eren ALPER, Ahmet Arif EREN
51
intermediate staff in the related sector may arise and may also have a positive im-pact on the unemployment rate.
The development of foreign trade in open economies, the increase in the labor force working in the fields related to foreign trade and carrying out export-im-port transactions and processes can also be considered as a positive effect of eco-nomic complexity. In addition to the positive impact of exports, which increase with the use of information and technology on the economy of the country, it causes an increase in the trained workforce carrying out these transactions. The employment of well-equipped personnel who will conduct the export process in a healthy way will increase. In addition, the introduction of money into the coun-try along with exports may lead to a healthier financial system and more money to enter the system. This may cause the financial system to become even stronger and the market to find the desired loan in an easier and cheaper way. This may lead to an increase in investments and new employment in sectors other than for-eign trade. In this way, new jobs will be created and the unemployment level will be lowered. Considering all of these, it is a fact that countries with high economic complexity index have an advantage in competition and selling products in the in-ternational market and can use this knowledge and technology effectively to turn this competition into an advantage. It can be said that this provides an opportu-nity for countries to reduce unemployment rates and create new business lines, employment increases with economic development, and economic development is faster and easier for countries that are producing sophisticated products. All of these can be demonstrated by various methods or can be supported by accurate and reliable data. On the other hand, despite the economic complexity had sev-eral positive effects on unemployment rate for country’s labor force, some nega-tive aspects also could be counted for labor market. The first example may have given that the more unskilled labor force will become unemployed since produc-ing high technology products requires high educated and high skilled employ-ers. Therefore, unskilled person will not be in the producing process because of person who does not have enough educated level and experienced background for producing of goods.
The second example could be given from producer side. The producer creates the labor-capital combination so as to produce the lowest cost. The fact that the development of the economic complex entered the production process at a very rapid pace started the automation period in production and naturally reduced the

52
THE RELATIONSHIP BETWEEN ECONOMIC COMPLEXITY AND UNEMPLOYMENT RATE
İbrahim OZAYTURK
use of labor and the level of employment decreased and technological unemploy-ment emerged. Economic complexity and therefore the use of more knowledge and skills in production explains a significant part of the problem of unemploy-ment (Ataman, 1998). Advocates of this thesis argue that substituting machin-ery for labor will increase unemployment, but these authors are concerned that the cost of computing technology will rapidly decrease and labor cost will con-tinue to increase (Orhan et al., 2014). In other words, the developments created by economic complexity and the priority of knowledge in production increase labor costs for enterprises. Although economic complexity increases labor costs in terms of enterprises, there is also a cost reduction effect in the part related to globalization. The development of information technologies plays a key role in the rapid development of production in the globalization process. Along with sharp decreases in communication costs, parallel landings in transportation costs enable production costs to be minimized by re-shifting the production system to low-cost regions. This kind of development, foreign investments will be directed towards developing countries directly (Orhan & Savuk, 2014).
The most important result of small-scale production in terms of labor is the con-traction of employment. For one thing, new technologies are handing over to many robots that were previously hand-held on human machines. Software-ca-pable, reprogrammed robots can handle many routine or standard tasks without human intervention. In fact, the main purpose of computerized production sys-tems is to save production from human intervention (Ozaki, 1992). In addition, the high level of automation, which is described as the third industrial revolu-tion, has led to the emergence of factories capable of operating only a few quali-fied technicians. As a result of new approaches to the problem of unemployment, automation is the most important factor causing changes in the labor market. Automation affects the factors that determine both labor supply and labor de-mand. The way it affects labor demand arises as less demand for labor as a result of increasing or emerging economic complexity. Less manpower will be needed to produce in the next century though automation in industry. So the value of labor will no longer be determined in terms of productivity, there are machines that replace the arm strength (Ataman, 1998).

PERSPECTIVES ON MODERN ECONOMY
Aizhan KHOICH, Ali Eren ALPER, Ahmet Arif EREN
53
Economic Complexity And International Trade
The importance of free trade along with the classics view and the production of goods for international markets have led to the differentiation of the countries’ production. High value-added products are an indicator of differentiation at this point, and are also key to achieving prosperity growth in a country. It is very im-portant that the product sold in the world is qualified and non-price competi-tive. Producing high value-added goods brings more income to countries and in-creases their welfare levels. The fact that producer countries aim higher in terms of quality and price in the products they sell to the world markets, necessitates them to produce high value added products compared to other manufacturers. The economic complexity index value measures how diverse and widespread the export basket of a country is. The widespread production by many countries in-dicates that the product is ordinary. It can be interpreted that as the ordinariness of the product increases, its quality decreases. Therefore; The high value of eco-nomic complexity index also shows the potential of countries to sell its products with high added value (Akın & Güneş, 2018).
The Economic Complexity Index, prepared by Hausmann and Hidalgo, provides information on the extent to which countries differentiate their products and pro-duce goods with high added value. This high value shows that countries produce products by using more knowledge and skills, and the possibility of the product being preferred by other countries at some point. It is a fact that when the ordi-nary of the produced product increases, the quality of that product decreases and the chances of being preferred also decrease. On the contrary, as the percentage of knowledge and skills used in the manufactured product increases, the price flex-ibility of that product in international markets will increase. It is clear that this index, which was prepared by Hausmann and Hidalgo (2009), has an important place in explaining the export potential of countries. Here it is useful to make the following definition. When international trade is discussed, it should be re-membered that the countries that have an open economy exchange with each other. When two or more countries are taken into consideration, send the prod-uct produced to another country is an exporter, while the exporters are deemed to have made the importation. Trade between these countries is also called for-eign trade of countries. At this point, the economic complexity index is expected to be high in order to choose the product produced by the exporting country.

54
THE RELATIONSHIP BETWEEN ECONOMIC COMPLEXITY AND UNEMPLOYMENT RATE
İbrahim OZAYTURK
The high level of economic complexity index can also be measured through pat-ent applications by countries. This type of measurement is only one of the ways. Before describing the contributions of patents, it is useful to give a definition of the patent. Patents are the documents that enable individuals to “produce, use, sell or import technologies for a period of time (Dereli & Durmuşoğlu, 2007). The patent document shows that the inventor has the right to use his opinion, ex-plain, marketing and authorize others to use it (Eren & Kılıç, 2016). In line with these definitions, the number of patents owned by countries shows the number of inventions and inventions made within the country and reflects the importance they attach to research and development (Şeker, 2019). The number of patents also reflects the innovative sides of those countries and gives information about the knowledge and experience used in production with this innovation (Ang et al., 2015). In addition to the surplus of patent applications, another way to in-crease the index of economic complexity is to produce production costs at an appropriate level for international markets. And it is also necessary that products produced with high technology and the qualified labor and R & D expenditures required for this should be at reasonable levels. First of all, it is useful to define of R & D. R & D is defined as systematic and creative studies about the emer-gence of new products and production processes (Koçakoğlu & Bayraktar, 2019). R & D studies include the studies to produce new products that will enable the development of science and technology (TOBB, 2004). In today’s world where globalization and competition is intense, countries can only export high quality products when they can produce at an affordable price (Özer & Çiftçi, 2009). Developed and developing countries do not only produce innovations made as a result of R & D activities, but also export them to the domestic market. Ad-dressing the foreign market through exports also reduces the unit costs of R & D investments and this encourages R & D activities (Göçer, 2013). Information and communication technologies create time and cost advantages by accelerating all kinds of information flow required for production, and enable the production of goods and services at a lower cost in a shorter time and increase productivity and demand (Bongo, 2005). How the economic complexity is important for ex-porting countries emerged from this point onwards? It is seen that the countries that invest in R & D at the required rate have reached the technological compe-tencies and provided competitive advantages in the international markets, have established strong places for themselves and obtained permanent customers. On the other hand, in addition to the benefits provided by R & D, the following can be stated. It should be noted that R & D is a benefit of economic complexity to

PERSPECTIVES ON MODERN ECONOMY
Aizhan KHOICH, Ali Eren ALPER, Ahmet Arif EREN
55
products. Developed countries that export R & D intensive industrial products maintain their trade balance or give lots of surplus. The reason for this may be the fact that the demand for advanced technology products in the international markets has higher income elasticity than other products. Assuming that income elasticity of demand is decisive, it can be said that the share of advanced technol-ogy products in international trade will increase more during expansion periods than in the contraction periods of the world economy (Çelebi, 2002).
Economic complexity also increases the quality of the product produced and helps countries to gain advantage in international trade. The aim of the technical in-novations and advancements of advanced countries with advanced technology in areas such as microelectronics is to improve quality, reduce product costs and de-velop new products (Freeman, 1989). In this way, developed countries are gain-ing advantage in international markets by producing better quality and cheaper goods. On the other hand, as emphasized in the technological deficit theory, new products produced are exported to developing countries that do not have this in-novation before technological innovation reaches other countries (Karluk, 1991). Another point is that direct investments are particularly important for countries with a capital deficit as they increase both export and production and employ-ment capacity in the countries. Many studies have also used direct investment inflows as data to explain high-tech product exports due to economic complex-ity (Güneş & Akın, 2019).
In this study, it is stated that countries with high economic complexity index use more information on the products they produce many times and this informa-tion differentiates the product and provides an advantage to countries in foreign trade economically and brings competitive advantage. This information provides knowledge economy for countries. With the knowledge economy, the borders dis-appear and the products have the chance to enter the markets on a global scale. In addition, it is possible to produce new products by obtaining new informa-tion via internet which has an important place in this economy (Yumuşak & Özgür 2007). The ability to produce new products and enter the markets on a global scale affects the production, exports and hence the imports of other coun-tries (Yücel, 2018). As a consequence of all these factors, exporting high-medium or high-tech products is important for countries in terms of achieving sustaina-ble competitive performance in international markets. When the exports of de-veloped countries are examined, it is seen that high technology products have a

56
THE RELATIONSHIP BETWEEN ECONOMIC COMPLEXITY AND UNEMPLOYMENT RATE
İbrahim OZAYTURK
significant importance in exports (Sungur, Aydın, & Eren, 2016). If the share of high-tech exports is high, the welfare level of the country rises, competitiveness increases and the country reaches the level of having an international word (Çapik & Kaygasız, 2018). Exporting high-tech products means high value-added prod-ucts, which is also key to achieving sustainable welfare growth in a country (Io-annidis & Schreyer 1997). Due to economic complexity, the share of technol-ogy-intensive products in global foreign trade is rapidly increasing. The export value of the world’s high-tech products increased from $ 1,158 billion in 2000 to $ 1,947 billion in 2016 (Worldbank, 2018).
Conclusion
In this study, the importance of economic complexity, unemployment, interna-tional trade, export and technological infrastructure has been paid special atten-tion and attention has been given to them. In recent years, the economic com-plexity index is an indicator of how competitive countries are in world trade, and the fact that these data are based on a realistic basis has increased the interest in the index. According to the results of this study, the economic complexity index gives information in terms of how much technology is used in the production of countries, and how much they apply to knowledge and skills. It is seen that the countries applying for knowledge and skills have high indices and are more suc-cessful in producing value added products.Countries with high economic com-plexity index are more competitive in international trade than other countries with low index. The countries that use knowledge and skills more effectively in their products are more successful in exports. They also find themselves more com-fortable customers in international markets, more comfortable in marketing their products and less competitive in price of their products. There are also cost ad-vantages. In addition, it is concluded that the high investment in R & D of the countries with high economic complexity index in terms of quality enables coun-tries to produce better quality products and therefore to be more effective in inter-national markets. In addition, the economic complexity index provides informa-tion on the unemployment levels of countries. It should be noted that, since the countries with high economic complexity index are ahead of the other countries with low index, the educated and experienced labor force has more opportuni-ties to find a job if compared with countries that have lower index. On the con-trary, in countries with a high index of economic complexity, the participation of unskilled labor in business life is just as difficult. At this point, the height of the

PERSPECTIVES ON MODERN ECONOMY
Aizhan KHOICH, Ali Eren ALPER, Ahmet Arif EREN
57
index increases the employment opportunities of educated and skilled labor force, while decreasing the opportunity of unskilled labor force finding employment.
References
Akın T., & Güneş S. (2018 ). Ihracatın Niteliğindeki Artışın Dış Ticaret Had-dine Etkisi: Türkiye Analizi C.Ü. İktisadi ve İdari Bilimler Dergisi, Cilt 19, Sayı 2, 2018 448
Albeaik, S., Kaltenberg, M., Alsaleh, M., & Hidalgo, C. (2017). Improvıng the economıcs complexıty Index. Atlas of Economic Complexity, Harvard University
Antonis, A., Antonis G., & Athanasios L. (2019). Economic complexity and jobs: an empirical analysis. Munich Personal RePEc Archive MPRA Paper No. 92401
Ang, J. B., Madsen, J. B., & Robertson, P. E. (2015). Export Performance of the Asian Miracle Economies: The Role of Innovation And Prod-uct Variety. The Canadian Journal of Economics 48(1): 273-309.
Arıcıoğlu, E., Coşkun N., & Tuncer I. (2017). Türkiye’de İBBS Düzey 2 Bölge-lerinin Büyüme Dinamikleri ve Ekonomik Karmaşıklık Analizi. Ed: Oya S. Erdoğdu, Dilek Temiz Dinç ve M. Aykut Atar, Tasarruf, Sürdürülebilir Büyüme ve Teknolojik Gelişme, Türkiye Ekonomi Ku-rumu, 59-90.
Ataman, B. C.(1998). İşsizlik Sorununa Yeni Yaklaşımlar. AÜ SBF Dergisi, Cilt: 53, Sayı: 1, 1998, 59-72.
Bartel A., Ichnıowskı C., & Shaw K.(2007). How Does Informatıon Technol-ogy Affect Productıvıty? Plant-Level Comparısons Of Product In-novatıon, Process Improvement, And Worker Skılls*
Başterzi, S.(1994). İşsizlik Sigortası; Ankara 1994; s. 7
Bhorat H., Ewinyu A., Lilenstein K., Rooney C., Steenkamp F., & Thornton A.(2019). Economic Complexity and Employment Expansion: The Case of South Africa.
Bongo, P. (2005). The Impact of ICT on Economic Growth. EconWPA Working Paper Series, No. 501008.
58
THE RELATIONSHIP BETWEEN ECONOMIC COMPLEXITY AND UNEMPLOYMENT RATE
İbrahim OZAYTURK
Çapik, A., & D. Kaygısız (2018). Ar-Ge Harcamaları Ve Yüksek Teknolojili Ürün İhracatının Büyümeye Etkisi: Türkiye Örneği Cilt/Volume: 16 Sayı/Issue: 4 Aralık/December 2018 ss./pp. 301-314 E. Doi: http://dx.doi.org/10.11611/yead.463205
Çelebi, K. (2002). Türkiye’de teknolojik yapı ve dış ticaret üzerindeki etkileri. Yönetim ve Ekonomi: Celal Bayar Üniversitesi İktisadi ve İdari Bil-imler Fakültesi Dergisi, 9(1), 157-172
Dereli, T., & Durmusoglu, A.(2007). Patent Alarm Sistemi (PAS), YA/EM’2007: Yöneylem Araştırması. Endüstri Mühendisligi XXVII. Ulusal Kongresi, ,Izmir, 2-4 Temmuz, ss. 624-629,
Dinçer, C. (1997). Avrupa Topluluğu ve Türkiye’de İşsizlik ve İşsizlik Sigortası; Ocak 1997; s. 28
Eren, H., & Kılıç A. (2016). Firmalarda Patent ve Faydalı Model Koruma Stratejisini Etkileyen Faktörler. Uluslararası Yönetim İktisat ve İşletme Dergisi, 12 (28), 189-208
Freeman C. (1989). Technical Change and Productivity. Finance-Development, Vol. 26, No. 3, September 1989, s.46. 5
Hartmann, D., Guevara, M. R., Jara-Figueroa, C., Aristarán, M., & Hidalgo, C. A. (2017). Linking Economic Complexity, Institutions, and In-come Inequality. World Development 93, 75–93.
Genda Y., & Kondo A. (2011). What is Structural Unemployment?. The Japa-nese Journal of Labour Studies, No. 516
Göçer I. (2013). Ar-Ge Harcamalarının Yüksek Teknolojili Ürün İhracatı, Dış Ticaret Dengesi ve Ekonomik Büyüme Üzerindeki Etkileri. Maliye Dergisi, Sayı 165, Temmuz-Aralık 2013, 215-236
Güneş, S. & T. Akın (2019). Yüksek Teknolojili Ürün İhracatı: Lider Ülkeler ve Türkiye Analizi, Sosyoekonomi, Vol. 27(40), 11-29.
Hartmann, H., Adams, H. D., Hammond, W. M., Hoch, G., Landhäusser, S. M., Wiley, E., & Zaehle, S.(2018), Identifying differences in car-bohydrate dynamics of seedlings and mature trees to improve car-bon allocation in models for trees and forests, Environ. Exp. Bot., 152, 7 -18, https://doi.org/10.1016/j.envexpbot.2018.03.011, 2018.
Hausmann, R., Hidalgo, C. A., Bustos, S.,Coscia, M., Chung, S., Jimerez, J., Simoes, A., Yıldırım M. A. (2011). The Atlas of Economic Com-

PERSPECTIVES ON MODERN ECONOMY
Aizhan KHOICH, Ali Eren ALPER, Ahmet Arif EREN
59
plexity: Mapping Paths to Prosperity, Center for International De-velopment at Harvard University and Macro Connections MIT Me-dia Lab.
Hidalgo, C. A.,(2009). The Dynamics of Economic Complexity and the Prod-uct Space Over a 42 Year Period, Harvard Universtiy CID Working Paper, No.189
Hidalgo, C. A., & R. Hausmann R. (2009). The Building of Economic Com-plexity, Proceedings of the National Academy of Sciences of the United States of America PNAS, 106 (26), ss. 10570-10575.
Ioannidis, E., & P. Schreyer (1997). Technology and Non Technology Deter-minants of Export Share Growth. OECD Economic Studies, No: 28, 169-194.
Karluk R. (1991). Uluslararası Ekonomi, Bilim Teknik Yayınevi, Istanbul 1991, s.93.
Koçakoğlu, M., & Bayraktar, O. (2019). AR-GE Harcamaları, Patent Baş-vuruları ve Yüksek Teknoloji İçeren Ürünlerin İhracat Rakamları Arasındaki İlişkiye Yönelik Bir Çalışma. İktisadi Yenilik Dergisi , 6 (2), 120-128
Mcmillan M., Rodrik, D., & Verduzco-Gallo I. (2014). Globalization, Struc-tural Change, and Productivity Growth, with an Update on Africa, World Development, 63, ss.11-32
Orhan S., & Savuk F. (2014). Emek-Teknoloji-işsizlik ilişkisi. ÇSGB Çalışma Dünyası Dergisi, Cilt: 2, Sayı: 2, Mayıs-Ağustos 2014, Sayfa: 9-24
Ozaki, M. (1992). Technological Change and Labour’ Relations, Cenevre, ILO
Özer, M., & Çiftçi, N. (2009). Ar-Ge Harcamaları ve Ihracat Ilişkisi: OECD Ülkeleri Panel Veri Analizi. Dumlupınar Üniversitesi Sosyal Bilimler Dergisi, (23), 39-49
Öngen, T. (1995). İleri Teknoloji ve Çalışma İlişkilerinin Değişen Paradigması, Ankara Üniversitesi SBF Dergisi, 50(2), 279-295.
Poncet, S., & Waldemar, F. S. (2013). Export Upgrading and Growth: The Prerequisite of Domestic Embeddness, World Development, 51, ss. 104-118
Serter, N.(1993). Genel Olarak ve Türkiye Açısından İstihdam ve Gelişme; İs-tanbul; 1993; s.5

60
THE RELATIONSHIP BETWEEN ECONOMIC COMPLEXITY AND UNEMPLOYMENT RATE
İbrahim OZAYTURK
Şeker A. (2019). Teknolojik Gelişme ve Yüksek Teknoloji İhracatının Ekono-mik Karmaşıklık Endeksi Üzerindeki Etkisi: Türkiye Örneği Man-isa Celal Bayar Üniversitesi İ.İ.B.F, Yönetim Ve Ekonomi Yıl:2019 Cilt:26 Sayı:2 ss. 378-395
Standing, G. (1983). The Notion of Structural Unemployment; International Labor Review; Vol. 122 No. 2 March – April 1983; s. 138
Sungur, O., Aydın, H. İ., & Eren, M. V. (2016). Türkiye’de Ar-Ge, İnovasyon, İhracat ve Ekonomik Büyüme Arasındaki İlişki: Asimetrik Ned-ensellik Analizi, Süleyman Demirel Üniversitesi İktisadi ve İdari Bil-imler Fakültesi Dergisi, 21 (1): 173-192.
Türkiye Odalar ve Borsalar Birliği. (2004). Teknoloji Geliştirme ve Yenilik Destekleri Rehberi, S. 3, 10.
Vroman, W.(1999). Unemployment and Unemployment Protection in Three Groups of Countries; Social Protection Discussion Papers of World Bank; Mayıs 1999; s. 20
Worldbank (2018). <https://data.worldbank.org/indicator/TX.VAL.TECH.MF.ZS>, 10.10.2018.
Yücel, Y. (2018). Bilgi Ekonomisi Ve Dış Ticaret İlişkileri: Yükselen Ekonomiler Örneği. Erzurum Teknik Üniversitesi Sosyal Bilimler Enstitüsü Der-gisi, 3(6), 33-55.
61
4LABOR MARKET REGULATIONS AND UNEMPLOYMENTÖzlem ÖZTÜRK ÇETENAK1
Introduction
In each country, a legal and institutional infrastructure has been established to ensure the minimum standard of living of the population. In many countries, this infrastructure is in the interest of sub-legal branches such as labor law, col-lective relations law and social security law. Labor laws, laws on collective labor relations, drafting, adopting and implementing collective labor agreements, or-ganizing labor unions and industrial actions of workers and employers layouts. Social security laws regulate the social rights of individuals in conditions such as old age, disability, death, illness, and unemployment. Also, labor market regula-tions standardize wages, benefits, and what types of employment contracts can be made. It also sets limits for working hours and working conditions, prohibits certain employment-related practices and provides protection for employees. The rationale behind these regulations stems from the various flaws of the labor mar-ket. Some of these flaws include discrimination, lack of information, the lack of equal power of employers and workers in the market, and the inability of the mar-ket to eliminate risks related to employment. However, regulations on the labor market may lead to a decrease in productivity. Regulations can affect the profita-bility and efficiency of companies. If the cost of implementing these regulations is too high, companies may choose to don’t obey business laws.
In this study first, the development and institutionalization process of labor mar-kets will be explained. Then the theoretical framework for labor markets will be addressed and the conceptual framework on regulation will be drawn. Finally, the literature about the relationship between labor market regulations and un-employment will be examined.
1 Dr. Niğde Ömer Halisdemir University, Faculty of Economics and Administrative Sciences, Department of Economics, 51240-Niğde, Turkey. E-mail: [email protected], Tel: +90-388-225-2049

62
LABOR MARKET REGULATIONS AND UNEMPLOYMENT
Özlem ÖZTÜRK ÇETENAK
Development Of Labor Markets In The Hıstorıcal Process
A well-functioning labor market is the cornerstone of a rich economy. labor mar-kets play an important role in the creation of income and output and factor dis-tribution. These markets are also one of the main factors’ markets of the econ-omy. Due to its important role in the economy, it has also been the subject of many studies.
The history of labor markets goes back a long way. In the historical process, new jobs and therefore professions have emerged and work areas have developed. However, until national states are established, it is not possible to talk about the existence of the labor market in today’s sense. First of all, the first condition for the individual to gain the status of workers is that he or she has basic rights and freedoms. The working class in the feudal period in Europe consists of slaves or serfs. During this period, the work is not consensual and working is not an in-come-paid action. For a real labor market to emerge, multiple employers are needed who want to attract paid workers and enter into employment contracts with them. In other words, in the labor market, workers can choose between dif-ferent employers and negotiate their wages. The emergence of such labor markets coincides with the establishment of national states.
As a result of the transition from feudal life to a lifestyle based on money, From the 13th century onwards the landowners started to see their lands as goods with monetary value. As a result of the monetization of economic life, landowners be-gan to use their land in activities that would bring more income. For example, The “Enclosure Movement” was a push in the 18th and 19th centuries to take land that had formerly been owned in common use, and change it to privately owned land, usually with fences around it. To remove the peasant from his land has created a new working class who was landless, deprived of traditional sources of income and weak (Heilbroner, 1968).
The industrial revolution changed the production process and led to the emer-gence of two different classes. On the one hand, the workers who offer their la-bor; on the other hand, owners of capital goods, i.e. capitalists. With the indus-trial revolution, the production process changed, paid working status was born and as a result, worker-employer relations began to develop. The shares of la-bor and capital factors from production are in proportion to their contribution to production. While the owners of the capital receive a return through profits;

PERSPECTIVES ON MODERN ECONOMY
Aizhan KHOICH, Ali Eren ALPER, Ahmet Arif EREN
63
workers receive–agreed with the employer- wage (Deane 1988). First workers’ working conditions were bad and living conditions were quite poor. The capitalist system owes its bad reputation to these conditions of the aforementioned period. The first workers of capitalism, which were cut off from the land and consisted of rough labor, had to work long hours with very low wages. And among these workers, there are even children between the ages of five and six. These workers, whose working hours last up to 16-18 hours, have hardly had time to rest. This period, when many people died from work accidents, led to major labor actions in Europe. Rapid industrialization has led to a change in worker-employer rela-tions. Since the industrial revolution, it has always been discussed how the to-tal revenue as a result of the production activity will be shared among those who produce it. This distributional relationship turns into a power conflict, where the capitalist and the worker confront. Both sides want to get more shares from the total revenue. Once the share of the wage in the total income is determined, the remaining will be profit. The entrepreneur’s profit is the portion that remains af-ter deducting the share from the total income to the wage. The increasing num-ber of the working class with industrialization has turned the question of “how many shares of the production participants will get from the total income” into a “distribution” problem. While the number of proletarian labor increased in the early years of the industrial revolution, the conflict of interest between workers and employers caused grouping among those with common interests. Associa-tions of workers representing a larger group are the first examples of today’s trade unions. The idea that a struggle together would provide greater benefit, initiated unionization. Economic, political and social developments leading to unioniza-tion took place for the first time in the United Kingdom.
In 1800, thousands of union-registered workers in the UK were convicted by the law with the charge of trying to raise wages. In France and Germany, trade unionists were treated as rebels or criminals. The development of trade unions in America was slower than in Europe. The reasons for this delay are the belief in the idea of individualism by workers and employers in the United States, the employment of immigrants as workers in heavy industries and, the efforts of em-ployers against unionization. The first turning point in modern labor law was the British Health and Morals of Apprentices Act of 1802. Similar legislation for the protection of young people was adopted in Zurich in 1815 and France in 1841. In 1848, the first legal limitation of adult working hours was adopted by the Swiss canton of Glarus House. Before the October Revolution in 1917, there

64
LABOR MARKET REGULATIONS AND UNEMPLOYMENT
Özlem ÖZTÜRK ÇETENAK
was almost no labor legislation in Russia. The first major progress was to amend the Factory Act of 1922 to enact the contracts adopted in the first session of the International Labor Conference in Washington in 1919. Sickness insurance and worker’s compensation were spearheaded by Germany in 1883 and 1884. At a time when established trade unions emerged in Europe, there were only skilled workers in the United States. The widespread emergence of trade unions in the United States coincides with the mid-1930s (Heilbroner, 1968).
Workers in the 19th century, have to struggle hard and long to have today’s fun-damental rights around the world during the 19th century. Mandatory arbitra-tion in industrial disputes was initiated in New Zealand in the 1890s. In In-dia, working with children aged 7 to 12 years was limited to nine hours a day in 1881 and 10 hours a day to adult men in textile factories in 1911. In Japan, basic regulations were introduced to work in mines in 1890, but a proposed fac-tory law for 30 years was discussed before it was adopted in 1911. Labor legis-lation in Latin America began in Argentina in the early years of the century and gained strong momentum from the Mexican Revolution, which ended in 1917, just as in North America. this trend was generalized only under the influence of the Great Depression. Progress in labor legislation in Africa has gained impor-tance since the 1940s.
Theoretıcal Framework
The rules governing working life have emerged after the industrial revolution to protect the rights of paid workers. In this context, legal arrangements have been made to protect workers. The relations between worker and employer have been established within the framework of the principle of contract freedom in line with the paradigm of “Laissez Faire Laissez-Passer”. However, the contracting system was unable to protect the worker and it was a necessity to protect and improve the economic and social rights of workers when poverty began in Europe. This requirement ultimately led to the emergence of labor law and the concept of the social state began to develop (Işıklı 1996).
According to representatives of the Classical School such as Smith, Ricardo, Mal-thus, Mill, anyone who wants to work at the current wage level can find a job. According to the rule known as “Say Law”, ‘each supply creates its demand’, there is no excess demand or supply in the market, thus, simultaneous balance in the

PERSPECTIVES ON MODERN ECONOMY
Aizhan KHOICH, Ali Eren ALPER, Ahmet Arif EREN
65
goods market and labor market is achieved. On the other hand, the rules of free competition are a mechanism that automatically enables full employment. The classical view has seen the problem of unemployment as a problem stemming from high wages in cases where free competition is prevented from functioning, and they have explained the problem of unemployment after the emergence of trade unions. In other words, if people agree to work at lower wages, they will be able to find a job. Therefore, they have concluded that if there is unemploy-ment in the economy, this is voluntary unemployment. The main problem at this point is the determination of the wage. In the classical view, the wage is de-termined under the conditions of free competition, so any factor that may affect the determination of wages from the outside will disrupt the classical balance.
Karl Marx, who adopted the labor theory of value like the classics, handled the situation of labor from a different perspective. Based on the labor theory of value, Marx argued that at the end of the capitalist process, wealth would be collected in certain hands and workers would become absolutely and relatively impoverished. This will lead to class conflict. Increased misery, oppression, slavery, humiliation and exploitation strengthen the sense of solidarity among workers and encourage rebellion. The production forces of capitalism conflict with the production rela-tions of capitalism and the relations of production are rapidly changed. In this case, According to Marx, workers will make a revolution and take ownership of the means of production. The public property will abolish private property and workers’ exploitation will cease. This stage is the stage of socialism. Karl Marx came to a completely different conclusion from them using the classical school’s analysis tools. According to him, no matter how well-intentioned the capitalist is, the internal dynamics of the capitalist system cause the value created by the worker to enter the pocket of the capitalist. In such a scheme, it is not possible to create a fair wage.
The classical theory, was insufficient to explain labor markets, as the external fac-tors affecting wage formation became more and more evident every day and these concepts of the new situation of the market were embodied by Keynes’s General Theory published in 1936. According to Keynes, full employment can only be achieved through government policies. Keynes pointed to a reluctant unemploy-ment problem by incorporating regulations such as collective bargaining and le-gal subsistence wages into labor market analysis, which emerged in certain forms up to that time, but were neglected or neglected due to its contradiction to liberal

66
LABOR MARKET REGULATIONS AND UNEMPLOYMENT
Özlem ÖZTÜRK ÇETENAK
doctrine. With Keynes, the problem of unemployment is now defined as not be-ing able to work voluntarily, but not being able to find work even at the current wage level even though they are willing to work. According to Keynes, wages are strict in falling because there is a lower limit set by law. Collective agreements and the presence of trade unions were also included in the analysis by Keynes in determining wages (Ataman, 1999). Keynes’ policies were implemented after the second world war. The post-1945 period was the period when trade unions vis-ibly demonstrated their existence and institutionalization was established in la-bor markets around the world.
When the oil crisis of 1973 was added to the high inflation and unemployment problems that started in the mid-1960s in the European economies, a period of stagflation began. Keynesian policies began to be questioned and criticized with the current economic literature. The developments after the first oil shock re-quired the solution of an unemployment problem that did not accelerate infla-tion. Inflation and the problem of unemployment are not independent and the two are interacting with each other. In other words, there is a competition be-tween unemployment prevention policies and inflation prevention policies. In this case, the target should be optimal employment, not full employment. And optimal employment may not always be full employment (Ataman, 1999). In-creasing competition conditions with the accelerating globalization process after 1980, increasing the supply-side economic outlook, which argues that wage stick-iness and regulations that complicate market functioning lead to underemploy-ment, the quality of labor market regulations has become more important. Dur-ing this period, the aim of achieving a competitive advantage in terms of labor costs by going to deregulation is highlighted (Chang, 2003). In the early 1990s, the number of regulations decreased. It seems possible to explain the “open door approach” of such a clear increase and decrease in the number of arrangements. According to this approach, future regulations of each new regulation make fu-ture regulation more necessary (Addison and Hirsch, 1997).
When the labor law regulations made in OECD countries between 1980 and 2009 are examined, it is seen that most regulations are made on occupational work safety and health. Under the second place of regulations on employment policy and employment promotion, the aim may be to ease the pressure on un-employment rates due to increased labor force participation rates. The third area with the most regulations is training, professional guidance and skills acquisition

PERSPECTIVES ON MODERN ECONOMY
Aizhan KHOICH, Ali Eren ALPER, Ahmet Arif EREN
67
arrangements (Ghose et. All, 2008). One of the most important developments that can be said for today’s labor market is the end of the industrial society and the information society phase has begun. Today, production is not based solely on labor, it benefits from machines. The element of labor in production has not been excluded, only its role has changed. Now, instead of a classical worker, there is a need for the knowledge worker who dominates the machines. Increased pres-sures as a result of multinational corporations and unrestricted capital move-ments are the biggest obstacle for national states to protect their social structures.
Under the name of globalization, capital directed towards developing countries as a result of various legal regulations and heavy social security, taxes, high labor cost and environmental protection in their own countries, forced to deregulate these countries by imposing the governments. With this deregulation, they take the state out of the labor market and make it unable to provide even the basic el-ements of being human such as social security, minimum wage, and protection-ism (Görücü, 2006). Developments in the labor market have also led to a signif-icant change in the understanding of the state. In today’s world, the state is not the one that manages the labor market, but the state that plans manpower re-sources following the needs of the economy.
Labor Market Regulations
The need for the labor market to be regulated by the state arises because the la-bor market rarely operates effectively. Market flaws such as asymmetric knowl-edge, differences between private and social benefits, lack of bargaining power and lack of competition lead to increased welfare of the employer at the expense of the loss of welfare of employees. The reason for this welfare transfer is that the employer has more bargaining power in the labor market than the worker.
The most common flaws in labor markets are the difficulties employers have in monitoring workers ‘efforts or skills in full, and the inability to accurately assess employees’ contribution to the company’s productivity (and therefore know what their fees should be). Knowledge problems also complicate the harmony between employees and vacancies, especially when skills are important. Another flaw comes from market power: if employers dominate their business relationships, wages can be very low, and if labor prevails, wages can be too high. Finally, market mecha-nisms cannot provide adequate insurance against the risk of unemployment given

68
LABOR MARKET REGULATIONS AND UNEMPLOYMENT
Özlem ÖZTÜRK ÇETENAK
the total nature of such a risk (IMF, 2003). Labor market regulation defines in-terventions by governments in terms of quantity, quality and prices for the pro-tection of the workforce for the state (Akalın, 2002: 83). Botego et al. examined labor market regulations in 4 main topics.
• Basic employment rights framework: These are basic employer-employee poli-cies such as anti-discrimination laws, occupational health, and safety laws, con-ditions for contributing to pension funds, policies governing maternity leave, payroll taxes, and minimum wage. These policies aim to govern the relation-ship.
• Employment and dismissal policies: These include employment contracts and policies that control the reliance on workers in the form of part-time, non-per-manent or temporary workers more than permanent workers. The number of hours worked per week and the policies that determine the conditions that employers can lay off workers are also included in this category.
• Policies on unionization: These policies enable employees to better represent themselves in negotiations with employers. This category is the government’s support for unionization and/or the approval and encouragement of collec-tive bargaining mechanisms.
• Direct government provision: These policies include benefits such as social insurance funds and disability and unemployment benefits, pensions and ac-cess to job search tools and vocational training programs. These policies are designed to improve social equality, reduce labor market fragility and help re-duce temporary employment.
Labor market regulations vary considerably between countries. Flexible regula-tions for the labor market mean that market forces are allowed more permission for labor market issues such as setting wages, creating conditions for hiring and firing. In the relevant theoretical literature, Karanassou and Snower (1998) re-jected the notion that cyclical unemployment and structural unemployment were largely independent of each other and focused on the relationship sought between the two types of unemployment. They acknowledged that their unemployment movement spawned mainly as a result of the interaction between labor market shocks and the delayed correction process. In this context, they stated that each shock had the effect of unemployment as a chain reaction and that it caused an-other delay and extended it from the present to the near future. They called it

PERSPECTIVES ON MODERN ECONOMY
Aizhan KHOICH, Ali Eren ALPER, Ahmet Arif EREN
69
the chain reaction theory of unemployment. The relevant empirical literature also shows that stricter labor market regulations can hinder the job creation pro-cess and therefore lead to higher unemployment (Bernal-Verdugo, et al., 2012).
In terms of the units regulating the labor market, regulations can be made by five different bodies (Regini, 2000). These: i.) Laws ii.) Government administrative activities iii.) Collective bargaining iv.) Social parties contributing to the forma-tion and shaping of policies related to the labor market v.) Strong or weak net-works restricting the behavior of labor market actors.
Empirical studies indicate that the unemployment rate has increased in highly regulated labor markets. However, the lack of regulation, especially in markets where labor supply is high, results in low wages. Low wages mean a reduction in the income of the working class, which makes up a large proportion of the pop-ulation in many countries. This reduction brings with it many different macro-economic problems arising from lack of total demand, especially injustice in in-come distribution. For this reason, labor markets are regulated for many reasons such as guaranteeing the income of the worker within a certain period, improv-ing working conditions, combating poverty, improving the quality of labor sup-ply. Empirical studies outlined above on labor market regulations have often con-cluded that regulations lead to higher unemployment rates. In particular, strict market regulations deter the employer to create jobs. Another problem that arises in markets where there are strict regulations is the widespread employment of un-registered workers. Although regulations on the labor market have negative ef-fects on employment, these regulations are implemented in almost every country.
Public interest in labor markets is not limited to classic business and worker matching or worker employment. The public authority draws the boundaries of the labor market through public employment institutions, which is the visi-ble hand in the labor market and affects labor markets in various ways through legal and institutional regulations. Public interference in labor markets may in-clude protective or restrictive measures depending on the situation and may dif-fer for the intended purpose. Although the methods differ, the intervention aims to obtain several results that cannot be achieved by the functioning of the labor market itself (Biçerli, 2011).
Regulations are a social phenomenon and are based because unemployment af-fects not only the unemployed individual but the whole society. One of the main

70
LABOR MARKET REGULATIONS AND UNEMPLOYMENT
Özlem ÖZTÜRK ÇETENAK
reasons for public intervention in labor markets is to explain externality. When the unemployed individual is employed and unemployment ends, it will contrib-ute not only to him but also to society through positive externalities. Unemploy-ment, on the other hand, will lead to inefficient use of resources and negative externalities such as increased crime rates and drug use. In this context, the un-derlying reasons for the state’s intervention in the labor market can be grouped as follows (Tuna & Yalçıntaş, 1999; Sayın, 2002):
• Humanitarian, religious and health-related causes: Poor working condi-tions, especially the harsh employment of persons unsuitable for their physi-cal structure, the threat of epidemic diseases due to work and environmental reasons to threaten the whole of society, reactions of active religious institu-tions to these events.
• Military Reasons: The threat of the state’s manpower depleting due to the negativity in working conditions during the war.
• Economic Reasons: Forcing the workforce to work above normal to make more profits will not lead to an increase in production. On the contrary the negative impact of the workforce cause problems in the whole economy.
• Political Reasons: Concerns that heavy work conditions and poor working relations after the industrial revolution will strengthen the emerging socialist ideas and this will lead to the collapse of the system.
• The pressure of the working class: Organizing the working class against the state (or capital or other political power parties) as a political force.
For the reasons listed above, countries carry out the policies they have set for reg-ulating labor markets through various institutions within the legal framework they set. The objectives of these institutions are as follows (Görücü, 2006):
• Filling the open jobs in the labor market as soon as possible and with the most appropriate workforce,
• Regulation of the labor market in such a way as to determine the current and future labor demands and needs and to ensure the realization of the labor sup-ply following these needs,
• To carry out appropriate programs and studies to create new employment op-portunities in the labor market,

PERSPECTIVES ON MODERN ECONOMY
Aizhan KHOICH, Ali Eren ALPER, Ahmet Arif EREN
71
• To help those who enter the labor market for the first time and those who are unemployed.
• Preparation and implementation of special programs for the adaptation of the working or unemployed, having problems adapting to the labor market,
• Vocational training, vocational guidance, providing vocational courses to the unemployed and job seekers, providing services on adaptation to work and working life,
• Providing consultancy services for employers,
• Incentive practices for creating or protecting employment,
• Management of monetary resources that will provide employment.
Studies investigating regulations on the labor market use different indicators of regulations or create their own data sets. variables related to labor market regu-lations differ according to the way they intervene in the market or the variety of legal/institutional instruments. The most widely used indicator representing la-bor market regulations is the Labor Market Regulatory Index. The index is pub-lished by the Fraser Institute. The most prominent labor market regulations are minimum wages, layoff arrangements, central wage determination, expansion of trade union contracts to include non-participating parties, and compulsory mil-itary practices. The labor market regulation index is designed to measure the ex-tent to which these constraints exist. High scores in evaluating the components of the labor market mean that the conditions of hiring and firing in a country and wages are determined by market forces and that there is no compulsory mil-itary service. The index is calculated by taking the arithmetic average of the six sub-indices listed below.
• Hiring regulations and minimum wage
• Hiring and firing regulations
• Centralized collective bargaining
• Hours Regulations
• Mandated cost of worker dismissal
• Conscription

72
LABOR MARKET REGULATIONS AND UNEMPLOYMENT
Özlem ÖZTÜRK ÇETENAK
Relationship Between Labor Market Regulations And Unemployment: A Brıef Overview Of The Literature
Analyses of labor market regulations are based on two complementary approaches. The first group of studies directly looking at the relationship between unemploy-ment and labor market institutions. The second group of studies is based on sim-ulations carried out with the IMF’s new Global Economic Model (GEM) and consists of macroeconomic models including detailed descriptions of labor and goods market defects (Laxton and Pesenti, 2003). The common findings of both approaches are as follows:
• Comprehensive and competitive reforms can bring significant gains. Both ap-proaches suggest that well-designed labor reforms can lead to an output gain of about 5% and a drop in the unemployment rate by about 3%.
• Reforms need to be comprehensive; partial reforms may be less effective, es-pecially when the labor market is not competitive.
• When labor markets are more competitive, the economy reacts more quickly and smoothly to changes in interest rates. This facilitates the task of the mon-etary authorities.
Studies examining the relationship between unemployment and labor market regulations try to answer two basic questions: i) How do regulations well explain the changes in the phenomenon of unemployment? ii) Which labor market reg-ulation is the most successful?
Many studies in the literature provide evidence of highly regulated labor markets rising unemployment rates. It has been found that more unionization is associ-ated with higher unemployment. High layoff costs or strict labor standards often lead to higher average unemployment. Labor taxes tend to increase unemploy-ment, including direct taxes on household stipends and social security contribu-tions. If trade unions have strong enough bargaining power, higher labor market taxes are more likely to be absorbed by employers and allow market mechanisms to function fully on employment will have a smaller effect than the one given. reductions in unemployment benefits and the relaxation of regulations on spe-cific term employment contracts have found that some OECD countries play an important role in reducing unemployment rates. Payments such as severance pay lead to increased unemployment. Scarpetta (1996) analyzed the data of OECD

PERSPECTIVES ON MODERN ECONOMY
Aizhan KHOICH, Ali Eren ALPER, Ahmet Arif EREN
73
member countries and demonstrated one of the pioneering studies on this issue. The findings of Scarpetta’s study include:
• High unemployment benefits are likely to lead to higher unemployment lev-els and reduce the rate of labor market compliance after an external shock. In some OECD countries, the increase in the replacement rates in the last two decades is estimated to have led to an average increase of 1 to 3 percentage points in structural unemployment.
• Tight employment regulations are likely to significantly increase balance un-employment rates. These regulations have a positive impact on young people and long-term unemployment.
• As previous studies have shown, the bargaining power of the worker appears to be associated with higher unemployment, even though the impact is weak.
• Active labor market programs (ALMPs) appear to harm unemployment.
The complementarity between labor taxes and the nature of collective arrange-ments examined by Daveri and Tabellini (1997). Their analysis relates to 14 coun-tries during the period 1965-1991. They find a correlation between the negative influence of labor taxes on labor market performance and the nature of workers’ organization. Decentralized or centralized countries perform better in terms of lower unemployment rates, regardless of the level of labor tax. S. Nickell (1997) used data from western European and North American countries from 1983 to 1996 to conclude that strict regulations on the protection of employment had no significant impact on total unemployment. However, regulations have a statisti-cally significant and negative effect on long-term unemployment.
J. Elmeskov et al. (1998) investigated the data of OECD member countries with the OLS Random Effects Model between 1983-1995. They extend the previous analysis considering previous institutional developments and testing for potential interactions between policies or institutional factors. The main conclusion is that the accomplishment of successful countries may be owed to reforms controlled by insiders. In particular, the tightening of eligibility requirements and the reduc-tion of unemployment benefits and the facilitation of fixed-term contracts may have a decisive effect. The authors created a new indicator that characterizes the wage-setting system and summarizes degrees of centralization and coordination. In countries with a moderate degree of centralization coordination between ac-tors can be particularly important. Elmeskov et al. also provide evidence for the

74
LABOR MARKET REGULATIONS AND UNEMPLOYMENT
Özlem ÖZTÜRK ÇETENAK
interaction effects hypothesis. First, the average tax swap and employment protec-tion regulation push the structural unemployment rate to a higher level in coun-tries with corporatism at the intermediation level. Furthermore, in countries with relatively high levels of active labor market spending, unemployment benefits are likely to have a higher impact. While the degree of protection of employment is not significant, the impact of unemployment benefits is expected to be higher in countries with high employment protection, while the bargaining power of workers is assumed to be greater. As a result, according to the results of the anal-ysis, there is a positive relationship between strict protection of employment and unemploymentDiTella and Culloch (1999) analyzed data from OECD member states from 1984-1990 using the Fixed Effects Model. According to the results of the study, increased flexibility in the labor market increases labor force partic-ipation along with employment. Using the Nickell and Layard (1999) Random Effects Model, he investigated the impact of the degree of rigidity in maintain-ing employment in OECD member countries on short-term unemployment. Ac-cording to the study findings, the degree of rigidity in maintaining employment does not affect short-term unemployment and has a positive effect on long-term unemployment, but it does not make sense.
Belot and van Ours (2000) used data from eighteen OECD countries for the period 1960-1995. In the analysis, the relationship between the unemployment rate and the labor market institutional variables such as tax rate, substitution rate, employment protection, union density, union coverage, bargain coordina-tion was investigated. The analysis shows that the interaction effects are impor-tant. For example, the Replacement rate increases unemployment if labor taxes are reduced while trade union coverage and bargaining coordination are high and union density and employment protection are low. The result of the study is two-way. First, for some countries, the interaction effects of institutions in the market are more important than direct effects. second, financial incentives deter-mine the direction in which the unemployment rate moves for most countries. If financial incentives such as tax deductions are applied, unemployment decreases and unemployment increases if financial incentives are weakened. After all, there is a clear correlation between unemployment and specific combinations of labor market reforms.Blanchard and Wolfers (2000) investigated the causes of unem-ployment in Europe in their work. According to the results of the study, the in-crease in the real interest rate increases unemployment by reducing the demand for investment and labor. There is poor evidence that high real interest rates are

PERSPECTIVES ON MODERN ECONOMY
Aizhan KHOICH, Ali Eren ALPER, Ahmet Arif EREN
75
associated with high unemployment in industrial countries. The real interest rate is likely to be lower in the future than soon. Institutions are also slowly becom-ing employment-friendly. The analysis results show that a more favorable macro-economic environment and improvement in institutions should lead to a signifi-cant decrease in unemployment. Saavedro and Torero (2000) in their analysis of Peru concluded that the impact of job security provisions on employment was negative. Botero et al(2004). Using examples of 85 countries and labor regula-tion data from 1997, they found that stricter employment laws were associated with higher unemployment rates, especially among young people.
Another group of studies on the flexibility of the labor market found that higher labor market flexibility was associated with lower unemployment. Bande and Kara-nassou (2009) investigated regional unemployment rate differences in the labor market in Spain and found that regional labor market flexibility had an impact on the unemployment rate.
Many studies using different analysis methods have also concluded that flexible labor market conditions reduce unemployment. Feldman (2009) analyzed the ef-fects of labor market regulations on unemployment in the world in 2000-2003 using data from 73 economies. According to regression results, tighter regulation generally increases unemployment. tightening of the rules of recruitment and dis-missal and the existence of compulsory military service are regulations with the highest negative effects. Other consequences of the study are that central collec-tive bargaining increases women’s unemployment and regulations affect young people more. The minimum wage or unemployment rate had no significant ef-fects on unemployment. In their work, Python and Rycx (2018) assessed the ef-fects of labor market regulations on unemployment for European countries and concluded that policies for market liberalization generally reduced unemploy-ment. Bassanini and Duval (2006) used the data of OECD countries to explain the determinants of unemployment. According to the analysis results, on average, changes in policies and institutions have announced about two-thirds of non-cy-clical unemployment changes over the past two decades. In particular, high and long-term unemployment benefits, high tax wedges, and anti-competitive prod-uct market regulation (PMR) have been found to increase total unemployment. Finally, while policies and institutions seem to play an important role in shaping the unemployment patterns, macroeconomic conditions are also important. Neg-ative total factor efficiency shocks, deterioration in foreign trade levels, increases

76
LABOR MARKET REGULATIONS AND UNEMPLOYMENT
Özlem ÖZTÜRK ÇETENAK
in long-term real interest rates or negative labor demand shocks have been found to increase unemployment.
Another group of studies claims that there is no correlation between labor mar-ket regulations and unemployment. Baker et al. (2002), found that there is no negative or positive correlation between the many institutional variables in labor markets and the level of unemployment. According to the results of the study, it is very difficult to determine the effects of various types of deregulation on un-employment and is negligibly weak. Moreover, such effects are more about labor force participation than employment. Deakin et al. (2014) using the data of the six OECD countries in their analysis. They suggest that labor laws, in general, do not lead to higher unemployment and that some regulations may have the effect of reducing it. Ahmed and Aljane (2014) analyzed the relationship between la-bor market flexibility and unemployment. The main result of the dynamic panel forecast is that the labor regulation indicator used has no statistically significant relationship with the unemployment rate. However, there is a direct link between layoff and hiring regulations and unemployment. Furthermore, the regulation has not had a negative impact on total unemployment.
Conclusion
In general, it is accepted that the labor market will not function well without an appropriate mix of regulations, taxes, and subsidies affecting the relationship be-tween “appropriate institutions”, i.e. workers and employers. But what are the “appropriate” institutions? To what extent do “ideal” labor market institutions re-flect country-specific characteristics and preferences? What are the consequences of having defective institutions and what are the gains in correcting them? These questions are still among the most discussed topics in the literature.
Increasing competition conditions due to the acceleration of globalization after the 1980s necessitated the reduction of labor costs. On the other hand, the change in the sectoral structure of employment also necessitated new regulations. The rapid deregulation process, which started in the 1980-2000 period, slowed down in the 2000s. The most common types of regulation are atypical employment, ease of application to fixed-time employment contracts, deregulations on temporary em-ployment agencies’ application area and temporary employment practices.In par-allel with these developments, many empirical studies have concluded that the

PERSPECTIVES ON MODERN ECONOMY
Aizhan KHOICH, Ali Eren ALPER, Ahmet Arif EREN
77
high level of regulation of labor markets leads to an increase in unemployment. Hiring - firing, compensation, etc. strict regulations discourage employers from hiring. Another problem created by strict regulations is the widespread use of in-formal workers. However, financial support such as unemployment insurance, health and poverty benefits make individuals prefer not to work.
There are many studies in the literature that prove that labor market regulations increase unemployment. These studies conducted for different countries or groups of countries argue that more flexible markets are more successful in creating em-ployment and therefore the state should avoid strict market regulations. However, the lack of regulation, especially in markets with high labor supply, leads to low wages and unfavorable working conditions. Therefore, labor markets are regu-lated for reasons such as guaranteeing the income of the worker, fighting poverty, improving the quality of labor supply, and matching work and workers. A small number of studies have concluded that there is no relationship between labor mar-ket regulations and unemployment. These studies claim that unemployment is determined by other macroeconomic variables and that the effect of regulations is weak or negligible. There is a different reason for each country’s unemploy-ment problem. Therefore, first of all, problems of labor markets should be iden-tified and arrangements should be made for these problems.
References
Addison, J. & Hirsch, B. (1997). The Economic Effects of Employment Reg-ulatıon: What Are The Limits? in Kaufman, B. (ed.) Government Regulation of the Employment Relationship, (125-178), Ithaca.
Akalın, G. (2002). İşgücü Piyasamız ve Çalışma Mevzuatımız. Mercek, 28, 83 – 92.
Ataman, B.C. (1999). İşgücü Piyasasında Kurumsallaşma: Avrupa Birliği Modeli ve Türkiye (Publication No: 583). Ankara: Ankara Üniversitesi SBF Yayınları.
Baker, D., Glyn, A., Howell, D., & Schmitt, J. (2002). Labour Market Institu-tions And Unemployment: A Critical Assessment Of The Cross Country Evidence (Publication No: 17). CEPA Working Papers.

78
LABOR MARKET REGULATIONS AND UNEMPLOYMENT
Özlem ÖZTÜRK ÇETENAK
Bassanini, A., & Duval, R. (2006). The Determinants of Unemployment Across OECD Countries: Reassessing the Role of Policies And In-stitutions. OECD Economic Studies,7-86.
Belot, M., & van Ours, J. (2000). Does the Recent Success of Some OECD Coun-tries in Lowering Their Unemployment Rates Lie in the Clever Design of Their Labour Market Reforms? (Publication No: 147). IZA Dis-cussion Paper.
Bernal-Verdugo, L.E., Furceri, D., & Guillaume, D. (2012). Labour Market Flexibility And Unemployment: New Empirical Evidence Of Static And Dynamic Effects (Publication No: WP/12/64). IMF WP.
Biçerli, M. K. (2011). Çalışma Ekonomisi. İstanbul:Beta Basım Yayım Dağıtım AŞ.
Blanchard, O., & Wolfers, J. (2000). The Role of Shocks and Institutions in the Rise of European Unemployment: The Aggregate Evidence. Economic Journal, 110, 1–33.
Botero J.C., Djankov, S., & La Porta R. (2004). The Regulation of Labour. The Quarterly Journal of Economics, November, 1339–1382.
Chang, H. (2003). Globalisation, Economic Development and the Role of State. N.York: Zed Boks Ltd.
Daveri, F. & Tabellini, G. (1997). Unemployment, Growth and Taxation in In-dustrial Countries (Publication No: 122). IGIER working paper.
Deakin, S., Malmberg, J., & Sarkar, P. (2014). How do labour laws affect un-employment and the labour share of national income? The expe-rience of six OECD countries, 1970–2010. International Labour Review,153 (1), 1-27.
Deane, P. (1988). The First Industrial Revolution. Cambridge: Cambridge Uni-versity Press.
DiTella, R. & MacCulloch, R. (1999). The consequences of labour market flexi-bility: Panel evidence based on survey data. (Publication B 02-1999), Bonn: ZEI
Elmeskov, J., Martin, J. & Scarpetta, S. (1998). Key Lessons for Labour Market Reforms: Evidence from OECD Countries’ Experiences. Swedish Economic Policy Review, 5, 205–58.

PERSPECTIVES ON MODERN ECONOMY
Aizhan KHOICH, Ali Eren ALPER, Ahmet Arif EREN
79
Feldmann, H. (2009). The unemployment effects of labour regulation around the World. Journal of Comparative Economics, 37(1), 76–90.
Fitoussi, J. P., Jestaz, D., Phelps, E. & Zoega, G. (2000). Roots of the Recent Recoveries: Labour Reforms of Private Sector Forces? Brookings Pa-pers on Economic Activity, 1, 237–309.
Ghose, A., Majid, N. & Ernst, C. (2008). The Global Employment Challenge. Geneva: ILO.
Görücü, İ. (2006). Türkiye’de İşgücü Yasası Yönetimi Ve Bir Model Önerisi: İnönü University Institute of Social Sciences [Unpublished Doc-toral Dissertation].
Heilbroner, R., L. (1970). İktisadi Sorun, (Demir Demirgil Trans.). İstanbul: Çağlayan Kitabevi.
IMF. (2003). World Economic Outlook, International Monetary Fund. Research Dept. Retrieved from: https://www.imf.org/en/Publications/WEO/Issues/2016/12/31/Growth-and-Institutions
Işıklı, A. (1996). İş Hukuku, Ankara:İmge Kitabevi.
Karanassou, M., Snower, D.J. (1998). How labour market flexibility affects un-employment: Long-term implications of the chain reaction theory. Economic Journal, 108, 832- 849
Laxton, D., & Pesenti p. (2003). Monetary Policy Rules for Small, Open, Emerging Economies. Journal of Monetary Economics 50, 1109-1146.
Nickell, S. (1997). Unemployment and labour market rigidities: Europe versus North America. Journal of Economic Perspectives, 11(3), 55-74.
Nickell, S., & Layard, R. (1999). Labour Market Institutions and Economic Performance, in Ashenfelter, O., Card, & D. (Eds), Handbook of Labour Economics (3029–84). New York and Oxford: Elsevier.
Piton, C. & Rycx, F. (2018). The Unemployment Impact of Product and Labour Market Regulation: Evidence from European Countries (Publication No: 11582). IZA Institute of Labour Economics,.
Regini, M. (2000). The Dilemmas of Labour Market Regulation”, in Esping G.A. & Regini, M. (eds.), Why DeRegulate Labour Markets (1 – 30). Oxford: Oxford University Press.

80
LABOR MARKET REGULATIONS AND UNEMPLOYMENT
Özlem ÖZTÜRK ÇETENAK
Saavedra, J. & Torero, M. (2000). Labour market reforms and their impact on formal labour demand and job market turnover: The case of Peru (Publication No: R-394). Inter- American Development Bank WP.
Sayın, A., K. (2002). Emek Piyasasında Aracılık ve Özel İstihdam Büroları (Pub-lication No:324). Ankara: Türkiye İş Genel Müdürlüğü.
Scarpetta, S. (1996). Assessing the Role of Labour Market Policies and Institu-tional Settings on Unemployment: A Cross-Country Study. OECD Economic Studies, 26(1), 43–98.
Tuna, O., & Yalçıntaş, N. (1999), Sosyal Siyaset, İstanbul: Filiz Kitabevi.

81
5THE DYNAMIC EFFECT OF GLOBALIZATION ON UNEMPLOYMENT RATES IN DEVELOPING COUNTRIESFaruk MİKE1
1. Introduction
In recent years, the impact of economic globalization on the employment oppor-tunities in developing countries has been extensively discussed by researchers. The common view is that trade liberalization, foreign direct investment and technol-ogy transfers, which are the main indicators of economic globalization, increase the economic growth and thus create the new employment opportunities. How-ever, some recent studies have shown that such an effect is not always consistent with the real economic conditions. Accordingly, trade liberalization and foreign direct investment can also have the negative effects on employment, especially in countries that are based on labour intensive production and do not have a com-petitive market structure. This creates a contradiction about the relationship be-tween the economic globalization and the unemployment rates.
This study aims to analyse the impact of economic globalization on unemploy-ment rates for 23 developing countries by using dynamic panel data method. The analyses will be carried out by testing the two different models frequently used in the empirical literature. The first of these takes into account the trade liberali-zation and the foreign direct investment as the main indicators of economic glo-balization and examines the relationship between these parameters and unem-ployment rates. However, there is an important criticism against this approach. According to Dreher (2006), these parameters are not sufficient to explain the all economic globalization process alone. Instead of this, it is more appropriate to use the Economic Globalization Index (EGI) which is a more comprehensive
1 Asst. Prof. Dr., Economics and Administrative Sciences, Department of Economics, Hakkari University, Hakkari, 30000, Turkey, [email protected].

82
THE DYNAMIC EFFECT OF GLOBALIZATION ON UNEMPLOYMENT RATES IN DEVELOPING COUNTRIES
Faruk MİKE
indicator. Therefore, secondly, the relationship between the economic globaliza-tion index and unemployment rates will be also investigated in the study.
In this sense, this study makes two main contributions to the literature. Firstly, this paper examines the two type unemployment models together for the first time for developing countries and therefore it will be possible to compare the findings from different models. Secondly, the study tries to explain the unemploy-ment rate trends in developing countries in the face of global economic shocks (positive and negative) in the recent years. The impacts of these shocks on unem-ployment rates are generally neglected for developing countries by the research-ers since the unemployment rates are considered to be one of the chronic macro-economic problems for these countries. For this reason, the effects of the global economic crises that faced in recent years (especially in 2008 that started in the United States and then spread to European countries) were mostly examined for developed countries such as Spain, Italy and so on. This study aims to eliminate this deficiency in the literature.
The rest of the paper is as follows: The definition, types and processes of glo-balization are explained in the second section. The third section defines the basic theoretical relationships between the economic dimension of globalization and unemployment rates. The fourth section consists of literature review. The fifth section describes the data and the econometric methodology. The sixth section presents the empirical results from both two models of economic globalization. The final section is the conclusion.
2. Globalization: Definition, Types and Processes
Globalization refers to a complex process with far-reaching effects. In this con-text, the studies reveal a number of different dimensions of globalization since the 1970s (Robinson, 2007: 125). The main distinction is especially made in three areas: economic, social and political globalizations2.
2 In addition to these three distinctions, there are also two important dimensions of globalization, namely migration and cultural globalization. The cultural dimension of globalization acts with the assumption of a transnational “the idea of global culture”. On the other hand, the migration dimension refers to the international movement of individuals, identities and societies across the countries (Robinson, 2007: 125).

PERSPECTIVES ON MODERN ECONOMY
Aizhan KHOICH, Ali Eren ALPER, Ahmet Arif EREN
83
The economic dimension of globalization imply that economic factors such as goods, services and capital can move freely in the international area and that the progress of the integration levels of national economies. The economic globaliza-tion also includes international labour mobility and technology transfers (Interna-tional Monetary Fund, 2008: 2). However, the social dimension of globalization defines the effects of globalization on human life (or society) and working con-ditions. The social globalization includes important components such as identity, culture, social commitment and social inclusion or exclusion (Gunter and Ho-even, 2004: 8). Finally, the political dimension of globalization explains the po-litical changes in the world from the classical imperial formations to the global organizational structure (Modelski and Devezas, 2007: 310).
It is widely accepted that the modern globalization process (economic globaliza-tion) took place three stages in the historical context. The first stage of globali-zation covers the period from 1870 to 1914. This period refers to a process such as advancing transportation facilities and reducing trade barriers. These develop-ments have significantly increased the international movements of goods, capital and labour across the countries. However, the second stage covers the period from 1950 to 1980 and focuses on integration between the rich countries such as Ger-many, France, Japan, the United Kingdom and the United States. In this period, developed countries increased their commercial relationship each other within the framework of the General Agreement on Tariffs and Trade (GATT), whereas developing countries remained isolated from capital flows and mostly based on primary commodity trade. This caused to increase in the economic gap between developed and developing countries. Finally, the third stage of globalization cov-ers the period from the 1980s to the present. The most important feature of this period is undoubtedly the rapid progress in transportation and communication technologies. In addition, foreign trade and investments have significant progress due to the effective roles of multinational companies on a global scale (World Bank, 2002: 3-4). This study considers the third stage of economic dimensions.
3. Economic Globalization and Unemployment
The economic dimension of globalisation contains to the three main indicators such as cross-border mobility of goods and services, international financial capi-tal flows and technology transfers (Shangquan, 2000: 1). These factors can have the direct and the indirect effects on the labour markets in developing countries.

84
THE DYNAMIC EFFECT OF GLOBALIZATION ON UNEMPLOYMENT RATES IN DEVELOPING COUNTRIES
Faruk MİKE
The impact of the economic globalization on the labour markets is generally ex-plained with the two different approaches in the literature. The positive view sug-gests that if investment and production are encouraged in appropriate sectors in developing countries (such as agriculture and textiles), this will contribute to in-crease in labour demand in these countries. In this way, it can be created the new employment opportunities especially for women who are living in rural areas and can be also provided an increase in labour income. On the other hand, the nega-tive view states that the some practices (the removal of trade barriers and the pri-vatization of state enterprises) that will be implemented by developing countries to gain competitive advantage may increase the unemployment rates. According to this view, the local enterprises cannot compete against the foreign enterprises which are based on the technology intensive production and therefore this causes the import dependency of the countries rather than creating new employment opportunities. In addition to this, the macroeconomic fluctuations arising from short term capital flows may also have negative effects on job security in these countries (Rama, 2003: 1).
Specifically, it is useful to discuss the effects of the main determinants of the eco-nomic globalization process on economic growth and unemployment rates in de-veloping countries. These effects are of mixed character. First of all, trade liber-alization can have the positive and the negative effects on employment rates and wages in these countries. These can differ in terms of the income level of the coun-tries and/or comparative advantage over certain products. Secondly, foreign direct investment is generally considered to have a positive effect on economic growth and employment. However, this situation may also have a strong exclusion ef-fect because the local enterprises that are based on labour intensive production may be adversely affected by foreign enterprises that are based on capital inten-sive production. Finally, technology and skill transfers potentially are expected to increase the labour productivity in the local economy. However, this may be the case in the presence of local companies that can absorb new technologies to their production processes and respond to new demands (World Commission on the Social Dimension of Globalization, 2004: 38-39). Therefore, the effects of the main determinants of economic globalization on the local economy may not al-ways point to the same conclusion.

PERSPECTIVES ON MODERN ECONOMY
Aizhan KHOICH, Ali Eren ALPER, Ahmet Arif EREN
85
4. Literature Review
The effect of globalization on the unemployment rates is examined in two parts in the empirical literature. The first of these takes into account the trade liberali-zation and the foreign direct investment as the main indicators of economic glo-balization and investigates the relationship between these parameters and unem-ployment rates. For example, Seyf (2000) examined the job creation capacity of foreign direct investment by linear and nonlinear regression methods for four Eu-ropean Union countries, namely Germany, France, Spain and the United King-dom. The findings suggest that foreign direct investment does not have any sig-nificant impact on job creation for these countries. Jenkins (2006) examined the direct and indirect effects of foreign direct investment on unemployment rates for Vietnam. The results reveal that both direct and indirect impacts were lim-ited in job creation capacity for this country. Zeb, Qiang and Sharif (2014) ex-amined the impact of foreign direct investment on unemployment rate in Paki-stan by using Ordinary Least Squares (OLS) method over the period from 1995 to 2011. The findings show that foreign direct investment plays a significant role in unemployment reduction in Pakistan. Specifically, a unit increase in foreign direct investment leads to 2.75 units decrease in unemployment for the country.
On the other hand, Dutt, Mitra and Ranjan (2009) examined the relation-ship between international trade and unemployment rates with the distinction of Heckscher-Ohlin (H-O) and Ricardian’s comparative advantage theory. The cross-sectional analysis test results indicate the strong and robust findings for the Ricardian estimation, which expresses the negative relationship between unem-ployment and trade openness. On the other hand, the panel data test results show that trade liberalization has an unemployment-increasing effect in the short term. In addition to this, the authors found that an unemployment-reducing effect leads to new steady-state equilibrium in the long term. Ogunrinola and Osabuohien (2010) examined the effect of trade openness and the annual income of customs and excise duties on unemployment level in the manufacturing sector in Nigeria over the period from 1990 to 2006. The results show that there is a positive re-lationship between global competitiveness and unemployment level in the coun-try. The study also states that infrastructure expenditures for this sector will con-tribute to labour productivity in Nigeria. Felbermayr, Prat and Schmerer (2011) examined the effect of trade openness on unemployment rates with the panel data and the cross-sectional analyses. The panel data analysis covers 20 OECD

86
THE DYNAMIC EFFECT OF GLOBALIZATION ON UNEMPLOYMENT RATES IN DEVELOPING COUNTRIES
Faruk MİKE
countries for the period from 1980 to 2003, whereas the cross-sectional analy-sis covers 62 countries for the period from 1990 to 2006. The results show that trade openness has a decreasing effect on unemployment rates. Meidani and Za-hibi (2011) investigated the dynamic effect of globalization on unemployment rates in Iran by using Johansen-Juselius cointegration analysis over the period from 1971 to 2006. The authors use the trade intensity index (ratio of total export and imports to GDP) as a proxy of globalization indicator in the study. The results reveal that globalization has a negative and significant effect on unemployment rate in Iran. Also, the value of Error Correction Model (ECM) coefficient im-plies that approximately 95% of the unemployment rate adjustment occurs after two years. Hasan, Mitra, Ranjan, and Ahsan (2012) examined the relationship between trade liberalization and unemployment rate for India by state-level and industry-level distinctions. The findings shows that trade reforms do not have any increasing effects on unemployment rates.
Secondly, some studies take into account the economic, political and social dimen-sions of globalization (published by KOF globalization index) and try to explain the relationship between these distinctions and unemployment rates. For exam-ple, Awad and Youssof (2016) examined the impact of the economic globaliza-tion index on unemployment rates for Malaysia by using the Autoregressive Dis-tributed Lag Bound (ARDL) method over the period from 1980 to 2014. The findings indicate that the economic globalization has a reducing effect on Ma-laysia’s unemployment rates in the long run. Daly, Ullah, Rauf and Khan (2017) investigated the relationship between economic, political and social globalization indices and unemployment rates for Pakistan by using the ARDL method over the period from 1980 to 2013. The results obtained show that political and so-cial integrations have an increasing effect on expected unemployment rate in the long run, whereas economic integration has a reducing effect on unemployment rate for this country. Gozgor (2017) examined the impact of economic, politi-cal and social globalization on structural unemployment for 87 countries by us-ing OLS and Two-Stage Least Squares (2SLS) estimations over the period from 1991 to 2014. The findings show that economic, social and political globaliza-tion has a negative and statistically insignificant effect on structural unemploy-ment rates for these countries. Adamu, Kaliappan, Bani and Nor (2018) exam-ined the impact of globalization on unemployment for 35 Sub-Saharan African countries by using the Generalized Method of Moments (GMM) method over the period from 2007 to 2014. The results show that only political globalization

PERSPECTIVES ON MODERN ECONOMY
Aizhan KHOICH, Ali Eren ALPER, Ahmet Arif EREN
87
had a decreasing effect on unemployment rates. Furthermore, the study reveals that economic growth and labour market regulations had a negative impact on unemployment rates, whereas wage rates and inflation had an increasing effect on unemployment rates. Siddiqa, Hussain, Qasim and Javed (2018) examined the economic, political, and social dimensions of globalization on unemploy-ment rates and economic growth for developing countries by using fixed effect and Driscoll and Kraay analyses over the period from 2003 to 2013. The results show that the economic and the political globalizations have significant impact on the reduction of unemployment, whereas social globalization has an increas-ing effect on unemployment rates for these countries. In addition to this, these three types of dimension have a positive and significant effect on economic growth for developing countries.
Finally, a few studies take into account both the main indicators (trade liberaliza-tion and foreign direct investment) and the globalization index together and em-pirically investigate the relationship between these variables and unemployment rates. For example, using these two models, Malik, Chaudhry and Javed (2011) examined the effect of economic globalization on unemployment rates in Pakistan through Johansen cointegration and Error Correction Model analyses over the period from 1973 to 2009. The findings suggest that foreign direct investment, worker remittances and economic globalization have increasing effect on employ-ment opportunities both in short run and in long run. On the other hand, trade openness and social and political globalizations have negative effects on employ-ment for this country. Gozgor (2014) investigated the impact of four different measures of trade openness and globalisation on unemployment rates in seven developed economies (G7), namely Canada, France, Germany, Italy, Japan, the United Kingdom, and the United States. The data covered the different period for each country in the range of 1960 and 2011. The Least Square Dummy Var-iable (LSDV) test results show that all four measures of trade openness (nominal openness, real openness, the globalization index, and the KOF globalization in-dex) significantly reduce the equilibrium unemployment rate in the G7 economies.
5. Data and Methodology
This study examines the impact of economic globalization on unemployment rates for 23 developing countries over the period from 1990 to 2016. The countries included in the study are determined from the classification of United Nations

88
THE DYNAMIC EFFECT OF GLOBALIZATION ON UNEMPLOYMENT RATES IN DEVELOPING COUNTRIES
Faruk MİKE
Conference on Trade and Development (UNCTAD). These countries are Algeria, Barbados, Chile, China, Colombia, Costa Rica, Ecuador, Hong Kong, Indone-sia, Korea, Macao, Malaysia, Mauritius, Mexico, Morocco, Peru, the Philippines, Singapore, South Africa, Sri Lanka, Thailand, Turkey and Uruguay, respectively.
The analyses are carried out within the framework of two different models con-sidering the distinction in the international literature as mentioned above. This distinction is mainly based on the criticisms of Dreher (2006)’s study and can be grouped under five parts: (a) Individual consideration of the sub-dimensions of globalization (trade liberalization and foreign direct investment) may be insuffi-cient to explain the overall impact of globalization. (b) The sub-dimensions of globalization may be related to each other and therefore modelling these dimen-sions separately may cause collinearity problems. (c) Failure to include non-pri-mary sub-dimensions in the model when performing analysis may reduce the reliability of the estimated coefficients. (d) The economic effects of the sub-di-mensions of globalization can take place at different degrees. (e) Failure to use a general measurement tool in explaining the overall effects of globalization may create a significant deficiency in findings.
In accordance with this information, the models to be applied in the study are given in Equation 1 and 2, respectively. In terms of model preference, it has been benefited from the studies of Awad and Youssof (2016), Daly, Ullah, Rauf and Khan (2017) and Gozgor (2017).
UNEMP is the unemployment rate, GDP is the real gross domestic product per capita, FDI is the foreign direct investment stock per capita, TRADE is the trade openness (or trade liberalization), EGI is the economic globalization index, POP is the total population, and PROD is the real output per worker as a proxy of la-bour productivity. In addition , , , , and are the elasticities of the coef-ficient and is the error term. The unemployment rate series was obtained from the International Monetary Fund (IMF) – International Financial Statistics (IFS) database, and the foreign direct investment series came from the United Nations Conference on Trade and Development database. For the economic globalization

PERSPECTIVES ON MODERN ECONOMY
Aizhan KHOICH, Ali Eren ALPER, Ahmet Arif EREN
89
index3, it was benefited from the Gygli, Haelg, Potrafke and Sturm (2019)’s study. The remaining variables (the real gross domestic product per capita, the trade openness, the total population and the labour productivity) were obtained from the World Bank database. All series are included in the analyses in logarithmic form except the EGI variable which is calculated as index.
The analyses are performed by the Generalized Moments Method developed by Arellano and Bond (1991). Economic relations include dynamics of adjustment processes in general. It is very important to consider the lagged values of vari-ables as explanatory factors when examining economic relations, since the eco-nomic behaviour in a given period is influenced by past experience and behav-iour patterns. This dynamic structure is frequently used in panel data models. The panel data model where the lagged values of the dependent variable take place as the independent variable is expressed in Equation 3 (Tatoğlu, 2013: 65; Baltagi, 2005: 135).
where is the scalar, and are 1xK and Kx1, respectively. It is assumed that follows a one-way error component model and is defined as in Equation 4.
where and independent of each other and among them-selves. Panel data models defined in Equation 3 and 4 are characterized by two persistence sources over time. The autocorrelation occurs due to the presence of lagged dependent variable among the regressions and individual effects charac-terize heterogeneity among the units. Some basic problems arise with the addi-tion of the lagged dependent variable to the model as an independent variable.
is a function of and therefore is a function of . For this reason, , which is the explanatory variable in Equation 3, is correlated to the error term. This makes the OLS estimator biased and inconsistent, even if are not serially correlated (Baltagi, 2005: 135).
Anderson and Hsiao (1981) suggested using first difference transformations to ex-clude individual effects from the model. Since the error terms of the first differ-ence model often have negative autocorrelation, it is appropriate to use the GMM
3 http://www.kof.ethz.ch/globalisation/.

90
THE DYNAMIC EFFECT OF GLOBALIZATION ON UNEMPLOYMENT RATES IN DEVELOPING COUNTRIES
Faruk MİKE
proposed by Arellano and Bond (1991). With this method, the first difference model is transformed using the instrumental variable matrix and then this trans-formed model is estimated with the Generalized Least Squares Method. The first difference model with general instrumental variable is in matrix form in Equa-tion 5 (Tatoğlu, 2013: 80):
or
The GMM estimation is represented by the matrices as in Equation 7:
where is the variance-covariance matrix of error terms.
6. Empirical Results
Table 1 shows the results for Model 1 in Equation 1. As mentioned above, this model investigates the impact of the main indicators of the economic globaliza-tion (foreign direct investment and trade liberalization) on unemployment rates for developing countries. The findings show that the coefficients obtained for real gross domestic product per capita (GDP) and trade liberalization (TRADE) parameters are negative and statistically significant. Accordingly, a 1% increase in real gross domestic product per capita and trade liberalization reduce unem-ployment rates by 0.44% and 0.28%, respectively. On the other hand, the co-efficient for the foreign direct investment stock per capita (FDI) is positive and statistically insignificant. Finally, a lagged value of the dependent variable [UN-EMP(-1)] has a positive and statistically significant coefficient. This reveals that unemployment rates are significantly affected by past values.

PERSPECTIVES ON MODERN ECONOMY
Aizhan KHOICH, Ali Eren ALPER, Ahmet Arif EREN
91
Table 1: The Analysis Results for Model 1
Variable Coefficient Standard Error t-Statistic Probability
lnUNEMP(-1) 0.607* 0.085 7.153 0.000
lnGDP -0.436* 0.139 -3.140 0.001
lnFDI 0.078 0.060 -1.306 0.192
lnTRADE -0.276* 0.058 -4.722 0.000
Descriptive Statistics
Wald Test 422.164 (0.000) AR(1) -2.382 (0.017)
Sargan Test 21.351 (0.317) AR(2) -1.185 (0.236)
Note: *, indicates the significance of coefficients at the level of 1%. Values in parentheses represent probability estimation.
Table 1 also provides descriptive statistics for Model 1. First, the Wald test was used to test the significance of the model as a whole. The Wald test results indi-cate that the model is generally significant. Second, the Sargan test was used to determine whether the variables in the model were applied or not. In other words, the Sargan test is used to test the validity of excessive identification constraints. According to the Sargan test results, the basic hypothesis cannot be rejected and it is decided that the instrument variables are valid. Finally, the Arellano and Bond test was used to analyse for the presence of autocorrelation between the series. In order to investigate the presence of autocorrelation in the model discussed, it is sufficient to consider the presence of second order autocorrelation [AR(2)]. Al-though the first order autocorrelation [AR(1)] is not important, the second order autocorrelation [AR(2)] should not be in the model in order for the Generalized Moments Estimators to be effective. The results show that there is no autocorre-lation problem in the model.
The findings in Table 1 indicate some important implications for developing econ-omies. First of all, it can be said that the most important effect on unemployment rates is due to the past values of the unemployment rates. In other words, previ-ous unemployment rates have a negative effect on current unemployment rates. Secondly, economic growth is the most important parameter in reducing unem-ployment rates in these countries. Thirdly, trade liberalization does not have a negative impact on employment opportunities contrary to expectations. Finally,

92
THE DYNAMIC EFFECT OF GLOBALIZATION ON UNEMPLOYMENT RATES IN DEVELOPING COUNTRIES
Faruk MİKE
it is estimated that the foreign direct investment flows to these countries are not significantly enough to create new employment opportunities.
On the other hand, Table 2 shows the results for Model 2 in Equation 2. In par-ticular, it is argued by opposing views that Model 1 is not sufficient to explain the reasons for unemployment rate in a country. According to this view, both foreign direct investment and trade liberalization are not sufficient to explain the economic globalization process alone and a more comprehensive parameter, the Economic Globalization Index, should be used instead of these parameters.
Table 2: The Analysis Results for Model 2
Variable Coefficient Standard Error t-Statistic Probability
lnUNEMP(-1) 0.761* 0.050 15.089 0.000
lnGDP -1.327** 0.517 -2.565 0.011
EGI -0.008* 0.002 -4.956 0.000
lnPOP 1.314* 0.194 6.768 0.000
lnPROD 0.711 0.494 1.439 0.151
Descriptive Statistics
Wald Test 1796.073 (0.000) AR(1) -2.773 (0.006)
Sargan Test 21.103 (0.274) AR(2) -1.035 (0.301)
Note: * and ** indicate the significance of coefficients at the level of 1% and 5%, respectively. Values in parentheses represent probability estimation.
The findings for Model 2 are similar to those for Model 1. Accordingly, real gross domestic product per capita (GDP) and economic globalization index (EGI) have negative and statistically significant effects on unemployment rates. A 1% increase in real gross domestic product per capita reduces unemployment rates by approx-imately 1.33%. The economic globalization index, on the other hand, has a very small and decreasing effect on unemployment rates. In contrast, a lagged value of unemployment rates [UNEMP(-1)] and total population (POP) have a posi-tive and statistically significant effect on unemployment rates. A 1% increase in the total population increases unemployment rates by approximately 1.31%. Fi-nally, the coefficient obtained for labour productivity (PROD) is positive, but is not statistically significant.

PERSPECTIVES ON MODERN ECONOMY
Aizhan KHOICH, Ali Eren ALPER, Ahmet Arif EREN
93
Table 2 also provides descriptive statistics for Model 2. The Wald test result indi-cates that the model is generally significant. The Sargan test results revealed that the instrument variables were valid. The autocorrelation test [AR(2)] results show that there is no autocorrelation problem in the model.
The findings in Table 2 again point to some important implications for devel-oping economies. Firstly, the real gross domestic product per capita has a most important impact on unemployment rates. The increase in real income per cap-ita significantly reduces unemployment rates. Secondly, the economic globaliza-tion index has a decreasing effect on unemployment rates. These results reveal the positive effect of the globalization process on unemployment rates. Thirdly, it is noteworthy that population growth has a serious negative effect on unem-ployment rates. Similarly, fourthly, the past values of unemployment rates have the negative effect on unemployment rates. Finally, it is understood that labour productivity has no effect on unemployment rates.
7. Conclusion
In recent years, the impact of the economic globalization on the basic macroe-conomic variables in developing countries has been frequently discussed. One of the most important macroeconomic parameters in question is undoubtedly un-employment rates. In general, the impact of economic globalization on unem-ployment is shaped around two different approaches. According to the positive view, trade liberalization, foreign direct investment and technology transfers in-crease employment opportunities in developing countries. In other words, invest-ments to be made in sectors where countries have comparative advantage can sig-nificantly reduce unemployment rates. This is also a very successful process in terms of encouraging female labour force, especially lives in rural areas, to em-ployment. However, the negative view states that the globalization can increase unemployment rates in countries with a non-competitive economic system and based on labour intensive production. Approaches developed around these two opposing views leave the impact of the economic globalization on unemploy-ment rates are inconclusive.
This study aimed to investigate the effect of globalization on the unemployment rates in order to explain this contradiction. In this context, the dynamic panel data analysis was applied for 23 developing countries over the period from 1990

94
THE DYNAMIC EFFECT OF GLOBALIZATION ON UNEMPLOYMENT RATES IN DEVELOPING COUNTRIES
Faruk MİKE
to 2016. The analyses were performed with the Generalized Moments Method developed by Arellano and Bond (1991). For this purpose, two different models which are frequently used in the empirical literature were tested in this study. The first of these models (Model 1) examines the relationship between the main in-dicators of the economic globalization (trade liberalization and foreign direct in-vestment) and unemployment rates. The second model (Model 2) examines the relationship between the economic globalization index (published by the KOF globalization index) and unemployment rates. In this way, it is possible to use both models instead of a single model frequently used in the literature and to compare the findings to be obtained from these models.
When the results obtained from both two models are evaluated together, the main conclusion is that the economic globalization process has a positive effect on un-employment rates for developing countries. The coefficients for trade liberaliza-tion and economic globalization index are negative and statistically significant. Only a statistically insignificant coefficient was obtained for foreign direct invest-ment, which is one of the basic elements of the economic globalization process. This is thought to be related to the new tax policy implemented by the United States in recent years. It is known that US based multinational companies have started to transfer their investments from foreign countries to their own coun-tries due to their tax policy. Therefore, the foreign direct investment shares of de-veloping countries have been decreasing in recent years.
On the other hand, it is remarkable that the main macroeconomic variables in-cluded in the models as well as economic globalization parameters point out to very important findings for developing countries. In particular, real gross domes-tic product income per capita has a negative and statistically significant coefficient in both two models. In other words, the increase in real gross domestic product per capita in developing countries significantly reduces the unemployment rates. In contrast, total population growth and past values of unemployment are the main reasons to increase unemployment rates in these countries.
As a result, developing countries should continue to implement economic globali-zation policies effectively, whereas these countries are struggling with the unem-ployment problem. These countries should try to attract more trade and capital flows in order to increase the competitiveness of local firms, labour productivity

PERSPECTIVES ON MODERN ECONOMY
Aizhan KHOICH, Ali Eren ALPER, Ahmet Arif EREN
95
and innovations. In this way, it is thought that the countries can provide more important improvement in economic growth and employment opportunities.
References
Adamu, P., Kaliappan, S. R., Bani, Y., & Nor, N. M. (2018). Impact of globali-zation on unemployment in Sub-Saharan African (SSA) countries. Int. Journal of Economics and Management, 12(S2), 443-454.
Anderson, T. W., & Hsiao, C. (1981). Estimation of dynamic models with error components. Journal of the American statistical Association, 76(375), 598-606.
Arellano, M., & Bond, S. (1991). Some tests of specification for panel data: Monte carlo evidence and an application to employment equa-tions. The Review of Economic Studies, 58(2), 277-297.
Awad, A., & Youssof, I. (2016). The impact of economic globalisation on unemployment: The Malaysian experience. The Journal of Inter-national Trade & Economic Development, 25(7), 938-958. DOI: 10.1080/09638199.2016.1151069.
Baltagi, B. (2005). Econometric analysis of panel data (Third Editon). Chiches-ter, England: John Wiley & Sons.
Daly, V., Ullah, F., Rauf, A., & Khan, G. Y. (2017). Globalization and unem-ployment in Pakistan. Asian Economic and Financial Review, 7(7), 634-643. DOI: 10.18488/journal.aefr.2017.77.634.643.
Dreher, A. (2006). Does globalization affect growth? Evidence from a new in-dex of globalization. Applied Economics, 38(10), 1091-1110. DOI: 10.1080/00036840500392078.
Dutt, P., Mitra, D., & Ranjan, P. (2009). International trade and unemploy-ment: Theory and cross-national evidence. Journal of International Economics, 78(1), 32-44. DOI: 10.1016/j.jinteco.2009.02.005.
Felbermayr, G., Prat, J., & Schmerer, H. -J. (2011). Trade and unemployment: What do the data say?. European Economic Review, 55(6), 741-758. DOI: 10.1016/j.euroecorev.2011.02.003.
Gozgor, G. (2014). The impact of trade openness on the unemployment rate in G7 countries. The Journal of International Trade & Economic Devel-opment, 23(7), 1018-1037.

96
THE DYNAMIC EFFECT OF GLOBALIZATION ON UNEMPLOYMENT RATES IN DEVELOPING COUNTRIES
Faruk MİKE
Gozgor, G. (2017). The impact of globalization on the structural unemploy-ment: An empirical reappraisal. International Economic Journal, 31(4), 471-489. DOI: 10.1080/10168737.2017.1408666.
Gunter, B. G., & Van der Hoeven, R. (2004). The social dimension of glo-balization: A review of the literature. International Labour Review, 143(1-2), 7-43.
Gygli, S., Haelg F., Potrafke N., & Sturm, J. -E. (2019). The KOF globalisa-tion index – revisited. Review of International Organizations, 14(3), 543-574.
Hasan, R., Mitra, D., Ranjan, P., & Ahsan, R. N. (2012). Trade liberalization and unemployment: Theory and evidence from India. Journal of Development Economics, 97(2), 269-280. DOI: 10.1016/j.jdeve-co.2011.04.002.
International Monetary Fund. (2008). Globalization: A brief overview. Issues Brief, 02/08, IMF Staff, Washington, D. C., USA.
Jenkins, R. (2006). Globalization, FDI and employment in Viet Nam. Transna-tional corporations, 15(1), 115-142.
Malik, S., Chaudhry, I. S., & Javed, H. I. (2011). Globalization and employ-ment: Evidence from Pakistan. Pakistan Journal of Social Sciences (PJSS), 31(2), 215-226.
Meidani, A. A. N., & Zabihi, M. (2012). The dynamic effect of globalization on unemployment rate in Iran: A co-integration analysis. Interna-tional Business Research, 5(1), 120-126.
Modelski, G., & Devezas, T. (2007). Political globalization is glob-al political evolution. World Futures, 63(5-6), 308-323. DOI: 10.1080/02604020701402707.
Ogunrinola, I. O., & Osabuohien, E. S. (2010). Globalisation and employ-ment generation in Nigeria’s manufacturing sector (1990-2006). European Journal of Social Sciences, 12(4), 581-593.
Rama, M. (2003). Globalization and workers in developing countries. Policy Rearch Working Paper: 2958. The World Bank, Washington D. C., USA.
Robinson, W. I. (2007). Theories of globalization. In: Ritzer, G. (ed.), The Blackwell companion to globalization, 125-143, Oxford: Blackwell.

PERSPECTIVES ON MODERN ECONOMY
Aizhan KHOICH, Ali Eren ALPER, Ahmet Arif EREN
97
Seyf, A. (2000). Can more FDI solve the problem of unemployment in the EU? A short note. Applied Economics Letters, 7(2), 125-128. DOI: 10.1080/135048500351951.
Shangquan, G. (2000). Economic globalization: trends, risks and risk prevention. Economic & Social Affairs, CDP Backround Paper, 1, United Na-tions, New York, USA.
Siddiqa, A. Hussain, T. Qasim, M. and Javed, M. I. (2018). The Impact of Globalization on Unemployment and Economic Growth: Panel Data Analysis for Developing Countries. Bulletin of Business and Economics, 7(3), 122-131.
Tatoğlu, F. Y. (2013). İleri Panel Veri Analizi: Stata Uygulamalı. Istanbul, Tur-key: Beta Basım Yayın.
World Bank. (2002). Globalization, growth, and poverty: Building an inclusive world economy. The International Bank for Reconstruction and De-velopment, Washington D. C., USA: The World Bank and Oxford University Press.
World Commission on the Social Dimension of Globalization. (2004). A fair globalization: Creating opportunities for all. Geneva, Switzerland: International Labour Organization.
Zeb, N., Qiang, F., & Sharif, M. S. (2014). Foreign direct investment and unemployment reduction in Pakistan. International Journal of Eco-nomics and Research, 5(2), 10-17.


SECTION IIEXCHANGE RATE


101
6GLOBAL COMPETITION AND EXCHANGE RATE DETERMINATIONYelda Bugay TEKGÜL1
Introduction
Some developed countries in the world economy acquire current account sur-pluses, whereas some incur current account deficits. Table 1 presents the national income per capita, which is one of the important welfare indicators of the coun-tries, and the current account status, which is an important indicator of their re-lations with the outside world as of 2019. It is observed that among the coun-tries with common development levels, there are those who incur current account deficits as well as those who acquire surpluses. World trade and capital movements exhibit an out-of-balance view on a global scale2. In the first phase, it can be ex-pected that developed countries would acquire surpluses, and developing coun-tries would incur deficits. Undoubtfully, the current account surplus or deficit may differ due to reasons and results in terms of countries. However, standard foreign trade theories (SFTT) seem to insist on the Notion that such deficit or surplus would constitute a balance by eliminating these deficits or surpluses in the long-run with the economic consequences they generate. On the other hand, per capita GDP, which is one of the important welfare indicators of a country, also varies significantly. For instance, the US economy, which is the largest econ-omy in the world, has the largest current account deficit and achieves the high-est per capita income. However, China, with the second-largest economy in the world, has a current account surplus, and a per capita income much lower than the USA (see Table 1).
1 Asst. Prof. Dr., Çukurova Universiy, FEAS- Department of Economics, Orcid no: 0000-0002-3800-5427
2 The concept of “balance” is frequently discussed in economic theory. What is meant here involves the difference among the rates of change of economic magnitudes.

102
GLOBAL COMPETITION AND EXCHANGE RATE DETERMINATION
Yelda Bugay TEKGÜL
Table 1: Current Accounts of the Selected Countries (Billion USD-2019) and Per Capita GDP-Current USD-2019)
Countries Surplus Per Capita Income
Countries Deficit Per Capita Income
China 141,335 10,200 USA 498,350 65,280
Germany 274,504 46,250 United Kingdom 106,885 42,300
Italy 58,933 33,180 Brazil 49,451 8,717
Japan 184,539 40,240 Canada 35,409 46,197
Kuwait 33,788 32,030 France 18,548 40,493
Russsian Federation
64,607 11,585 Chili 9,157 14,896
Saudi Arabia 49,842 23,139 Argentina 3,461 10,006
Singapur 63,139 65,233 Mexico 2,443 9,863
Source: Data.imf.org/regular.aspx?key=62805740 Access Date 07.19.2020
SFTT asserted that financial and trade liberalization leads to advanced commer-cial relations, acceleration of economic growth, swifter technological change, and allocation of nation’s resources to efficient exportable goods. The structure of the neoclassical (Orthodox) theory underlies all these results. The view put forward as an economic policy suggests that the best option of economic development is to open the country to world markets; to remove foreign trade protectionism, to open financial markets, and to privatize public enterprises (Shaikh, 2016: 495-496). It is well-known that the economic policy extensions of these views are con-ducted by global institutions such as the IMF and the World Bank. Despite this, serious criticism is on the rise from these organizations.3 There is evidence that financial liberalization has historically made the real exchange rate dependent on the volatility of short-term capital flows. This situation connects the domestic in-terest rate to the international capital markets, thus making it burdensome for the interest rate to be a variable of domestic growth policies (Rodrik, 2001: 23).
The competition-based theoretical explanation of international trade is based on Ricardo’s work entitled Principle of Comparative Advantages. Based on the ex-ample of a country with a more developed capital and a less developed country,
3 The most widespread and influential criticism on this subject came from Joseph Stiglitz, whose repercussions still persist. See Stiglitz, Joseph (2002), “Globalism’s Discontents” American Prospect, January 4. http://prospect.org/aticle/globalism-discontent

PERSPECTIVES ON MODERN ECONOMY
Aizhan KHOICH, Ali Eren ALPER, Ahmet Arif EREN
103
Ricardo argued that the export revenues of the country with developed capital would exceed the import expenditures, in turn, it results in the inflow of funds and the money supply would increase. In the country with less efficient capital, on the contrary, the money supply decreases. In theory, the increase in the money supply would boost prices and costs in the developed country, while decreasing them in a less developed country. Thus, while the cost advantage of the devel-oped country decreases, the other country would better-off. As a result, the im-balance in foreign trade would cease to exist.4
As can be seen clearly from Table 1, today’s economies present a different view from Ricardo’s views. Therefore, in explaining global competition, approaches based on Ricardo’s views are criticized and new views are put forward. Since Ri-cardo’s views are based on a price (cost)-oriented analysis, the criticisms are real-ized through the determination of the exchange rate. Therefore, the first part of this book chapter is devoted to examining two neoclassical-based exchange rate determination models, the first being the monetary approach model and the sec-ond the portfolio balance approach model. In the second part, alternative exchange rate determination approaches are discussed. In the last part, criticism of Ricardo’s principle of comparative advantage, which represents the neoclassical spirit that is widely used in explaining global competition, is emphasized.
1. Standard Exchange Rate Models
By the end of WWII, capital has become the main subject of international trans-actions with an increasing speed. Despite the motivation of the Bretton Woods system established in the post-war period to control capital flows, the Eurodol-lar market began to emerge by the end of the 1950s, and the European money market played a crucial role in determining the exchange rate until the end of the Bretton Woods system.
Throughout the period from 1973 until today, capital mobility, which increased for various reasons, has been playing a dominant role in determining the exchange rate. Nonetheless, organizations such as the IMF and WB continue to rely on two theoretical explanations that are examined below. 5
4 In this analysis, it is seen that Ricardo is in favor of the “quantity theory of Money”.5 Harvey (1996) is utilized in explaining these models.

104
GLOBAL COMPETITION AND EXCHANGE RATE DETERMINATION
Yelda Bugay TEKGÜL
1.1. Monetary Approach Model
The monetary approach model used in determining the exchange rate is a model directly derived from the monetarist approach. The model includes 3 basic as-sumptions:
i. Prices and wages are perfectly elastic.
ii. Money demand is stable.
iii. PPP is valid all the time.
The first two assumptions are crucial, the third assumption is of vital impor-tance in determining the exchange rate. The following equation is generally es-timated in applied studies:
(1)
Among the notations in Equation 1, denotes the exchange rate, denotes the money supply, denotes real income, denotes the ratio of the desired money balances to nominal income, denotes the income elasticity of the money de-mand, and denotes the interest elasticity of the money demand. The asterisk indicates foreign country variables (the variables are in logarithmic form). Equa-tion 1 indicates the monetary exchange rate model determined by purchasing power parity.6 In this model, the fact that variables move together between coun-tries would also bring up the validity of the law of one price.
Interest rate (i), one of the variables in the model, is determined in international financial markets depending on the capital flows in the real world, apart from the assumptions of this model. Nevertheless, in the monetarist Equation 1, the interest rate is tied to the cash demand, thus affecting the price level, hence, the exchange rate. In fact, the rise in the domestic interest rate renders the domestic assets alluring to foreigners in the international capital market and the national currency is appreciated. However, such an outcome is not predicted in the mon-etary model. Instead, an increase in the domestic interest rate decreases the de-mand for cash assets and creates a surplus in the money supply. Thus, domestic
6 PPP, in its most general definition, is an approach that suggests the changes in exchange rates between the currencies of the two countries within a certain period are determined according to the difference in the relative price levels of the two countries. In the relative PPP approach, it is asserted that the higher the inflation rate in a country compared to the foreign country, the higher the exchange rate should be.

PERSPECTIVES ON MODERN ECONOMY
Aizhan KHOICH, Ali Eren ALPER, Ahmet Arif EREN
105
prices rise and the national currency is depreciated. The outcome predicted by the monetary model does not fit in the real world. As a result, the monetarist model does not attribute a role to capital movements in determining the exchange rate. Although the model lacks strong empirical support, it remains popular (by car-rying on the neoclassical tradition) due to its pro-free-market feature.
1.2. Portfolio Balance Model
In the Portfolio Balance Model, international capital flows are deemed necessary in determining the exchange rate. In this model, investors prefer three types of assets: national bonds, foreign bonds, and domestic currency. As an important assump-tion, there is no substitution between national bonds and foreign bonds. There-fore, interest rates may differ. In the simple version of this model, a small coun-try model, in which the citizens of this country can hold foreign assets whereas the foreigners are not allowed to hold any assets, is used. In this case, nominal assets can be expressed as follows:
W=M+B+SF (2)
W denotes the net financial asset of the private sector, M denotes the money sup-ply, B denotes the value of national bonds, F denotes the value of foreign assets held domestically, and S denotes the exchange rate. The demand for each com-ponent of national assets is defined as follows: r denotes the yield on national bonds, r* denotes the yield on foreign bonds. Signs represent the direction of the effect on the dependent variable.
M= m(r, r*) (3)
-, -
B= b(r, r*) (4)
+, -
F=f(r, r*) (5)
-, +
This model can be considered as a more advanced model in comparison to the monetary approach model. It primarily concentrates on profit maximization in the capital market and investors’ portfolio selection. Another advantage of this model involves a causality from the interest rate toward the exchange rate by focusing on

106
GLOBAL COMPETITION AND EXCHANGE RATE DETERMINATION
Yelda Bugay TEKGÜL
the asset market in accordance with the real world. For instance, when the inter-est rate is reduced by implementing monetary policy, investors would purchase foreign bonds, and the price of foreign currency would increase. The changes to be made by the investors in the portfolio decisions in the model may occur due to the decisions to be taken by the government and the current account imbal-ances. When a current account surplus occurs in the country, such surplus can be used to purchase foreign bonds and the foreign currency is depreciated. The foreign currency depreciation would eliminate the current account surplus.7 The change in portfolio decisions is due to both the government policies and the cur-rent account imbalances.
Changes in the players’ expectations regarding the foreign exchange market cause frequent and rapid changes in portfolio decisions.8 This model failed to acquire specific integrity that includes expectations and the result of changes in expecta-tions. Empirical studies could not indicate that this model was powerful. None-theless, unlike the monetarist model, it provides an explanation for the exchange rate volatility by allowing overshooting of the exchange rate and trade imbalances.
2. An Alternative Approach of Real Exchange Rate Determination
Both models described above reflect the spirit of neoclassical economic under-standing. The situation presented in Table 1 seems far from reflecting a balance in terms of both individual welfare and current account, representing the world’s important developed economies. There is an imbalance in the world economy that is not compatible with the predictions of Ricardo’s “Principle of Compara-tive Advantages”. A Ricardian understanding of competition, which claims that the exchange rate would achieve balance in foreign trade, does not find a coun-terpart at the global level and in the real world. Therefore, alternative exchange rate determination models have become widespread in the economics literature. The Post-Keynesian approach from the heterodox views emerged in the late 1970s in comprehending the dynamics of the exchange rate volatility in the interna-tional financial and monetary system (IMFS) that came to existence following
7 If the prices in the goods market cannot temporarily provide the necessary harmony in the short term and, an exchange rate overshooting may occur. An imbalance in the current account would be automatically offset when the exchange rate reverts to its balance level in the long-run.
8 This result may occur even if there is no policy decision or an imbalance in the current account.

PERSPECTIVES ON MODERN ECONOMY
Aizhan KHOICH, Ali Eren ALPER, Ahmet Arif EREN
107
the Bretton Woods system. Post-Keynesian approach to exchange rates (David-son, 1998; Dow, 1999; Harvey, 1991, 1996, 2006, 2007, 2009, 2017) is based on the view that capital movements play an independent and active role in the economy and it constitutes the basis of the explanations for the determination of exchange rates. Therefore, in this part, the determination of exchange rates is examined within the framework of an alternative approach.
2.1. Exchange Rates and Trade Imbalances
One of the serious problems related to the SFTT is that it bases export and im-port equality in the long-run on the price mechanism (Purchasing Power Pari-ty-PPP) and Ricardo’s “Comparative Advantages Principle”. The traditional ap-proach argues that trade among countries would generally achieve balance in the long-run. According to this approach; Exchange rates would reflect the relative domestic prices at the equilibrium point where foreign exchange supply and de-mand are equalized, and automatic movements in the exchange rate would auto-matically maintain such balance. In the short-run, deviations in the equilibrium exchange rate would be followed by foreign trade deficits. This principle of neo-classical trade theory would determine which country be more competitive than another. Therefore, if the exchange rate can be managed well enough to achieve and sustain such competition, it would also be able to maintain foreign trade bal-ance. It is assumed that real exchange rates eliminate competition differences in the long-run. Nonetheless, it should be noted that while historical data provide evidence of the persistence of trade imbalances (although different systems such as a managed, fixed, and flexible exchange rate have been implemented), the two principles of foreign trade balance are frequently adopted by economic policy-makers (Hernández, 2010: 55-56).
The view that capital movements have an independent and active role in the coun-try’s economy in determining the exchange rate constitutes the basis of Post-Keynes-ian theoretical explanations and distinguishes this view from traditional econom-ics (Harvey, 2003: 131). In this context, their work aims to explain the actual decision-making process in foreign exchange markets (Ramos and Prates, 2018: 2). In this regard, Schulmeister’s (1988, 2009a, 2009b) studies also aim to ex-plain the actual decision-making process within foreign exchange markets in a similar way to Harvey. Since the 1980s, Schulmeister has been analyzing the pat-tern of exchange rate movements from both the inductive and microstructural

108
GLOBAL COMPETITION AND EXCHANGE RATE DETERMINATION
Yelda Bugay TEKGÜL
approaches and emphasized that exchange rates do not follow a random move-ment, but on technical trading systems (spots and derivatives) that have become increasingly important in the foreign exchange market following the 1990s (Schul-meister 2009b).9 Accordingly, the exchange rate dynamics arise from the interac-tion of strategies and models used by ‘chartist traders’ (who decide to trade only based on information contained in past prices). Schulmeister asserted that tra-ditionally traders have two types of expectations regarding exchange rate move-ments, and the short-term exchange rates are more influenced by political and economic news, whereas the medium-term exchange rates are more inclined to be affected by growth rates, interest differentials among countries, and relative infla-tion. According to Schulmeister, while foreign exchange trading has experienced a great change within the last two decades, the daily volume of the foreign ex-change market has exceeded the world trade volume by approximately forty times and portfolio investments by almost sixty times, and therefore, direct speculation by banks, multinational companies, and other unexpected agents would begin to dominate the market (Schulmeister, 1988: 344). Harvey, on the other hand, based his opinions on Schulmeister’s analysis of money markets, but in many of his studies, he especially concentrated on the “mental model” and the behavior of “pro-trade” agents, taking into account the changes in macroeconomic variables while creating exchange rate expectations. Harvey’s expectation formation analy-sis includes Keynesian insights as well as the views of behavioral economists used to explain the forecasting-regulation approaches to the foreign exchange market.
According to Harvey’s (2009) “mental model”, agents’ predictions about regulat-ing expectations are based on three layers:
i. The demand for foreign currency depends on net exports, net foreign direct investment and net portfolio foreign investment;
ii. These are affected by expected domestic and external inflation differences, ex-pected relative macroeconomic growth, expected relative interest rates, and ex-pected liquidity.
iii. Investors keep a list of indicators (such as GDP growth, unemployment rates, etc.) upon establishing expectations for changes in these factors.
9 “Technical analysis” is a broader concept that does not have to be limited to trade. In technical currency trading within the foreign exchange market, investors focus on charts and tables. They monitor the index charts for signs of convergence / divergence that may indicate profitable buy and sell signals.

PERSPECTIVES ON MODERN ECONOMY
Aizhan KHOICH, Ali Eren ALPER, Ahmet Arif EREN
109
Harvey (2009) explains the determinants of the exchange rate in the developed mental model with five exchange rate determinants examined by Schulmeister (2009a), besides portfolio investments made based on exchange rate estimates. These consist of volatility, herd psychology, technical analysis, trade barriers, and cash inflows. According to Harvey, the main debate is all about the reasons for trade imbalances. Do these imbalances occur due to differences in absolute advantage, or as a result of the autonomous portfolio, capital flows when exchange rates diverge from balanced trading levels ? (Harvey, 2017: 1).
2.2. The Relationship Between Capital Flows & Speculative Movements and the Foreign Exchange MarketWithin the framework of the heterodox Post Keynesian approach, capital flows are the main determinants of the exchange rate. Financial capital flows are driven by forecasts in an uncertain speculative market. The value of the exchange rate affects trade flows. The most prominent feature of exchange rates is that they ex-hibit huge volatility and are chronically set below, or above their value. Volatil-ity appears as a deterrent element by including a new cost factor to international trade. Setting a foreign exchange rate above or below its value means that trade imbalances may persist for very long time without achieving balance automati-cally. The relationship between the volatility of exchange rates and the overval-uation/ undervaluation of exchange rates is illustrated in Figure 1. The daily ex-change rate transactions is much higher than what is required for international trade. Therefore, the autocorrection mechanism usually does not function. Be-cause there is a demand for foreign exchange far beyond the demand merely for international goods and services, and the exchange rate, which ensures the trade balance level, cannot be guaranteed not to change (Harvey, 1995: 493-94).
Harvey (1999) discussed the types of demand for foreign exchange and empha-sized the relatively essential role of portfolio investments, which is essentially based on speculation. Investors’ expectations regarding asset price movements would de-termine the exchange rate volatility and the current prices of these assets (Harvey, 1999: 201). According to Andrade and Prates, there are historically two funda-mental points underlying such volatility: Firstly, interest rates and asset prices are exposed to both huge volatility in the short-run and significant changes in the long-run, generating higher volatility in exchange rates. Secondly, financial im-balances have a high degree of a spillover effect from the basepoint of the system toward markets and countries that have nothing to do with the main concern (Andrade & Prates, 2013:10).

110
GLOBAL COMPETITION AND EXCHANGE RATE DETERMINATION
Yelda Bugay TEKGÜL
Figure 1. Th e Eff ect of Increasing Capital Flows on the Foreign Exchange Market (Harvey, 1995)
The exchange rate volatility is an outcome of the current market structure. Trade flows are inclined to have higher stability than capital flows, especially in the short-run. The most apparent reason for this is the ease with which an interna-tional supplier of goods or services may alter the structure of a financial portfo-lio in comparison to altering its source. As capital flows grow, so does the size and volatility of the demand for foreign exchange. Therefore, if the size increases, the probability of the emergence of the volatility features would also rise. If the foreign currency has the desired properties as an asset, then the currency prices would be much more volatile, increasing the opportunities for speculation on this asset. In this case, upon assuming that there may be individuals who wish to benefit from possible profits, the volume of speculative activities would also in-crease (Mottif, 1983 as cited in Harvey, 1995: 495). According to Harvey, the increase in the volume of speculative movements result in several consequences, each of which leads to three positive feedbacks that make the role of speculation even more important (see Figure 1).

PERSPECTIVES ON MODERN ECONOMY
Aizhan KHOICH, Ali Eren ALPER, Ahmet Arif EREN
111
First of all, the rise in the speculative activities’ volume directly causes an increase in the imbalance and size of the demand for foreign currency and, thus stimulates the growth of volatility. Secondly, the rising importance of speculative movements would lead to a circumstance in which there is no anchor for exchange rates inde-pendent of these speculative powers.10 Therefore as speculators purchase and sell in pursuit of an unknown future balance, the exchange rate volatility would in-crease even further. The third feedback begins with the impact of increasing spec-ulation volume on foreign exchange activities. With the decrease in the profita-bility of banks’ traditional operations, the increasing speculative activity volume has gradually shifted the focus of these operations of financial institutions toward foreign exchange speculation. The shift in this focus causes the rise of speculative purchases and sales with the profit motive in case of any volatility in the foreign exchange market. If the asset prices are tightly linked to exchange rate volatil-ity, such volatility renders portfolio investment one of the main targets. The fact that exchange rates depend on investors’ pursuit of capital gain in the short-run explains the exchange rate volatility during the post-Bretton Woods period. Ac-cordingly, rapidly changing predictions regarding future foreign exchange price movements cause spot prices to change instantly. The reasons behind the rapid change in forecasts concentrate on 6 points: the speculative nature of the foreign exchange market from an alternative perspective, the lack of a real anchor in de-termining money values, the subculture of foreign exchange buyers and sellers, the way individuals make decisions, the uncertainty, and the impact of herd psy-chology (Harvey, 1999: 206).
3. Criticism of the Standard Foreign Trade Theories
The competition that emerges in a national economy occurs in the form of firms cutting their prices by reducing their costs and expanding their market share in a way that casts out their competitors. In this process, there is no guaranteed way for one firm to lower its costs more than another. This motivation consti-tutes the basis of the capitalist production and competition process. Therefore,
10 Exchange rates respond to changes in “basic” variables. These values are assumed to provide the average trend in exchange rates. For such a trend to occur, the factors that determine the demand for foreign exchange must be relatively stable and easy to describe. Moreover, the processes influenced by these factors should be related to foreign exchange trading. Any speculative movement stabilizes since stable and clear movements in the factors that dominate the market can be predicted. However, the general opinion is that speculative movements are the dominant force in the market.
112
GLOBAL COMPETITION AND EXCHANGE RATE DETERMINATION
Yelda Bugay TEKGÜL
it is inevitable for some companies to go bankrupt. The equivalent of this pro-cess experienced in a national economy during international trade is that coun-tries with more efficient production and lower wage levels have a higher chance of success.11 Smith argued that capital pursues the profit motive regardless of the line of business in which it operates (Smith, 1973: 474). Making production for either domestic or foreign markets does not mitigate the profit motive. Ricardo, like Smith, started out from individual firms that seek profits in various countries.
When international trade is made between less developed and more developed countries, there would be an outflow of capital from the less developed coun-try (net importer) to the developed country (net exporter) and a trade imbalance would arise (in favor of the net exporter). Then, as the national currency supply in the net exporting country increases, prices and costs would rise and the im-balance would disappear.12 This mechanism continues to function as long as the imbalance persists. Regardless of the initial differences in effectiveness, the two countries eventually become equally competitive. In this situation, free trade cre-ates the result that a low-efficiency (high-cost) country does not need to correct this adverse condition (Shaikh, 1980: 205).13 Ricardo transformed absolute cost advantages into relative cost advantages in foreign trade and continued the process with the same mechanism. Companies operating in countries should specialize in products with the lowest cost in case cost differences, and leave the production of other products to their competitors in other countries. It is assumed that indi-vidual firms that are in pursuit of profits throughout the whole process manage a process that would result in all countries better-off in international trade. The first of the most important criticisms toward this analysis is seen in the reduction of the balance of payments only to the balance of trade. Because the flow of goods is separated from financial flows in this analysis. Money is seen only as a medium of circulation. Whereas funding capital is intrinsically dependent on the trade of goods (borrowing in the case of deficit, or vice versa). In the real world, absolute costs determine foreign trade, not relative costs. Countries with less competitive capital constantly run deficits and fill this gap with debt (Shaikh, 2016: 504-509).
11 This approach constitutes the basis of Adam Smith’s “Principle of Absolute Advantages”. This principle is applied in the same manner in competition within the country and in international competition.
12 A causality between price level and money supply is predicted.13 The process works the same for flexible or fixed exchange rate (see Shaikh, 2016)
PERSPECTIVES ON MODERN ECONOMY
Aizhan KHOICH, Ali Eren ALPER, Ahmet Arif EREN
113
In fact, according to the competition theory, which originates from Keynes and Marx, the international competitiveness of an industry or country is mainly based on absolute production technology and labor productivity. Accordingly, it is the com-petitive position of the country that determines the exchange rate. It is argued that the differences between real production costs determine international trade con-ditions, and hence, exchange rates (Milberg, 1994). Upon considering the views of Anwar Shaikh and R. Antonopoulos, it is seen that they modeled competi-tion as a function of the “vertically integrated cost of labor of the producer”. The lower these costs, the more likely a country would acquire a trade surplus. Such an advantage does not automatically wear off over time (Shaikh and Antonopou-los, 1998). Post-Keynesians have adopted this approach partially and agreed that the less expensive the labor force in a country, the more trade surplus the coun-try would acquire (Harvey, 2017: 12).
In the alternative approach that Hernández presented in his study as of 2010, he claims that money flows caused by trade imbalances would not fulfill the bal-ance as in the quantity theory of money and that such balance would be achieved through the exchange rates proposed by Marx, Keynes, and Harrod (Hernández, 2010: 57). It means that absolute cost advantages would not disappear with money flows and the theory of absolute advantages persists.
It also means that free trade would further increase the trade imbalance, which automatically includes capital flows.
Therefore, a country incurring a trade deficit would become an international debtor. One of the points that Hernández underlined regarding exchange rates in the same study is that, similar to Shaikh and Antonopoulos (1998), the long-term real exchange rates would be determined by vertical real unit labor cost ra-tios in the tradable sectors of the producing countries.14 Secondly, the trade defi-cits or surpluses are not anomalies of the competitively operating market system. Thirdly, the devaluation would not have a permanent influence on the trade bal-ance unless the devaluation is accompanied by a significant change in national real wages or productivity, in other words, production costs.
14 This means that neither absolute nor relative purchasing power parity would apply in general.

114
GLOBAL COMPETITION AND EXCHANGE RATE DETERMINATION
Yelda Bugay TEKGÜL
Conclusion
The globalization of the world economy emphasizes the importance of interna-tional competition. The phenomenon of international competition is explained with some standard views in terms of economic theory. These views also constitute a theoretical basis for organizations such as IMF and WB that steer world trade. The theoretical framework on which the standard views are based relies on the “Principle of Comparative Advantages” put forward by David Ricardo and binds international competition to costs defined by the exchange rate. This theory is represented by the Monetary Approach Model and Portfolio Balance Model, on which organizations such as the IMF and WB are based. The theoretical claim put forward is that free competition would offset foreign trade (current account) with its long-term effect on the exchange rate. The predictions of this theoreti-cal view are incompatible with the data of the world economy. As can be seen in Table 1, there are serious differences in the current account deficits/surpluses of the economies that are predominant in the world economy. Also, per capita na-tional income values, which are among the basic welfare indicators of these coun-tries, differ from each other. Therefore, standard (orthodox) theoretical views do not seem to comply with real-world data, in terms of predicting and explaining global competition. Such inconsistency in which standard theories face the real world brings forth alternative exchange rate determination models (Post-Keynes-ian explanations, in general) and Ricardo’s views are criticized. These criticisms concentrate on the need to prioritize capital flows, production technologies, and unit labor costs between countries, rather than explaining the exchange rate with the relative demand for and supply of foreign currency. Consequently, there are arguments that, instead of the classical views that dominate the determination of exchange rates, the exchange rates are largely determined by the demand for foreign exchange stemming from international investors’ efforts to adjust their portfolios, and permanent imbalance of payments arise due to the rise in capital flows dominating the market.
References
Andrade, R. P., Prates, D. M. (2013) Exchange rate dynamics in a peripheral monetary economy: a Keynesian perspective, Journal of Post-Keynes-ian Economics, v. 35, n. 3, pp.399-416.

PERSPECTIVES ON MODERN ECONOMY
Aizhan KHOICH, Ali Eren ALPER, Ahmet Arif EREN
115
Davidson, P. (1998) Volatile Financial Markets and the Speculator, Economic Issues, 3(2), Reprinted in L. Davidson (eds.) Uncertainty, Interna-tional Money, Employment and Theory: The Collected Writings of Paul Davidson, vol 3, ch.21, London: McMillan, 1999, pp.276-295.
Dow, S.C. (1999) International Liquidity Preference and Endogenous Credit, In J T Harvey and J Deprez (eds.), Foundations of Internation-al Economics: A Post Keynesian Analysis, London: Routledge, pp.153-170
Harvey, John T. (1991) A Post Keynesian View of Exchange Rate Determina-tion, Journal of Post Keynesian Economics, Vol. 14, No.1, pp. 61-71.
Harvey, John T. (1995) The International Monetary System and Exchange Rate Determination: 1945 to the Present, Journal of Economic Issues, Vol. 29, No. 2, pp. 493-502
Harvey, John T. (1996) Orthodox Approaches to Exchange Rate Determi-nation: A Survey, Journal of Post-Keynesian Economics, vol. 18, n. 4.pp. 567-583.
Harvey, John T. (1999) Exchange Rates, Volatility a misalignment in the Post-Bretton Woods era, in Foundations of International Econom-ics: Post Keynesian Perspectives, J. Deprez and J.T. Harvey (eds.), London: Routledge, pp.200-211.
Harvey, John T. (2005) Post Keynesian versus Neoclassical Explanations of Ex-change Rate Movements: A Short Look at the Long Run, Journal of Post Keynesian Economics, Vol. 28, No. 2, pp. 161- 179
Harvey, John T. (2007) Teaching Post Keynesian Exchange Rate Theory, John T. Harvey Source: Journal of Post Keynesian Economics, Vol. 30, No. 2, pp. 147- 168.
Harvey, John T. (2009) Currencies, Capital Flows, and Crises: A Post Keynesi-an Analysis of Exchange Rate Determination, London: Routledge.
Harvey, John T. (2017) Exchange Rates and the Balance of Payments: Recon-ciling an Inconsistency in Post Keynesian Theory, Working Paper, https://www.researchgate.net/publication/319991305

116
GLOBAL COMPETITION AND EXCHANGE RATE DETERMINATION
Yelda Bugay TEKGÜL
Hernández F. A. M. (2010) “An alternative theory of real exchange rate deter-mination: theory and empirical evidence for the Mexican econo-my, 1970-2004”, Investigación Económica, vol. 69, 273, pp.55-84.
Milberg, William (1994) Is absolute advantage passé? Towards a post-Keynes-ian/Marxian theory of international trade, Competition, Technol-ogy, and Money: Classical and Post-Keynesian Perspectives, Mark Glick edt. Aldershot, UK: Edward Elgar, pp.219-235.
Ramos A.D., D.M. Prates (2018) The Post-Keynesian view on exchange rates: towards the consolidation of the different contributions in the ABM and SFC frameworks, Texto para Discussão. Unicamp. IE, Campinas, n. 352, ISSN 0103-9466.
Rodrik, Dani (2001) The Global Governance of Trade: As if Trade Really Mattered. New York: United Nations Development Programme (UNDP)
Schulmeister, S. (1988) Currency speculation and dollar fluctuations, BNL Quarterly Review, 41(167), 343-365
Schulmeister, S. (2009a) Aggregate trading behavior of technical models and the yen/dollar exchange rate 1976–2007, Japan and the World Economy, Volume 21, Issue 3, 270-279.
Schulmeister, S. (2009b) Trading Practices and Price Dynamics in Commodity Markets and the Stabilising Effects of a Transaction Tax, 2009/018-1/S/WIFO project no: 6408
Shaikh, Anwar (1980) The laws of International exchange, in Growth, Profits and Property: Essays in the Revival of Political Economy, pp.204-235, E.J. Nell (ed.), Cambridge University Press, Cambridge
Shaikh, Anwar M., Rania Antonopoulos (1998) Explaining long-term ex-change rate behavior in the United States and Japan, Jerome Levy Economics Institute, Working Paper, no.250.
Shaikh, Anwar (2016), Capitalism, Oxford University Press.

117
7LOGISTICS-TRADE PERFORMANCE NEXUS: EVIDENCE FROM A LARGE SAMPLE OF COUNTRIESÖzge DEMİRAL1, Mehmet DEMİRAL2
Abstract
This chapter empirically analyzes a six-year (2007, 2010, 2012, 2014, 2016, 2018) dataset of exports, imports, and logistics performance metrics of 133 countries to assess the relationships between international trade performance and logistics per-formance. Unlike the former studies, we group countries into 53 trade-surplus countries (TSCs) and 80 trade-deficit countries (TDCs) based on their average trade balance over the period of interest. We extend export and import functions by including foreign direct investment inflows and the World Bank’s overall in-ternational logistics performance index together with the widely-examined pre-dictors of the trade such as exchange rate, domestic income, and foreign income. Findings coherently reveal that improved logistics tend to promote both exports and imports for all country groups. Additional results contradict some predic-tions of the conventional theory on the exchange rate, domestic income, and for-eign income adjustment patterns of the trade balance. Overall evidence suggests that countries, particularly TDCs, need to invest in logistics and promote pro-duction and productivity in export sectors to increase the values and volumes of exports as well as their domestically produced contents which consequently help in curbing the import dependency and trade deficit.
1 Ph.D., Associate Prof., Department of International Trade and Logistics Management, Niğde Ömer Halisdemir University, 51240, Niğde, Turkey. Tel (w): +(90) 388-225-4296, e-mail: [email protected], ORCID ID: 0000-0003-0165-2206.
2 Ph.D., Associate Prof., Department of Economics, Niğde Ömer Halisdemir University, 51240, Niğde, Turkey. Tel (w): +(90) 388-225-2047, e-mail: [email protected], ORCID ID: 0000-0002-8836-5682.

118
LOGISTICS-TRADE PERFORMANCE NEXUS: EVIDENCE FROM A LARGE SAMPLE OF COUNTRIES
Özge DEMİRAL, Mehmet DEMİRAL
Keywords: Logistics, Logistics performance index, Trade performance, Export func-tion, Import function
JEL codes: C33, F14, F21, L90
1. Introduction
It is a well-documented fact that international trade provides multifaceted contri-butions in terms of productivity, income growth, economic development, tech-nological diffusion, and employment for open economies (Edwards, 1993; Ma-tusz, 1996; Barro and Sala-i-Martin, 1997; Alcalá and Ciccone, 2004; Thirlwall, 2006; Awokuse, 2008; Sannassee et al., 2014). Consistently, there has been a vast literature about the channels through which trade performance of especially developing countries can be improved with a specific reference to the sequential export-led growth success of some East Asian countries which the World Bank (WB, 1993) first described as the ‘East Asian miracle’. Within the political econ-omy approach, exchange rate policies and changes in relative prices of exports and imports have attracted a huge interest regarding the Marshall-Lerner condi-tion (Goldstein and Khan, 1978; Dong, 2017) and the J-curve adjustment pro-cess (Magee, 1973; Bahmani-Oskooee and Hegerty, 2010) where domestic and foreign income and exchange rate are the core determinants of a country’s trade performance. However, with the increasing financial integration, vertical special-ization, intra-industry trade, and global supply chains participation together with the global adoption of free-floating exchange rate regimes, the effect of exchange rate have become inconclusive (Rose, 1990; Kharroubi, 2011; Dong, 2017) and the J-curve adjustment pattern has become even more ambiguous (Bahma-ni-Oskooee and Hegerty, 2010; Tandon, 2014).
Besides such widely-recognized determinants of international trade performance as globalization and/or openness, macroeconomic indicators, productivity, competi-tiveness, and resource abundance, a growing body of international trade literature has been investigating the logistics effects on international trade performances of countries (Arvis et al., 2018). This research strand goes back to the theory which links the rising international trade to declining international transportation costs (Limão and Venables, 2001; Hummels, 2007) and arises a question for studies: Do better logistics services in countries reduce their trade costs and raise their exports? (Behar et al., 2011). As the integration of countries into global supply

PERSPECTIVES ON MODERN ECONOMY
Aizhan KHOICH, Ali Eren ALPER, Ahmet Arif EREN
119
chains has increased, the relationships between logistics performance and trade facilitation have recently received attention from researchers, policy-makers, and trade practitioners (Hausman et al., 2013; Mangan and Lalwani, 2016; Gani, 2017). Previous studies in the relevant literature on the predictors of countries’ trade performance have rarely considered the impacts of logistics performance because of the limited availability of country-specific and internationally-compa-rable metrics of logistics performance. However, recently some unique initiatives such as the World Bank’s Logistics Performance Index (LPI) have been providing international composite metrics for logistic performance which has increased the number of empirical studies investigating the logistics-trade performance nexus at sector-specific, country-specific, and cross-country levels (Korinek and Sour-din, 2011; Felipe and Kumar, 2012; Kabak et al., 2019).
The relevant cross-country studies mostly classify countries by income and/or development levels. To contribute to the developing literature, this study exam-ines how logistics performance affects imports and exports for a large sample of countries including 53 trade-surplus countries (TSCs) and 80 trade-deficit coun-tries (TDCs)3 using a slightly unbalanced dataset of the years 2007, 2010, 2012, 2014, 2016, 2018. In the rest of the study, section 2 explains logistics and logis-tics performance based on the World Bank’s international LPI measures. Section 3 briefly presents an overview of the relevant literature. Section 4 is devoted to the empirical framework which introduces variables, data, model, and methodology and reports the results, respectively. The study concludes with a short discussion of some policy implications based on the key findings.
3 TSCs included in the sample are “Algeria, Angola, Argentina, Austria, Bahrain, Belgium, Bolivia, Chile, China, Cote d’Ivoire, Czech Republic, Denmark, Estonia, Finland, Gabon, Germany, Hungary, Iceland, Indonesia, Iran, Iraq, Ireland, Israel, Italy, Japan, Kazakhstan, Kuwait, Libya, Luxembourg, Malaysia, Malta, Netherlands, New Zealand, Nigeria, Norway, Oman, Paraguay, Peru, Poland, Qatar, Russian Federation, Saudi Arabia, Singapore, Slovak Republic, Slovenia, South Korea, Spain, Sweden, Switzerland, Thailand, United Arab Emirates, Uzbekistan, Zambia”. The TDCs sample includes “Afghanistan, Albania, Armenia, Australia, Bahamas, Bangladesh, Belarus, Benin, Bhutan, Bosnia and Herzegovina, Brazil, Bulgaria, Burkina Faso, Burundi, Cambodia, Cameroon, Canada, Chad, Colombia, Comoros, Costa Rica, Croatia, Cyprus, Dominican Republic, Ecuador, Egypt, El Salvador, France, Gambia, Georgia, Ghana, Greece, Guatemala, Guinea, Guinea-Bissau, Guyana, Haiti, Honduras, India, Jamaica, Jordan, Kenya, Kyrgyz Republic, Lao PDR, Latvia, Lebanon, Lesotho, Liberia, Lithuania, Madagascar, Mali, Mauritania, Mauritius, Mexico, Mongolia, Myanmar, Namibia, Nepal, Niger, Pakistan, Panama, Philippines, Portugal, Romania, Rwanda, Senegal, Serbia, Sierra Leone, South Africa, Sri Lanka, Tajikistan, Togo, Tunisia, Turkey, Ukraine, United Kingdom, United States, Uruguay, Vietnam, Zimbabwe”.

120
LOGISTICS-TRADE PERFORMANCE NEXUS: EVIDENCE FROM A LARGE SAMPLE OF COUNTRIES
Özge DEMİRAL, Mehmet DEMİRAL
2. Logistics and Logistics Performance
As a narrow notion, logistics is simply about an operational process of transport of goods and services from the first location they are produced to the final des-tination they are consumed. Logistics services have micro-level and macro-level roles in domestic and international trade and, thus, in the socio-economic devel-opment and global competitiveness of a country. In the diamond model of Por-ter (1990), one of the key pillars determining the competitiveness of a country’s industry in international markets is infrastructure including advanced transporta-tion, logistics services, and telecommunications. As the diamond model depicts, the success of companies, industries, and countries requires efficient logistics. The rationale behind this prediction is the microeconomic role of logistics in making a company competitively advantaged in the dynamic world market beyond its static comparative advantage of factor endowment. The competitiveness of companies spreads within and between industries leading to an increase in nationwide com-petitiveness. The availability of logistics services in a country enables companies to compete with their counterparts in international markets and to involve more ef-ficiently in global supply chains. Considering the cost-cutting effects, many coun-tries have been investing in logistics to facilitate trade potential and performance of local companies. Besides, in today’s murky business environment, global sup-ply chains have been becoming more and more complex. Some geographically disadvantaged countries endeavor to link global supply chains while those that are currently engaging in global supply chains face risks associated with uncer-tainty and instability. In both cases, the availability of logistics services is a key fac-tor for tackling with these challenges (Hausman et al., 2013; Arvis et al., 2018).
In line with the increased understanding of the crucial contribution of logistics and transport services to international trade and investment relations, both schol-ars and business practitioners have become more interested in the conceptualiza-tion and measurement of logistics performance of countries (Marti et al., 2017; Arvis et al., 2018). These measures help in comparing countries’ logistics perfor-mances and explaining why some countries have more improved logistics than others. The World Bank’s LPI metric is a unique benchmarking tool that pro-vides a reliable comparison of global advances in logistics based on time, cost, and punctuality. The World Bank’s LPI database provides both domestic and in-ternational metrics.

PERSPECTIVES ON MODERN ECONOMY
Aizhan KHOICH, Ali Eren ALPER, Ahmet Arif EREN
121
The international LPI (hereinafter LPI unless otherwise specified) reflects a country’s logistics performance based on the efficiency of the customs proce-dures, quality of infrastructure and logistics services, ease of arranging ship-ments which are competitively priced, capability to track and trace consign-ments, and punctuality of shipments. The LPI comes from a survey pool of logistics professionals who evaluate and score logistics services in the foreign countries in which they operate. The LPI ranges from 1 (the lowest logistics performance) to 5 (the highest logistics performance) (WB WDI, 2020). The list of best performers and the gap between high- and low-income countries in LPI did not change much from the first edition in 2007 to the sixth edition in 2018. High-income countries especially those from the European Union (EU) are among the best performers. Figure 1 exhibits clearly that high-income coun-tries outperform low-income countries in terms of the overall LPI while Fig-ure 2 is illustrating neither exports nor imports are strongly correlated with the LPI in 2018. Thus, a regression analysis is required to explore the causal rela-tionships between LPI and trade performance.
Ove
rall
LPI (
1=lo
w to
5=h
igh)
GDP per capita (constant 2010 USD) (1,000 USD)
Note: Several countries that have a gross domestic product (GDP) per capita higher than 80,000 US Dollar (USD) are not seen in the fi gure. Source: WB WDI, 2020
Figure 1. Per Capita GDP and Overall LPI in Th e World, 2018 (153 countries)

122
LO GIS TIC S-TRADE PERFORMANCE NEXUS: EVIDENCE FROM A LARGE SAMPLE OF COUNTRIES
Özge DEMİRAL, Mehmet DEMİRAL
Ove
rall
LPI (
1=lo
w to
5=h
igh)
Total exports of goods and services (% of GDP)
Total imports of goods and services (% of GDP)
Note: Several countries that have a trade share higher than 100% are not seen in the fi gure.Source: WB WDI, 2020
Figure 2. Trade Flows and Overall LPI in Th e World, 2018 (146 countries)
As a composite notion, logistics has wide-range definitions in both academic and professional arenas. Integrating the varied definitions and adopting the LPI ap-proach of the World Bank, we can broadly define logistics as the overall availability of materials, technologies, facilities, services, utilities, information, and transport systems to start and operate a business and manage the production, packaging, storage, distribution, control, and recycling of goods and services both within and between countries. Therefore, logistic performance is an evaluation of these qualifications in terms of quantity, quality, time, efficacy, cost, ease, and reach-ability. As described by Mangan and Lalwani (2016), logistics and logistics per-formance capture “getting the right product in the right way in the right quan-tity and right quality in the right place at the right time for the right customer at the right cost” where the attribution ‘right’ may change dynamically over time and between countries.
3. Literature Directions: An Overview
Studies in the literature on the logistics-trade performance nexus have used dif-ferent analytical approaches and provided strong cross-country evidence that the availability and quality of logistics services facilitate both exports and imports. This well-evidenced bidirectional link practically indicates that low-quality logis-tics services hinder trade performance by impeding the efficient use of both time and money. Empirical studies in the relevant literature can be distinguished

PERSPECTIVES ON MODERN ECONOMY
Aizhan KHOICH, Ali Eren ALPER, Ahmet Arif EREN
123
between those adopting a cross-country approach and those with a country-spe-cific approach while the number of studies in the latter group is relatively much lower due to the unavailability of long-period logistics data of individual coun-tries. Given the well-documented logistics contribution in trade facilitation, some studies distinguish between the impacts of specific improvements in logistics per-formance. A study of Hausman et al. (2013) indicated that the relative impor-tance of time-saving and cost-cutting effects as well as availability, reliability, and complexity characteristics of logistics performance depended on the bilateral trade conditions. Their findings imply that such trade conditions as the distance be-tween trade partners and changeable cross-border duties alter transportation costs and thus affect bilateral trade performance. The previous studies have shown that such country characteristics as the development phase, income level, location, and membership of international organizations matter for trade facilitation effects of logistics. Consistently, cross-country studies can be reorganized into two groups as those classifying countries by income and/or development levels (e.g. Korinek and Sourdin, 2011; Gani, 2017; Çelebi (2019)) and those considering the mem-bership of regional economic integration and/or international organizations (e.g. Felipe and Kumar, 2012; Puertas et al., 2014; Lai et al., 2019).
Korinek and Sourdin (2011) analyzed the impact of trade logistics in low-, mid-dle-, and high-income countries using several indicators obtained from the World Bank’s LPI and Doing Business metrics as well as the infrastructure component of the World Economic Forum’s Global Competitiveness Index. Their results from the estimations of gravity models revealed that higher-quality trade logistics sig-nificantly enhanced trade, particularly exports, for all countries. They highlight that developing and least developed countries may get more benefits from in-creased trade flows promoted through logistics investments. Gani (2017) esti-mated export and import equations in conjunction with logistics performance using logistics data from a sample of 60 countries including both developed and developing countries with different income levels and found trade, more signif-icantly exports, associated positively with logistics performance. Adopting an income-level approach, Çelebi (2019) found that low-income and lower-mid-dle-income countries got relatively more benefits from the improvement of their logistics services since logistics quality increased their exports more than their im-ports whereas better logistics performance tended to arise imports more than ex-ports in the upper-middle-income and high-income countries.
124
LOGISTICS-TRADE PERFORMANCE NEXUS: EVIDENCE FROM A LARGE SAMPLE OF COUNTRIES
Özge DEMİRAL, Mehmet DEMİRAL
Within the regional aspect, in the case of Central Asian countries, Felipe and Kumar (2012) estimated a gravity model and found that trade facilitation which they assessed based on the LPI and its dimensions, tended to increase trade gains. Their findings showed that the highest contribution to total trade came from the improvement in infrastructure, followed by logistics and efficiency of the cus-toms and other border agencies. Marti et al. (2014) used a gravity model to ex-amine the effects of procedures, costs, and infrastructure aspects of the LPI on trade experience in emerging economies grouped regionally. Their findings con-firmed that improvements in all aspects stimulated trade flows of countries espe-cially in Africa, South America, and Eastern Europe. Luttermann et al. (2020) found a significant positive relationship between logistics performance and trade as well as foreign direct investment for 20 Asian countries. Regional studies seem to have a specific interest in East Asian countries because of their relatively higher performance in both logistics and trade compared to other developing regions. A recent study of Lai et al. (2019) found that advancement in transport logistics stimulated both regional and global trade for the Association of Southeast Asian Nations (ASEAN) countries. The EU region is an example of reginal economic integration linked with advanced logistics networks. Gravity model estimations of Puertas et al. (2014) revealed that LPI components were important for espe-cially exporting EU countries.
As previously stated, a better performance in local logistics improves international competitiveness. On the other hand, upgrading different drivers of competitive-ness such as infrastructure, technology, and education may also support logistics performance. Kabak et al. (2019) analyzed this mutual interaction between the competitiveness and logistics performance adopting a mixed methodology on a dataset from the LPI and the World Economic Forum’s global competitiveness pillars. Their results support the two-way interaction that global competitiveness pillars particularly business sophistication, financial market development, infra-structure, and good market efficiency as well as higher education and training considerably improve the logistics performance which also tends to strengthen the competitiveness especially the market size pillar. Besides, several studies point out some possible weaknesses in the LPI methodology based on its unlikeliness to cap-ture all complex system of logistics (Rezaei et. al., 2018) and the possible subjec-tivity of the global LPI surveys which may embody personal judgments and pro-duce biased assessments (Beysenbaev and Dus, 2020). Relying on the LPI metric which reflects the overall logistics performance of countries, we estimate export

PERSPECTIVES ON MODERN ECONOMY
Aizhan KHOICH, Ali Eren ALPER, Ahmet Arif EREN
125
and import functions with a specific focus on the influences of logistic perfor-mance using a short panel dataset of a large sample of countries. The study dif-fers from previous research by adopting a trade-balance approach.
4. Empirical Framework4.1. Variables and Data
Our trade performance indicators, i.e. dependent variables, are total exports and imports of goods and services. Both indicators are expressed as a percentage of Gross Domestic Product (GDP). The logistics performance indicator is repre-sented by the Overall International Logistics Performance Index (OLPI). The World Bank’s LPI database (WB WDI, 2020) provides OLPI together with its six components: i) “ability to track and trace consignments (LPI-TRACK)”, ii) “competence and quality of logistics services (LPI-LOGS)”, iii) “ease of arrang-ing competitively priced shipments (LPI-SHIP)”, iv) “efficiency of customs clear-ance process (LPI-CUST)”, v) “frequency with which shipments reach consignee within scheduled or expected time (LPI-TIME)”, and vi) “quality of trade and transport-related infrastructure (LPI-INFR)”. These indices reflect logistics pro-fessionals’ perception of the logistics aspects on a rating ranging from 1 (low-est) to 5 (highest) on the surveys conducted by the World Bank in partnership with academic and international institutions and private companies and individ-uals engaged in international logistics. Scores are averaged across all respondents. Some studies include each of the OLPI and its dimensions separately. However, in our case, as pairwise correlations in Table 1 show, the OLPI can be some-what used interchangeably with its sub-dimensions since they are highly corre-lated. Therefore, we represent the logistics performance by the OLPI. By doing so, we also hindered serious multicollinearity problem which would produce un-stable regression results.

126
LOGISTICS-TRADE PERFORMANCE NEXUS: EVIDENCE FROM A LARGE SAMPLE OF COUNTRIES
Özge DEMİRAL, Mehmet DEMİRAL
Table 1. Correlations among World Bank’s LPI Metrics (133 countries, 2007-2018)
OLPI LPI-TRACK
LPI-LOGS
LPI-SHIP
LPI-CUST
LPI-TIME
LPI-INFR
OLPI 1
LPI-TRACK 0.97 1
LPI-LOGS 0.98 0.94 1
LPI-SHIP 0.94 0.88 0.90 1
LPI-CUST 0.96 0.90 0.93 0.90 1
LPI-TIME 0.94 0.90 0.89 0.85 0.86 1
LPI-INFR 0.97 0.92 0.95 0.88 0.95 0.88 1
Variables are described in Table 2. The Real Effective Exchange Rate (REER) da-taset is obtained from UNCTAD (2020) while the others are computed from the World Bank’s World Development Indicators (WB WDI, 2020).
Table 2. Variables, Descriptions, and Measurements
Dependent variables
Export Exports of goods and services (% of GDP).
Import Imports of goods and services (% of GDP).
Explanatory variables
REER Real effective exchange rate index (GDP deflator based), (2005=100). One-year lagged.
DInc Domestic income. Annual growth of GDP per capita (%). For import functions only.
FInc Foreign income. The OECD (except relevant member country) average of annual growth of GDP per capita (%). For export functions only.
FDIInf Foreign Direct Investment (FDI). Net inflows (% of GDP).
OLPI Overall International Logistics Performance Index.
The study uses a time-discrete annual panel dataset of 133 countries distinguished between TSCs and TDCs. Timespan is necessarily restricted by the limited avail-ability of LPI metrics which are currently available for six years (2007, 2010, 2012, 2014, 2016, 2018). Country classification is based on these six years’ av-erage trade deficits (export-import). Because of several years with missing data for some countries’ OLPI series, the dataset is arranged as slightly unbalanced. Countries with more than one missing data point are excluded from the sample.

PERSPECTIVES ON MODERN ECONOMY
Aizhan KHOICH, Ali Eren ALPER, Ahmet Arif EREN
127
Several descriptive statistics reported in Table 3 show that TSCs, on average, have higher OLPI than TDCs. Both TSCs and TDCs have similar import share in their GDP implying that TDCs have trade deficits due to relatively lower exports rather than higher imports compared to TSCs.
Table 3. Descriptive Statistics
Export Import REER DInc FInc FDIInf OLPI
Trade surplus countries-TSCs (53 countries, N: 310)
Mean 57.14 49.08 111.90 2.61 1.49 5.00 3.25
Max. 213.04 181.51 236.00 121.78 2.27 105.67 4.23
Min. 9.22 11.50 62.28 -24.50 0.66 -58.32 2.05
Std. dev. 37.94 33.05 22.05 7.71 0.54 12.90 0.58
Trade deficit countries-TDCs (80 countries, N: 461)
Mean 32.09 44.34 114.40 2.79 1.48 5.80 2.72
Max. 105.83 236.39 206.82 17.03 2.27 280.13 4.07
Min. 0.14 0.08 73.95 -9.16 0.66 -37.16 1.61
Std. dev. 16.23 20.89 21.15 3.19 0.54 18.89 0.47
Note: Descriptive statistics are represented on the common-sample basis for a better comparison.
Additionally, the bilateral correlations in Table 4 show that although import and export are strongly correlated in both country groups, the correlation is much higher in TSCs. It can be seen from Table 4 that both exports and imports are not correlated considerably with their presumed predictors.
Table 4. Pairwise Correlations between Import, Export and Their Predictors
Variables All sample (N:771)
TSCs (N:310)
TDCs N:461) Variables
All sample (N:771)
TSCs (N:310)
TDCs (N:461)
Correlations between Export and other variables
Correlations between Import and other variables
Import 0.83 0.96 0.71 Export 0.83 0.96 0.71
REER -0.15 -0.19 -0.09 REER -0.10 -0.21 0.03
DInc 0.06 0.04 0.17 DInc 0.03 0.00 0.13
FInc -0.02 -0.02 -0.03 FInc -0.02 -0.03 -0.02
FDIInf 0.22 0.42 0.18 FDIInf 0.27 0.44 0.19
OLPI 0.37 0.31 0.11 OLPI 0.13 0.34 -0.22

128
LOGISTICS-TRADE PERFORMANCE NEXUS: EVIDENCE FROM A LARGE SAMPLE OF COUNTRIES
Özge DEMİRAL, Mehmet DEMİRAL
4.2. Model and Method
In the empirical part, we estimate export and import functions using panel regres-sion models in Equation 1 and Equation 2, respectively. These functions build on the approaches of Goldstein and Khan (1978) and Rose (1990) as well as their derived specifications within the theoretical development of the Marshall-Lerner condition which we extended by including net FDI inflows and OLPI. Moreo-ver, for controlling the presence of the J-curve adjustment pattern introduced by Magee (1973) we include the REER series as one-year lagged (t-1).
where all variables are as previously explained in Table 2. In these linear equations, c (c=1,...,133=C) and t (t=2007, 2010, 2012, 2014, 2016, 2018=T=6) are the cross-section units (countries) and temporal units (years), while α0 and β0 are coun-try-specific constant effects of regressions. The composite random errors, e and u, contain both cross-section and time influences of all other factors excluded in the models. Finally, α1,…,α4 and β1,…,β4 parameters are the coefficients we respec-tively estimate for all sample (global panel), TSCs, and TDCs. Since the numbers of cross-section units of all panels are larger than those of temporal units, the study has a short panel structure. Variables except domestic income (DInc) and net FDI inflows (FDIInf) are in the logarithmic form (log) which enables us to interpret es-timated coefficients as elasticities. Within a panel data framework, linear regressions can be estimated through the fixed effects and random effects models. Both models can be either one-way (cross-section effects or time effects) or two-way (cross-sec-tion effects and time effects). Based on the statistics of the F-test, Lagrange multi-plier tests, and Hausman test, we found that one-way (cross-section) fixed effects models were fitting the data characteristics of all panel clusters better than alterna-tive model specifications. Consequently, we estimated panel regression models of ex-port and import functions using the country-weighed generalized least squares esti-mators which tolerate possible heteroskedastic and correlated errors to some degree.
4.3. Empirical Results
In Table 5, the regression results4 show that both exports and imports are posi-tively associated with OLPI for all panel groups while the estimated OLPI elas-
4 Data and unreported results are available from the authors upon request.

PERSPECTIVES ON MODERN ECONOMY
Aizhan KHOICH, Ali Eren ALPER, Ahmet Arif EREN
129
ticity of export is statistically insignificant (p>0.10) in TSCs. Increasing logistics performance raises imports more than exports in all country groups while the difference in export (0.13) and import (0.14) elasticities is not much for TDCs. Some additional findings tend to contradict the theoretical expectations: An in-crease in REER reduces exports more than imports for all groups. The import-re-ducing impact of REER is the lowest and statistically insignificant for TDCs. Furthermore, foreign income is negatively associated with exports for all panels whereas domestic income tends to increase imports significantly for only TDCs. Even their impacts are inconsiderably slight in magnitude, net FDI inflows seem to prevent the improvement of export performance in the global panel while they reduce imports in the global panel and TSCs.
Table 5. Regression Results of Estimated Export and Import FunctionsParameters, Variables
Global panel (N:771) TSCs (N:310) TDCs (N:461)
Estimated coefficients (α) of export function (logExport)
α0: Constant 5.25 [0.16](0.00)*** 5.79 [0.30](0.00)*** 5.06 [0.23](0.00)***
α1: log(REER)t-1 -0.39 [0.03](0.00)*** -0.43[0.06](0.00)*** -0.39 [0.05](0.00)***
α2: log(FInc) -0.04 [0.01](0.00)*** -0.03 [0.01](0.00)*** -0.05 [0.01](0.00)***
α3: FDIInf -0.00 [0.00](0.03)** -0.00 [0.00](0.24) -0.00 [0.00](0.35)
α4: log(OLPI) 0.15 [0.06](0.01)*** 0.10 [0.11](0.38) 0.13 [0.08](0.08)*
Weighted statistics
R2; Adj. R2 0.99; 0.98 0.98; 0.98 0.96; 0.96
F-st. 369.14 (0.00)*** 262.91 (0.00)*** 120.36 (0.00)***
Durbin-Watson st. 1.43 1.42 1.38
Estimated coefficients (β) of import function (logImport)
β0: Constant 4.54 [0.15](0.00)*** 4.73 [0.28](0.00)*** 3.65 [0.17](0.00)***
β1:log(REER)t-1 -0.17 [0.03](0.00)*** -0.28 [0.06](0.00)*** -0.03 [0.03](0.41)
β2: DInc 0.00 [0.00](0.13) -0.00 [0.00](0.25) 0.01 [0.00](0.00)***
β3: FDIInf -0.00 [0.00](0.05)** -0.00 [0.00](0.03)** 0.00 [0.00](0.93)
β4: log(OLPI) 0.20 [0.05](0.00)*** 0.29 [0.08](0.00)*** 0.14 [0.06](0.02)**
Weighted statistics
R2; Adj. R2 0.99; 0.98 0.99; 0.99 0.98; 0.98
F-st. 343.10 (0.00)*** 378.53 (0.00)*** 248.02 (0.00)***
Durbin-Watson st. 1.79 1.72 1.74
Note: ***, ** and * indicate statistical significance at .01, .05, and .10 levels, respectively. Standard errors are in [brackets] and probabilities are in (parentheses).

130
LOGISTICS-TRADE PERFORMANCE NEXUS: EVIDENCE FROM A LARGE SAMPLE OF COUNTRIES
Özge DEMİRAL, Mehmet DEMİRAL
5. Conclusion
Using a short panel dataset of 133 countries classified into TSCs and TDCs by trade balance, this chapter estimated export and import functions with a specific interest in the effects of logistics performance on trade performance. Our find-ings revealed that logistics performance proxied by the OLPI was coherently lead-ing to increases in both exports and imports of all countries regardless they have a trade deficit or trade surplus. For countries that have been facing a persistent trade deficit, investing in logistics is an efficient way to facilitate export but only a part of the solution to ease trade deficit and needs to be accompanied by other policy initiatives to stimulate export side of trade rather than just mitigating im-ports. Our study ambiguously showed that the adjustment patterns of the exchange rate, domestic income, and foreign income predicted by conventional wisdom were invalid, even controversial, in our case. Based on the estimated impacts of net FDI inflows, we can infer that recent multinational activities are mostly mo-tivated by market size while their effects are inconclusive for TDCs. Therefore, especially TDCs need to promote productivity in export sectors to increase both exports and domestic value-added share. Furthermore, TDCs should promote the local production of imported goods and services as well as imported intermedi-ates and capital goods to diminish import dependency and import penetration. This import-substitution may help in curbing trade deficit through increases in both the volumes and values of exports.
This empirical study provides new evidence from a recent dataset and contrib-utes to the relevant body of literature on the logistics and trade performance nexus through its large sample and country classification based on the trade bal-ance. Given the well-evidenced trade facilitation effect as well as productivity, eco-nomic growth, competitiveness, and employment contributions of logistics ser-vices, some countries especially those with large trade deficits underperform in logistics quality. Therefore, future empirical studies may explore the drivers and barriers of logistics performance with a specific reference to the logistic perfor-mance elasticity of exports in TDCs.

PERSPECTIVES ON MODERN ECONOMY
Aizhan KHOICH, Ali Eren ALPER, Ahmet Arif EREN
131
References
Alcalá, F. & Ciccone, A. (2004). Trade and productivity. The Quar-terly Journal of Economics, 119(2), 613-646. https://doi.org/10.1162/0033553041382139
Arvis, J.F., Ojala, L., Wiederer, C., Shepherd, B., Raj, A., Dairabayeva, K. & Kiiski, T. (2018). Connecting to compete 2018: Trade logistics in the global economy. Washington: World Bank.
Awokuse, T.O. (2008). Trade openness and economic growth: Is growth ex-port-led or import-led? Applied Economics, 40(2), 161-173. https://doi.org/10.1080/00036840600749490
Bahmani-Oskooee, M. & Hegerty, S.W. (2010). The J- and S-curves: A survey of the recent literature. Journal of Economic Studies, 37(6), 580-596. https://doi.org/10.1108/01443581011086639
Barro, R.J. & Sala-i-Martin, X. (1997). Technological diffusion, convergence, and growth. Journal of Economic Growth 2, 1-26. https://doi.org/10.1023/A:1009746629269
Behar, A., Manners, P. & Nelson, B. (2011). Exports and international logis-tics. World Bank Policy Research Working Papers, 5691. https://openknowledge.worldbank.org/handle/10986/3455 (Accessed 10 May 2020)
Beysenbaev, R., & Dus, Y. (2020). Proposals for improving the Logistics Per-formance Index. The Asian Journal of Shipping and Logistics, 36(1), 34-42. https://doi.org/10.1016/j.ajsl.2019.10.001
Çelebi, D. (2019). The role of logistics performance in promoting trade. Mar-itime Economics & Logistics, 21, 307-323. https://doi.org/10.1057/s41278-017-0094-4
Dong, F. (2017). Testing the Marshall-Lerner condition between the U.S. and other G7 member countries. The North American Journal of Economics and Finance, 40, 30-40. https://doi.org/10.1016/j.na-jef.2017.01.003
Edwards, S. (1993). Openness, trade liberalization, and growth in developing countries. Journal of Economic Literature, 31(3), 1358-1393.

132
LOGISTICS-TRADE PERFORMANCE NEXUS: EVIDENCE FROM A LARGE SAMPLE OF COUNTRIES
Özge DEMİRAL, Mehmet DEMİRAL
Felipe, J. & Kumar, U. (2012) The role of trade facilitation in Central Asia. Eastern European Economics, 50(4), 5-20. https://doi.org/10.2753/EEE0012-8775500401
Gani, A. (2017). The logistics performance effect in international trade. The Asian Journal of Shipping and Logistics, 33(4), 279-288. https://doi.org/10.1016/j.ajsl.2017.12.012
Goldstein, M. & Khan, M. (1978). The supply and demand for exports: A simultaneous approach. The Review of Economics and Statistics, 60(2), 275-286. https://doi.org/10.2307/1924981
Hausman, W.H., Lee, H.L. & Subramanian, U. (2013). The impact of logistics performance on trade. Production and Operations Man-agement, 22(2), 236-252. https://doi.org/10.1111/j.1937-5956.2011.01312.x
Hummels, D. (2007). Transportation costs and international trade in the sec-ond era of globalization. Journal of Economic Perspectives, 21(3), 131-154. https://doi.org/10.1257/jep.21.3.131
Kabak, Ö., Önsel Ekici, Ş. & Ülengin, F. (2019). Analyzing two-way inter-action between the competitiveness and logistics performance of countries, Transport Policy (2019). https://doi.org/10.1016/j.tran-pol.2019.10.007
Kharroubi, E. (2011). The trade balance and the real exchange rate. BIS Quar-terly Review, 33-42. https://www.bis.org/publ/qtrpdf/r_qt1109e.pdf (Accessed 20 June 2020)
Korinek, J. and Sourdin, P. (2011). To what extent are high-quality logistics services trade facilitating? OECD Trade Policy Papers, 108, Paris: OECD Publishing. http://dx.doi.org/10.1787/5kggdthrj1zn-en
Lai, K., Pang, Y., Wong, C.W.Y., Lun, Y.H.V. & Ng, Y.N.E. (2019). Are trade and transport logistics activities mutually reinforcing? Some em-pirical evidences from ASEAN countries. Journal of Shipping and Trade 4(2). https://doi.org/10.1186/s41072-019-0041-x
Limão, N. & Venables, A.J. (2001). Infrastructure, geographical disadvantage, transport costs, and trade. The World Bank Economic Review, 15(3), 451-479.

PERSPECTIVES ON MODERN ECONOMY
Aizhan KHOICH, Ali Eren ALPER, Ahmet Arif EREN
133
Luttermann, S., Kotzab, H. & Halaszovich, T. (2020). The impact of logistics performance on exports, imports and foreign direct investment. World Review of Intermodal Transportation Research, 9(1). https://doi.org/10.1504/WRITR.2020.106444
Magee, S. (1973). Currency contracts, pass-through, and devaluation. Brook-ings Papers on Economic Activity, 1973(1), 303-325. https://doi.org/10.2307/2534091
Mangan, J. & Lalwani, C.C. (2016). Global logistics and supply chain manage-ment. 3rd ed., West Sussex: Wiley.
Marti, L., Martin, J.C. & Puertas, R. (2017). A Dea-logistics performance index. Journal of Applied Economics, 20(1), 169-192. https://doi.org/10.1016/S1514-0326(17)30008-9
Marti, L., Puertas, R. & Garcia, L. (2014) The importance of the Logistics Per-formance Index in international trade. Applied Economics, 46(24), 2982-2992. https://doi.org/10.1080/00036846.2014.916394
Matusz, S. (1996). International trade, the division of labor, and unemploy-ment. International Economic Review, 37(1), 71-84. https://doi.org/10.2307/2527246
Porter, M.E. (1990). The competitive advantage of nations. New York: Free Press.
Puertas, R., Marti, L. & García, L. (2014). Logistics performance and export competitiveness: European experience. Empirica, 41, 467-480. https://doi.org/10.1007/s10663-013-9241-z
Rezaei, J., Roekel, W.S.V. & Tavasszy, L. (2018). Measuring the relative impor-tance of the logistics performance index indicators using best worst method. Transport Policy, 68, 158-169. https://doi.org/10.1016/j.tranpol.2018.05.007
Rose, A.K. (1990). Exchange rates and the trade balance: Some evidence from developing countries. Economics Letters, 34(3), 271-275. https://doi.org/10.1016/0165-1765(90)90130-S
Sannassee, R., Seetanah, B., & Jugessur, J. (2014). Export-led growth hypoth-esis: A meta-analysis. The Journal of Developing Areas, 48(1), 361-385.

134
LOGISTICS-TRADE PERFORMANCE NEXUS: EVIDENCE FROM A LARGE SAMPLE OF COUNTRIES
Özge DEMİRAL, Mehmet DEMİRAL
Tandon, S. (2014). Trade balance and the real exchange rate: An empirical anal-ysis of multilateral and bilateral relationship. Foreign Trade Review, 49(2), 117-139. https://doi.org/10.1177/0015732514525222
Thirlwall, A. P. (2006). Growth & development: With special reference to develop-ing economies. 8th ed., New York: Palgrave Macmillan.
UNCTAD (2020) https://unctadstat.unctad.org/wds (Accessed 11 July 2020)
WB (1993). The East Asian miracle: Economic growth and public policy. London: Oxford University Press.
WB WDI (2020). https://databank.worldbank.org/source/world-develop-ment-indicators (Accessed 3 May 2020)

135
8ESTIMATION OF RELATIONSHIP BETWEEN INFLATION, FOREIGN EXCHANGE RATES AND OIL PRICES IN TURKEYBige Küçükefe1
1. Introduction
The mechanism through which foreign exchange rates and energy prices effect consumer price inflation (CPI) is well understood. Changes in cost of imported goods in terms of local currency due to exchange rate fluctuations or energy prices results in direct impact on CPI in an open economy. Price stability in many de-veloping countries after 2000 is owed to implementation of exchange rate sta-bilization regimes in various forms (currency peg, currency board etc.) (Fetai et al, 2016). US dollar and Euro are the main trading currencies for international trade. Thus, any significant depreciation of local currency in developing coun-tries against the major trading currencies results in higher inflation. Exchange rate has the effect of a change in local currency import prices due to a change in ex-change rate between importing and exporting countries and thereby resulting ef-fect (positive or negative) on inflation (Golberg and Knetter, 1997). Working on a panel data of 71 countries, Choudri and Hakura (2001) found a pass-through effect from exchange rates to prices.
As the main source of energy input for many products and industries, oil price is one of the important factors determining consumer prices. Turkey is an oil im-porter country with current account deficit (Kucukefe, 2019). Hence, understand-ing the relationship between CPI, foreign exchange rates and oil prices is crucial by policymakers. In this paper, I aim to develop a vector error correction model to estimate the relationship between these time series.
1 Dr., Tekirdağ Namık Kemal University, Marmara Ereğlisi Vocational School

136
ESTIMATION OF RELATIONSHIP BETWEEN INFLATION, FOREIGN EXCHANGE RATES AND OIL PRICES IN TURKEY
Bige Küçükefe
In his seminal paper, Sims (1980) proposed the use of vector autoregressions (VARs) for macroeconomic studies and policy decisions. VAR models remain to be use-ful for many purposes ranging from forecasting to evaluating economic models (Christiano, 2012). VAR models require all the variables to be I(0) (stationary). However, many macroeconomic time series move together and are non-station-ary due to market forces of demand and supply (Brooks, 2004) and differentiat-ing them to obtain stationary data may not be desired for analysis purposes such as preserving the stochastic trend. Implausible relationships between variables may be discovered as evidenced by Yule (1926) concerning the “proportion of England marriages to all marriages and the mortality rate over the period 1866-1911” (Ventosa-Santautaria, 2009) when all the regressors are I(1) and not coin-tegrated. This phenomenon is called “Spurious Regression” and may lead to un-usual statistical results.
Cointegration refers to long term relation between time series variables. Nonsta-tionary time series are cointegrated if a linear combination of them is stationary (i.e. I(0)). Engler and Granger (1987) extended the relationships between coin-tegration and error correction models suggested by Granger (1981) and devel-oped estimation procedures for co-movement of time series variables. The con-cept of cointegration is used to specify more realistic economic models and to better understand the long run relationships between macroeconomic and finan-cial variables. The existence of cointegration among nonstationary time series var-iables is a precondition for estimating Vector Error Correction Models (VECM) (Damba et. al. 2019).
The existing literature on cointegration is rich. Incekara et. al. (2015) tested va-lidity of Fisher Hypotesis (Fisher, 1930) by investigating long term link (cointe-gration) between nominal interest rates and inflation rates in Turkey and found that these two variables are cointegrated. Similarly, Nortey et al. (2015) reported a long-term relationship between inflation and exchange rates in Ghana by ap-plying a cointegration test. Stern (2000) analyzed the causal relationship between GDP and energy in the USA by testing for cointegration. A panel cointegration and error correction model by Apergis and Payne (2009) indicated that cointe-gration is present between real GDP, energy consumption, the labor force, and real gross fixed capital formation in six Central American countries over the pe-riod 1980-2004.

PERSPECTIVES ON MODERN ECONOMY
Aizhan KHOICH, Ali Eren ALPER, Ahmet Arif EREN
137
An empirical study by Abdurehman and Hacilar (2016) assessed the relationship between exchange rate and inflation by using an ordinary least square (OLS) and a simple generalized autoregressive conditional heteroscedasticity model (GARCH) in Turkey. Their result attributed the deviation of power purchasing parity to fac-tors such as transaction cost, government restriction and product specialization. Turhan et. al. (2014) investigated the role of oil prices in explaining the dynam-ics of selected emerging countries’ exchange rates between 2003 and 2010. The authors divided the time series data into three subsamples and obtained the cor-responding impulse response functions. Their finding suggested an increasing re-lationship between oil prices and exchange rates after 2008 financial crisis. Simi-larly, Zivkov (2019) used a wavelet-based Markov switching approach to investigate how oil price changes affect CPI in Central and Eastern European countries and found a low transmission mechanism from oil prices to CPI except for the coun-tries with more dependence on oil imports.
This paper aims to contribute the literature on the relationship between CPI, ex-change rates and oil prices in Turkey by cointegration and VECM approaches for which there exists a research gap to the best knowledge of the author. The rest of the paper is organized as follows. Section 2 describes data and methodology. The results are presented and discussed in Section 3. The last section concludes.
2. DATA AND METHODOLOGY2.1. Data
The dataset for this study covers monthly data from January 2005 to June 2020. The data for Turkish CPI and USD/TRY exchange rate data (monthly aver-age) was obtained from the Central Bank of the Republic of Turkey (TCMB). Oil price data (West Texas Intermediate) was drawn from Federal Reserve Bank of St. Louis. Oil prices are converted to Turkish Lira (TRY) by using the USD/TRY exchange rate for the respective month. Consumer price index is calculated from monthly CPI data (Jan 2005=100). All variables in the dataset are normal-ized to their respective June 2005 levels so that starting value is 1.0 for all series.

138
ESTIMATION OF RELATIONSHIP BETWEEN INFLATION, FOREIGN EXCHANGE RATES AND OIL PRICES IN TURKEY
Bige Küçükefe
Figure 1: Normalized values of USD/TRY, Consumer Price Index, and Oil Prices (TRY) (2005=1)
2.2. Cointegration
By definition, the variables in a N dimensional process yt are called cointegrated of order (d,b) if all components of yt are I(d) and there exists a linear combination zt := β’yt such that zt is I(d-b). For example, if all components of yt are I(1) and zt is I(0) (stationary), then yt is cointegrated of order (1,1), briefly, yt - CI(1,1). The vector β is called a cointegration vector (Lütkepohl, 2005).
A cointegration model variables may have a long-run relationship if there is a com-mon stochastic trend among the variables. The existence of a such relationship is referred to as equilibrium. Over time, the variables in the model return towards the equilibrium path even though they move away periodically.
2.3. Vector Error Correction Model
The deviation of a cointegrated variable from its equilibrium path may be mod-elled by using an error correction representation. Cointegrated multivariate time series have an error correction (VEC) representation and vice versa (Engle and Granger, 1987). If there is a cointegration relationship among variables, either a vector error correction model or autoregressive distributed lag (ARDL) model

PERSPECTIVES ON MODERN ECONOMY
Aizhan KHOICH, Ali Eren ALPER, Ahmet Arif EREN
139
(Zou, 2018) can be derived. ARDL has limitations with small sample data. A VEC model can be considered as a VAR model with cointegration constraints.
Assuming yt is N-dimensional stochastic time series and yit - I(1), i = 1, 2, …, N; a VAR model with p lags can be written as (ignoring trend component):
yt = µ + A1 yt-1 + A2 yt-2 + … + Ap yt-p + εt (1)
where µ is a constant vector and εt is the error term (iid). For (1), there always exist an error correction representation of the form:
Δyt = α0 + Π yt-1 + Δyt-i + εt(2)
where Δ is the difference operator, α0 is a constant vector, Π is the long run ma-trix, and is the vector of parameters representing the short-term relationships (Brooks, 2014). The cointegrating vectors α (speed adjustment towards long-run equilibrium) and β (long-run parameter) are determined from Π by decompo-sition (Π= α βr; where r: number of cointegrated relations). Restriction may be introduced on β and α if required by model.
2.4. Johansen Cointegration Test
Engle-Granger and Johansen approaches are widely used for cointegration test-ing (Bilgili, 1998). Two-step procedure of the Engle-Granger approach involves checking the integration of order of both variables and estimating the long-run relationship between with the regression. If the estimation residuals are station-ary, then the conclusion is made that the variables are cointegrated. On the other hand, the Engle-Granger procedure is not able to identify multiple cointegrating vectors besides other limitations such uncertainty of results under certain condi-tions and complications with two step procedure.
In a multivariate setting, cointegration testing amounts to determining the rank of Π in (2) for which Johansen (1988) established a novel method in a maxi-mum likelihood framework. The method suggests ordering the eigenvalues in as-cending order (λ1> λ2> … >λn) and testing the null hypothesis that there are at most r cointegrating vectors.

140
ESTIMATION OF RELATIONSHIP BETWEEN INFLATION, FOREIGN EXCHANGE RATES AND OIL PRICES IN TURKEY
Bige Küçükefe
3. RESULTS3.1. Unit Root Tests
The Augmented Dickey-Fuller (ADF) test was applied to each series at levels and the first differences to check whether they have a unit root or are stationary. Test-ing included three different model types: (a) no constant and no trend, (b) con-stant, (c) trend. Table 1 presents the results which revealed USD/TRY and CPI are nonstationary in levels but stationary at first differences for all model types. Oil Price TRY series was stationary at first difference and non-stationary at level without constant and trend model type. In order to test the “stationary” finding for “Oil price TRY” at constant and trend model types, separate ADF test was performed by an alternative R library (tseries) and the “Oil price TRY” series was found to be nonstationary (p-value=0.3579, lag order=5).
Table 1. Unit root test results for USD/TRY exchange rate, consumer price index, and TRY oil prices (Normalized values, January 2005 = 1)
ADF test in Levels ADF test in First Differences
None Constant Trend None Constant Trend
USD/TRY 2.7313 1.5662 -0.6473 -9.4289*** -9.8238*** -10.269***
CPI 6.7512 4.2814 1.3041 -6.1605*** -8.8718*** -10.7486***
Oil Price TRY
-0.6282 -2.6809* -4.5363*** -9.703*** -9.696*** -9.6517***
Note: *, **, *** denote 10%, 5%, and 1% critical values respectively
3.2 VAR Model Lag Selection
Correctly selecting the lag order of a VAR model is required before performing Jo-hansen cointegration test which is sensitive to lag selection. Table 2 shows the re-sults of lag selection by the Akaike Information Criterion (AIC), Hannan-Quinn Information Criterion (HQ), Schwarz Bayesian Criterion (SBC), and Final Pre-diction Error (FPE). A lag length of 9 was selected from AIC and FPE criterion. Other criterions HQ and SBC suggested lag lengths of 4 and 3, respectively.

PERSPECTIVES ON MODERN ECONOMY
Aizhan KHOICH, Ali Eren ALPER, Ahmet Arif EREN
141
Table 2. Lag selection criteria for Johansen cointegration test
Lag AIC HQ SBC FPE
1 -14.1761 -14.0877 -13.9582 6.97E-07
2 -14.3984 -14.2438 -14.0172 5.58E-07
3 -14.7729 -14.5519 -14.2282* 3.84E-07
4 -14.8732 -14.586* -14.1652 3.48E-07
5 -14.9148 -14.5613 -14.0434 3.34E-07
6 -14.9501 -14.5303 -13.9152 3.22E-07
7 -14.9876 -14.5015 -13.7894 3.11E-07
8 -15.0367 -14.4844 -13.6751 2.97E-07
9 -15.0712* -14.4525 -13.5461 2.87E-07*
10 -15.0363 -14.3513 -13.3478 2.98E-07
11 -15.0335 -14.2822 -13.1816 3.00E-07
12 -14.9959 -14.1784 -12.9807 3.13E-07
* indicates the lag order selected by criterion. AIC: Akaike Information Criterion, SBC: Schwarz Bayesian Criterion, FPE: Final Prediction Error, HQ: Hannan-Quinn Information Criterion
3.3. Cointegration Test
I used ‘urca’ package in R software to perform Johansen cointegration test on the time series. Results of the Johansen test revealed the presence of one cointe-grating equation in the long run at 1% significance level as shown in Table 3.
Johansen test has two variations which differ in terms of the alternative hypothe-sis. The maximum eigenvalue test examines whether the largest eigenvalue is zero relative to the alternative that the next largest eigenvalue is zero. Contrary to its name, Trace test is not based on the trace of Π matrix in (2). It tests whether the rank of Π is r for which the null hypothesis (Ho) is rank(Π) = r. For both vari-ations of Johansen test with ‘long run’ option, the null hypothesis of r=0 was re-jected at 1% significance level.
Table 3. Johansen cointegration test results for USD/TRY exchange rate, con-sumer price index, and TRY oil prices (Normalized values, January 2005 = 1)

142
ESTIMATION OF RELATIONSHIP BETWEEN INFLATION, FOREIGN EXCHANGE RATES AND OIL PRICES IN TURKEY
Bige Küçükefe
Ho:Rank (r)
Eigenvalue
Trace Test Maximum Eigen Test
StatisticCritical Values
StatisticCritical Values
10% 5% 1% 10% 5% 1%
r = 0 0.21943268 54.72*** 28.71 31.52 37.22 43.85*** 18.90 21.07 25.75
r <=1 0.04400274 10.87 15.66 17.95 23.52 7.97 12.91 14.90 19.19
r <=2 0.01628320 2.91 6.5 8.18 11.65 2.91 6.5 8.18 11.65
*** denotes rejection of null hypothesis at 1% significance level.
3.4. VEC Model Estimation
Since the time series variables are found to be cointegrated by Johansen test, un-restricted VEC model can be estimated by using the output model of Johansen test with cointegration rank (r=1). From the OLS regression, cointegrating vec-tor (β) and adjustment parameters (α) of the VECM were determined and are provided in Table 4.
Adjustment parameters α1 (USD/TRY) and α3 (Oil Price) are not statistically sig-nificant but α2 (CPI) is significant at less than 0.001 level. Adjustment parame-ters determine the speed of return to long run equilibrium and estimated values satisfy the condition for long run stable relationship.
Table 4. Vector error correction estimates
Cointegrating vector (β) Adjustment Coefficients (α)
USD/TRY CPI Oil Price USD/TRY (α1) 0.0105987
β 1 -0.5989304 0.3264787 CPI (α2) 0.00136***
Oil Price (α3) -0.02585
*** denotes less than 0.001 significance level.
Impulse response functions (IRF) were estimated by converting the VEC model to VAR as shown in Fig.1. The relation between variables is evident from the fig-ures. CPI responds to USD/TRY shocks sharply within 3 periods. On the other hand the response is gradual for oil price shocks. Oil price TRY follows USD/TRY changes closely. Figure 1a and 1b depict the long-term relation between time se-ries variables in accordance with findings from the cointegration test.
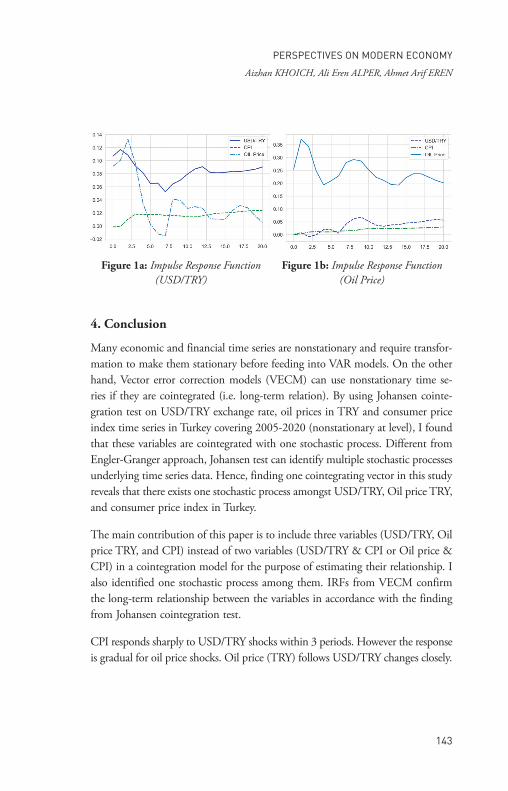
PERSPECTIVES ON MODERN ECONOMY
Aizhan KHOICH, Ali Eren ALPER, Ahmet Arif EREN
143
Figure 1a: Impulse Response Function (USD/TRY)
Figure 1b: Impulse Response Function (Oil Price)
4. Conclusion
Many economic and financial time series are nonstationary and require transfor-mation to make them stationary before feeding into VAR models. On the other hand, Vector error correction models (VECM) can use nonstationary time se-ries if they are cointegrated (i.e. long-term relation). By using Johansen cointe-gration test on USD/TRY exchange rate, oil prices in TRY and consumer price index time series in Turkey covering 2005-2020 (nonstationary at level), I found that these variables are cointegrated with one stochastic process. Different from Engler-Granger approach, Johansen test can identify multiple stochastic processes underlying time series data. Hence, finding one cointegrating vector in this study reveals that there exists one stochastic process amongst USD/TRY, Oil price TRY, and consumer price index in Turkey.
The main contribution of this paper is to include three variables (USD/TRY, Oil price TRY, and CPI) instead of two variables (USD/TRY & CPI or Oil price & CPI) in a cointegration model for the purpose of estimating their relationship. I also identified one stochastic process among them. IRFs from VECM confirm the long-term relationship between the variables in accordance with the finding from Johansen cointegration test.
CPI responds sharply to USD/TRY shocks within 3 periods. However the response is gradual for oil price shocks. Oil price (TRY) follows USD/TRY changes closely.

144
ESTIMATION OF RELATIONSHIP BETWEEN INFLATION, FOREIGN EXCHANGE RATES AND OIL PRICES IN TURKEY
Bige Küçükefe
References
Abdurehman, Abderezak Ali, and Samet Hacilar. 2016. “The Relationship be-tween Exchange Rate and Inflation: An Empirical Study of Tur-key.” International Journal of Economics and Financial Issues 4(4): 1454–59.
Apergis, Nicholas, and James E. Payne. 2009. “Energy Consumption and Eco-nomic Growth in Central America: Evidence from a Panel Coin-tegration and Error Correction Model.” Energy Economics 31(2): 211–16.
Bilgili, F., 1998. Stationarity and Cointegration Tests: Comparison of En-gle-Granger and Johansen Methodologies, Journal of Faculty of Economics and Administrative Sciences, Erciyes University, No. 13, 131-141.
Brooks, C., 2014. Introductory Econometric for Finance, Third Edition, Cam-bridge University Press, ISBN 978-1-107- 03466-2.
Christiano, Lawrence J. 2012. Christopher A. Sims and Vector Autoregressions. Scandinavian Journal of Economics 114(4): 1082–1104.
Choudri, E.U., Hakura, D.S. (2001), Exchange Rate Pass-Through to Domes-tic Prices: Does Inflationary Environemnt Matter? IMF Working Paper, WP/01/194.
Damba, Osman Tahidu, Avni Birinci, and Abdulbaki Bilgiç. 2019. “Estimation of Short and Long-Run Relationship between Selected Food Pric-es and Macroeconomic Variables in Ghana.” Atatürk Üniversitesi Ziraat Fakültesi Dergisi 50(1): 92–105.
Engle, Robert F., and Clive W.J. Granger. 1987. “Co-Integration and Error Correction: Representation, Estimation, and Testing.” Economet-rica 55(2): 251–76.
Fetai, Besnik, Paul Sergius Koku, Agran Caushi, and Ariana Fetai. 2016. “The Relationship between Exchange Rate and Inflation: The Case of Western Balkans Countries.” Journal of Business, Economics and Fi-nance 5(4).

PERSPECTIVES ON MODERN ECONOMY
Aizhan KHOICH, Ali Eren ALPER, Ahmet Arif EREN
145
Goldberg, Pinelopi Koujianou, and Michael M. Knetter. 1997. “Goods Prices and Exchange Rates: What Have We Learned?” Journal of Econom-ic Literature 35(3): 1243–72.
Granger, C. W.J. 1981. “Some Properties of Time Series Data and Their Use in Econometric Model Specification.” Journal of Econometrics 16(1): 121–30.
Fisher, I. (1930). The Theory of Interest, New York, Macmillan.
İncekara, A., Demez, S. and Ustaoğlu, M. (2012). Validity of Fisher Effect for Turkish Economy: Cointegration Analysis. Procedia-Social and Behavioural Sciences, 58, 396-405.
Johansen, Søren. 1988. “Statistical Analysis of Cointegration Vectors.” Journal of Economic Dynamics and Control 12 (213): 231–54.
Kucukefe, Bige. 2019. “Energy Price Shocks and Dynamics of Current Account in Turkey: A FAVAR Approach.” Journal of Economics, Finance and Accounting 6(3): 135–41.
Lütkepohl, H. 2005. New Introduction to Multiple Time Series Analysis, Ber-lin, Springer-Verlag
Nortey, E.N.N., Ngoh, D.D., Doku-Amposah, K., and Ofoi- Boateng, K., 2015. Modelling Inflation Rates and Exchange Rates in Ghana: Application of Multivariate GARCH Models. Springer-Plus, DOI 10.1186/s40064-015-0837-6.
Sims, C. A. 1980, Macroeconomics and Reality, Econometrica 48, 1–48.
Stern, David I. 2000. “A Multivariate Cointegration Analysis of the Role of En-ergy in the US Macroeconomy.” Energy Economics 22(2): 267–83.
Turhan, Ibrahim, Erk Hacihasanoglu, and Ugur Soytas. 2014. “Oil Prices and Emerging Market Exchange Rates.” In Emerging Markets Finance and Trade, , 21–36.
Ventosa-Santautaria, D. 2009. “Spurious Regression”, Journal of Probability and Statistics 2009, https://doi.org/10.1155/2009/802975
Yule, G. 1926. “Why do we sometimes get nonsense-correlations between time-series? A study in sampling and the nature of time-series”, Journal of the Royal Statistical Society, 89(1): 1-63

146
ESTIMATION OF RELATIONSHIP BETWEEN INFLATION, FOREIGN EXCHANGE RATES AND OIL PRICES IN TURKEY
Bige Küçükefe
Živkov, Dejan, Jasmina Đurašković, and Slavica Manić. 2019. “How Do Oil Price Changes Affect Inflation in Central and Eastern European Countries? A Wavelet-Based Markov Switching Approach.” Baltic Journal of Economics 19(1): 84–104. https://doi.org/10.1080/1406099X.2018.1562011.
Živkov, Dejan, Jasmina Đurašković, and Slavica Manić. 2019. “How Do Oil Price Changes Affect Inflation in Central and Eastern European Countries? A Wavelet-Based Markov Switching Approach.” Baltic Journal of Economics 19(1): 84–104. https://doi.org/10.1080/1406099X.2018.1562011.

147
9REVISITING EXCHANGE RATE DYNAMICS FOR TURKEYBilgin BARİ1
Introduction
The exchange rate is a key variable that always keeps its importance for the Turk-ish economy. The subject is so important because it contains information about the economy’s structural characteristics. Exchange rate dynamics in the Turkish economy works like a spiral. The structural problems of the economy cause vol-atility or increase in exchange rates. These increases cause new macroeconomic problems such as inflation, foreign debt, and balance sheets of private sector. In the context of these structural problems, it is crucial to examine the exchange rate dynamics to develop policy recommendations. This study examines the ex-change rate dynamics for the period of floating exchange rate regime in Turkey. November 2000 and February 2001 crises have revealed high costs on the Turk-ish economy. The economic policy aimed at combating inflation based on a fixed exchange rate collapsed in February 2001, and a floating exchange rate regime was adopted. The rapid rise of the suppressed exchange rate caused destructive effects on the economy. The four leading macroeconomic indicators in Figure 1 show how the exchange rate’s pressure has increased, and the economic ground that will create a currency crisis is formed.
1 Ass. Prof. Dr., Anadolu University, Department of Economics, FEAS, Eskisehir, TURKEY, [email protected]

148
REVISITING EXCHANGE RATE DYNAMICS FOR TURKEY
Bilgin BARİ
Figure 1. Macroeconomic Indicators (1998-2003)
Source: EDDS, CBRTNote : CAD/GDP : Current Account Defi cit / Gross Domestic ProductM2 / INTRES : Broad Defi ned Money Supply / International ReservesREER : Real Eff ective Exchange RateUSD / TL : US Dollar / TL
Since 1999, when a new economic program was implemented to decrease infla-tion, TL started to appreciate and became overvalued in 2000. The overvalued TL caused the foreign trade balance to deteriorate through decreasing exports and increasing imports. With the effect of capital outflows, the current account defi-cit started to increase and reached its highest level in 2000. The CB foreign ex-change reserves, which are used to stabilize the exchange rate, started to decrease since 1999, and this decrease accelerated in 2000 and 2001. In the face of specula-tive attacks, the inability to stop the decline in exchange rates and the decrease in foreign exchange reserves made it necessary to leave the exchange rate fluctuating. After the adoption of floating exchange rate regime, market dynamics enabled the exchange rate to find its equilibrium price, and economic indicators improved.
Due to the lack of a planned transition to the floating exchange rate regime and the realization of this transition after the foreign currency rush, an arduous pro-cess was experienced. It was approved to continue the floating exchange rate re-gime in the new economic program, which was implemented after the crises. In this context, the floating exchange rate regime will continue, exchange rates will

PERSPECTIVES ON MODERN ECONOMY
Aizhan KHOICH, Ali Eren ALPER, Ahmet Arif EREN
149
not be intervened in any way, only when there is excessive volatility, interventions will be made to buy or sell. The implementation of the inflation targeting regime with the floating exchange rate regime is one of the critical paradigm changes in economic policy. As stated in the annual monetary and exchange rate policy an-nouncements announced since 2002, under this regime, exchange rates are not a policy tool or target and are determined by the supply and demand conditions in the market. Although there is no exchange rate level to be preserved in the floating exchange rate regime, having a strong foreign exchange reserve position contributes significantly to eliminating the adverse effects of foreign and domes-tic shocks that the economy may face and increasing confidence in the economy. In the floating exchange rate regime, the CBRT does not intervene in the foreign exchange market unless necessary. When the Central Bank thought that the for-eign exchange market’s current volatility would increase, it intervened in volatil-ity (Özatay, 2009). Under the floating exchange rate regime, the Central Bank can implement its monetary policy more flexibly than the fixed and predictable exchange rate regime and respond to the banking system’s Turkish Lira liquidity needs more flexibly and quickly. Also, as long as it is compatible with the infla-tion target, excessive volatility of money market interest rates can be prevented. Since the Central Bank does not keep a level of exchange to maintain, the for-eign exchange reserves level is less important than fixed or predictable exchange rate regimes. Nevertheless, the Central Bank must have a strong foreign exchange reserve to eliminate foreign and domestic shocks’ harmful effects in developing economies such as Turkey( CBRT, 2007). The amount of reserves has an impor-tant role both in market interventions and on exchange rate expectations.
Exchange Rate Dynamics
Exchange rate interventions are also crucial for the Central Bank, which carries out an anti-inflationary monetary policy. The reason for this is that the exchange rate in Turkey has a significant impact on inflation. Figure 2 shows the course of the exchange rate and the fluctuations in the exchange rate during this period. Due to the frequent fluctuations in the international markets and the domestic market developments, high-rate fluctuations and rapid and sudden movements were observed in the foreign exchange market. In the upper panel of Figure 2, two different periods in the course of the exchange rate draw attention. We see that the exchange rate moved in a horizontal trend between 2001-2010. Since 2011, an upward trend has emerged. Therefore, it is vital to analyze the second sub-pe-riod. In the lower panel of Figure 2, fluctuations in exchange rates are explained using weekly data. The striking point here is that the fluctuations in the exchange

150
REVISITING EXCHANGE RATE DYNAMICS FOR TURKEY
Bilgin BARİ
rate are high. Especially in some periods, we can see that sudden increases occur due to the effect of domestic and foreign shocks. However, we could say that the fluctuations experienced in the first period are effective in the horizontal course of the exchange rate, that is, supply-demand dynamics in the market operate in a way that ensures the exchange rate remains stable. In this period, the unfavorable impact on the economy and exchange rate stems from the global financial crisis. Later, with the effect of global liquidity conditions, the volatility decreased while the exchange rate declined. We can say that the second period’s fluctuation has decreased relatively, but the supply-demand process that will lead to the upward trend of the exchange rate has been realized. The sudden and sharp increase ex-perienced in 2018 indicates that the market was rapidly affected by foreign and domestic developments. The magnitude of the rapid capital outflow determines the response of the exchange rate. If such rapid and intensive foreign exchange demand in the foreign exchange market in the short term cannot be met with sufficient supply, the pressure on the exchange rate increases.
Figure 2. Exchange Rate DynamicsSource: EDDS, CBRT

PERSPECTIVES ON MODERN ECONOMY
Aizhan KHOICH, Ali Eren ALPER, Ahmet Arif EREN
151
Figure 3 shows the course of the real effective exchange rate index. The real ef-fective exchange rate is calculated by taking the weighted geometrical average of the ratio of our country’s price level to the price levels of our trade partners. An index value of 100 indicates equality between the local currency and the trade partners’ currencies. An increase of the index above 100 indicates an appreciation in TL, and a decrease below 100 indicates a depreciation in TL.
Figure 3. Real Eff ective Exchange Rate (2001-2020)Source: EDDS, CBRT
It is more useful to examine the real effective exchange rate in two sub-periods. It is seen that TL appreciated in the first period. Since 2011, TL depreciated against other currencies. In the first period (2001-2010), leaving aside the neg-ative impacts of the global crisis, a well-managed economic policy impacted the exchange rate, like other macroeconomic variables in the economy. The effect of global conditions on the exchange rate in this period is also affirmative. Turkish economy achieved a growth rate well above the historical average for the period 2002-2007 as noted in Ozatay (2009). There was a sharp decline in inflation and the real interest rate. Public debt and the budget deficit (as a ratio to GDP) fell below their end-2001 levels. The financial sector deepened and strengthened: The ratio of loans to GDP increased, the ratio of non-performing loans decreased, capital adequacy ratios increased. During the same period, some important insti-tutional changes were made. With these changes, the Central Bank was made in-dependent. Despite all these positive developments, the global crisis has affected

152
REVISITING EXCHANGE RATE DYNAMICS FOR TURKEY
Bilgin BARİ
Turkey’s economy sharply. During the recession that started in the second quar-ter of 2008, the fall of GDP was more in-depth than the lows observed in three recessions in the 1990-2001 period.
Facts On Turkish Economy
The adverse effects of structural problems and uncertainties in the economy on the exchange rate increased after 2010. Ozatay (2015) points out that there are two main interrelated reasons why the Turkish economy is fragile to external shocks. The first is that the savings rate is too low. The low savings rate is not enough to even finance low-level investments (current account deficit is high). As a re-sult, the economy’s need to borrow from abroad increases, and the gap between foreign currency liabilities and assets is gradually widening. Therefore, the Turk-ish economy is becoming fragile against sudden jumps in the exchange rate. Oz-men (2015) compares Turkey with a group of countries in terms of current ac-count balance-investment ratio and current account balance-savings ratio for the period 2002-2014. Turkey, along with Brazil, South Africa, Greece and Iceland, is in the region of high current account deficit-low savings rate and high current account deficit–low investment rate. Ozmen also compares the financing of the current account deficit with the net international investment position and em-phasizes that the net international investment position has negatively increased (deficit). Figure 4 shows the ratio of the current account deficit to gross domes-tic product and the net international investment position. The difference between total financial assets and total financial liabilities in an international investment position is called a net international investment position. In other words this shows the net difference between Turkey’s receivables from abroad and Turkey’s debts abroad. The resulting net position can be a positive or negative value. An even more negative value of this difference indicates Turkey’s increasing foreign exchange demand and exchange rate risk.

PERSPECTIVES ON MODERN ECONOMY
Aizhan KHOICH, Ali Eren ALPER, Ahmet Arif EREN
153
Figure 4. Current Account Defi cit and Net Investment PositionSource: EDDS, CBRT
In recent years, Turkey’s financial fragility has been increasing compared to previous years and other emerging market economies. Figure 5 refers that both the ratio of total foreign debt to GDP and short-term foreign debt has increased, and the ratio of both to net central bank foreign exchange reserves has increased. Ozmen (2015) remarks that the loan-to-deposit ratio and non-financial sector debt dollarization increase. He also underlines that the non-financial sector’s risk will eventually turn into the financial sector’s risk, and it will turn into the problem of the public sector.
Figure 5. Foreign Debts and Net FX ReservesSource: EDDS, CBRT

154
REVISITING EXCHANGE RATE DYNAMICS FOR TURKEY
Bilgin BARİ
In the floating exchange rate regime, the size of the central bank’s foreign ex-change reserves (foreign exchange supply) is essential, especially in eliminating domestic and foreign shocks’ harmful effects on the exchange rate in developing countries. One of the internationally accepted standards2 for measuring foreign exchange reserves’ adequacy is comparing reserves with short-term foreign debts. Figure 5 shows that short-term foreign debt increased more after 2011 than the total reserves. As a result, increased risk perception could be followed up with CDS(Credit Default Swap) premiums. CDS are one of the macroeconomic in-dicators that affect foreign exchange market dynamics. The higher the CDS pre-mium of a country or company, the higher the borrowing cost. CDS premium is determined instantly by supply and demand, just like exchange rates in the mar-ket. For this reason, it is considered as the most objective indicator in risk meas-urement. Figure 6 shows Turkey’s 5-year CDS premium. In the period of April 2010-September 2020, the CDS premium increases by as much as three times. This leads to an increase in demand for foreign currency, along with an increased perception of risk. Gurkaynak et al. (2015) state that domestic factors were very forceful in the TL’s depreciation in the post-2010 period. They examine the po-litical implications and success of policymaking and the exchange rate response to them. The central bank’s reluctance to use interest rates as a policy tool, or its inability to withstand political pressures, primarily affects the exchange rate. The resulting policy uncertainty is also reflected in the CDS premium.
Figure 6. Turkey 5-Years CDSSource: investing.com
2 Internationally accepted standards for measuring the adequacy of foreign exchange reserves (IMF (2001;2005;2011)):- The ratio of reserves to imports- The ratio of reserves to short-term foreignl debt- The ratio of the money supply to Central Bank reserves- The ratio of reserves to 1-year foreign liabilities

PERSPECTIVES ON MODERN ECONOMY
Aizhan KHOICH, Ali Eren ALPER, Ahmet Arif EREN
155
Capital outflow from the country due to changing portfolio preferences of foreign investors increases the exchange rate demand. Another reason for the exchange rate demad is that domestic resident turn to foreign currency. One significant indicator of this is the share of foreign currency (FX) deposits in total deposits. Figure 7 shows that the rate of foreign currency deposits has increased in recent years, and this share has increased to more than 50%. Although this situation re-sults from the increase in the exchange rate, it also causes an increase in the ex-change rate. Figure 7 also indicates increased dollarization.
Figure 7. Share of TL and FX DepositsSource: EDDS, CBRT
Empirical Literature
There are many theoretical approaches used to explain the exchange rate move-ments in the literature. The development of these approaches has shifted from static techniques to dynamic techniques. To analyze a dynamic market, such as the foreign exchange market, the effects of many variables must be taken into ac-count. Although similar structural features in developing economies affect the ex-change rate, different factors for each country may also affect the exchange rate. Kaplan and Yapraklı (2014) tested the factors affecting the exchange rate in the fragile 12 Developing Countries (Emerging Markets) using panel data analysis for the period 2000-2012. According to the analysis results, the exchange rate nega-tively affects variables such as current account deficit / GDP, gross public debt /

156
REVISITING EXCHANGE RATE DYNAMICS FOR TURKEY
Bilgin BARİ
GDP, private sector domestic loan debt / GDP, and inflation rate. It has a posi-tive effect on foreign exchange reserve / GDP and foreign debt/export variables. Moreover, they found that the the exchange rate was affected by the foreign ex-change reserve / GDP ratio.
Recent studies on the determination of the exchange rate in Turkey use different techniques and data sets. Güney (2015) examined the determinants of the nomi-nal exchange rate in the context of monetary exchange rate models, using monthly data for the period of 1990:01-2014:03. Kalman filter method was used in the estimation of the models. While the decrease in the money supply gap and the expected inflation gap positively affect the exchange rate, the nominal exchange rate increases if the income and interest gap increase. Yurdakul (2016) used the variables of stock market index, CPI, industrial production index, M2-money sup-ply, export, import, gold price and interest variables for the period of 2006M06-2015M12. According to the results of Engle-Granger and Johansen cointegration tests, a long-term equilibrium relationship could not be found between these var-iables and the exchange rate. Akıncı and Yılmaz (2016) pointed a strong relation-ship between exchange rates and interest rates using the Johansen-Juselius coin-tegration test from 1980 to 2012. Ekinci et al. (2016) used regression analysis to find a positive relationship between exchange rates and deposit interest rates. To-run and Karanfil (2016) proved a long-term relationship between real exchange rates and interest rates using the Johansen cointegration test.
Dincer et al. (2017) examined the factors determining the exchange rate between 1988 and 2016 using the MARS method. According to the results, the increase in the current account deficit causes a depreciation of the TL. They also state that economic growth causes an appreciation of the TL. Kartal et al. (2018) ana-lyzed the factors affecting the USD / TL and Euro / TL parity using the MARS method for the period 2006:1-2017:6. According to the results of the study, the macroeconomic indicators that are important for the forecasting of US dollar rate are money supply, budget deficit, foreign investments, unemployment, domestic debt, imports, inflation, and current account deficit. The most important varia-bles for the euro rate prediction model are money supply, budget deficit, current account deficit, foreign investments, crude oil imports, and exports.
Sit and Karadag (2019) analyzed the factors that determine the exchange rate us-ing the ARDL Bounds test for the period of 2003M01-2018M06. According to

PERSPECTIVES ON MODERN ECONOMY
Aizhan KHOICH, Ali Eren ALPER, Ahmet Arif EREN
157
both short and long term coefficients, a positive relationship was found between the exchange rate and current account deficit and foreign trade deficit. A nega-tive relationship was found between the exchange rate and the interest rate and the effect of interest on the exchange rate was negative. In addition, the increase in the general level of prices (inflation) causes an increase in the exchange rate. There is also a positive relationship between the Central Bank’s foreign exchange reserves and the exchange rate.
Siklar and Akca (2020) examined the relationship between the exchange rate pres-sure index and monetary policy for 2002-2018. The increase in the exchange rate pressure index indicates the depreciation of the TL. According to the results, domes-tic credit expansion causes an increase in the exchange rate pressure index. There is a bi-directional relationship between the exchange rate and interest rate. Besides, the increase in interest rates causes the exchange rate pressure index to decrease.
Data And Methodology
This study explains the period when the exchange rate showed an upward trend (2011: 01-2020: 06) using monthly data. Table 1 presents the data set used in the study.
Table 1. Data Set
Variable Definition Source
EXC Exchange Rate (US Dollar/TL) Electronic Data Delivery System
CAD Current Account Deficit Electronic Data Delivery System
RES Total Foreign Exchange Reserves of CBRT Electronic Data Delivery System
M2 Money Supply Electronic Data Delivery System
INT Short term interest rate (TRLIBOR) FRED Economic Data
CDS Credit Default Swaps investing.com
CPI Consumer Price Index Turkstat
Many variables are used in logarithms (logs) for forecasting and economic analysis, as stated in Lutkepohl and Xu (2012). For time series analysis, logarithmic trans-formation is used to stabilize the variance of a series. Fort that reason, all variables are transformed into logarithmic form. Figure 8 represents the course of the time series for the related period, while Table 2 gives the statistical properties of the series.

158
REVISITING EXCHANGE RATE DYNAMICS FOR TURKEY
Bilgin BARİ
Figure 8. Time Series Plots of Variables
Table 2. Time Series Properties of Variables
LNEXC LNCDS LNCPI LNINT LNM2 LNRES LNCAD
Mean 1.069440 5.466614 5.621211 2.342315 20.89297 11.40798 8.768234
Median 1.052555 5.457711 5.580285 2.276648 20.89701 11.42912 8.823292
Maximum 1.940179 6.347424 6.143842 3.237506 21.82609 11.64607 9.539860
Minimum 0.418710 4.796864 5.207298 1.643846 20.18605 10.76378 6.385194
Std. Dev. 0.451046 0.333337 0.269898 0.328149 0.447962 0.171717 0.448699
Skewness 0.393465 0.514185 0.373079 0.789383 0.210392 -1.030672 -1.559555
Kurtosis 1.866569 2.954144 2.012168 3.688573 1.959002 4.533787 8.868144
Jarque-Bera 9.043633 5.033327 7.279685 14.09153 5.988501 31.35781 209.7788
Probability 0.010869 0.080728 0.026256 0.000871 0.050074 0.000000 0.000000
Sum 121.9161 623.1940 640.8181 267.0239 2381.799 1300.510 999.5787
Sum Sq.Dev. 22.98905 12.55585 8.231486 12.16807 22.67570 3.331991 22.75043
Observations 114 114 114 114 114 114 114
ARDL (Autoregressive Distributed Lag) bound test approach developed by Pesa-ran et al. (2001) could be applied regardless of whether series are I (0) or I (1). For this purpose, the stationarity of the series should be tested. Traditional unit

PERSPECTIVES ON MODERN ECONOMY
Aizhan KHOICH, Ali Eren ALPER, Ahmet Arif EREN
159
root tests test the null hypothesis that the time series is I (1). In the KPSS unit root test developed by (Kwiatkowski et al. 1992), the alternative hypothesis tests that there is a unit root in the series and it is not stationary. The purpose of the KPSS (Kwiatkowski-Phillips-Schmidt-Shin) test is to purify the deterministic trend in the observed series and ensure that the series is stationary. The KPSS test sug-gests that the time series is stationary around a deterministic trend, and the de-terministic trend is calculated as the sum of random selection and stationary ran-dom errors. Table 3 shows the unit root test results. According to the results, the null hypothesis stating that the series is stationary for all variables is rejected. So the series is not stationary at the level. Thereupon, the same unit root tests were carried out by taking the first differences of the series, and it was determined that the series became stationary after taking the first differences.
Table 3. KPSS Unit Root Test Results
Variables Level I(0) First Difference I(1)
LNEXC 1.220 0.116
LNCDS 0.740 0.063
LNCPI 1.221 0.406
LNINT 0.770 0.123
LNM2 1.245 0.345
LNRES 0.783 0.464
LNCAD 0.808 0.162
Critical values0.739 (%1) 0.739 (%1)
0.463 (%5) 0.463 (%5)
0.347 (%10) 0.347 (%10)
It is necessary to determine the appropriate lag length for cointegration analysis. The Schwarz criterion was preferred to determine the appropriate lag length. As seen in Figure 9, ARDL (1,2,1,0,2,0,0) model has the most suitable lag lengths for estimation.

160
REVISITING EXCHANGE RATE DYNAMICS FOR TURKEY
Bilgin BARİ
-4.79
-4.78
-4.77
-4.76
-4.75
-4.74
-4.73
ARDL
(1, 2
, 1, 0
, 2, 0
, 0)
ARDL
(1, 0
, 1, 1
, 2, 0
, 0)
ARDL
(1, 0
, 1, 1
, 2, 1
, 0)
ARDL
(1, 0
, 1, 0
, 2, 0
, 0)
ARDL
(1, 2
, 1, 1
, 2, 0
, 0)
ARDL
(1, 0
, 1, 0
, 2, 1
, 0)
ARDL
(1, 2
, 1, 0
, 2, 1
, 0)
ARDL
(1, 0
, 1, 1
, 3, 0
, 0)
ARDL
(1, 1
, 1, 0
, 2, 0
, 0)
ARDL
(1, 0
, 2, 1
, 2, 0
, 0)
ARDL
(1, 2
, 2, 0
, 2, 0
, 0)
ARDL
(1, 2
, 1, 0
, 3, 0
, 0)
ARDL
(1, 2
, 1, 2
, 2, 0
, 0)
ARDL
(1, 1
, 1, 1
, 2, 0
, 0)
ARDL
(1, 0
, 1, 2
, 2, 0
, 0)
ARDL
(1, 2
, 1, 0
, 2, 0
, 1)
ARDL
(1, 3
, 1, 0
, 2, 0
, 0)
ARDL
(2, 2
, 1, 0
, 2, 0
, 0)
ARDL
(1, 0
, 1, 1
, 3, 1
, 0)
ARDL
(1, 0
, 1, 1
, 2, 0
, 1)
Schwarz Criteria (top 20 models)Schwarz Criteria (top 20 models)
Figure 9. Lag Selection
After estimating the ARDL model with the appropriate lag length, a cointegra-tion test was performed. The results of the limit test made according to this model are presented in Table 4. The null hypothesis indicates no cointegration relation-ship, whereas the alternative hypothesis indicates the cointegration relationship.
Table 4. F-Test Results
K F-Statistic Sign. Lower bound Upper bound
I(0) I(1)
6 6.417998 1% 2.88 3.99
5% 2.27 3.28
10% 1.99 2.94
According to the results in Table 4, the calculated F statistic is at the 1% signifi-cance level developed by Pesaran et al. (2001) was higher than the critical values. In this case, the null hypothesis, which states that there is no cointegration rela-tionship, is rejected, and it is concluded that there is a cointegration relationship between the variables. Since there is a cointegration relationship between series, the ARDL model can be used to determine long and short run relationships. Some

PERSPECTIVES ON MODERN ECONOMY
Aizhan KHOICH, Ali Eren ALPER, Ahmet Arif EREN
161
diagnostic tests were applied before estimating the long-run model.The high R2 value indicates that the explanatory variables used in explaining the exchange rate changes are quite powerful. LM test results confirm that there are no autocolera-tion problems in the residuals. ARCH test results show that residuals have fixed variance. Jarque Bera that the errors show a normal distribution. Ramset RESET results also confirm that the model has been correctly defined.
Table 5. ARDL Model and Long Term Coefficients
Variables Coefficient Std. Error t-statistic Prob.Short-run
LNEXC(-1) 0.849834 0.062618 13.57163 0.0000LNCDS 0.038185 0.015970 2.391010 0.0187
LNCDS(-1) 0.008245 0.019444 0.424035 0.6725LNCDS(-2) -0.050134 0.016157 -3.102996 0.0025
LNCPI 0.863669 0.233537 3.698202 0.0004LNCPI(-1) -0.922719 0.216737 -4.257317 0.0000
LNINT 0.037493 0.011608 3.229957 0.0017LNM2 0.884338 0.114257 7.739931 0.0000
LNM2(-1) -0.350625 0.158456 -2.212758 0.0292LNM2(-2) -0.386631 0.120659 -3.204323 0.0018
LNRES -0.023854 0.025330 -0.941760 0.3486LNCAD 0.013311 0.005871 2.267377 0.0255
C -2.506234 0.836734 -2.995256 0.0035Long-run
LNCDS -0.024669 0.082416 -0.299324 0.7653LNCPI -0.393230 0.593672 -0.662369 0.5093LNINT 0.249676 0.081783 3.052921 0.0029LNM2 0.979460 0.314818 3.111199 0.0024LNRES -0.158854 0.141052 -1.126210 0.2628LNCAD 0.088643 0.050300 1.762300 0.0811
C -16.68975 3.597188 -4.639666 0.0000
R2 0.998549Serial Correlation LM(1) 0.460 (0.498)Serial Correlation LM(2) 0.233 (0.792)Heteroscedasticity ARCH (1) 0.189 (0.663)Heteroscedasticity ARCH (2) 0.414 (0.661)Normality Jarque-Bera 2.854 (0.239)Ramsey RESET 0.186 (0.663)

162
REVISITING EXCHANGE RATE DYNAMICS FOR TURKEY
Bilgin BARİ
Table 5 contains the estimated ARDL model and the long-term coefficients of the variables affecting the exchange rate. CDS, inflation, interest rate, money supply, and current account deficit have positive and significant effects on the exchange rate in the short run. In the long run, interest rates and money supply have a signifi-cant effect on the exchange rate. The money supply has a strong positive effect on the exchange rate in the short and long run. Contrary to theoretical expectations, the interest rate’s effect on the exchange rate is positive for the short and long run.
Table 6 presents the estimation results for the error correction model. The error correction coefficient of the model was found to be negative and statistically sig-nificant. The short-term coefficients of the model are also significant for all varia-bles. The error correction coefficient was found to be -0.15. This situation shows that if there is a deviation from the long-run equilibrium in the short-run, 15% of the disequilibrium will be eliminated in each period, that is, the system can return to equilibrium after about 3 periods (months).
Table 6. Error Correction Model
Variables Coefficent Std. Error t-statistic Prob.
D(LNCDS) 0.038185 0.014099 2.708281 0.0080D(LNCDS(-1)) 0.050134 0.013899 3.607026 0.0005
D(LNCPI) 0.863669 0.184181 4.689244 0.0000D(LNM2) 0.884338 0.095887 9.222752 0.0000
D(LNM2(-1)) 0.386631 0.106604 3.626784 0.0005CointEq(-1)* -0.150166 0.020253 -7.414470 0.0000
The stability of the short and long term coefficients is measured by CUSUM (cumulative sum) and CUSUMSQ (cumulative sum of squares) tests. The test results are presented in Figure 10. The test statistics remained within the critical limits (significance level at 5%). Therefore, it is concluded that the estimated pa-rameters are stable during the analyzed period.
-30
-20
-10
0
10
20
30
2012 2013 2014 2015 2016 2017 2018 2019 2020
CUSUM 5% Significance
-0.2
0.0
0.2
0.4
0.6
0.8
1.0
1.2
2012 2013 2014 2015 2016 2017 2018 2019 2020
CUSUM of Squares 5% Significance
Figure 10. Stability of the model

PERSPECTIVES ON MODERN ECONOMY
Aizhan KHOICH, Ali Eren ALPER, Ahmet Arif EREN
163
Conclusion
The exchange rate is a critical macroeconomic indicator of the Turkish economy. The exchange rate dynamics can be understood by examining the instant sup-ply-demand developments in the foreign exchange market. This market structure varies according to the development level of the economies. At the same time, the structural characteristics of economies themselves also have an impact on the foreign exchange market or exchange rate dynamics. Turkey was forced to move to a floating exchange rate regime in February of 2001 due to intense speculative attacks. We could infer that the floating exchange rate regime has a more effec-tive economic functioning compared to the fixed exchange rate regime. For ex-ample, since there is no promised exchange rate level, healthy foreign exchange reserves are not needed to achieve this. Moreover, it is not possible to have such a high foreign exchange reserve in developing countries. However, the econo-my’s current conditions determine the price of the currency in the floating ex-change rate system. Again, for a developing economy, it is necessary to add po-litical conditions as well as economic conditions. The economies’ economic and political situation is priced in the foreign exchange market, and this pricing oc-curs very quickly and instantly.
When we examine the period of implementation of the floating exchange rate re-gime in the Turkish economy, we see that two distinct sub-periods appear. There is a horizontal exchange rate level in the first sub-period. The reason behind this is, of course, the market dynamics in this period. Supply-demand developments de-termine market dynamics. It is a period in which the efficiency of economic policy is high between 2002 and 2010. Therefore, it has benefited from favorable global liquidity conditions. In the post-2011 period, the exchange rate has been increas-ing steadily. If we look in terms of market dynamics, this is because the demand for foreign exchange is higher than the foreign exchange supply. To explain this simple market mechanics, it is necessary to focus on the economy’s structural features. In-sufficient savings and foreign trade deficit cause a high current account deficit. Fi-nancing this deficit with short-term capital inflows increases exchange rate risks. In-creasing uncertainties increase the demand for foreign currency. It is complicated to intervene with a foreign exchange reserve to meet this demand in the floating ex-change rate regime. Having low reserves creates a more disruptive effect.
I examine the exchange rate dynamics in the Turkish economy. First of all, I try to explain the current situation with a narrative approach. Then I analyze the

164
REVISITING EXCHANGE RATE DYNAMICS FOR TURKEY
Bilgin BARİ
short and long term dynamics using an empirical approach. I base the foreign exchange market dynamics on supply-demand developments, which is a simple and efficient market process. The findings indicate that the money supply has a powerful effect on short and long-term exchange rates. It is seen that increasing TL liquidity also increases the demand for the foreign currency. The most striking result of the analysis is that the relationship between interest rate and exchange rate is the similar in the short and long run. This result emphasizes that the ex-pected effect of the interest rate on the exchange rate is lost. While inflation has a strong effect on the exchange rate in the short run, it does not have an effect in the long run. The increase in CDS, which is used to measure the increased risk, also creates an increasing pressure on the exchange rate in the short term.
A stable exchange rate in the economy is also an indicator of a stable economy. Therefore, the economy’s structural problems must be solved, an effective eco-nomic policy must be carried out, and uncertainties must be reduced. The foreign trade deficit should be improved, and the level of savings should be increased in order to reduce the need for foreign currency. An economic policy that will en-sure and maintain price stability should be established. A monetary policy that will increase the interest rate’s efficiency, which is a policy tool, should be imple-mented. Institutions or institutional structure that are effective in reducing un-certainties should be strengthened.
References
Akıncı, M. & Yılmaz, Ö. (2016). “The Trade-Off between Inflation and Inter-est Rate: A Dynamic Least Squares Method for Turkish Economy in the Context of Fisher Hypothesis”, Sosyoeconomy, 24(27), 33-56.
CBRT (2007). Inlation Report:2007:IV, October.
Dinçer, Hasan, Hacıoğlu Ümit & Yüksel, Serhat. (2017). “Determining Influ-encing Factors of Currency Exchange Rate for Decision Making in Global Economcy using MARS Method”, Chapter 13: Geopolitics and Strategic Management in the Global Economy, IGA Global.
Ekinci, E. B. M., Alhan, A., & Ergör, Z. B. (2016). “Nonparametric Regres-sion Analysis: Examining the Relationship between Interest Rate,
PERSPECTIVES ON MODERN ECONOMY
Aizhan KHOICH, Ali Eren ALPER, Ahmet Arif EREN
165
Inflation and Exchange Rate”, Banking and Insurance Research Journal, 2(9), 28-37.
Güney, A. (2015). “Döviz Kuru Teorileri ve Türkiye’de Döviz Kurunun Be-lirleyicileri”, (Yayımlanmamış Doktora Tezi). İstanbul Üniversitesi Sosyal Bilimler Enstitüsü, İstanbul.
Gürkaynak, R. S., Kantur, Z., Tas, M.A.,l & Yildirim, S. (2015). “Monetary policy in Turkey after Central Bank independence”, CFS Working Paper Series, No. 520, Goethe University Frankfurt, Center for Financial Studies (CFS).
IMF (2001). Reserve adequacy in Emerging Market Economies, IMF Working Papers, WP/01/43,
IMF (2005). Guidelines for Foreign Exchange Reserve Management: Accom-panying Document and Case Studies. https://www.imf.org/en/Publications/Manuals-Guides/Issues/2016/12/30/Guidelines-for-Foreign-Exchange-Reserve-Management-Accompanying-Docu-ment-and-Case-Studies-17343
IMF (2011). Assessing Reserve Adequacy. https://www.imf.org/external/np/pp/eng/2011/021411b.pdf
Kaplan, F. & Yapraklı, S. (2014). “Ekonomik Kırılganlık Endeksi Gösterge-lerinin Döviz Kuru Üzerindeki Etkileri: Kırılgan 12 Ülke Üzerine Panel Veri Analizi”, Uluslararası Alanya İşletme Fakültesi Dergisi, 6 (3), 111-121.
Kartal, M.T., Depren, S.K., & Depren, O. (2018). “Determination Of Macro-economic Indicators Affecting Foreign Exchange Rates In Turkey: An Examination With Mars Method”, MANAS Journal of Social Studies, 7(1), 209-229.
Kwiatkowski, D., Phillips, P. C. B., Schmidt, P. ve Shin, Y. (1992). Testing The Null Hypothesis of Stationarity Against the Alternative of A Unit Root, How Sure Are We That Economic Time Series Have a Unit Root? Journal of Econometrics, 54, 159-178.
Lütkepohl, H., Xu, F. (2012). “The role of the log transformation in forecasting economic variables. Empirical Economics, 42, 619–638.
Özatay, F. (2009). “Türkiye’de 2000-2008 Döneminde Para Politikası”, İktisat, İşletme ve Finans,24

166
REVISITING EXCHANGE RATE DYNAMICS FOR TURKEY
Bilgin BARİ
Özatay, F. (2015). “2000’li Yıllarda Türkiye Ekonomisi”, İktisat İşletme ve Fi-nans 30 (351)
Özmen, E. (2015). “Cari Açıklar, Dış Ticaret ve Finansal Kırılganlıklar”, İktisat İşletme ve Finans 30 (351)
Pesaran, H. Shin, Y. ve Smith R. J. (2001). Bound Testing Approaches to the Analysis of Long Run Relationships. Journal of Applied Econo-metrics, 16 (3), 289-326.
Siklar, I & Akca, A. (2020). Exchange Market Pressure and Monetary Policy: The Turkish Case, Ekonomika. 2020, vol. 99(1), 110-130.
Sit, M. & Karadag, H. (2019). “Economic Factors Of Determining Exchange Rate: Ardl Bounds Testing Application For Turkey”. International Journal of Economic and Administrative Studies, 2019 (23):151-168.
Torun, M., & Karanfil, M. (2016). “Relationship between Inflation and Inter-est Rates in Turkey Economy for the Period 1980-2013”, Journal of Administrative Sciences, 14(27), 473-490.
Yurdakul, F. (2016). Döviz Kuru Modellemesi ve Türkiye Üzerine Bir Uygula-ma (Bölüm 1). Gazi Kitabevi: Ankara.

167
10THE FUTURE OF MONETARY UNION IN THE EUROPEAN UNIONHasan Memiş1, Hülya Derya2
Introduction
The European Union (EU) emerged with the Treaty of Paris (1952) and the Treaty of Rome (1957) for the re-strengthening of Europe following WWII. The union, which was initially established as an economic union, namely, EEC, has been de-veloped, expanded, and deepened over time, and became political with the Maas-tricht Treaty in 1992. The Maastricht Treaty, signed in 1992, transferred the power to create money to the European Central Bank (ECB). Thus, as of 2002, Euro banknotes and coins were released into circulation and the Eurozone was estab-lished. A common currency in Europe has created the money that member coun-tries cannot create themselves. The ECB ensured a very low inflation rate within the Eurozone by implementing a tight monetary policy since the date it was es-tablished. Despite the monetary union, the targeted political unity has not been achieved. The most important reason underlying this involves both the system and the structure of the monetary union. Because national autonomy exists and responsibility is assumed by political finance. Accordingly, the member countries borrow in a currency that they cannot create. On the one hand, the ECB has to purchase government bonds during the debt crisis. On the other hand, the ECB becomes more and more the “lender of last resort” in this regard. This role is not in compliance with its legal basis.
In the study; after concentrated on the establishment of the EU and the reasons for the lack of political integration within the monetary union, the ECB’s deci-sions on preventing crises and responses to the question of whether More Eu-rope is required are sought.
1 Assoc. Prof. Balıkesir University, FEAS2 Assoc. Prof. Kilis 7 Aralık University, FEAS

168
THE FUTURE OF MONETARY UNION IN THE EUROPEAN UNION
Hasan Memiş, Hülya Derya
1. The European Union (EU)
A) Establishment Of The EU
Following WWI and WWII, during which nearly 60 million people lost their lives, some European leaders and thinkers have concluded that the only way to main-tain peace was the economical and political unification of countries. In this con-text, the European Coal and Steel Community (ECSC) was established in 1951 with 6 members comprising Belgium, Federal Germany, Luxembourg, France, Italy, and the Netherlands, and the European Economic Community (EEC) was established in 1957. The Community became the European Community (EC) in 1967, and eventually the European Union (EU) in 1992. The basic principles of the Union are expressed in Article 2 of the Treaty on the EU. According to this article, the Union is based on such merits as human dignity, freedom, democracy, equality, rule of law and respect for human rights, including the human rights belonging to minorities. Common to all EU member states, these merits con-sist of the principles of pluralism, indifference, tolerance, justice, solidarity, and equality between women and men. According to Article 3 of the Treaty, the aim of the EU is to maintain peace, to protect the merits of the Union, and to im-prove the welfare of their people. According to Article 6 of the Treaty, the mem-bers of the EU agree to protect the rights, freedoms, and principles stated in the ‘Charter of Fundamental Rights of the EU’ and to be a party to the ‘Conven-tion for the Protection of Human Rights and Fundamental Freedoms’. In terms of economy, the aim of the EU is to achieve balanced and sustainable develop-ment by ensuring the free movement of goods, services, capital, and workforce, and the freedom of capital to settle within the Union. The Union has ultimately achieved its goals. After the end of WWII, Europe witnessed the longest period of peace and stability in its history. For this achievement, the EU was awarded the Nobel Peace Prize in 2012. On the other hand, in 1957, only 12 of the 28 EU member states were governed by democracy. As of today, all 28 countries are being governed by democracy. In terms of freedoms, it is seen that the EU is one of the freest communities in the world according to Freedom House (2017). Eu-rope is home to the world’s largest single market and the second most utilized currency. It is also the world’s largest trade power, and the provider of develop-ment and humanitarian aid (Karluk, 1996: 81).
While the 21st century, which witnessed two world wars, also hosted many in-ternational associations and formations, the EU draws attention as one of the

PERSPECTIVES ON MODERN ECONOMY
Aizhan KHOICH, Ali Eren ALPER, Ahmet Arif EREN
169
most important of these formations. European countries have removed not only physical borders but also the borders between their regulations and policies; a su-pranational formation has been created with international agreements and con-sensus on various issues. While the EU has brought many enlargements since its first phase so far, it has made it crucial for its members to fulfill standard prac-tices in many domains. With the Maastricht Treaty established on the basis of the EU, the name of the EEC has been transformed into the EC, and 3 basic principles have been adopted that accelerate and strengthen socio-economic pro-gress (Karluk, 1996: 82):
- A free-market economy based on the Competition Principle.
- Sound management of Public Finance.
- Substitution principle.
The common policies determined by the Treaty of Rome (1957) were altered with the treaty signed in Maastricht on February 7, 1992. The concept of the EU, the goals and policies pursued through the European Communities (ECSC, EEA, EC) and the goals and policies covered by the three new actions (Economic and Monetary Union, European Citizenship and Common Security and Foreign Policy) brought by the EU agreement that will be taken gradually are used as a whole (Borchard, 2000: 76).
The member countries, which are in full cooperation with the legal regulations and the implementation of these regulations, also existed in a monetary union with a common currency. Nevertheless, although the monetary policies are the same, the monetary union is far from working effectively, as the EU member countries implement different fiscal policies. Since the EU member countries, whose mon-etary policy decisions are made by the ECB, are free to implement their own fis-cal policies, this situation has revealed policy disputes in extraordinary situations.
B) Monetary Union
The Maastricht Treaty signed in 1992 has transferred the power to create money to the ECB. In 1999, the Euro became the currency of the EU member states, and in 2002, Euro banknotes and coins were released into circulation. Thus, the Eurozone was established. It was believed that this step would lead Europe to po-litical integration. In 1992, 62 professors issued a warning about the European

170
THE FUTURE OF MONETARY UNION IN THE EUROPEAN UNION
Hasan Memiş, Hülya Derya
monetary union in the Frankfurter Allgemeine Zeitung: In the article, scientists underlined that the European monetary union could not be an optimal mone-tary zone (FAZ, June 11, 1992: 15).
According to Sievert, a common currency in Europe “reveals money that members cannot create themselves”(Sievert 1992: 19). The Maastricht and Lisbon Treaties give the ECB the task of maintaining price stability. Moreover, the bank is given a broad range of autonomy. The ECB is the world’s most independent central bank in every formal aspect. It is modeled after the German central bank. Na-tional central banks are also linked to the ECB system. In this way, they came through national finance - labor market policy pressure. Conflicts of national in-terest that often occur in Europe in a way that would shake the price stabiliza-tion are wished to be settled among the member countries accordingly. Although Hayek (1977) wanted to create an anti-nationalization of money in other ways, this monetary union ultimately provides this anti-nationalization (Hayek, 1977: 65).
The Maastricht Treaty ultimately establishes an international monetary order that has not been known in Europe since the gold standard, which ensures the objec-tification of the money supply. The member countries would no longer use the devaluation instrument deliberately to remain competitive in the short-run. De-valuation only increases competitiveness in the short-term, because real-economic conditions that reduce competitiveness do not improve in this regard. What is at stake here is an erroneous wage-labor market policy, which increases the cost of wages above total economic productivity, affecting the competitiveness of com-panies. Devaluation partially compensates for this wage disadvantage, but usually leads to new wage increases with rising import prices and the inflationary pres-sure stemming from it. The devaluation - inflation - high wages spiral continues to warp accordingly. Especially southern European countries experience this emi-nently before entering the monetary union. In this context, it should not be pos-sible to put pressure on the ECB in the European platform, neither at the level of finance nor labor market policy. Thus, the structural errors of the monetary un-ion did not exist in national finance, labor market, and social policy autonomy, unlike some claimed. In fact, the decentralized responsibilities of national states over financial-economic policies are some of the founding features of the mon-etary union, which is, one of the pillars of the monetary union structure, which would of course have severe consequences.

PERSPECTIVES ON MODERN ECONOMY
Aizhan KHOICH, Ali Eren ALPER, Ahmet Arif EREN
171
The fathers of the monetary union also know that countries that are not used to stabilization policies would immediately wish to take advantage of low-interest rates and postpone the real-economic harmony, which is required to improve com-petitiveness in the medium-run. That is why benchmarks and political finance in the Maastricht Treaty introduced a stabilization and growth pact to correct faulty developments. Similar mechanisms are not found in other European treaties. Also, everyone knows that a stabilization culture would not be fostered within a few years. However, some progress was to be expected in terms of fiscal-politi-cal discipline. Whereas, first, Germany frustrates these hopes. The structural er-ror of the monetary union appears in two points. First of all, the NO - BAIL-OUT (a state cannot be a guarantor for the other state) clause in the Maastricht and Lisbon treaties, is not plausible. As a result, the member states are not told anything, as one member has to consider having difficulty in repayments due to excessive indebtedness. A state-type bankruptcy scheme was not established. Sec-ondly, the possibility of a deep financial and banking crisis was not taken into account much, which had shaken the world in the past few years. Besides, the interdependence among the debt policies of the member states along with bank-ing and financial market regulations has not been examined. If there are some spillover effects in a country’s non-payment situation and the banks in question are not equipped with sufficient equity capital, the non-guarantor clause loses its plausibility. Even a bankruptcy order established for states cannot enhance it (BMF Scientific Committee, 2010).
2. Solution Approaches For The European Monetary Union
A) The European Central Bank in Dilemma
The ECB has been implementing a tight monetary policy since its establishment, ensuring a very low inflation rate in the Eurozone. In cases where capital move-ments are free and capital controls are not applied, interest rates must be equal-ized in all Eurozone member countries. Indeed, the Greek interest rates are con-verging to the German interest rates due to the decline in inflation expectations in the Eurozone. However, economic units in Greece have been getting used to high-interest rates for a long time. While public sector expenditures mostly go to social programs, households turn to housing construction. This causes an increase in budget deficit/GDP and public debt/GDP ratios in Greece over the years. In order to ensure sustainability in current transactions, the country has to apply

172
THE FUTURE OF MONETARY UNION IN THE EUROPEAN UNION
Hasan Memiş, Hülya Derya
a contractionary fiscal policy. Encountered the problem of sustainability in cur-rent transactions, Greece tries to increase public revenues while decreasing pub-lic expenditures. Of course, this causes a decrease in the GDP and an increase in the unemployment rate in Greece (Sievert, 1992: 13-24). Increasing tensions and discontent in Greece and other EU member countries in similar cases are begin-ning to manifest itself in the political arena. It is the US financial crisis of 2008 that exacerbates this trend and the Euro crisis that hit Europe a few years later. In both, the liberal system conceived by the elites has been collapsing in the presence of external shocks. The price for these failures is paid by ordinary workers, not elites. Political unity is essential for the Euro’s success. German Prime Minister Helmut Kohl and French President François Mitterand, who created the mone-tary union, predicted that the monetary union would deepen the economic in-tegration and that a political union in the EU would be constituted over time. However, such a union could not be established and it is not foreseen to be es-tablished in the near future. The EU can persist without the Euro, and it can be even more successful.
The basic order of the European monetary union is also under threat. If the ECB cannot create stable money, its future will be questioned. Plausibility and repu-tation are essential features for an independent central bank. Otherwise, it faces government pressure and has to support it with money-inflation policies. The cur-rent policy of the ECB resembles walking on a rope. On the one hand, it has to create liquidity in order to keep banks functional. It is currently the only institu-tion in the EU that can prevent a new banking and financial crisis. However, on the one hand, the ECB’s purchase of government bonds threatens its plausibility and independence. On the other hand, the ECB’s liquidity provisions in 2011 and 2012 succeeded in maintaining the stability of the banking and financial sys-tem in Europe using monetary measures. Although banks have largely purchased government bonds with these coins and the bond between state and banks has narrowed further, this attitude is still better than purchasing government bonds on secondary markets. But ultimately, the ECB has to withdraw this excess li-quidity from the market after overcoming the debt crisis. It is also highly doubt-ful that it will sterilize this liquidity at the right time and sufficiently. However, there seems to be no inflation threat in the European region at the moment. But, high liquidity and the insecure situation in the Eurozone would force the ECB to revert to a tight monetary policy. If the ECB crosses the boundary between monetary and financial policies again and again, then this situation is politically

PERSPECTIVES ON MODERN ECONOMY
Aizhan KHOICH, Ali Eren ALPER, Ahmet Arif EREN
173
thought-provoking. If the government purchases bonds, the bonds purchased from the secondary markets would greatly injure the ECB in accordance with Article 123 of the Maastricht and Lisbon Treaties. Whereas the ECB should have this power since this is part of its open market policy. Nevertheless, it is also problem-atic to purchase government bonds of the countries under excessive indebtedness to facilitate refinancing, because, in this regard, the fiscal policy limit is crossed.
The ECB would have made been a grave mistake by changing its task, rendering itself the “lender of last resort” of countries. Because in this way, it would have to purchase unlimited amounts of government bonds and could re-finance the EU member states. Accordingly, it would have remained on financial-political tasks that would have not been compatible with its independence. Moreover, the door to lenient monetary policy would have been opened. The European monetary union would have no longer been a stabilization union. This would have been a constitutional problem for Germany, on which on this basis Germany agreed to establish a European monetary union. Eventually, Germany would be seriously contemplating the exit from the monetary union.
But Germany’s or any other country’s exit from the monetary union could have disastrous consequences for the monetary union region as well as the German economy. In the crisis of 2012, capital owners not only withdrew their money from the heavily indebted southern countries but also in the entire monetary un-ion because they feared the collapse of a currency unit.
Each break will raise these expectations and directly cause other capital flight. As a result, a spillover process develops and it directly fuels the fear of the system’s collapse. Germany’s exit from the union would cause exactly this shock. But this would have adverse impacts on the German economy. Until the new exchange rate between the Euro and the German mark (or other new currencies) was formed, mutual currency relations would have been partially suspended and various Ger-man companies could not have survived that process. Eventually, bankruptcies would have come and the GNP would have fallen. Also, the new DM would come under appreciation pressure and this would have constantly hindered Ger-man exports. So, this would have been too expensive for Germany as of today.
So far, only the ECB has been able to prevent the collapse of the monetary union by purchasing government bonds. In this context, perhaps by making a change in the establishment article, it could have paved the way for it to purchase unlimited

174
THE FUTURE OF MONETARY UNION IN THE EUROPEAN UNION
Hasan Memiş, Hülya Derya
government bonds, which would also cause the financial markets to calm down. This function would have also been with his constant purchase of government bonds in the presence of a threat, in accordance with daily needs. The ECB would likely be responsible for the same number of government bonds at the end of such a process. However, this is not in compliance with the order policy in sav-ings and essentially does not have a calming effect on the markets.
The ECB and German policy stand in front of such a dilemma. On the one hand, the ECB feels obliged to purchase government bonds during the debt cri-sis, because it wishes to prevent the collapse of the monetary union. In this case, Germany may turn a blind eye to a limited purchase, because the collapse of the Euro could cause serious economic damage in Germany. On the other hand, the ECB becomes more and more “lender of last resort” in this way, which is not in compliance with its legal basis. Due to such a dilemma, Germany should ulti-mately choose between two options.
B) “More Europe” as a Solution?
This dilemma does not disappear simply by calling for “More Europe”. Moreo-ver, the “More Europe” strategy is still open to interpretation and various solu-tion strategies gathered under this heading are not realistic. At the same time, it is an unrealistic vision of trying to solve this problem of over-indebtedness with an institutionalized budget or political economy control. These suggestions in-clude, for instance, the European economic government, the Greek savings com-missioner, the European finance minister, or Brussels to be equipped with broad powers on the budget. After all, when Germany is asked to take responsibil-ity, it is normal for such suggestions to come from the base. If the German fed-eral government is to take responsibility, it wishes to have some guarantees in return. These suggestions are unrealistic because such rights can only be estab-lished within the hierarchical traditional governments of national states. How-ever, Europe would never become a unitary state. As delicately put by Napo-leon in this context: “Europe will or will not be federal” (Feld, 2003: 289-317). In the federal order, it is not possible to interfere with the budgets of member states. The American federal states, Canadian provinces, and Swiss cantons have extensive budgetary autonomy. They can borrow by the right bestowed to them, but they are fully responsible for these borrowings. There is no debt service ob-ligation union. German states, on the other hand, are subject to a very limited

PERSPECTIVES ON MODERN ECONOMY
Aizhan KHOICH, Ali Eren ALPER, Ahmet Arif EREN
175
restriction and are in a debt service union at the federal level. Here, just like the USA, Switzerland, and Canada, the states have administrative autonomy (Feld and von Hagen 2007: 125-150).
Only Brazil makes an exception at this point. Brazil experienced a series of finan-cial crises following the military dictatorship, and in the 80s and the 90s, this of-ten resulted in the liberation of states on the federal level. Subsequently, the fed-eral intervention has become an expectation in the states during this period. In the wake of a new financial crisis and the expected bankruptcy of some states, the federal government passed a Fiscal Responsibility Law, which imposed a tight ex-penditure and debt brake on both the federal government and the states. For the implementation of this, the federal administration was given the right to inter-vene in the state budgets. The law also has sanctions: personal mistakes in poli-tics and economics can be punished by fines or imprisonment. Besides, a series of rules ranging from management transparency to personnel training is applied in Brazil. The financial responsibility law has become decisive for the stabiliza-tion of public finance. Even though the harsh sanctions of the law have not been used yet, these rights eventually brought about a transformation into the uni-tary state. The local controls of the German federal states have been shown as a model generally in the context of the right to intervene so far. Notwithstanding, there are some obligations in Switzerland and the USA. The federal-state can ul-timately be disciplined by force in a probable situation. This legal right does not apply much since both states have ultimately gone through civil wars. Although the excessive indebtedness of the states in Germany is the subject of the federal parliament and boards, a legal sanction is also preferred as the last option here.
This brief description of law on budgetary intervention in federal states has shown us that the intervention of a higher state level must be assessed differently for sound budgetary policy formation. On the other hand, the EU is far from be-ing a federal state, at this stage there is no disposition that only national budgets would be controlled more effectively. One of the main reasons why France and Germany did not want to accept in the 2003 pact is to ensure their budgetary autonomy. It does not seem possible for the EU’s sovereign powers to accept ef-fective usage rights. Beyond that, the integration of budget policies in Europe is NOT CONCERNING THE SOLUTION OF THE PROBLEM. There are two reasons for crises in the European Union: firstly, it is a system crisis and secondly, the structural problems of the member states underlie the crisis.

176
THE FUTURE OF MONETARY UNION IN THE EUROPEAN UNION
Hasan Memiş, Hülya Derya
The cause of the system crisis lies in the structure of the European monetary un-ion since there is national autonomy and the responsibility is assumed by the political finance. In this regard, member countries borrowed in a currency that they could not produce. The ECB is not subject to a liability law in this sense, so it cannot directly re-finance member countries. Besides, member countries should not mutually assist each other in accordance with the prohibition of mu-tual aid. After all, this indicates that if a country becomes over-indebted, it must go bankrupt. This bankruptcy risk emerged with the refinancing of Greece’s “vol-untary” debt burden. Due to the risk of bankruptcy, especially vulnerable inves-tors sold off borrowed government bonds. This increased the cost of refinancing and raised concerns that these countries would not be able to recover with their own power. Since there is no common solution in the European region, the fi-nanciers who worry that the monetary union would collapse are moving away from the Euro (Feld, 2011: 31).
The government borrowing of Greece, Italy, Ireland, Portugal, and Spain is very high. Also, wage costs rise sharply. The factors that cause problems in these coun-tries are not so important in this context. Italy and Greece have had high govern-ment debt for a long time, although Italy has had a primary surplus and private sector borrowing is low, but that does not change the situation. In Portugal, the growth of state and private borrowings is thought-provoking. Excessively high pri-vate borrowing in Ireland and Spain causes major problems. Labor costs are too high in all five countries. Regardless of the reasons for this difficult situation that countries have fallen into, there is no escape from the consolidation of public fi-nance and the reforms in the labor and product markets. These countries have to make the necessary adjustments in the short- and medium-run. But even in this way, the systemic crisis may not be overcome, even if the problems were not systemic, the situation would not change even if the monetary union states were in great condition before the financial crisis. Because once a systemic crisis devel-ops, then investors’ trust usually comes back only over time. Even if states make reforms and necessary improvements, investors are not guaranteed to give them money at regular interest rates.
After all, the solution to the Euro crisis should be bilateral. It should lead member states to the consolidation of state finances and reforms in the business - prod-uct markets and include measures to overcome the systemic crisis. Consolida-tion and structural reforms can be made within national responsibility. Because

PERSPECTIVES ON MODERN ECONOMY
Aizhan KHOICH, Ali Eren ALPER, Ahmet Arif EREN
177
the necessary corrections require wide-ranging interventions in existing income and wealth relations, which can only be realized with national-state responsibil-ity. If the ECB’s prohibition on the purchase of government bonds was lifted, then government bonds can be purchased on a large scale. This would have ulti-mately meant ‘More Europe’ since government borrowing would have been in-cluded in the community through the ECB balance sheet.
The second option to overcome the systemic crisis may be Eurobonds. Nonethe-less, the concept of Eurobond is not used clearly. At this point, it would be cor-rect to define it with an exquisite definition. Eurobonds are essentially common European government bonds, for which the member states of the monetary un-ion bear joint responsibility in this regard. Although each bond has a limited ma-turity and amount, the moment such an instrument reaches the EU platform, it becomes unlimited. In this way, government borrowing is constantly included in the community. If Eurobonds were now ready for use, which is difficult due to the legal framework, then it would have created a partially reliable investment tool into which investors could have deposited money. Furthermore, this would have been a clear confirmation of the persistence of the European monetary union.
Conclusion
The EU has appeared on the stage of history since the era when its foundations were laid, and been one of the most important actors of both politics and econ-omy for many years. Nevertheless, similar to the fact that different inhabitants of a house live in constant conflict, it was not easy, as predicted, for countries with different cultures and features to live under the same roof. In the monetary un-ion, a group of countries has determined a common currency unit, abandoning their existing national currencies. The monetary union must have an institution with the authority to set interest rates, make decisions on money emission, and manage the common exchange rate. In the monetary union, there should be no significant differences among the policies implemented by the national banking regulatory and supervisory authorities of the member countries. In case of a fi-nancial crisis in the monetary union, the central bank of the union should as-sume the task of being the lender of last resort from which financial institutions may borrow. In the monetary union, it should be clearly known how the central bank will allocate the financial burden that would arise in crisis situations among the member countries due to its duty of the lender of last resort. Today, the point

178
THE FUTURE OF MONETARY UNION IN THE EUROPEAN UNION
Hasan Memiş, Hülya Derya
is that the member countries, trying to blend the same monetary policy with dif-ferent fiscal policies, have made huge discrepancies between the economic indi-cators in one corner and the indicators in the other corner. Such discrepancies are not likely to diminish at all. The structural problem of the Eurozone that un-derlies the crisis is the paradox of “economic integration/political fragmentation”. Despite the economic integration, the incomplete political integration constitutes the structural basis of various problems the EU encounters as of today. Nonethe-less, the hope that the EU member states will find a way out without leaving the monetary union is still alive. Thus, it is necessary to return to the basic princi-ples of the Maastricht Treaty and support the existing monetary regulations with a bankruptcy rule for states and rules for the banking union. In this context, the ECB should not be held accountable for greater monetary value stabilization.
References
Borchard, Klaus Dieter (2000), “The ABC of Community Law, European Commission, Luxemburg”, http://www.europa.eu.int/eur.lex/en/about/abc/index.html, (18.01.2009).
Die EG-Währungsunion füh t zur Zerreißp obe”, Manifest und Unterschrif-tenliste, Frankfurter Algemeine Zeitung vom 11. Juni 1992, S. 15.
Feld, Lars P. (2003), Eine Europäische Verfassung aus polit-ökonomischer Sicht, ORDO – Jahrbuch für die Ordnung von Wirtschaft und Gesellschaft 54, S. 289 – 317.
Feld, Lars P. (2011), Ein Scheitern ist nicht eingeplant, oder: Ordnungspoli-tische Prinzipien der Europäischen Währungsunion, Impulsreden zur Sozialen Marktwirtschaft, Schriftenreihe des Wirtschaftspoli-tischen Clubs Deutschland, Berlin.
Feld, Lars P. und Jürgen von Hagen (2007), Federal Republic of Germany, in: Anwar Shah(Hrsg.), The Practice of Fiscal Federalism Compara-tive Perspectives, A Global Dialogue on Federalism Series Vol. 4, McGill University Press, Montreal et al., S. 125 – 150.
Hayek, Friedrich A. von (1977), Entnationalisierung des Geldes. Eine Analyse der Theorie undPraxis konkurrierender Umlaufsmittel, Mohr Sie-beck, Tübingen.

PERSPECTIVES ON MODERN ECONOMY
Aizhan KHOICH, Ali Eren ALPER, Ahmet Arif EREN
179
Karluk, S. Rıdvan (1996), Avrupa Topluluğu Ve Türkiye, 4. Baskı, İstanbul Menkul Kıymetler Borsası Yayınları, İstanbul.
Sievert, Olaf (1992), Geld, das man nicht selbst herstellen kann: Ein ordnung-spolitisches Plädoyer für die Währungsunion, Frankfurter Allge-meine Zeitung vom 26. September 1992; wieder abgedruckt in: Peter Bofinger, Stephan Collignon und Ernst-Moritz Lipp (Hrsg.), Währungsunion oder Währungschaos?, Gabler, Wiesbaden 1993, S. 13 – 24.
Wissenschaftlicher Beirat beim Bundesministerium der Finanzen (BMF) (2010), Ohne Finanzmarktreformen keine Lösung der europäis-chen Staatsschuldenkrise, Brief an Bundesfinanzminister Wolfgang Schäuble.


181
11INTERNATIONAL OUTSOURCING AND THE CHARACTERISTICS OF FIRMS: EVIDENCE FROM THE TURKISH MANUFACTURING FIRMS1
Almıla BURGAÇ ÇİL2
1. Introduction
In the past few decades, the world economy has witnessed the rapid globalization of economic activities that have caused significant change. International produc-tion, international trade and investments are more organized in the global value chains of different countries in the production process (De Backer and Yamona, 2012). This functional and spatial fragmentation in the global value chains sig-nificantly affects how the global economy operates and increases the economic dependence between economies.
The international trade theories have changed quite significantly in the globalized world of the 21st century. This change has started to be observed in the mid-1990s with widespread availability of firm-level data. The importance of the firm level decisions and the characteristics of the firms are increasingly emphasized in determining the causes and consequences of international trade (Bernard et.al., 2007) and “international fragmentation of production” and “firm heterogene-ity” are stand out.
Heterogeneous firm models, which follow the pioneering work of Melitz (2003), are focused on the reallocation of resources between and within firms as the en-dogenous change in firm productivity and exhibiting the different characteristic
1 This study was supported by TUBİTAK (The Scientific and Technological Research Council of Turkey) with the project number 1059B191701240.
2 Asst. Prof. Dr. Çukurova University, Faculty of Economics and Administrative Sciences, Department of Economics, [email protected]

182
INTERNATIONAL OUTSOURCING AND THE CHARACTERISTICS OF FIRMS: EVIDENCE FROM THE TURKISH MANUFACTURING FIRMS
Almıla BURGAÇ ÇİL
of the firm within the same sector. Owen (2015) asserts that the firm is hetero-geneous in terms of its characteristics such as size, export, status and productivity in the New New Trade Theory. Especially, with the availability of firm-level da-taset, most of studies in recent literature focus on export activity and firm’s het-erogeneity (Bernard and Jensen, 2004; Helpman et.al. 2004; Greenway et. al. 2007; Arnold and Hussinger, 2010). On the other hand, the internationaliza-tion of the production and liberalization of international trade leads to techno-logical development a decrease in production cost and international fragmenta-tion of the value chain. International fragmentation of production of value chain which is international outsourcing causes every parts of products to be subjected to international trade and is the source of comparative advantage of fragmented goods (Arndt and Kierzkowski, 2001; Jones, et.al. 2005).
International outsourcing has attracted increasing attention on international eco-nomics in the recent years. Feenstra and Hanson (1999) pointed out that inter-national outsourcing seems to be an important source of change in factor pro-ductivity and have an impact on how changes affects value added prices and production efficiency. In this sense, the developments in international trade the-ories and related literature are concerned on explanation of the increasing impor-tance on international outsourcing that has caused on rise in international trade along with the fragmentation of the production for firms, economists and policy makers (Deardoff, 2001; Jones and Kierzkowski, 2001).
International outsourcing is one of the most popular topic in developed and de-veloping countries. More particularly, the share of imported intermediate inputs to the total import is gradually increasing in developing countries (Feenstra and Hanson, 1999; Amiti and Wei, 2009 and Falk, 2012). The manufacturing indus-try is an important part of Turkey’s foreign trade and has a decisive role in Turk-ish economic growth. Exports include medium-low and low technology products, while imports include medium-high and high technological products. It is seen that most of the export products are related to the imported intermediate inputs. The use of imported intermediate inputs in Turkey raises from low technology to high technology industry but the share of the value added is decreasing. Con-sidering the structure of foreign trade of Turkish economy, intermediate inputs constitute a significant proportion of import. The use of imported intermediate inputs in Turkish manufacturing firms is increasing throughout. Imported inter-mediate inputs in Turkish economy between 2006 and 2015 was increased by an

PERSPECTIVES ON MODERN ECONOMY
Aizhan KHOICH, Ali Eren ALPER, Ahmet Arif EREN
183
average of 11% annually and that constituted around 2/3 of total imports. In the same period, the share of imported intermediate inputs in total imports increased rapidly, from 66% to 73%. National Development Plans in Turkey have focused on increasing exports, productivity and control of imported intermediate inputs.
The goal of this study is to analyze the link between the firm’s characteristics and international outsourcing for the Turkish manufacturing industry in terms of firm’s heterogeneity in international trade. Thereby, it is aimed to produce more reliable information for policymakers by using firm-level data, along with theoretical ar-guments. Hereby, this study contributes to the literature in the number of ways. Firstly, based on Turkish firm-level data, the present study investigates the firm heterogeneity in international outsourcing. In the literature, measurements of in-ternational outsourcing based on sectoral data sources are more common (Feenstra and Hanson, 1996, 1999; Hijzen, 2003; Hijzen et al., 2005; Egger and Egger, 2006; Horgos, 2009). Sectoral data sources are considered to have lower accuracy in measurement compared to firm-level data sources. Alvarez and Lopez (2005), Marinov et al. (2008), Arnold and Hussinger (2010) highlight that firms oper-ating even within narrowly defined industries are heterogeneity as firm’s charac-teristics such as productivity, size, capital intensity, etc. If these analyses use in-dustry-level measures, the aggregate data are inadequate since macro-level data in measuring international outsourcing leads to smooth the information (Tomiura, 2005). Firm-level data allows showing whether international outsourcing has dif-ferent effects according to the characteristics of the firms. Therefore, using firm-level data is very important. Second, Melitz (2003), Bernard et al. (2003) and Chaney (2016) have asserted the effect of firm heterogeneity on the decision of firms to serve a foreign market. In this sense, this study examines that the de-termination of international outsourcing following recent developments on firm heterogeneity in international trade. The study fundamentally aims to serve this purpose for the Turkish economy. As far as our best information, this is the first study to investigate the firm-level drivers of the international economy in spe-cific to the Turkish economy.
This study is organized as follows. Section 2 presents potential drivers of inter-national outsourcing, and Section 3 summarizes a brief review of the literature. Section 4 introduces econometric methodology and data. The empirical results are reported in Section 5. Section 6 provides conclusions.

184
INTERNATIONAL OUTSOURCING AND THE CHARACTERISTICS OF FIRMS: EVIDENCE FROM THE TURKISH MANUFACTURING FIRMS
Almıla BURGAÇ ÇİL
2. Potential Drivers of International Outsourcing
Globalization has led to efforts to increase competitive pressure, reducing costs and increase efficiency. Increasing efficiency and reducing costs resulted in inter-national fragmentation of the manufacturing processes of the firms. Firms have aimed to provide a competitive advantage by making different stages of produc-tion activities in different countries. Thus, there are many factors that can lead firms to use imported intermediate inputs.
Firstly, we analyze the relationship between international outsourcing and the firm’s total factor productivity. The productivity has been intensively examined in the literature on firm’s engaging in international trade. There is a strong re-lationship between the international outsourcing and productivity. Firm’s deci-sion to outsource or not is endogenously determined and, a firm’s characteristics and its productivity play an important role on this decision (Antras and Help-man, 2004). In the short term, the impacts of international outsourcing on firm’s productivity is that outsourcing firms are able to reach higher quality and less costly inputs internationally than domestically obtained. Since imported inter-mediate inputs may differ in quality from domestic equivalents (Castellani et al, 2010), the diversification of intermediate inputs for firm leads both to a better quality of final goods and leading to a shortening of the production process (Al-tomonte et. al., 2013). Thus, the increase in the use of imported intermediates inputs directly increases firm’s productivity (Görg and Hanley, 2005 and Amiti and Wei, 2009). In the long term, international outsourcing will lead to change in factor shares that will impact on productivity (Görg and Hanley, 2005). Tak-ing into consideration such factors as technological development and labor cost firm in the small open economy allows reallocation of resources more efficien-cytly. It also provides a competitive advantage on production on which different stages performed in different countries (Damijan et. al., 2009). Görg and Han-ley (2005) and Amiti and Wei (2009) have emphasized the importance of the reallocation of production within firms because of the use of international out-sourcing. They have found that there is a positive relation between international outsourcing and productivity.
Although the growing literature on the relationship between productivity and international outsourcing, there has no built consensus yet (Falk, 2012). Most of studies find a positive and significant effect the relationship between interna-tional outsourcing and firm’s productivity (Pavnick, 2002; Görzig and Stephan,

PERSPECTIVES ON MODERN ECONOMY
Aizhan KHOICH, Ali Eren ALPER, Ahmet Arif EREN
185
2002; Hesmati, 2003; Girma and Görg, 2004; Görg and Hanley, 2005; Tomi-ura, 2005; Kurz, 2006; Amiti and Konings, 2007; Kasahara and Rodriguze, 2008, Topolova and Khandelwal, 2011; Altomente et al. 2013; , Farinas et al 2016) while the other studies in the litarture find no effect (Gilley and Rasheed, 2000; Egger and Egger, 2006; Bengston and Dabhilkar, 2009).
As the second determinant of international outsourcing, we investigate the effect of the exporting firm’s status or export intensity. There are different direct and in-direct channels through which export can increase imported intermediate inputs (Bas and Strauss-Kahn, 2014). The first channel is indirect complementarily effect which firms access to more input varieties from abroad. It is stated in the literature that imported intermediate inputs are a significant incentive for the firm’s exports (Bas and Strauss-Khan, 2014). Improved export market access is accompanied by both firms productivity and overcoming export fixed costs. Kugler and Verhoo-gen (2009), Goldberg et al. (2010), Bas and Strauss-Kahn (2014) and Halpern et al. (2015) emphasize that accessing more different kind of imported interme-diate inputs increase firms’ productivity and enable firms to operate in the more export markets or produce new products to the export markets. Imported inter-mediate inputs lead to productivity gains. With the increase in productivity, im-ported intermediate inputs increase the firm’s export and hence firms cover more easily the fixed cost to enter the export markets and can continue their activi-ties in the competitive export markets. The second effect is firms have access to high-quality input and new technology (Feng et al., 2016). Achieving advanced technology and the imported intermediate input allow for some of the fixed costs to be offset in relation to the possibility of increased exports and the restructur-ing of external demand to produce goods that satisfy the required quality stand-ard. In brief, imported intermediate input affects the firm’s exports in three ways (Edwards et al. 2018). First, imported intermediate input is associated with the firm’s productivity increase (Schor, 2004; Amiti and Konning, 2007; Halpern et al, 2015; Kasahara and Rodrigue, 2008). Second, accessing low-cost intermedi-ate inputs increases export revenues (Bas and Strauss-Kahn, 2014). This chan-nel increases the profitability of the firm as they bear the fixed costs in the ex-port markets. Third, imported intermediate input increases production quality in the production process. It allows the sale of higher quality products in the ex-port market (Kugler and Verhoogen, 2009).

186
INTERNATIONAL OUTSOURCING AND THE CHARACTERISTICS OF FIRMS: EVIDENCE FROM THE TURKISH MANUFACTURING FIRMS
Almıla BURGAÇ ÇİL
Another important drivers of international outsourcing is the firm’s ownership by nationality. Firm’s ownership structure is different between outsourcer and non-outsourcer. The probability to contract out more productive firms abroad is very high for foreign-owned firms due to part of competing in the international market, hence these firms are more intensive the use of international outsourcing compared to domestic firms. According to the earlier paper in the empirical liter-ature, the relationship between national ownership and international outsourcing is unclear. Girma and Görg (2004), Tomiura (2005) and Díaz-Mora (2008) have found positive signs, but Holl (2008) has obtained negative signs.
Furthermore, we analyze the influence of firm size as drivers of international out-sourcing. The firm size states the specialization motive of international outsourc-ing. Firm size considers controlling economies of scale. The large firms bear the fixed entry costs for international outsourcing. Therefore, larger firms tend to be more active in international outsourcing. Tomiura (2005) has emphasized that larger firms can contract with firms from abroad for international outsourcing more easily because of having stronger negotiating power in the market. The sign of firm size is mixed in the literature. Tomiura (2005) and Holl (2008) have found positive relationship between international outsourcing and firm size, while Görg and Hanley (2004) and Díaz-Mora (2008) have obtained negative relation.
Finally, firm’s financial constraint is also related to international outsourcing. The importance of productivity and financial constraints have been widely proven in the international trade literature on heterogeneous firm trade models (e.g., Melitz, 2003; Manova, 2013; Muuls, 2015; Chaney, 2016). Firms have to bear fixed and sunk costs in order to operate in the export markets. Therefore, it is emphasized that financial factors is critical role in determining the firm’s decision to enter the export markets (Berman and Hericourt, 2010; Göksel, 2012; Chaney, 2016). Bas and Berthou (2012) and Muûls (2015) found that financial constraint affects the firm’s ability to import. Based on these developments in the literature, the effect of financial constraint on international outsourcing has investigated in this study. Lu et al. (2018) found that financial constraint and productivity have an impor-tant role on global value added. Muûls (2015) and Chaney (2016) show theo-retically firms with high financial constraint are less likely to export or import.
Because the implications and directions of the different determinants of inter-national outsourcing in terms of firm heterogeneity are mostly mixed and have

PERSPECTIVES ON MODERN ECONOMY
Aizhan KHOICH, Ali Eren ALPER, Ahmet Arif EREN
187
been never examined for the Turkish manufacturing firms up to this point, we will analyze the relationship between international outsourcing and firm charac-teristics empirically.
3. Brief Review of Literature
In recent years, the international outsourcing is one of the most popular top-ics in empirical literature. The vast majority of international outsourcing litera-ture concentrates on impact of international outsourcing on productivity. Amiti and Konings (2007), Görg et al. (2008), Kasahara and Rodrigue (2008), Gold-berg et al. (2010), Lileeva and Trefler (2010), Yu and Li (2014), Halpern et al. (2015) and Forlani (2017) have documented that the use of imported interme-diate inputs for firms play a crucial role in increasing productivity. Halpern et al. (2015), Kugler and Verhoogen (2009), Gibson and Graciano (2011), Bas and Strauss-Kahn (2014) and Fan et al. (2015) and Fen et al. (2016) have demon-strated that firms increase productivity by taking advantage of new technologies embedded in imported intermediate inputs.
The other part of studies is about that embed the firm’s outsourcing in the esti-mation of a firm production function. Görzig and Stephan (2002), Görg et al. (2008), Görg and Hanley (2004) and Hijzen et al. (2005), and McCann (2011) have investigated that international outsourcing leads to increase the firm’s pro-ductivity. While international outsourcing is increasingly becoming most impor-tant in international trade literature, the empirical literature on this subject is very limited. Görg and Hanley (2004), Girma and Görg (2004, Tomiura (2005), Díaz-Mora and Triguero (2007), Díaz-Mora (2008), Holl (2008) and Paul and Woster (2010) have investigated the determinants of international outsourcing at the firm level in increasing productivity.
4. Economic Model and Data
The empirical specifications used in this study have been expressed to analyze de-terminants of international outsourcing. To capture the relationship between inter-national outsourcing, productivity and firm characteristics for the Turkish manu-facturing industry, we use the basic model in econometric estimation by following Girma and Görg (2004), Farians and Martin-Marcos (2010) and DíazMora(2008):

188
INTERNATIONAL OUTSOURCING AND THE CHARACTERISTICS OF FIRMS: EVIDENCE FROM THE TURKISH MANUFACTURING FIRMS
Almıla BURGAÇ ÇİL
• Model 1: outit=α+β1TFPit+υt+εt (1)
• Model 2: outit=α+β1TFPit+ β2Xit + υt+εt (2)
where i is the firm in manufacturing industry, t denotes the time, outit represents firm’s international outsourcing, TFPit represents firm-based total factor produc-tivity, Xit shows the control variables specifying other characteristics of the firms such as financial constraint (fincons), price to cost margin (PCM), export inten-sity (exp_intensity) or export dummy (dum_export), firm’s ownership (FDI), firm size and profit before tax (bef_profit). All estimated models include year and in-dustry-specific fixed effects to consider for firm invariant factors in our sample.
Firstly, the basic model that examines the effect of the firm’s TFP on the interna-tional outsourcing of firms has been tested. We then turn to exploit important other indicators of firm heterogeneity in addition to an extension to basic model. The dependent variable in this study is international outsourcing, which is calcu-lated as the ratio of imported intermediate inputs to total intermediate inputs at the firm level. Görg and Hanley (2005) and Farians and Martin Marcos (2010) also used the same measurement for international outsourcing to underline the importance of imported intermediate inputs in their analysis.
To calculate the firm level TFP we employ Levinsohn-Petrin (2003) semi-par-ametric method. We would expect more productive firms to do more interna-tional outsourcing than other firms. Financial constraint is measured the share of total financial expenditure to total cost. Export intensity is measured as rate of firm’s exports value to sales. Export dummy is defined as export status of the firm, which takes a value of 1 if firm is exporter and 0 for firm is non-exporter. Export market access is accompanied by both firm productivity and overcom-ing export fixed costs. Kugler, Verhoogen (2009), Goldberg et al. (2010), Bas and Strauss-Kahn (2014) and Halpern et.al. (2015) emphasize that accessing more different kind of imported intermediate inputs increase firm productiv-ity and enable firm to operate in more export markets or produce new products to the export markets and hence firm covers more easily the fixed cost to enter the export market and can continue its activities in the competitive export mar-kets. Thus, we would expect the sign of export variable to have positive. Foreign ownership dummy takes value of 1 if the firm has foreign ownership and 0 oth-erwise. The sign of FDI is expected to be positive if firms have foreign owner-ship are that is expected to use international outsourcing more intensively. The firm size variable is calculated the ratio value added of firms over the total value

PERSPECTIVES ON MODERN ECONOMY
Aizhan KHOICH, Ali Eren ALPER, Ahmet Arif EREN
189
added of sector and included in analysis to control for the effects of economies of scale. We would expect this variable to have positive relation, because larger firms might be more probability to outsource. PCM is the price to cost margin and is computed by the value added minus wages to divide by the value of gross production. bef_profit is profit before tax.
The dataset covers the period from 2006-2015 and we get the unbalanced panel which contains 13.874 firms with total of 93,918 observations. We use two dis-aggregated sources of large firm-level data sets obtained from the Turkish Statis-tical Institute (TURKSTAT) in order to analyze the relationship between energy intensity and firm characteristics for the Turkish manufacturing industry. The first firm-level dataset used is retrieved from the Annual Industrial and Service Statistics survey that contains very comprehensive firm-level information and that covers firms operated in all manufacturing and service sectors of the Turkish economy. This survey involves the firm-level information on classifications of economic ac-tivities at four-digit level, employment, payments, revenues, expenses, value added, number of employees, stocks and investments, financial expenses, profit before and after tax and etc. The second dataset is Foreign Trade Statistics which con-tains statistics on each trading firm’s products, including export and import val-ues, quantity measures, statistics on partner country. In order to compose the da-taset, we received firms belong to with 20 or more employee and drop firms with lower than operating three years in the manufacturing sector. After eliminations and calculations, we merge the Annual Industrial and Service Statistics and For-eign Trade Statistics by using the firm’s identification number.
5. Economic Results
In this part of the study, we indicate the estimated results for the equation (1-2). We examine the drivers of international outsourcing. In all regressions, firm of international outsourcing is regressed on total factor productivity and other firm characteristics variables using Ordinary Least Squares (OLS) and fixed effect meth-ods. Time and industry effects are included in all models. Table 1 shows the esti-mated results of the econometric analysis for each model about determinants of outsourcing. Especially, in the direction of heterogeneity firm trade model, we see in Table1 that manufacturing firms have important differences on characteristics.
The findings can be summarized as follows. First of all, estimated results for TFP are statistically significant and positive in all models on international outsourcing.

190
INTERNATIONAL OUTSOURCING AND THE CHARACTERISTICS OF FIRMS: EVIDENCE FROM THE TURKISH MANUFACTURING FIRMS
Almıla BURGAÇ ÇİL
Consistent with the findings of Halpern et al. (2015), we have calculated to in-crease the total factor productivity by importing intermediate inputs, TFP of firms affects positively on international outsourcing in all columns of Table 1 in all used econometric methods. Hence, an increase of TFP enhances the firm’s in-ternational outsourcing. The positive relationship between TFP and international outsourcing assert that imported intermediate inputs can be an important chan-nel of technology transfer.
Table 1. Determinants of International OutsourcingVariables OLS_1 FE_1 OLS_2 FE_2 OLS_3 FE_3
TFP 0.104 0.058 0.078 0.049 0.083 0.062
prob. 0.000 0.000 0.000 0.000 0.000 0.000
FDI 0.877 0.089 0.899 0.065
prob. 0.000 0.209 0.000 0.327
exp_intens 0.004 0.012
prob. 0.311 0.024
dumexport 0.373 0.139
prob. 0.000 0.000
ln_PCM 0.317 0.133 0.351 0.131
prob. 0.000 0.000 0.000 0.000
ln_firmsize -0.056 0.027 -0.055 0.026
prob. 0.000 0.072 0.000 0.057
ln_ bef_profit 0.152 0.001 0.116 0.009
prob. 0.000 0.918 0.000 0.181
ln_fincons 0.046 0.022 0.035 0.023
prob. 0.001 0.000 0.001 0.000
N 93918 93918 60967 60967 77898 77898
F 22.451 12.098 122.445 13.696 145.937 19.802
Second, column (3) to column (6) express that firm size which is a sign to econ-omies of scale and that is also significant and positive sign even after controlling other firm characteristics for result of fixed effect. Firms provide some advantages

PERSPECTIVES ON MODERN ECONOMY
Aizhan KHOICH, Ali Eren ALPER, Ahmet Arif EREN
191
with the effects of economies of scale such as the lower per unit costs, through the use of the division of labor, operational efficiency, and vertical integration. Hence, according to the positive relationship between a firm’s size and international out-sourcing, an increase in the firm’s size causes international outsourcing activities.
Third, exporting activity variables are statistically significant and have positive signs in all models. These results are in consistent with Grossman and Help-man (2002), Görg and Hanley (2004), Bas, Strauss-Kahn (2014), and Feng et al. (2016) works. Hence, consistent with a priori expectations, increase in share of export value to sales are related to higher level of international outsourcing. We explain that firms whose plan is to continue export activity and to improve their competitiveness are demanding higher imported intermediate inputs than the other firms. The positive relationship between export activities and interna-tional outsourcing is considerably important because firm accesses more export markets and/or firm’s export value increases, then the possibility of finding higher quality intermediate inputs from abroad increase. The results for all models ver-ify the strong nexus between the international outsourcing and export intensity or export dummy. The higher the value of the firm’s export intensity, the higher the international outsourcing (Columns 3-6). This relationship goes on even af-ter controlling for the impact of imported intermediate inputs imports on firm’s export performance by total factor productivity, which is positively connected with the exports value and export variety. Under these circumstances, the results remain the same to the addition of the other firm characteristics such as firm’s size, financial constraint, profitability and PCM.
Fourth, columns (3-6) of Table 1 reports results for estimation allowing the im-portance of nationality of ownership on international outsourcing. While FDI is statistically insignificant for the fixed effect results, it is positive and significant for OLS results. In line with the prior expectations, we would expect foreign-owned firms are to be more intensive in international outsourcing. The results confirm that FDI has a positive effect on international outsourcing like Girma and Görg (2004) and Diaz Mora (2008) and Holl (2008).
Fifth, in order to reveal the effects of fixed entry cost for entering the interna-tional markets, we generate interaction with international outsourcing and finan-cial constraint. The results show that financial constraint is positively and sig-nificantly correlated with international outsourcing. These factors, especially in

192
INTERNATIONAL OUTSOURCING AND THE CHARACTERISTICS OF FIRMS: EVIDENCE FROM THE TURKISH MANUFACTURING FIRMS
Almıla BURGAÇ ÇİL
Turkey, have an impact on the firm’s decision whether or not it enters both into international outsourcing and the increase in the value of the export value or en-tering exports markets, significantly and sizable.
Sixth, we also examine the impact of firm’s financial constraint on international outsourcing. The results reveal that the firms with financial constraint are more inclined to outsource from abroad. Overall, the regression results indicate that engagement in international outsourcing needs to be a way of broadening the fi-nancial sources for financially constrained firms. Turkey’s First and Second 500 Largest Manufacturing Firms Report 2016 prepared by Istanbul Chamber of In-dustry’s emphasize that the most of the firms operating manufacturing industry satisfy their financial needs with internal financial sources. Also, more firms have to use external financing and external resources with high borrowing cost. Hereby, this relationship between financial constraint and international outsourcing can arise possible difficulties that financially constrained firms face in higher costs of international outsourcing.
6. Conclusion
This study has tried to answer how firms’ characteristics affect international out-sourcing using firm-level data for Turkish manufacturing industry over the period 2006–2015 and in this direction what policies should be implemented for inter-national outsourcing. This results show that TFP has a significant role on inter-national outsourcing. According to the results, an increase in firm size leads to increase the international outsourcing. The larger firms in the manufacturing in-dustries may bear the significant fixed cost more easily than the other firms and thereby increasing the profitability from international outsourcing activity. Addi-tionally, the results indicate that the higher export intensity is positively related to international outsourcing so that an increase in export value or entering the new export market is an important factor.
All based on our results, we shortly recommended that policymakers should es-tablish firm-based policies to ensure exports and productivity increases as pointed out in Turkey’s National Development Plan. Thereby, the policies about inter-national outsourcing need to aim at more efficient production structures in the medium and long term to ensure the best resources allocation. Additionally, pol-icymakers need to consider the policies that increase the value-added gains and

PERSPECTIVES ON MODERN ECONOMY
Aizhan KHOICH, Ali Eren ALPER, Ahmet Arif EREN
193
competitiveness from the point of the current account without decreasing the productivity gains from the imported intermediate inputs. Turkish governments should give incentives and investments which can increase value added. However, it should provide these opportunities for more productive firms, not all. Thereby, the requirements of the determining of medium and long term firm-based selec-tive policies in international trade strategies stand out.
References
Altomonte, C., Aquilante, T., Békés, G., & Ottaviano, G. I. (2013). Interna-tionalization and innovation of firms: evidence and policy. Eco-nomic policy, 28(76), 663-700.
Alvarez, R., & Lopez, R. A. (2005). Exporting and performance: evidence from Chilean plants. Canadian Journal of Economics/Revue canadienne d’économique, 38(4), 1384-1400.
Amiti, M., & Konings, J. (2007). Trade liberalization, intermediate inputs, and productivity: Evidence from Indonesia. American Economic Review, 97(5), 1611-1638.
Amiti, M., & Wei, S. J. (2009). Service offshoring and productivity: Evidence from the US. World Economy, 32(2), 203-220.
Antras, P., & Helpman, E. (2004). Global sourcing. Journal of political Econo-my, 112(3), 552-580.
Arndt, S. W., & Kierzkowski, H. (Eds.) (2001). Fragmentation: New produc-tion patterns in the world economy. Oxford: Oxford University Press.
Arnold, J. M., & Hussinger, K. (2010). Exports versus FDI in German man-ufacturing: firm performance and participation in international markets. Review of International Economics, 18(4), 595-606.
Bas, M., Berthou, A., (2012). The decision to import capital goods in India: firms’ financial factors matter. World Bank Econ. Rev. 26, 486–513.
Bas, M., & Strauss-Kahn, V. (2014). Does importing more inputs raise exports? Firm-level evidence from France. Review of World Economics, 150(2), 241-275.
194
INTERNATIONAL OUTSOURCING AND THE CHARACTERISTICS OF FIRMS: EVIDENCE FROM THE TURKISH MANUFACTURING FIRMS
Almıla BURGAÇ ÇİL
Bengtsson, L., & Dabhilkar, M. (2009). Manufacturing outsourcing and its ef-fect on plant performance—lessons for KIBS outsourcing. Journal of evolutionary economics, 19(2), 231.
Berman, N., & Héricourt, J. (2010). Financial factors and the margins of trade: Evidence from cross-country firm-level data. Journal of Develop-ment Economics, 93(2), 206-217.
Bernard, A. B., & Jensen, J. B. (2004). Why some firms export. Review of eco-nomics and Statistics, 86(2), 561-569.
Bernard, A. B., Eaton, J., Jensen, J. B., & Kortum, S. (2003). Plants and pro-ductivity in international trade. American economic review, 93(4), 1268-1290.
Bernard, A. B., Jensen, J. B., Redding, S. J., & Schott, P. K. (2007). Firms in international trade. The Journal of Economic Perspectives, 21(3), 105-130.
Castellani, D., Serti, F., & Tomasi, C. (2010). Firms in international trade: Importers’ and exporters’ heterogeneity in Italian manufacturing industry. World Economy, 33(3), 424-457.
Chaney, T. (2016). Liquidity constrained exporters. Journal of Economic Dy-namics and Control, 72, 141-154.
Coase, R. H. (1937). The nature of the firm. Economica, 4(16), 386-405.
De Backer, K., & Yamano, N. (2011). International comparative evidence on global value chains. OECD Science, Technology and Industry Work-ing Paper, 2012/3.
Damijan, J. P., De Sousa, J., & Lamotte, O. (2009). Does international openness affect the productivity of local firms? Evidence from south-eastern Europe 1. Economics of Transition, 17(3), 559-586.
Deardorff, A. V. (2001). Fragmentation in simple trade models. The North American Journal of Economics and Finance, 12(2), 121-137.
Díaz-Mora, C. (2008). What factors determine the outsourcing intensity? A dynamic panel data approach for manufacturing industries. Ap-plied Economics, 40(19), 2509-2521.
Díaz-Mora, C., & Triguero-Cano, A. (2007). Why do some firms contract out production. Evidence from Firm-Level Panel Data, FEDEA WP, 232.

PERSPECTIVES ON MODERN ECONOMY
Aizhan KHOICH, Ali Eren ALPER, Ahmet Arif EREN
195
Edwards, L., Sanfilippo, M., & Sundaram, A. (2018). Importing and firm ex-port performance: new evidence from South Africa. South African Journal of Economics, 86, 79-95.
Egger, H., & Egger, P. (2006). International outsourcing and the productivity of low-skilled labor in the EU. Economic Inquiry, 44(1), 98-108.
Falk, M. (2012). International outsourcing and productivity growth. Review of Economics and Institutions, 3(1), 19.
Fan, H., Li, Y. A., & Yeaple, S. R. (2015). Trade liberalization, quality, and export prices. Review of Economics and Statistics, 97(5), 1033-1051.
Farinas, J. C., López, A., & Martín-Marcos, A. (2016). Sourcing strategies and productivity: Evidence for Spanish manufacturing firms. BRQ Business Research Quarterly, 19(2), 90-106.
Farinas, J. C., & Martín-Marcos, A. (2010). Foreign sourcing and productivity: evidence at the firm level. World Economy, 33(3), 482-506.
Feenstra, R. C., & Hanson, G. H. (1996). Globalization, outsourcing, and wage inequality (No. w5424). National Bureau of Economic Research.
Feenstra, R. C., & Hanson, G. H. (1999). The impact of outsourcing and high-technology capital on wages: estimates for the United States, 1979–1990. The Quarterly Journal of Economics, 114(3), 907-940.
Feng, L., Li, Z., & Swenson, D. L. (2016). The connection between import-ed intermediate inputs and exports: Evidence from Chinese firms. Journal of International Economics, 101, 86-101.
Forlani, E. (2017). Irish Firms’ Productivity and Imported Inputs. The Man-chester School, 85(6), 710-743.
Gibson, M. J., & Graciano, T. A. (2011). Costs of starting to trade and costs of continuing to trade. Washington State University, 23.
Gilley, K. M., Rasheed, A. A., & Al-Shammari, H. (2017). Research on Out-sourcing: Theoretical Perspectives and Empirical Evidence. In Global Outsourcing Strategies (pp. 41-56). Routledge.
Gilley, K. M., & Rasheed, A. (2000). Making more by doing less: an analysis of outsourcing and its effects on firm performance. Journal of man-agement, 26(4), 763-790.

196
INTERNATIONAL OUTSOURCING AND THE CHARACTERISTICS OF FIRMS: EVIDENCE FROM THE TURKISH MANUFACTURING FIRMS
Almıla BURGAÇ ÇİL
Girma, S., & Görg, H. (2004). Outsourcing, Foreign Ownership, and Pro-ductivity: Evidence from UK Establishment-level Data. Review of International Economics, 12(5), 817-832.
Göksel, T. (2012). Financial constraints and international trade patterns. Eco-nomic Modelling, 29(6), 2222-2225.
Goldberg, P. K., Khandelwal, A. K., Pavcnik, N., & Topalova, P. (2010). Im-ported intermediate inputs and domestic product growth: Evidence from India. The Quarterly journal of economics, 125(4), 1727-1767.
Görg, H., & Hanley, A. (2004). Does outsourcing increase profitability. The Economic and Social Review, 35(3), 267-288.
Görg, H., & Hanley, A. (2005). International outsourcing and productivity: evidence from the Irish electronics industry. The North American Journal of Economics and Finance, 16(2), 255-269.
Görg, H., Hanley, A., & Strobl, E. (2008). Productivity effects of international outsourcing: evidence from plant-level data. Canadian Journal of Economics/Revue canadienne d’économique, 41(2), 670-688.
Görzig, B., & Stephan, A. (2002). Outsourcing and firm-level performance (No. 309). DIW Discussion Papers, Berlin.
Greenaway, D., Guariglia, A., & Kneller, R. (2007). Financial factors and ex-porting decisions. Journal of international economics, 73(2), 377-395.
Grossman, G. M., & Helpman, E. (2002). Integration versus outsourcing in industry equilibrium. The Quarterly Journal of Economics, 117(1), 85-120.
Halpern, L., Koren, M., & Szeidl, A. (2015). Imported inputs and productivi-ty. American Economic Review, 105(12), 3660-3703.
Helpman, E., Melitz, M. J., & Yeaple, S. R. (2004). Export versus FDI with heterogeneous firms. American economic review, 94(1), 300-316.
Heshmati, A. (2003). Productivity growth, efficiency and outsourcing in man-ufacturing and service industries. Journal of economic surveys, 17(1), 79-112.
Hijzen, A. (2003). Fragmentation, productivity and relative wages in the UK: A mandated wage approach. Leverhulme Centre for Research on Glo-balisation and Economic Policy, University of Nottingham.

PERSPECTIVES ON MODERN ECONOMY
Aizhan KHOICH, Ali Eren ALPER, Ahmet Arif EREN
197
Hijzen, A., Görg, H., & Hine, R. C. (2005). International outsourcing and the skill structure of labour demand in the United Kingdom. The Economic Journal, 115(506), 860-878.
Holl, A. (2008). Production subcontracting and location. Regional Science and Urban Economics, 38(3), 299-309.
Horgos, D. (2009). Labor market effects of international outsourcing: How measurement matters. International Review of Economics & Fi-nance, 18(4), 611-623.
Jones, R. W., & Kierzkowski, H. (2001). Horizontal aspects of vertical frag-mentation. In Global production and trade in East Asia (pp. 33-51). Springer, Boston, MA.
Jones, R., Kierzkowski, H., &Lurong, C. (2005). What does evidence tell us about fragmentation and outsourcing? International Review of Eco-nomics & Finance, 14(3), 305-316.
Kasahara, H., & Rodrigue, J. (2008). Does the use of imported intermediates increase productivity? Plant-level evidence. Journal of development economics, 87(1), 106-118.
Kugler, M., & Verhoogen, E. (2009). Plants and imported inputs: New facts and an interpretation. American Economic Review, 99(2), 501-07.
Kurz, C. J. (2006). Outstanding outsourcers: A firm-and plant-level analysis of production sharing. Working Paper, Federal Reserve Board, Wash-ington DC.
Levinsohn, J., & Petrin, A. (2003). Estimating production functions using in-puts to control for unobservables. The Review of Economic Studies, 70(2), 317-341.
Lileeva, A., & Trefler, D. (2010). Improved access to foreign markets raises plant-level productivity… for some plants. The Quarterly journal of economics, 125(3), 1051-1099.
Lu, Y., Shi, H., Luo, W., & Liu, B. (2018). Productivity, financial constraints, and firms’ global value chain participation: Evidence from China. Economic Modelling, 73, 184-194.
Manova, K. (2013). Credit constraints, heterogeneous firms, and international trade. The Review of Economic Studies, 80(2), 711-744.

198
INTERNATIONAL OUTSOURCING AND THE CHARACTERISTICS OF FIRMS: EVIDENCE FROM THE TURKISH MANUFACTURING FIRMS
Almıla BURGAÇ ÇİL
Marinov, R., Rocha, N., & DiNino, V. (2008). Trade Liberalization and New Exporters” Size: A Test of the Heterogeneous Firm Model. The BE Journal of Economic Analysis and Policy, 8(1).
McCann, F. (2011). The heterogeneous effect of international outsourcing on firm productivity. Review of World Economics, 147(1), 85-108.
Melitz, M. J. (2003). The impact of trade on intra-industry reallocations and aggregate industry productivity. Econometrica, 71(6), 1695-1725.
Muûls, M. (2015). Exporters, importers and credit constraints. Journal of Inter-national Economics, 95(2), 333-343.
Owen, E. (2015). Labor and Protectionist Sentiment. The Oxford Handbook of the Political Economy of International Trade, 119.
Paul, D. L., & Wooster, R. B. (2010). An empirical analysis of motives for offshore outsourcing by US firms. The International Trade Journal, 24(3), 298-320.
Pavcnik, N. (2002). Trade liberalization, exit, and productivity improvements: Evidence from Chilean plants. The Review of Economic Studies, 69(1), 245-276.
Schor, A. (2004), Heterogeneous productivity response to tariff reduction. Evi-dence from Brazilian manufacturing firms, Journal of Development Economics, 75, (2), 373-396.
Tomiura, E. (2005). Foreign outsourcing and firm-level characteristics: Evi-dence from Japanese manufacturers. Journal of the Japanese and International Economies, 19(2), 255-271.
Topalova, P., & Khandelwal, A. (2011). Trade liberalization and firm produc-tivity: The case of India. Review of economics and statistics, 93(3), 995-1009.
Williamson, O. E. (1989). Transaction cost economics. Handbook of industrial organization, 1, 135-182.
Yu, M., & Li, J. (2014). Imported intermediate inputs, firm productivity and product complexity. The Japanese Economic Review, 65(2), 178-192.

SECTION IIIECONOMIC POLICY


201
12IS COVID-19 THE NEW BLACK SWAN OF THE FINANCIAL MARKETS? ON THE LINKAGE BETWEEN COVID-19 AND STOCK MARKETSFatma MUMCU KÜÇÜKÇAYLI1, Gönül YÜCE AKINCI2
1. Introduction
The effect of financial markets on economic growth was first suggested by Schum-peter (1912) and explained that the development in financial markets positively affected economic growth. Financial markets contribute to the transformation of savings into investment and the development of the economy by ensuring that savings reach entrepreneurs in need of funds. Stock markets are one of the most important markets performing this function and stock market indices are an im-portant indicator of financial markets. The ratio of the market value of the stock exchanges to the national income in the countries where these exchanges are lo-cated shows the place of the stock market in the country’s economy. At the end of 2019, the ratio of the total market value of the stock exchanges to the total GDP is 133% (Turkey Capital Markets, 2019: 12). Capital markets can be af-fected by many factors, mainly economic and financial ones, as well as political events, wars and epidemics that will cause uncertainty in the society. Epidemics from past to present have caused millions of people to die and have deep effects on socio-economic life. The Spanish Flu, which was effective worldwide and ex-perienced between 1918-1920, caused an estimated 50 million deaths, while the Asian Flu and Hong Kong Flu between 1957-1958 and 1968-1969, respectively, caused an estimated 1 million deaths. Coronavirus (Covid-19), which emerged in
1 Assist. Prof., Burdur Mehmet Akif Ersoy University Ağlasun Vocational School of Higher Education, Department of Finance, Banking and Insurance, PO Box: 15800, Ağlasun-Burdur/Turkey, [email protected]
2 Assoc. Prof., Ordu University Ünye Faculty of Economics and Administrative Sciences, Department of Business, PO Box: 52300, Ünye-Ordu/Turkey, [email protected]

202
IS COVID-19 THE NEW BLACK SWAN OF THE FINANCIAL MARKETS? ON THE LINKAGE BETWEEN COVID-19 AND STOCK MARKETS
Fatma MUMCU KÜÇÜKÇAYLI, Gönül YÜCE AKINCI
Wuhan, China in December 2019, spread rapidly and caused a worldwide epi-demic problem. According to the World Health Organization (WHO), Covid-19 is a new member of the family of viruses from the common cold that causes more serious diseases such as Severe Acute Respiratory Syndrome (SARS) and Middle East Respiratory Syndrome (MERS) (Abodunrin et al., 2020: 14). The WHO declared a pandemic related to Covid-19 on 11 March 2020. As of 30 July 2020, a total of 17,132,177 cases and 668,377 deaths have occurred in worldwide (215 countries) (Worldometer).
These epidemics, which shocked social, economic and political life, are one of the main threats that create instability for societies. For example, Asian Flu (2008) in Asia and SARS (2002) spreading from Hong Kong were stated as the biggest source of socio-economic instability caused by the pandemic and was accepted as a new “Black Swan” with the jargon in the literature (Antipova, 2020: 357). The “Black Swan” theory was introduced to the literature with the pioneering work of Taleb (2007) and stated that the theory in question has three main fea-tures: i) black swan is unusual, ii) black swan has an extraordinary effect and iii) although the black swan was unpredictable, it contain a thousand facts that can be explained after they happen. The specified features and definitions are fully in-cluded in the Covid-19 case, which is called a new black swan (Morales and An-dreosso-O’Callaghan, 2020: 2). This instability caused by Covid-19 has spread to the financial markets, one of the most fundamental units of the economy, as well as the whole society. In this context, as Aleskerov and Egorova (2012) and Adams and Thornton (2013) state, “Black Swans” are defined as a sequence of events that can change the rate of return of an investment from positive to neg-ative and is associated with a significant level of market uncertainty (as cited in Morales and Andreosso-O’Callaghan, 2020: 3). The uncertainty that emerged in the markets negatively affected investors’ expectations for the future, causing them to lose financial assets and serious drops in stock markets. On March 9, 2020, the impact of Covid-19 on important stock indices in international capital markets was seen with the decrease of the index values by about 10% in one day (Kılıç, 2020: 68). Between January 1, 2020 and April 1, 2020, the depreciation rates of Morgan Stanley Capital International (MSCI) World Index is 25%, the MSCI Emerging Markets Index is 26%, the MSCI European Index is 27%, and the G7 Index is 25% (Şenol and Zeren, 2020; 2). Major world stock exchanges such as the Financial Times Stock Exchange (FTSE), Dow Jones Industrial Average, and Nikkei saw drastic drops as the number of Covid-19 cases increased. Dow Jones

PERSPECTIVES ON MODERN ECONOMY
Aizhan KHOICH, Ali Eren ALPER, Ahmet Arif EREN
203
and FTSE saw the biggest quarterly declines in the first three months of the year since the Stock Exchange Crisis occurred in 1987 (www.bbc.com, 30 June 2020).
The main objective of this study is to examine the impacts of Covid-19, new Black Swan, cases on the financial markets in 24 countries3 for the period between 01/16/2020 and 06/12/2020 with the five-day data set using the switching regres-sion analyses. For this purpose, the study will be composed of five parts. Follow-ing the introduction, in the second part of the paper, summary information will be presented about the applied studies investigating the effect of Covid-19 on fi-nancial markets in the literature, and in the third section, the data set, methodol-ogy and econometric model that are the subject of the application part of this study will be introduced. After the fourth part of the application findings, the study will be concluded with the fifth and final part where a general evaluation will be made.
2. Literature Review
The epidemic diseases have caused many people to become sick and lose their lives and have had a profound impact on human history. It is known that epi-demic diseases have many economic, social and psychological effects as well as the loss of many people. In addition to macroeconomic factors, epidemic diseases have shown their effects in the development of markets and stock exchanges. Ep-idemics create a shock effect in the market and have a negative impact on inves-tors’ expectations for the future. Relatively many studies in the literature show that “bad mood” and anxiety are effective on investor sentiment. Anxiety drives investors’ risk-taking attitudes, causing pessimism about future returns, and hence determines asset price movements (Ichev and Marinč, 2018: 153).
Covid-19 epidemic has also caused uncertainty around the world, has brought about anxiety in investors and has given rise to fluctuations in the stock markets by selling their shares. These effects have been examined theoretically and prac-tically by the researchers. It is expected that studies will continue to understand the effects of epidemics more clearly. Table 1 summarizes some of the studies in-vestigating the effects of Covid-19 epidemic on stock market indices and stock returns in different countries.
3 The countries that was included into the analysis are Turkey, Germany, Austria, Belgium, Australia, Czechia, Denmark, Finland, France, Ireland, Israel, Switzerland, Iceland, Japan, Hungary, Mexican, Norway, Poland, Portugal, Slovak, Slovenia, New Zealand, United Kingdom and Italy.

204
IS COVID-19 THE NEW BLACK SWAN OF THE FINANCIAL MARKETS? ON THE LINKAGE BETWEEN COVID-19 AND STOCK MARKETS
Fatma MUMCU KÜÇÜKÇAYLI, Gönül YÜCE AKINCI
Tabl
e 1. R
eview
of L
itera
ture
Sum
mar
y
Wri
ter(
s)-
Year
Cou
ntry
Peri
odM
etho
dC
oncl
usio
n
Bake
r et a
l (2
020)
Uni
ted
Stat
es (U
S) (S
tock
Mar
ket)
1918
-191
9-19
57-
1958
-196
8-20
20
(pan
dem
ic
perio
ds)
Text
-Bas
ed M
etho
dIt
was
det
erm
ined
that
Cov
id-1
9 ou
tbre
ak c
ause
d th
e hi
gh-
est
stock
mar
ket
fluct
uatio
n am
ong
all
infe
ctio
us d
iseas
es
incl
udin
g th
e 19
18 S
pani
sh F
lu.
Gun
ay (2
020)
US
( DJI
), Ita
ly(F
MIB
), Sp
ain(
IBEX
), C
hina
(SH
C),
U.K
. (U
KX
), an
d Tu
rkey
(XU
100)
03/0
1/20
05-
03/0
4/20
20
(4 d
iffer
ent t
ime
serie
s)
DC
C-
MV
GAR
CH
, D
CC
-M
VFI
GAR
CH
, M
odifi
ed IC
SS
Cov
id-1
9 w
as re
port
ed to
cau
se st
ruct
ural
bre
aks i
n th
e vo
l-at
ility
of s
tock
indi
ces.
Albe
r (20
20)
Chi
na, F
ranc
e, G
erm
any,
Italy,
Sp
ain,
USA
(Sto
ck M
arke
t) 01
/03/
2020
-10
/04/
2020
Pane
l Ana
lysis
It w
as fo
und
that
Cov
id-1
9 on
ly h
ad a
neg
ativ
e eff
ect o
n th
e sto
ck m
arke
t ret
urns
of C
hina
, Fra
nce,
Ger
man
y an
d Sp
ain.
Alqa
ralle
h et
al
(202
0)
US
(S&
P 50
0), C
anad
a (S
&P/
TSX
),U
K (F
TSE
100)
, Jap
an(N
225)
,H
ong
Kon
g(H
IS),
Chi
na (S
SE)
01/0
1/20
14-
08/0
4/20
20W
avel
et-C
opul
a G
ARC
H M
odel
Evid
ence
of s
trong
con
tagi
on h
as b
een
foun
d in
equ
ity m
ar-
kets
durin
g th
e C
ovid
-19
outb
reak
. Em
ergi
ng m
arke
ts su
ch
as C
hina
pro
vide
fer
tile
grou
nd f
or i
nter
natio
nal
dive
rsifi
-ca
tion.
Kılı
ç (2
020)
Turk
ey
(BIS
T S
ecto
r Ind
ices
)02
/01/
2018
-30
/04/
2020
Even
t Stu
dy
Met
hod
Neg
ativ
e ab
norm
al re
turn
s wer
e fo
und
in m
ost i
ndic
es. I
t is
state
d th
at th
e hi
ghes
t neg
ativ
e re
turn
s on
a se
ctor
bas
is ar
e in
the
tour
ism a
nd te
xtile
sect
ors,
whi
le th
e po
sitiv
e re
turn
s ar
e in
the
trad
e se
ctor
.
Estr
ada
et a
l (2
020)
US
(S&
P 50
0), T
aiw
an (T
WSE
), C
hina
(Sha
ngha
i St
ock
Exch
ange
), Ja
pan
(Nik
kei 2
25),
Ger
man
y (D
AX),
Hon
g K
ong
(Han
g Se
ng),
Uni
ted
Kin
gdom
(U
.K.)
(FT
SE),
Sout
h K
orea
(KR
X),
Sing
apor
e (S
GX
), an
d M
alay
sia (F
TSE
Bur
sa).
15/1
2/20
19-
15/0
3/20
20
Stoc
k M
arke
ts Si
mul
ator
(φ
-Sim
ulat
or)
For t
en m
ajor
stoc
k m
arke
t ana
lysis
, Cov
id-1
9 w
as p
redi
cted
to
cau
se si
mila
r dam
age
to th
e 19
29 C
risis.
(Ḡ =
0.2
3).
Kan
dil G
öker
et
al (
2020
)Tu
rkey
(The
Dat
a of
26
Sect
ors i
n BI
ST)
02/0
1/20
19-
09/0
4/20
20Ev
ent S
tudy
M
etho
d
Mos
t sec
tors
it w
as o
bser
ved
that
it o
btai
ned
nega
tive c
umu-
lativ
e ab
norm
al re
turn
s. H
ighe
st lo
ssIt
was
det
erm
ined
to b
e in
the
spor
ts, to
urism
and
tran
spor
-ta
tion
sect
ors.

PERSPECTIVES ON MODERN ECONOMY
Aizhan KHOICH, Ali Eren ALPER, Ahmet Arif EREN
205
Wri
ter(
s)-
Year
Cou
ntry
Peri
odM
etho
dC
oncl
usio
n
Lee
et a
l (2
020)
Mal
aysia
n (K
uala
Lum
pur C
ompo
site
Inde
x (K
LCI)
an
d 13
sect
oria
l ind
ices
)31
/12/
2019
-18
/04/
2020
Regr
essio
n An
alys
is
The
findi
ngs s
how
ed th
at h
ighe
r num
bers
of C
ovid
-19
case
s in
Mal
aysia
tend
ed to
adve
rsel
y aff
ect t
he p
erfo
rman
ce o
f the
K
LCI i
ndex
and
all
sect
oria
l ind
ices
, exc
ept f
or th
e Re
al E
s-ta
te In
vestm
ent F
und
(REI
T) i
ndex
.
Liu
et a
l (2
020)
Stoc
k In
dexe
s of 2
1 C
ount
ries
21/0
2/20
19-
18/0
3/20
20Ev
ent S
tudy
M
etho
d
It is
state
d th
at C
ovid
-19
affec
ts ex
chan
ges
nega
tivel
y in
all
coun
trie
s, w
hile
cou
ntrie
s in
Asia
exp
erie
nce
mor
e ne
gativ
e ab
norm
al re
turn
s com
pare
d to
oth
er c
ount
ries.
Baig
et a
l (2
020)
US
(S&
P 50
0)13
/01/
2020
-17
/04/
2020
OLS
regr
essio
nIn
crea
ses
in c
ases
and
dea
ths
due
to C
oron
aviru
s ca
used
a
signi
fican
t det
erio
ratio
n in
mar
ket l
iqui
dity
and
stab
ility
.
Şeno
l and
Ze
ren
(202
0)M
SCI I
ndic
es(W
orld
, Eur
opea
n, E
mer
ging
Mar
ket
and
G7)
21/0
1/20
20-
07/0
4/20
20Fo
urie
r C
oint
egra
tion
test
It is
dete
rmin
ed t
hat
ther
e is
a lo
ng t
erm
rel
atio
nshi
p be
-tw
een
stock
mar
kets
and
Cov
id-1
9 .
Paol
a an
d D
irks (
2020
)Eu
ro A
rea
(17
Cou
ntrie
s)01
/01/
2020
-17
/05/
2020
Pane
l Dat
a Re
gres
sion
Evid
ence
has
bee
n pr
esen
ted
that
mea
sure
s re
late
d to
Cov
-id
-19
have
a si
gnifi
cant
neg
ativ
e im
pact
on
the
exch
ange
s.
Zere
n an
d H
ızarc
ı (2
020)
Chi
na (S
SE),
Italy
(FT
SE M
IB),
Sout
h K
orea
(K
OSP
I), F
ranc
e (C
AC40
), G
erm
any
(DAX
30),
Spai
n (I
BEX
35)
23/0
1/20
20-
3/03
/202
0M
aki
Coi
nteg
ratio
n Te
st
It w
as d
eter
min
ed t
hat
Cov
id-1
9 ca
ses
have
coi
nteg
ratio
n re
latio
nshi
p w
ith S
SE,
KO
SPI
and
IBEX
35,
and
are
not
co-in
tegr
ated
with
FT
SE M
IB, C
AC40
, DAX
30.
Al-A
wad
hi e
t al
(202
0)C
hina
(HSI
and
SSE
Com
posit
e In
dex)
10/0
1/20
20-
16/0
3/20
20Pa
nel D
ata
Anal
ysis
It is
state
d th
at C
ovid
-19
has s
igni
fican
t neg
ativ
e eff
ects
on
stock
retu
rns i
n al
l com
pani
es.
Ashr
af (2
020)
Stoc
k M
arke
t Ret
urns
of 6
4 C
ount
ries
22/0
1/20
20-
17/0
4/20
20
Even
t Stu
dy
Met
hod
and
Pane
l D
ata
Regr
essio
n
Exch
ange
s wer
e fo
und
to h
ave
reac
ted
nega
tivel
y qu
ickl
y to
th
e gr
owth
in C
ovid
-19
appr
oved
cas
es.
Topc
u an
d G
ulal
(202
0)26
Em
ergi
ng S
tock
Mar
kets
10/0
3/20
20-
30/0
4/20
20
Ord
inar
y Le
ast
Squa
res (
OLS
) Re
gres
sion
Met
hod
The
high
est
effec
t of
Cov
id-1
9 w
as d
eter
min
ed o
n th
e em
ergi
ng s
tock
exc
hang
es in
Asia
and
the
low
est e
ffect
was
on
the
emer
ging
mar
kets
in E
urop
e. It
was
reve
aled
that
the
nega
tive
impa
ct o
f th
e pa
ndem
ic o
n em
ergi
ng e
xcha
nges
sta
rted
to d
ecre
ase
grad
ually
in m
id-A
pril.
Thak
ur
(202
0)U
S (S
&P
500)
23/0
1/20
20-
19/0
6/20
20
Vect
or
Auto
regr
essio
n (V
AR) m
odel
The
S&P
500
Inde
x ha
s sho
wn
nega
tive
reas
ons,
alon
g w
ith
an in
crea
se in
the
num
ber o
f new
cas
es.

206
IS COVID-19 THE NEW BLACK SWAN OF THE FINANCIAL MARKETS? ON THE LINKAGE BETWEEN COVID-19 AND STOCK MARKETS
Fatma MUMCU KÜÇÜKÇAYLI, Gönül YÜCE AKINCI
3. Dataset, Methodological Background and the Econometric Model
The main objective of this study is to examine the impacts of Covid-19 cases on the financial markets in 24 countries for the period between 01/16/2020 and 06/12/2020 with the five-day data set using the switching regression analy-ses. Closing prices of the each country’s stock exchange markets were taken as a proxy for the financial markets. This variable was used as the dependent variable of the analysis. On the other hand, Covid-19 variable was used as a regime-de-pendent regressor and the variable represents the number of people diagnosed with Covid-19. Four regime-independent regressors are used in the analysis as control variables. The first two of these variables are handled in order to determine the effects of Covid-19 on financial markets. In this context, the first variable was in-cluded in the analyses as the number of patients recovering from Covid-19, and the second variable was added as the number of people who died from Covid-19. On the other hand, the last two control variables, exchange rates in terms of US dollars and gold ons prices were used as macroeconomic control variables. The main reason for including these variables in the analysis is to examine the im-pact of macroeconomic variables during Covid-19 period on financial markets compared to normal periods without the epidemic. The datasets used in analy-ses are available in Digital Conversion Office of the Republic of Turkey, Invest-ing.com and Yahoo Finance.
In the study, the dynamic threshold model (switching regression) developed by Hansen (1999) for internal estimators and extended version of it by Kremer et al. (2013) is used. The model considered in the paper follows the cross-sec-tional threshold analysis of Caner and Hansen (2004) and Kremer et al. (2013) in which Generalized Method of Moments (GMM) estimation procedure is uti-lized to stand for endogeneity. In this context, a general form of dynamic panel threshold model can be defined as follows:
(1)
where represent the time, ity indicates the dependent variable, is based on the country-specific fixed effect and is the error term. The indica-tor function, , presents the regime behaviours represented by the threshold variable of itq . indicates the threshold level and itz consists of a set of inde-pendent variables that is based on m-dimensional vector. It is also possible that

PERSPECTIVES ON MODERN ECONOMY
Aizhan KHOICH, Ali Eren ALPER, Ahmet Arif EREN
207
the explanatory variables can contain lagged values of the dependent regressor (Kremer et al., 2013: 4).
The second step of the estimation process is to perform Two Stage Least Squares (2SLS) method to determine Covid-19 cases level. Following Caner and Hansen (2004: 818) and Kremer et al. (2013: 865), a reduced form of the regression for the independent variables of itz as a function of the instrumental variants of itx is estimated in the first phase. Then, the estimated values of independent varia-bles of ˆitz are substituted in the structural model for the independent variables of itz . In the second phase, by using predicted values of independent variables of ˆitz , the regression equation numbered (1) is estimated with the help of Ordinary Least Squares method for a fixed threshold level of . Let S ( ) define the sum of the squared residuals of least squares, this procedure is repeated until finding a suitable threshold value of that has the smallest sum of squared residuals. In other words, is called the threshold estimator that minimizes the sum of squared error terms (Hansen, 2000):
(2)
In order to determine the critical values for COVID-19 cases, the 95% confi-dence interval needs to be computed. Hansen (1999), Caner and Hansen (2004) and Kremer et al. (2013) suggest a constraint process which should be applied to find the optimal confidence values:
(3)
where, is the asymptotic distribution of the likelihood ratio and is the 95% percentile concerning the distribution process. When the optimal threshold value is determined, the slope coefficients can be predicted by applying GMM estimation process. In order to examine the impacts of Covid-19 cases on the vol-ume of stock exchange markets, the switching regression model which is based on the estimation of the generalized moments method is presented in equation (4).
(4)
In equation (4), the CVCit represents both Covid-19 threshold values and re-gime-dependent regressors for two different kinds of regime, VSME indicates the volume of stock exchange markets and itz refers to the vector of the control

208
IS COVID-19 THE NEW BLACK SWAN OF THE FINANCIAL MARKETS? ON THE LINKAGE BETWEEN COVID-19 AND STOCK MARKETS
Fatma MUMCU KÜÇÜKÇAYLI, Gönül YÜCE AKINCI
variables or else regime-independent regressors. and are the gradient coeffi-cients of regime, whereas shows regime intercepts.
According to Roodman (2009), the use of all the lagged values of dependent var-iable as the instrumental variable in switching regression analysis causes the es-timations to be both unbiased and consistent. For this reason, considering the study of Arellano and Bover (1995), all of the lagged values of dependent varia-ble are used in the model as instrumental variables.
4. Findings of the Analysis
The linkage between Covid-19 cases and volume of stock exchange markets is investigated by using switching regression analysis in the 24 countries through the period between 01/16/2020 and 06/12/2020 with the five-day data. For this purpose, the findings of the empirical analysis are presented in Table 2. The up-per panel of table indicates the predicted values of Covid-19 case thresholds and the 95% confidence bounds relating to the thresholds. Besides that, the middle panel exhibits the regime-dependent regressors of Covid-19 case levels. In other words, this panel shows the effects of Covid-19 cases on the volume of stock ex-change markets in the light of low and high case regimes. Finally, the lower panel of the table denotes the regime-independent regressors which represent the im-pact of control variables on the volume of stoke exchange markets.

PERSPECTIVES ON MODERN ECONOMY
Aizhan KHOICH, Ali Eren ALPER, Ahmet Arif EREN
209
Table 2. The Results of the Dynamic Threshold Model Analyses
Dependent Variable: Volume of Stock Exchange Markets
Estimated Value of COVID-19 Case Threshold and Confidence Intervals
Threshold Value 42.885***
95% Confidence Interval 38.195, 46.176
Regime-Dependent Regressors (Impact of COVID-19 Cases)
Low COVID-19 Case Regime 0.171* (1.742) [0.091]
High COVID-19 Case Regime -4.185*** (-2.983) [0.000]
Regime-Independent Regressors (Impact of Control Variables)
Constant 4.425*** (3.011) [0.000]
The Number of Patients Recovering from COVID-19
0.576* (1.912) [0.075]
The Number of Deaths from COVID-19 -5.951*** (-3.478) [0.000]
Exchange Rates*COVID-19 Period -6.407*** (-4.076) [0.000]
Gold Prices*COVID-19 Period -0.872*** (-2.691) [0.006]
Statistics of the Model
Optimum Model: Fixed Effects Model R2: 0.649
Cross-Section Effect: Yes F-Stat (Prob): 3.775*** [0.000]
Period Effect: Yes DW: 2.113
Number of Observations: 2568 Number of Cross-Sections: 24
Note: t-statistics are given in parentheses and probabilities are given in square brackets. *** and * indicates the 1% and 10% significance levels. 500 bootstrap replications are used to obtain the p-values to test for the number of thresholds.
The analysis results in Table 2 have shown that until the number of Covid-19 cases reaches 42,885 threshold case levels, the raise in the number of cases in-creases the stock market volume positively; however, it does not have strong ef-fect (0.171). However, beyond the threshold level of 42.885 Covid-19 case, it has been observed that an increase in the number of cases has negative (-4.185) and statistically strong effect on the stock market volume. This result reflects that within the time frame considered there is a quadratic relationship between Covid-19 cases and financial markets, in other words inverted U-shaped relation-ship between the related variables are valid. On the other hand, analysis findings

210
IS COVID-19 THE NEW BLACK SWAN OF THE FINANCIAL MARKETS? ON THE LINKAGE BETWEEN COVID-19 AND STOCK MARKETS
Fatma MUMCU KÜÇÜKÇAYLI, Gönül YÜCE AKINCI
reveal that the stock market volume raises (0.576) parallel to the increase in the number of patients recovering from Covid-19. Findings confirming this result show that the stock market volume decreases (-5.951) with the increasing num-ber of deaths from Covid-19. However, it should not be overlooked that the re-strictive effect of the increase in the number of deaths on the stock market vol-ume is much more dominant than the positive effect of the number of patients recovering on the stock market. In addition, it is observed that an increase in ex-change rates and gold prices during Covid-19 negatively affect the stock market volume (-6.407, -0.872, respectively).
5. Conclusions
The paper examines the impacts of Covid-19 cases on the financial markets in 24 countries for the period between 01/16/2020 and 06/12/2020 with the five-day data set using the switching regression analyses. The main reason for apply-ing this analysis method is that it enables to show the effects of Covid-19 cases on the volume of stock exchange markets in the light of low and high case regimes.
The findings of the analysis indicate that until the number of Covid-19 cases reaches the threshold level, an increase in the number of Covid-19 cases raises the stock market volume positively; however, beyond the threshold level Covid-19 case, it is seen that an increase in the number of cases has negative strong impact on the stock market volume. This findings point out that there is a quadratic nexus be-tween Covid-19 cases and financial markets, in other words inverted U-shaped relationship between the related variables are valid.
The basic condition for financial markets to avoid the negative impact of the pan-demic with the minimal losses depends on keeping the number of cases at a cer-tain threshold. In other words, it is observed that the number of cases that have not reached the threshold value does not have a negative impact on the financial markets, whereas it is adversely affected if the threshold value is exceeded. There-fore, it can be said that the black swan that drives the financial markets is ac-tually the number of cases that have a certain threshold value. It should not be overlooked that any measures that can limit the number of cases can reduce the volatilities in the stock markets. Beyond the threshold level, the economic agents can change their perceptions to real markets rather than financial markets in order to meet their daily needs, improve health conditions and strengthen prudential

PERSPECTIVES ON MODERN ECONOMY
Aizhan KHOICH, Ali Eren ALPER, Ahmet Arif EREN
211
conditions. As it is observed, in order that the pandemic does not have devastat-ing effects on the stock markets, governments should have to accelerate technical progress to improve health conditions, to boost R&D investments in health-care sector, to enable practices to encourage scientific progress in pandemic disease, to abolish the restrictions imposed on financial markets, to increase investment incentives that can direct domestic and foreign investors to financial markets, to take measures that will compensate for the losses of investors and to prepare de-velopment programs by taking whole economic sectors into account should be vital in the pandemic period.
References
Abodunrin, O., Oloye, G. and Adesola, B. (2020). Coronavirus Pandemic and Its Implication on Global Economy. International Journal of Arts, Languages and Business Studies, 4, 13-23.
Al-Awadhi, A. M., Alsaifi, K., Al-Awadhi, A. and Alhammadi, S. (2020). Death and Contagious Infectious Diseases: Impact of the COVID-19 Vi-rus on Stock Market Returns. Journal of Behavioral and Experimen-tal Finance, 27, 1-5.
Alber, N. (2020). The Effect of Coronavirus Spread on Stock Markets: The Case of the Worst 6 Countries, Available at SSRN: https://ssrn.com/abstract=3578080.
Alqaralleh, H., Canepa, A. and Chini, E.Z. (2020). Covıd-19 Pandemıc and Stock Market Contagıon: A Wavelet-Copula Garch Approach. Economics and Statistics “Cognetti de Martiis”. Working Paper Se-ries, https://www.researchgate.net/publication/342313419.
Antipova, T. (2020).Coronavirus Pandemic as Black Swan Event. Integrated Science in Digital Age 2020. ICIS 2020. Lecture Notes in Networks and Systems, Vol. 136, 356-366.
Arellano, M. & Bover, O. (1995). Another Look at the Instrumental Variables Estimation of Error-Components Models. Journal of Econometrics, 68(1), 29-51.
Ashraf, B.N. (2020). Stock markets’ reaction to COVID-19: Cases or fatali-ties? Research in International Business and Finance, 54, https://doi.org/10.1016/j.ribaf.2020.101249.

212
IS COVID-19 THE NEW BLACK SWAN OF THE FINANCIAL MARKETS? ON THE LINKAGE BETWEEN COVID-19 AND STOCK MARKETS
Fatma MUMCU KÜÇÜKÇAYLI, Gönül YÜCE AKINCI
Baig, A., Butt, H. A., Haroon, O. and Rizvi, S. A. R. (2020). Deaths, Pan-ic, Lockdowns and US Equity Markets: The Case of COVID-19 Pandemic. Available at SSRN: https://ssrn.com/abstract=3584947.
Baker, S.R., Bloom, N., Davis, S.J, Kost, K., Sammon,M. and Viratyosin, T. (2020). The Unprecedented Stock Market Reaction to COV-ID-19. Oxford Academic, The Review of Asset Pricing Studies, 1-23, https://doi.org/10.1093/rapstu/raaa008.
Caner, M. & Hansen, B. E. (2004). Instrumental Variable Estimation of a Threshold Model. Econometric Theory, 20, 813-843.
Chen, M.H., Jang, S.C. and Kim, W.G. (2007). The impact of the SARS outbreak on Taiwanese hotel stock performance: An event-study approach. International Journal of Hospitality Management, 26(1), 200-212.
Estrada, M. A. R., Koutronas, E. and Lee, M. (2020) Stagpression: The Eco-nomic and Financial Impact of COVID-19 Pandemic. Available at SSRN: https://ssrn.com/abstract=3593144.
Gunay, S. (2020). A New Form of Financial Contagion: COVID-19 and Stock Market Responses. Available at SSRN: https://ssrn.com/ab-stract=3584243.
Hansen, B. E. (1999). Threshold Effects in Non-Dynamic Panels: Estimation, Testing, and Inference. Journal of Econometrics, 93(2), 345-368.
Hansen, B. E. (2000). Sample Splitting and Threshold Estimation. Economet-rica, 68(3), 575-603.
Ichev, R. and Marinč, M. (2018). Stock prices and geographic proximity of in-formation: Evidence from the Ebola outbreak. International Review of Financial Analysis, 56, 153-166.
Kandil Göker, İ.E., Eren, B.S and Karaca, S.S. (2020). The Impact of the COV-ID-19 (Coronavirus) on the Borsa Istanbul Sector Index Returns: An Event Study. Gaziantep University Journal of Social Sciences, Special Issue, 14-41.
Kılıç, Y. (2020). The Effect of COVID-19 (Coronavirus) in Borsa Istanbul. Journal of Emerging Economies and Policy, 5(1), 66–77.

PERSPECTIVES ON MODERN ECONOMY
Aizhan KHOICH, Ali Eren ALPER, Ahmet Arif EREN
213
Kremer, S., Bick, A. & Nautz, D. (2013). Inflation and Growth: New Evidence from a Dynamic Panel Threshold Analysis. Empirical Economics, 44(2), 861-878.
Lee, K.Y-M., Jais, M. and Chan, C-W. (2020). Impact of Covıd-19: Evidence from Malaysian Stock Market. International Journal of Business and Society, Vol. 21(2), 607-628.
Liu, H.; Manzoor, A., Wang, C., Zhang, L., Manzoor, Z. (2020). The COV-ID-19 Outbreak and Affected Countries Stock Markets Response. International. Journal of Environmental Research and Public Health, 17(8), 1-19.
Morales, L. and Andreosso-O’Callaghan, B. (2020). Covid-19 - Global Stock Markets “Black Swan”. Critical Letters in Economics & Finance, 1, 1-14.
Nippani, S. and Washer, K.M. (2004). SARS: a non-event for affected coun-tries’ stock markets? Applied Financial Economics, 14 (15), 1105-1110.
Paola, D.O. and Dirks. MW. (2020). COVID-19 and Financial Markets: As-sessing the Impact of the Coronavirus on the Eurozone. Ruhr Eco-nomic Papers #859, http://dx.doi.org/10.4419/86788995.
Roodman, D. (2009). A Note on the Theme of too Many Instruments. Oxford Bulletin of Economics and Statistics, 71(1), 135-158.
Schumpeter, J. A. (1912). The Theory of Economic Development, Harvard University Press: Cambridge.
Şenol, Z. and Zeren, F. (2020). Coronavirus (Covıd-19) and Stock Markets: The Effects Of The Pandemic On The Global Economy. Eurasian Journal of Researches in Social and Economics, 7(4), 1-16.
Taleb, N. N. (2007). The Black Swan: The Impact of the Highly Improbable. USA, Random House.
Thakur, S. (2020). Effect of Covid 19 On Capital Market With Reference To S&P 500. Available at SSRN: https://ssrn.com/abstract=3640871.
Topcu, M. and Gulal, O.S. (2020). The Impact of COVID-19 On Emerging Stock Markets. Finance Research Letters, https://doi.org/10.1016/j.frl.2020.101691.

214
IS COVID-19 THE NEW BLACK SWAN OF THE FINANCIAL MARKETS? ON THE LINKAGE BETWEEN COVID-19 AND STOCK MARKETS
Fatma MUMCU KÜÇÜKÇAYLI, Gönül YÜCE AKINCI
Türkiye Sermaye Piyasası Raporu 2019, Finansal Piyasalar. (2020). https://www.tspb.org.tr/wpcontent/uploads/2020/07/TurkiyeSermayePi-yasasi2019r.pdf#page=16.
Worldometer, Covid-19 Coronavirus Pandemic. (Erişim: 30.07.2020), https://www.worldometers.info/coronavirus/.
www.bbc.com. Coronavirus: A visual guide to the economic impact. 30 June 2020. https://www.bbc.com/news/business-51706225.
Yahoo Finance Data. Yahoo Finance, New York, USA, https://finance.yahoo.com.
Zeren, F. and Hızarcı, A. E. (2020). The Impact of Covıd-19 Coronavirus on Stock Markets: Evidence From Selected Countries. Bulletin of Ac-counting and Finance Review, 3(1), 78- 84, DOI: 10.32951/mu-fider.706159.

215
13THE EFFECT OF ECONOMIC POLICY UNCERTAINTY ON PORTFOLIO INVESTMENT ASSETS AND LIABILITIESSevilay KUCUKSAKARYA1
Introduction
When the recent political events and their results are analyzed, it is observed that the high level of policy uncertainty can create adverse effcets on the economies. The studies related to economic policy uncertainty index (EPU) created by Baker et al. (2016) have significantly increased due to increase worldwide uncertainties. Not only such uncertainties cause households to worry, it also makes it difficult for businesses to plan. As a result of uncertainty, fluctuations occur in financial markets, and the country’s currency is damaged. For example, uncertainty regard-ing the fiscal policy can cause a long-term recession in the economy by delaying on investment and recruitment decisions. Studies imply that uncertainty shocks are an essential source of financial volatility (Baker et al., 2016; Phan et al., 2018, Li et al., 2018, Liu et al.,2017).
Economic policy uncertainty affects the economies through different channels. Empirical studies have revealed that economic policy uncertainty shocks are par-ticularly effective in financial markets. According to Bordo et al. (2016) and Zhang et al. (2019), economic policy uncertainty has a negative effect on banks’ loan growth. Nguyen et al. (2018) and Choudhry (2018) investigated the rela-tionship between economic policy uncertainty and housing prices. According to the authors, there is a long-term cointegration between economic policy uncer-tainty and house prices. Kang et al. (2017), Sun et al. (2018), Ji et al. (2018), Chen et al. (2019) emphasized that economic policy uncertainty increases asset and energy prices. These studies show the negative impact of economic policy
1 Assistant Prof., Department of Economics, FEAS, Anadolu University, Turkey, [email protected]

216
THE EFFECT OF ECONOMIC POLICY UNCERTAINTY ON PORTFOLIO INVESTMENT ASSETS AND LIABILITIES
Sevilay KUCUKSAKARYA
uncertainty on financial markets. However, little is known in the literature about the impact of uncertainty shocks caused by economic policy uncertainty on port-folio investment and international investment position of countries.
This article fills this gap and adds to the existing literature by analyzing the im-pact of economic policy uncertainty on portfolio investment assets and liabili-ties, using the panel causality test developed by Dumitrescu-Hurlin (2012) (D-H). Data covers annual data of the period 2005-2019 for 21 countries. For this purpose, firstly, the relevant literature was introduced, then the data and method used in the study, and the findings were explained, and lastly, the results of the study and policy recommendations were given.
Economic Policy Uncertainty Index and Economic Variables
Depending on the Baker et al.’s economic policy uncertainty index calculation, recent academic studies have increased regarding the effects of Economic Policy Uncertainty (EPU) on production and financial variables. Since 2008, economic policy uncertainty has averaged about twice the level of the previous 23 years. Baker et al. (2016) claimed a significant dynamic relationship that exists between economic policy uncertainty index and real macroeconomic variables. Authors found an increase in economic policy uncertainty as measured by their index fore-shadows a decline in economic growth and employment in the following months. In addition to this, according to results of their studies Gulen and Ion (2015), Baker et al. (2016) and Drobetz et al. (2018) stated that the high economic pol-icy uncertainty in the country lowered the investment. Karnizova and Li (2014) and Caggiano et al. (2017) implied the high economic policy uncertainty in the country reduced production. Pastor and Veronesi (2012), and Arouri et al. (2016) has observed that it decreases stock prices, while Choudhry (2018) found in his study it has a significant and negative effect on property prices in the country. Relative to the studies of Karnizova and Li (2014) and Caggiano et al. (2017) in periods when the economic policy uncertainty is higher, consumers and in-vestors tend to prefer a wait-and-see attitude instead of investing or consuming.

PERSPECTIVES ON MODERN ECONOMY
Aizhan KHOICH, Ali Eren ALPER, Ahmet Arif EREN
217
Figure 1. Global Economic Policy Uncertainty Index
Source: Scott Baker, Nicholas Bloom, Steven Davis, 2019, Th e extraordinary rise in trade policy uncertainty, https://voxeu.org/article/extraordinary-rise-trade-policy-uncertainty
Figure 1 highlights 20-years of the global economic policy uncertainty index measured by Baker et. al. (2019), computed as a GDP-weighted average of na-tional EPU indices for 21 countries that account for 80% of global output. Fig-ure 1 also reveals that economic uncertainty has been low during the 1990s but increased considerably after the 2001 recession. In contrast, a noticeable diver-gence exists for the period 2003 to 2007. High economic policy uncertainty is even more pronounced at the global level, with the global EPU index reaching several all-time highs since 2016. Based on the literature, the increase in eco-nomic policy uncertainty affects the financial market negatively through differ-ent channels. Higher economic policy uncertainty significantly reduces bank loan growth, with a stronger impact on larger and riskier banks (Bordo et al., 2016; Hu and Gong, 2018) And also it increases the returns of stocks significantly and this effect is stronger and permanent in periods of high volatility (Ko and Lee, 2015; Arouri et al., 2016).
Data and Methodology
This study uses a panel data which consist of 21 countries over the period 2005–2019. The sample includes following countries: Australia, Brazil, Canada, Chile, China, Colombia, France, Germany, Greece, India, Ireland, Italy, Japan, Mexico,

218
THE EFFECT OF ECONOMIC POLICY UNCERTAINTY ON PORTFOLIO INVESTMENT ASSETS AND LIABILITIES
Sevilay KUCUKSAKARYA
Netherlands, Russia, Singapore, Spain, Sweden, United Kingdom, United States. In the study, Country specific national economic policy uncertainty and two ver-sions of the GEPU Index - one based on current-price GDP measures, and one based on PPP-adjusted GDP2 are used. To measure policy-related economic un-certainty, writers construct an index from three types of underlying components that quantifies newspaper coverage of policy-related economic uncertainty; reflects the number of federal tax code provisions set to expire in future years and use dis-agreement among economic forecasters as a proxy for uncertainty.
International Portfolio investment assets and liabilities, which contains both debt securities an equity and investment fund shares are directly obtained from the World Development Indicators (World Bank). Table 1 presents variables and their data sources.
Table 1: Variables
National Economic Policy Uncertainty LEPU www.policyuncertainty.com
Global Economic Uncertainty based on current-price GDP measures
LGEPUC www.policyuncertainty.com
Global Economic Uncertainty based on PPP-adjusted GDP
LGEPU_PPP www.policyuncertainty.com
International Investment Position, Assets, Portfolio investment (US Dollar)
LTOTALASSET World Development Indicators
International Investment Position,Liabilities, Portfolio investment (US Dollar)
LTOTALLIAB World Development Indicators
In the study, to examine the effects of economic policy uncertainties on invest-ment liabilities and assets, by Dumitrescu-Hurlin (2012) the panel causality test is implemented. Prior to carrying out these tests, first the existence of cross-sec-tional dependence is investigated by Breusch-Pagan (1980) (Lagrange Multipli-er-LM) and Pesaran (2004) (Cross-section Dependence-CD) tests. After deter-mining the presence of cross-sectional dependence, D-H has been performed.
The D-H panel causality test is a simple adaptation of the Granger non-causal-ity test for constant coefficient non-homogeneous panel data models. It takes into account two dimensions of heterogeneity: the heterogeneity of the regres-sion model used to test Granger causality and the heterogeneity of causality
2 Time series of these indexes are extracted from www.policyuncertainty.com.

PERSPECTIVES ON MODERN ECONOMY
Aizhan KHOICH, Ali Eren ALPER, Ahmet Arif EREN
219
relationships. In order to do this test, the series must be stationary at the same level. This method takes into account the cross-sectional dependency between each country. One of the most important advantages of this test is that it can work regardless of whether there is a cointegration relationship between variables (Dumitrescu & Hurlin, 2012).
The D-H test can predict cross-section dependency and cross-section independ-ence situations. In normal panel Granger causality tests, when there is a causality relationship in only a subgroup of the sample due to the absence of cross-sectional information, that is, due to homogeneous null hypotheses, the null hypothesis ex-pressing the absence of the Granger causality relationship in cross sections is re-jected and the alternative hypothesis that this relationship exists for at least one cross section is accepted. In summary, in this test, despite the absence of the ho-mogeneous Granger causality relationship in the null hypothesis, the alternative hypothesis is tested that shows the existence of the relationship for at least one cross section (Dumitrescu & Hurlin, 2012).
The equation used for the D-H panel causality test considering the linear heter-ogeneous model is as follows:
, i=1,2,…,N : t=1,2,...,T
In the equation reflects individual effects and delay parameters; repre-sents the slope coefficients and K represents the lag length. In the model, it is as-sumed that the individual effects are constant, the lag and slope coefficients vary between units, and the lag length is the same in cross sections. For the D-H test, panel must be a balanced panel. The null and alternative hypotheses tested from the above equation are as follows:
The null hypothesis shows that all units have no Granger causality relationship be-tween variables, while the alternative hypothesis expresses the existence of Granger causality between variables in at least one unit. Individual residues are independent for each cross section unit. This test is normally distributed and allows. Although

220
THE EFFECT OF ECONOMIC POLICY UNCERTAINTY ON PORTFOLIO INVESTMENT ASSETS AND LIABILITIES
Sevilay KUCUKSAKARYA
the model used is heterogeneous, the null hypothesis makes us homogeneous; the alternative hypothesis leads to a heterogeneous result (Dumitrescu & Hur-lin, 2012). Table 1 displays the results of the D-H Panel Causality Tests between net investment assets position of countries and economic policy uncertainties 3.
Table 2: The Results of Pairwise Dumitrescu Hurlin Panel Causality Tests Between Assets and Economic Policy Uncertainties
Null Hypothesis: Test statistics
Null Hypothesis: Test statistics
Null Hypothesis: Test statistics
LTOTALASSET does not homogeneously cause LEPU
4.04957 (0.0000)
LTOTALASSET does not homogeneously cause LGEPU_PPP
4.96237(0.0035)
LTOTALASSET does not homogeneously cause LGEPUC
4.62375 (0.0128)
LEPU does not homogeneously cause LTOTALASSET
2.84717 (0.8184)
LGEPU_PPP does not homogeneously cause LTOTALASSET
4.15944(0.0577)
LGEPUC does not homogeneously cause LTOTALASSET
3.68838 (0.1938)
The results in Table 2 shows that there is unidirectional Granger causality run-ning from net investment assets position of countries (LTOTALASSET) to coun-try based economic policy uncertainties (LEPU). Similarly, the same causal re-lations are found between current price GDP measured global economic policy uncertainties. In other words, an increase in portfolio investments on assests in-dicates that the economy is performing well and might continue to perform well at least in the short run. On the other hand, there is bidirectional causal relations between PPP based global economic policy uncertainty and net investment as-sets position of countries. This should occurred because economic policy reflects also economic power of the country.
3 All test results show that there is cross section dependency. According to the results, the null hypothesis is rejected because it is meaningful. Therefore, there is a cross-sectional dependency for 21 countries. Economic and financial interactions, which are already accelerated by increasing globalization, increase this kind of cross-sectional dependency between economic policy uncertainty and external financial assets and liabilities among countries.

PERSPECTIVES ON MODERN ECONOMY
Aizhan KHOICH, Ali Eren ALPER, Ahmet Arif EREN
221
Table 3: The Results of Pairwise Dumitrescu Hurlin Panel Causality Tests Between Liabilities and Economic Policy Uncertainties
Null Hypothesis: Test statistics
Null Hypothesis: Test statistics
Null Hypothesis: Test statistics
LTOTALLIAB does not homogeneously cause LEPU
3.67883 (0.1980)
LTOTALLIAB does not homogeneously cause LGEPU_PPP
2.65544 (0.9886)
LTOTALLIAB does not homogeneously cause LGEPUC
2.6363 (0.9692)
LEPU does not homogeneously cause LTOTALLIAB
6.29181 (0.0000)
LGEPU_PPP does not homogeneously cause LTOTALLIAB
6.50748 (0.0000)
LGEPUC does not homogeneously cause LTOTALLIAB
6.7843 (0.0000)
Table 3 shows the results of D-H Panel Causality Tests between net investment liabilities position of countries and economic policy uncertainties. Test results in table shows that there are unidirectional causalities running from economic pol-icy uncertainties to liabilities. This result highlight the vulnerability of the liabil-ities to economic policy uncertainities.
Conclusion
In this study, the relationship between economic policy uncertainties (-both global and national) and portfolio investment assets and liabilities for 21 countries was analyzed using the D-H panel causality test during 2005 and 2019. The cross-sec-tional dependency between countries indicates that there are close economic and financial relations among the countries in the sample and that economic shocks arising from policy uncertainties are likely to spread between these countries.
Investing in short-term securities, particularly portfolio flows, including debt se-curities, equities and liabilities, is fully affected by both national and global eco-nomic policy uncertainties. As a result of this situation, it can be observed that investors use such information to make investment decisions across the coun-tries. In times of high economic policy uncertainty, investors do not want to in-vest in debt securities, especially the sample countries. If economic policy uncer-tainties indicated a country is not eligible in nature or inherently problematic in terms of the economic outcomes, the investors show less willingness to invest money into that countries’ equities, liabilities or debt securities. This highlights

222
THE EFFECT OF ECONOMIC POLICY UNCERTAINTY ON PORTFOLIO INVESTMENT ASSETS AND LIABILITIES
Sevilay KUCUKSAKARYA
the importance of early government actions and interventions to support the fi-nancial sector in case of an economic policy uncertainy.
References
Arouri, M., Estay, C., Rault, C., Roubaud, D., 2016. Economic policy uncer-tainty and stock markets: long-run evidence from the US. Financ. Res. Lett.18, 136–141.https://doi.org/10.1016/j.frl.2016.04.011.
Baker S.R, N. Bloom, S.J. Davis 2016, Measuring economic policy uncertainty, Q. J. Econ., 131 (4) (2016), pp. 1593-1636
https://doi.org/10.1093/qje/qjw024
Baker, S., Bloom, N., Davis, S., 2019, The extraordinary rise in trade policy uncertainty, https://voxeu.org/article/extraordinary-rise-trade-pol-icy-uncertainty
Bloom,N., 2009, The impact of uncertainty shocks. Econometri-ca77(3),623–685.
Bordo M.D., J.V. Duca, C. Koch, 2016, Economic policy uncertainty and the credit channel: aggregate and bank level US evidence over several decades, J. Financial Stab., 26 (2016), pp. 90-106
https://doi.org/10.1016/j.jfs.2016.07.002
Caggiano , G., Castelnuovo, E., Figueres, J.M., 2017. Economic policy un-certainty and unemployment in the United States: a nonlinear approach. Econ. Lett. 151, 31–34.https://doi.org/10.1016/j.econ-let.2016.12.002.
Chen X., X. Sun, J. Li, 2019, How does economic policy uncertainty react to oil price shocks? A multi-scale perspective Appl. Econ. Lett., pp. 1-6
https://doi.org/10.1080/13504851.2019.1610704
Choudhry T., 2018, Economic policy uncertainty and house prices: evidence from geographical regions of England and Wales, Real Estate Econ.
https://doi.org/10.1111/1540-6229.12266
Drobetz, W., El Ghoul, S., Guedhami, O., Janzen, M., 2018. Policy uncertain-ty, investment, and the cost of capital. J. Financ. Stab. 39, 28–45.https://doi.org/10.1016/j.jfs.2018.08.005.

PERSPECTIVES ON MODERN ECONOMY
Aizhan KHOICH, Ali Eren ALPER, Ahmet Arif EREN
223
Dumitrescu, E. I., Hurlin, C., 2012, Testing For Granger Non-Causality In Heterogeneous Panels. Economic Modelling, 29 (4): 1450-1460.
Gulen, H., Ion, M., 2015. Policy uncertainty and corporate investment. Rev. Financ. Stud. 29 (3), 523–564.
Hu, S., Gong, D., 2018. Economic policy uncertainty, prudential regulation and bank lending. Financ. Res. Lett.https://doi.org/10.1016/j.frl.2018.09.004
Ji Q., B.Y. Liu, H. Nehler, G.S. Uddin, 2018, Uncertainties and extreme risk spillover in the energy markets: a time-varying copula-based Co-VaR approach, Energy Econ., 76, pp. 115-126
https://Doi.org/10.1016/j.eneco.2018.10.010
Kang W., F.P. de Gracia, R.A. Ratti, 2017, Oil price shocks, policy uncertainty, and stock returns of oil and gas corporations, J. Int. Money Fi-nance, 70, pp. 344-359
https://doi.org/10.1016/j.jimonfin.2016.10.003
Karnizova , L., Li, J., 2014. Economic policy uncertainty,financial markets and probability of US recessions. Econ. Lett. 125 (2), 261–265.https://doi.org/10.1016/j.econlet.2014.09.018.
Li, Z.H., H. Dong, Z.H. Huang, P. Failler, 2018, Asymmetric effects on risks of virtual financial assets (VFAs) in different regimes: a case of bitcoin Quant. Finance Econ., 2 (4) , pp. 860-883
https://doi.org/10.3934/QFE.2018.4.860
Liu, L.X., H. Shu, K.J. Wei, 2017, The impacts of political uncertainty on asset prices: evidence from the Bo scandal in China, J. Financial Econ., 125 (2), pp. 286-310
https://doi.org/10.1016/j.jfineco.2017.05.011
Nguyen Thanh B., J. Strobel, G. Lee, 2018, A new measure of real estate uncer-tainty shocks, Real Estate Econ.
https://doi.org/10.1111/1540-6229.12270.
Pastor, L., Veronesi, P., 2012. Uncertainty about government policy and stock prices. J. Financ. 67 (4), 1219–1264.Pesaran, M.H., 2004. Gen-eral Diagnostic Tests for Cross Section Dependence in Panels.Pe-

224
THE EFFECT OF ECONOMIC POLICY UNCERTAINTY ON PORTFOLIO INVESTMENT ASSETS AND LIABILITIES
Sevilay KUCUKSAKARYA
saran, M.H., 2007. A simple panel unit root test in the presence of cross-section dependence. J. Appl. Econom. 22 (2), 265–312.
Pesaran, M. H., 2004, General Diagnostic Tests For Cross Section Dependence In Panels, Cambridge Working Papers İn Economics, Wp/0435.
Breusch, T. & Pagan, A. (1980), The Lagrange Multiplier Test and Its Applica-tions To Model Specification In Econometrics, Review of Econom-ic Studies, 47 (1), 239-253.
Phan D.H.B., S.S. Sharma, V.T. Tran, 2018, Can economic policy uncertainty predict stock returns? Global evidence J. Int. Financial Mark. Inst. Money, 55 (2018), pp. 134-150
https://doi.org/10.1016/j.intfin.2018.04.004
Sun X., X. Chen, J. Wang, J. Li, 2018, Multi-scale interactions between eco-nomic policy uncertainty and oil prices in time-frequency do-mains, North Am. J. Econ. Finance
https://doi.org/10.1016/j.najef.2018.10.002
Zhang D., L. Lei, Q. Ji, A.M. Kutan, 2019, Economic policy uncertainty in the US and China and their impact on the global markets, Econ. Model., 79, pp. 47-56
https://doi.org/10.1016/j.econmod.2018.09.028

225
14FINANCIAL LITERACY AND DIGITAL COMPETENCE COULD PREDICT FINANCIAL RISK TOLERANCE: A RESEARCH STUDY IN TURKEYÇağrı HAMURCU1
Abstract
The objectives of this study are to find out whether there are any relationships between financial risk tolerance, financial literacy, and digital competence or not and how financial risk tolerance could be predicted by financial literacy, digital competence, and demographical factors. To measure financial risk tolerance, fi-nancial literacy and digital competence, Grable and Lytton Financial Risk Toler-ance Scale, basic financial literacy questions and a newly developed digital compe-tence scale are used respectively. Results indicate that there are positive correlations between financial risk tolerance, financial literacy, and digital competence. The highest correlation is found between financial risk tolerance and financial liter-acy. A new digital competence scale structured with three factors (digital compe-tence factors 1, 2, and 3) is developed. Moreover, it is founded that gender and marital status are affecting factors for financial risk tolerance separately. The fi-nancial risk tolerance of men is greater than women and married ones are greater than single ones. Furthermore, as a result of multiple regression analysis, it is ob-tained that financial risk tolerance could be predicted by financial literacy, mar-ital status and digital competence factor 1. The importance of this work lies in its different perspectives for financial risk tolerance with the effects of financial literacy and digital competence on it. The finding mechanism could be used to strengthen financial sustainability.
1 Assist. Prof., Aksaray University, Ortakoy Vocational School of Higher Education, Department of Finance, Banking&Insurance, Aksaray, Turkey, e-mail: [email protected]

226
FINANCIAL LITERACY AND DIGITAL COMPETENCE COULD PREDICT FINANCIAL RISK TOLERANCE: A RESEARCH STUDY IN TURKEY
Çağrı HAMURCU
Jel Codes: D90, D91, G40, G41.
Keywords: Behavioral Finance, Financial Risk Tolerance, Financial Literacy, Dig-ital Competence, Financial Sustainability
Introduction
Financial risk tolerance is defined as the measure of risk believed and accepted and the attitude towards the risk (Sulaiman, 2012). In other words, financial risk tolerance is the eagerness of people to decide on financial issues under maximum uncertainty (Prabhakaran & Karthika, 2011). In the case of risk, the main point is how the risk is perceived rather than rationality. In this case, cognitive, emo-tional and demographic factors come into prominence. Evaluating the amount of risk, expected and realized results are becoming important factors.
In order to understand the basis of individuals’ financial risk tolerances, lots of studies were focused on the effect of demographic characteristics such as age, in-come, gender, marital status and level of education. Even though the existent studies focused especially on demographic factors, it is not sufficiently and com-promised knowledge about how an individual’s financial literacy and capability of using the latest technology or digital competence affects financial risk toler-ance attitudes. It is stated that an individual in a digital financial environment should be digitally competent and financially literate (Salman & Saleem, 2017).
The first objective of this study is to find out whether there are any relationships between financial risk tolerance, financial literacy, and digital competence or not. The second aim is to reveal how financial risk tolerance could be predicted by fi-nancial literacy, digital competence, and demographical factors. In this study, the effects of gender, marital status, and age on financial risk tolerance are researched as demographical factors. In order to reduce the effects of other demographic fac-tors, increase the clearance of the findings, level of education and income of the participants are kept constant.
Using and understanding financial information more appropriately and correctly is described as financial literacy (Huston, 2010). In order to ensure the financial sustainability of individuals, families, enterprises, and economies, it is known that financial literacy is one of the important abilities a person has (Swiecka, Yeşildağ, Özen,& Grima, 2020). In literature, it is founded that financial risk tolerance is

PERSPECTIVES ON MODERN ECONOMY
Aizhan KHOICH, Ali Eren ALPER, Ahmet Arif EREN
227
related to financial literacy positively (Grable, 2000; Grable & Joo, 2000; Gra-ble & Joo, 1999; Grable & Lytton, 1999; Riley & Russon, 1995). On the other hand, Yip (2000) reached a result that there is no relation between financial risk tolerance and financial literacy. Financial risk tolerance and financial literacy re-lation are evaluated in this research.
Moreover, to reveal the relation between digital competence and financial liter-acy, this relation is also researched in this study.
Recent developments in technology have led to significant changes in life. The capability of using the latest technology has received much attention, especially over the last decades. The next decade is likely to witness a considerable rise in digital technologies. To participate in nowadays society, some competencies re-lated to digital technologies are required. This set of competencies related to dig-ital technologies is Digital Competencies. As a result of this project, under five main digital competence areas, 21 digital competencies are defined (Ala-Mutka, 2011; Ferrari, 2013) (see Table 1). A new digital competence scale is developed according to the above stated digital competences. In this table, abbreviations are defined for each main competence and sub-competencies below.
Table 1 Digital Competencies
1. Information and data literacy (IDL)1.1 Browsing, searching and filtering information (IDL1)1.2 Evaluating Information (IDL2)1.3 Storing and retrieving information
4. Safety (S)4.1 Protecting devices (S1)4.2 Protecting personal (S2)4.3 Protecting health (S2)4.4 Protecting the environment (S3)
2. Communication and collaboration (CC)2.1 Interacting through technologies (CC1)2.2 Sharing information and content (CC2)2.3 Engaging in online citizenship (CC3)2.4 Collaborating through digital channels (CC4) 2.5 Netiquette (CC5)2.6 Managing digital identity (CC6)3. Digital content creation (DCC)3.1 Developing content (DCC1)3.2 Integrating and re-elaborating (DCC2)3.3 Copyright and Licenses (DCC3)3.4 Programming (DCC4)
5. Problem-solving (PS)5.1 Solving technical problems (PS1)5.2 Identifying needs and technological responses (PS2)5.3 Innovating and creatively using technology (PS3)5.4 Identifying digital competence gaps (PS4)

228
FINANCIAL LITERACY AND DIGITAL COMPETENCE COULD PREDICT FINANCIAL RISK TOLERANCE: A RESEARCH STUDY IN TURKEY
Çağrı HAMURCU
In order to investigate the interaction between financial risk tolerance, digital competence, and financial literacy, these hypotheses are developed: Hypothesis 1: “Financial risk tolerance is positively related to financial literacy”, H2: “Finan-cial risk tolerance is positively related to digital competence.”, H3: “Financial lit-eracy is positively related to digital competence”.
Material and Methods
This qualitative study is performed to 117 volunteers working in Ankara, Tur-key (May 2018-January 2019), has a university degree and has approximately the same amount of individual income. In the scheduled meetings, each partic-ipant is explained the research and how they can answer the questions. Then a web version of the form linked to email is sent privately. The privately completed forms by participants were then submitted back. Totally 135 participants were attended to meetings and 117 of these 135 participants are completed the form.
In the first phase, all explanations and statements defining every 21 digital com-petencies in Dig Comp 2.1 (Carretero, Vuorikari, & Punie, 2017) with 8 profi-ciency levels are translated into Turkish. The scale is prepared with the controls of relevant experts and researchers. In the second phase, the first version of this scale is implemented on randomly selected volunteers (N=20) working in An-kara, Turkey. In the scheduled meeting, each participant is explained the research, Digital Competence, DigComp 2.1, examples of use for each competence (Car-retero et al., 2017) and how they can answer the scale. Then a web version of the scale linked to email is sent. The privately completed scales by participants are then submitted back. Then, the first reliability analysis is performed on the data of the pilot test group (𝛼= .981).
In the third phase, the scale is implemented with the same method explained in phase two on the sample group (N=117) working in Ankara. Then, the second reliability analysis is performed on the data of the sample group. In the fourth phase, an explanatory factor analysis study is performed in order to determine whether the 21 statements in this scale has sufficient validity (𝛼 = .978).
In this study, to measure financial risk tolerance, digital competence, and finan-cial literacy; Grable and Lytton Financial Risk Tolerance Scale (Grable, & Lytton, 1999; Grable, Lytton, & O’Neill, 2004), the newly developed digital competence scale according to Dig Comp Ver 2.1 (Carretero et al., 2017) and basic finan-cial literacy questions (Lusardi, & Mitchell, 2007; Van Rooij, Lusardi, & Alessie,

PERSPECTIVES ON MODERN ECONOMY
Aizhan KHOICH, Ali Eren ALPER, Ahmet Arif EREN
229
2011) are used respectively. The scores of financial risk tolerance scale range from 13 to 47, high scores define increased financial risk tolerance. The newly devel-oped digital competence scale is composed of 21 items and each item is answered from 1 to 8 according to an individual’s proficiency level. This basic financial lit-eracy question set is composed of 5 questions in order to explore an individual’s numerical skills and to understand an individual’s knowledge about some basic financial terms such as compound interest, inflation, time value of money and income-price relation. If an individual gives a correct answer to any one of the basic financial literacy questions, 1 point is obtained. As a result, the total score of the basic financial literacy questions ranges from 0 to 5 for each individual.
All analyses are performed by SPSS Ver.20.
Results
In the first part of this section, the demographic distribution of the participants is given in Table 2.
Table 2. Demographic Distribution
Gender 45.3% (F, n=53) 54.7% (M, n=64)
Marital Status
65.8% (Married, n=77)
34.2% (Single, n=40)
Age 15.4% (30-, n=18) 48.7% (30-39, n=57) 19.7% (40-49, n=23)
16.2% (49+, n=19)
Note: F=Female; M=Male; n=number.
In this study, the level of education and income of the participants is kept constant.
To measure digital competence, a digital competence scale is developed. In order to evaluate the factors of this scale, explanatory factor analysis is performed. At the beginning of the factor analysis, it is evaluated that The Kaiser-Meyer-Olkin (KMO) value is 0.874 and the Bartlett sphericity test (df=210, Sig.=0.000) and these values show that this scale is suitable for factor analysis. At the end of suc-cessive calculations with promax with kaiser normalization as a rotation method, 14 components have remained and these components are distributed into 3 main factors (see Table 3). The total variance explained is 0.869. The same factor struc-ture with different loadings is evaluated when the varimax with Kaiser normali-zation is selected as a rotation method.
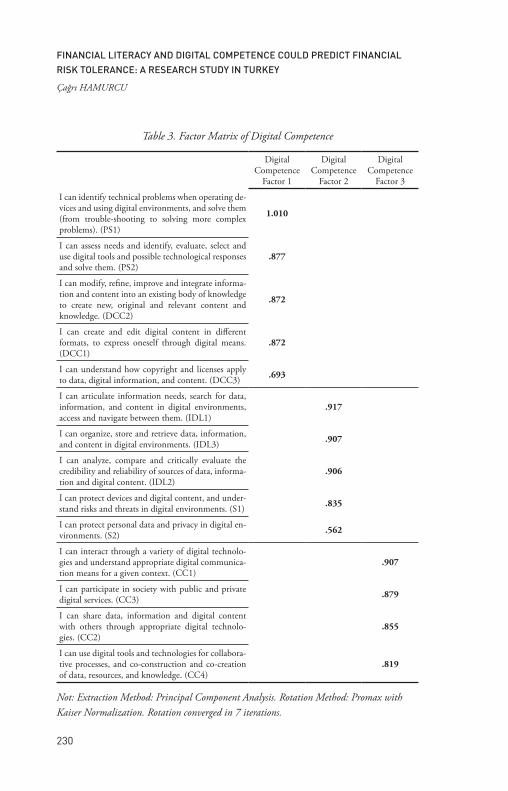
230
FINANCIAL LITERACY AND DIGITAL COMPETENCE COULD PREDICT FINANCIAL RISK TOLERANCE: A RESEARCH STUDY IN TURKEY
Çağrı HAMURCU
Table 3. Factor Matrix of Digital Competence
Digital Competence
Factor 1
Digital Competence
Factor 2
Digital Competence
Factor 3
I can identify technical problems when operating de-vices and using digital environments, and solve them (from trouble-shooting to solving more complex problems). (PS1)
1.010
I can assess needs and identify, evaluate, select and use digital tools and possible technological responses and solve them. (PS2)
.877
I can modify, refine, improve and integrate informa-tion and content into an existing body of knowledge to create new, original and relevant content and knowledge. (DCC2)
.872
I can create and edit digital content in different formats, to express oneself through digital means. (DCC1)
.872
I can understand how copyright and licenses apply to data, digital information, and content. (DCC3) .693
I can articulate information needs, search for data, information, and content in digital environments, access and navigate between them. (IDL1)
.917
I can organize, store and retrieve data, information, and content in digital environments. (IDL3) .907
I can analyze, compare and critically evaluate the credibility and reliability of sources of data, informa-tion and digital content. (IDL2)
.906
I can protect devices and digital content, and under-stand risks and threats in digital environments. (S1) .835
I can protect personal data and privacy in digital en-vironments. (S2) .562
I can interact through a variety of digital technolo-gies and understand appropriate digital communica-tion means for a given context. (CC1)
.907
I can participate in society with public and private digital services. (CC3) .879
I can share data, information and digital content with others through appropriate digital technolo-gies. (CC2)
.855
I can use digital tools and technologies for collabora-tive processes, and co-construction and co-creation of data, resources, and knowledge. (CC4)
.819
Not: Extraction Method: Principal Component Analysis. Rotation Method: Promax with Kaiser Normalization. Rotation converged in 7 iterations.

PERSPECTIVES ON MODERN ECONOMY
Aizhan KHOICH, Ali Eren ALPER, Ahmet Arif EREN
231
The Cronbach’s alpha values of Factor 1 is 𝛼 = .962, Factor 2 is 𝛼 = .952, Fac-tor 3 is 𝛼 = .940 and Total (14 Items) is 𝛼 = .967. In this newly developed scale, scores are ranged for factor 1 and factor 2 from 5 to 40, for factor 3 from 4 to 32, for total 14 items from 14 to 112.
Digital competence factor 1 composed of the items represent problem-solving 1,2 (PS1, and PS2) and digital content creation 1,2, and 3 (DCC1, DCC2, and DCC3). Information and data literacy 1,2,3 (IDL1, IDL2, and IDL3) and safety items are included digital competence factor 2. The third digital competence fac-tor (factor 3) is the sum of all four items in the communication and collabora-tion category (CC1, CC2, CC3, and CC4).
In order to find whether there are any relationships between financial risk toler-ance, digital competence, and financial literacy or not and to reveal the direction and severity of these relationships, first of all, correlation analysis is applied. Ta-bles 4 is the outputs of this analysis.
Table 4. Correlation Analysis of Financial Risk Tolerance - Financial Literacy - Digital Competence
Mean SD Financial Risk
Tolerance
FinancialLiteracy
DC Factor 1
DC Factor 2
DC Factor 3
DCScale
(Factor 1,2, 3)
Pearson Correlation
Financial Risk Tolerance 27.22 5.08 0.464** 0.255** 0.213* 0.155 0.232*
Financial Literacy 2.69 1.65 0.464** 0.223* 0.206* 0.221* 0.239**
DC Factor 1 15.09 8.49 0.255** 0.223* 0.731** 0.738** 0.913**
DC Factor 2 18.40 8.44 0.213* 0.206* 0.731** 0.727** 0.909**
DC Factor 3 13.87 7.34 0.155 0.221* 0.738** 0.727** 0.897**
DC Scale (factor 1, 2, 3) 47.37 22.00 0.232* 0.239** 0.913** 0.909** 0.897**
Note: SD = standard deviation. DC= Digital Competence. * Correlation is significant at the 0.05 level (2-tailed). ** Correlation is significant at the 0.01 level (2-tailed).
According to table 4, financial risk tolerance is positively correlated to financial literacy, digital competence factor 1, digital competence factor 2 and digital com-petence scale (factors 1, 2 and 3) separately (except Digital Competence Factor

232
FINANCIAL LITERACY AND DIGITAL COMPETENCE COULD PREDICT FINANCIAL RISK TOLERANCE: A RESEARCH STUDY IN TURKEY
Çağrı HAMURCU
3, p>0.05). In these relations, the highest correlation factor is found between fi-nancial risk tolerance and financial literacy (0.464).
In addition to that, relations of financial literacy with digital competence factor 1, digital competence factor 2 and digital competence factor 3 and digital com-petence scale (factors 1, 2 and 3) are significantly positive (p<0.05) (see table 4).
Moreover, as it is expected, there are positive correlations between all three factors of digital competences and digital competence scale (factor 1, 2 and 3). These correlations are at a very high level (between 0.727 and 0.909).
Based on the results obtained above, regression analyses are performed to esti-mate the dependent variable according to independent variables. In these analy-ses, gender, marital status, and age are included.
One-Way Anova and Kruskal-Wallis tests are also applied in order to find the re-lation between financial risk tolerance, financial literacy, digital competence and demographic factors (gender, marital status, and age). It is found statically mean-ingful relationships between financial risk tolerance&gender, financial risk toler-ance&marital status and financial literacy&gender (Sig. values are 0.014, 0.007 and 0.010 respectively). The result shows us that men (mean value is 28.27) have a greater financial risk tolerance than women (mean value is 25.96). In addition to that, the married ones (mean value is 28.13) has a greater financial risk toler-ance than the single ones (mean value is 25.48). It is also found that the finan-cial literacy values of men (mean value is 3.05) are higher than women (mean value is 2.26). Moreover, it is not found any significant relationship between fi-nancial risk tolerance, financial literacy, digital competence, and remaining de-mographic factors.
In order to predict financial risk tolerance, different regression models are devel-oped between independent factors. In all models, financial risk tolerance is cho-sen as a dependent factor. These regression models show that, when financial lit-eracy, marital status and digital competence factor 1 are added to the regression model hierarchically, the highest prediction ratio (R square = 0.3014) is achieved as a predictor of financial risk tolerance (see Table 5).
In model 1, only Financial Literacy is chosen as an independent factor, in model 2 Marital Status is added to model 1. In model 3, digital competence factor 1 is added to model 2. According to the regression analysis results, statistically

PERSPECTIVES ON MODERN ECONOMY
Aizhan KHOICH, Ali Eren ALPER, Ahmet Arif EREN
233
significant regressions are founded in all three models. As a result of hierarchi-cal regressions, Model 3 is achieved. In model 3, it is founded that financial risk tolerance is predicted by Financial Literacy, Marital Status and Digital Compe-tence Factor 1. The prediction formula of financial risk tolerance is given below.
Financial Risk Tolerance = 25.764 + 1.313xFinancial Literacy + 2.655xMarital Status + 0.098xDigital Competence Factor 1.
R Square value indicates that 30.14% of the variation in financial risk tolerance can be explained by model 3 containing Financial Literacy, Marital Status and Digital Competence Factor 1.
Table 5. Financial Risk Tolerance, Digital Competence, and Financial Literacy Regression Analysis
Independent Variable(s) B SE B β t p R R
SquareAdjusted R Square
Model 1
Constant 23.367 0.803 29.093 0.0000.464a 0.216 0.209Financial
Literacy 1.432 0.255 0.464 5.622 0.000
Model 2
Constant 26.894 1.384 19.437 0.000
0.525 b 0.276 0.263Financial Literacy 1.426 0.246 0.462 5.801 0.000
Marital Status 2.617 0.850 0.245 3.078 0.003
Model 3
Constant 25.764 1.473 17.487 0.000
0.549 c 0.301 0.283
Financial Literacy 1.313 0.249 0.426 5.277 0.000
Marital Status 2.655 0.839 0.249 3.164 0.002
Digital Competence Factor 1
0.098 0.048 0.164 2.037 0.044
Note: Dependent Variable= Financial Risk Tolerance; B=the unstandardized beta; SE B=the standard error for the unstandardized beta; β=the standardized beta, t=the t test statistic; p=the probability value; * Significant at the 0.05 level (2-tailed); ** Significant at the 0.01 level (2-tailed). (marital stasus = 1, for married; 0 = single. a=Predictors: (Constant), Financial Literacy. b=Predictors: (Constant), Financial Literacy, Marital Status. c=Predictors: (Constant), Financial Literacy, Marital Status, Digital Competence Factor 1.

234
FINANCIAL LITERACY AND DIGITAL COMPETENCE COULD PREDICT FINANCIAL RISK TOLERANCE: A RESEARCH STUDY IN TURKEY
Çağrı HAMURCU
To reveal the value of a variation in financial risk tolerance explained by digital competence factor 1, another regression analysis is applied. As a result of this anal-ysis, the R square value is found as 0.0499. It could be said this value can only explain 4.99% of the variation in financial risk tolerance by digital competence factor 1. 95.01% of financial risk tolerance can not be explained by digital com-petence factor 1. There must be other factors affecting financial literacy except for digital competence. This is consistent with the result of correlation analysis.
Discussion and Implications
The results demonstrate seven findings.
First of all, financial literacy is a determinant factor for financial risk tolerance and financial risk tolerance is increasing with financial literacy. There is a posi-tive correlation between financial risk tolerance and financial literacy. This result verifies Hypothesis 1 “Financial risk tolerance is positively related to financial lit-eracy”. Some researchers in literature found financial risk tolerance is positively related to financial literacy (Grable, 2000; Grable & Joo, 2000; Grable & Joo, 1999; Grable & Lytton, 1999; Riley & Russon, 1995) are consistent with our findings. On the other hand, the result of Yip (2007) that there is no relation be-tween financial risk tolerance and financial literacy does not support our findings.
Secondly, it is proven in our study that financial risk tolerance is related to digital competence. This finding verifies Hypothesis 2 “Financial risk tolerance is posi-tively related to digital competence”. It could be inferred that the level of digital competence could be a related factor for financial risk tolerance. From a different viewpoint, it could be said that digital competence creates an increase in people’s confidence (Ala-Mutka, 2011; Ferrari, 2012) or people’s confidence could pro-duce digital competence (Hatlevik, Ottestad, & Throndsen, 2015). This confi-dence could be the reason for ascending financial risk tolerance. The relation be-tween the readiness to use digital financial services and risk tolerance is founded positively in the study of Königsheim, Lukas & Nöth (2017). It could be inter-preted that this finding is compatible with ours.
Thirdly, it is also found that there are positive relations between digital compe-tences and financial literacy. This is proof of Hypothesis 3 “Financial literacy is positively related to digital competence”. It could be concluded from these find-ings that; digital competency could ease to be financially literate on a limited

PERSPECTIVES ON MODERN ECONOMY
Aizhan KHOICH, Ali Eren ALPER, Ahmet Arif EREN
235
scale. It is expected that digital competent people could reach information more easily and the correct way. From a financial point of view, this result could be commented that digital competence could create opportunities to increase finan-cial literacy. Because of the above-stated reasons, financial literacy could be in-terpreted as related to digital competence. The projection of digital competence on financial matters could be taken into account within the scope of financial literacy. In the study of Königsheim, Lukas & Nöth (2017), it is stated that the likelihood of using digital financial services is positively correlated with financial knowledge. As put forward by Rozkrut&Rozkrut (2019), e-finance solutions for financial consumers require digital competence. These findings could be inter-preted in favor of our findings.
Fourthly, a new digital competence scale structured with three digital competence factors (digital competence factor1, 2, and 3) is obtained. It is important to high-light the fact that; this study could be assumed one of the few studies focused on developing a scale one to one correspondence of DigComp 2.1. Previous studies on developing a scale on digital competence by Akkoyunlu, Soylu, and Çağlar (2010) and by Kuzminska, Mazorchuk, Morze, Pavlenko, and Prokhorov (2018) cannot be considered as conclusive. Although the first previous study is a succes-sive approach, major drawbacks are it is not exactly relayed on DigComp and its statements are on more of digital empowerment. The second study was one step close to DigComp. But it was not one to one correspondence of all 21 compe-tencies on DigComp 2.1.
Fifthly, it is founded that gender is affecting financial risk tolerance. The financial risk tolerance of men is greater than women. This result is compatible with pre-vious studies (Bajtelsmit, & Bernasek, 1996; Grable, 2000; Grable & Joo, 2000; Hallahan, Faff, & McKenzie, 2004; Hariharan, Chapman, & Domian, 2000; Os-trovsky-Berman & Litwin, 2018; Powell & Ansic, 1997; Sung & Hanna, 1996; Yao & Hanna, 2005).
Sixthly, financial risk tolerance is affected by the marital status such that the risk tolerance scores of the married ones are greater than the single ones. It could be originated from that the marriage and being family could give some safety and power for financial risk-taking because having a partner could provide more finan-cial and emotional sources and an increased ability to tolerate undesirable finan-cial results (Hallahan et al., 2004). According to the study of Wilson and Oswald

236
FINANCIAL LITERACY AND DIGITAL COMPETENCE COULD PREDICT FINANCIAL RISK TOLERANCE: A RESEARCH STUDY IN TURKEY
Çağrı HAMURCU
(2002), marriage can enhance feelings of attachment and belonging and ensures emotional and instrumental support. When comparing our results to those of older studies, it must be pointed out that some studies found that married ones are more risk-tolerant than single ones (Chang, DeVaney, & Chiremba, 2004; Grable, 2000; Grable & Lytton, 2003; Haliassos & Bertaut, 1995; Kuzniak, Rab-bani, Heo, Ruiz-Menjivar, & Grable, 2015; Sung & Hanna, 1996). On the con-trary, some studies found the opposite results (Hallahan et al., 2004; Sulaiman, 2012) and some studies found that marital status is unrelated to financial risk tolerance (Chaulk, Johnson, & Bulcroft, 2003; Grable et al.2004; Hammitt, Ha-ninger, & Treich, 2005).
Seventhly, it is developed a new model on financial risk tolerance. This model is structured on the prediction of financial risk tolerance. In this model financial risk tolerance is tried to be predicted by independent factors. The result of the analysis shows that financial risk tolerance could be calculated by financial liter-acy, marital status and digital competence factor 1. It could be said that financial literacy, marital status and digital competence factor 1 are the predictors of finan-cial risk tolerance. In the model, 30.14% of the variation in financial risk toler-ance could be explained by the above stated three factors. It also means that only % 69.86 of the variation in financial risk tolerance is still unexplained. For this reason, adding other independent variables could improve the fit of the model. Although this prediction ratio is limited, it wouldn’t be wrong to say being fi-nancially literate, married and digital competent could increase financial risk tol-erance. If financial risk tolerance increases, an individual might have sufficient courage for financial issues in order to benefit from opportunities. This mecha-nism could help to strengthen for individual’s financial sustainability.
Limitation of This Study and Implications for Future Research
Though the significant findings, this study has a few limitations. These limitations might be addressed in future studies. The first limitation of this study, however, is the number of participants. Although scientifically accepted results, it suffers from some limitations due to the number of participants. This study is imple-mented only in the capital city of Turkey, Ankara. This is the second limitation of this research. Other cities or even other countries could be added to the next researches. To increase the prediction ratio for financial risk tolerance, researching

PERSPECTIVES ON MODERN ECONOMY
Aizhan KHOICH, Ali Eren ALPER, Ahmet Arif EREN
237
and adding other independent variables and demographical factors having possi-ble effects on it could improve the fit of the model.
All the findings and recommendations about the limitations of this work provide a good starting point for discussion and further research. Our study provides a framework for a new perspective. Future investigations are necessary to validate conclusions that can be drawn from this study.
References
Akkoyunlu, B., Soylu, M. Y., & Çağlar, M. (2010). A study on developing “digital empowerment scale” for university students. HU Journal of education, 39, 10-19.
Ala-Mutka, K. (2011). Mapping digital competence: Towards a conceptual un-derstanding. Sevilla: Institute for Prospective Technological Stud-ies.
Bajtelsmit, V.L. & Bernasek, A. (1996). “Why Do Women Invest Differently Then Men?”. Financial Counseling and Planning, VII, 1-10.
Carretero, S., Vuorikari, R., & Punie, Y. (2017). DigComp 2.1: The Digital Competence Framework for Citizens with eight proficiency lev-els and examples of use (No. JRC106281). Joint Research Centre (Seville site).
Chang, C. C., DeVaney, S. A., & Chiremba, S. T. (2004). Determinants of subjective and objective risk tolerance. Journal of Personal Finance, 3(3), 53-67.
Chaulk, B., Johnson, P. J., & Bulcroft, R. (2003). Effects of marriage and chil-dren on financial risk tolerance: A synthesis of family development and prospect theory. Journal of Family and Economic Issues, 24(3), 257-279.
Ferrari, A. (2012). Digital competence in practice: An analysis of frameworks.
Ferrari, A. (2013). Dig Comp: A framework for developing and understanding digital competence in Europe.
Grable, J. E. (2000). Financial risk tolerance and additional factors that affect risk-taking in everyday money matters. Journal of Business and Psy-chology, 14(4), 625-630.

238
FINANCIAL LITERACY AND DIGITAL COMPETENCE COULD PREDICT FINANCIAL RISK TOLERANCE: A RESEARCH STUDY IN TURKEY
Çağrı HAMURCU
Grable, J. E., & Joo, S. H. (1999). Factors related to risk tolerance: A further examination. Consumer Interests Annual, 1999, 45(1), 53-58.
Grable, J. E., & Joo, S. H. (2000). A cross-disciplinary examination of financial risk tolerance. Consumer Interests Annual, 46, 151-157.
Grable, J. E., & Lytton, R. H. (1999). Assessing financial risk tolerance: Do demographic, socioeconomic, and attitudinal factors work. Family Relations and Human Development/Family Economics and Resource Management Biennial, 3, 80-88.
Grable, J. E., & Lytton, R. H. (2003). The Development of a Risk Assessment Instrument: A Follow-Up Study. Financial services review, 12(3).
Grable, J., Lytton, R., & O’Neill, B. (2004). Projection bias and financial risk tolerance. The Journal of Behavioral Finance, 5(3), 142-147.
Haliassos, M., & Bertaut, C. C. (1995). Why do so few hold stocks? The eco-nomic Journal, 1110-1129.
Hallahan, T. A., Faff, R. W., & McKenzie, M. D. (2004). An empirical in-vestigation of personal financial risk tolerance. Financial Services Review-Greenwich, 13(1), 57-78.
Hammitt, J., Haninger, K., & Treich, N. (2005). The effects of health and lon-gevity on risk tolerance. Boston, Harvard Center for Risk Analysis.
Hariharan, G., Chapman, K., & Domian, D. (2000). Risk tolerance and asset allocation for investors nearing retirement. Financial Services Re-view, 9(2), 159–170.
Hatlevik, O. E., Ottestad, G., & Throndsen, I. (2015). Predictors of digital competence in 7th grade: a multilevel analysis. Journal of Computer Assisted Learning, 31(3), 220-231.
Huston, S. J. (2010). Measuring financial literacy. Journal of Consumer Affairs, 44(2), 296-316.
Königsheim, C., Lukas, M., & Nöth, M. (2017). Financial knowledge, risk preferences, and the demand for digital financial services. Schmalenbach Business Review, 18(4), 343-375.
Kuzminska, O., Mazorchuk, M., Morze, N., Pavlenko, V., & Prokhorov, A. (2018). Digital competence of the Students and Teachers in Ukraine: Measurement, Analysis, Development Prospects, ITER.

PERSPECTIVES ON MODERN ECONOMY
Aizhan KHOICH, Ali Eren ALPER, Ahmet Arif EREN
239
Kuzniak, S., Rabbani, A., Heo, W., Ruiz-Menjivar, J., & Grable, J. E. (2015). The Grable and Lytton risk-tolerance scale: A 15-year retrospective. Financial Services Review, 24(2).
Lusardi, A., & Mitchell, O. S. (2007). Financial literacy and retirement plan-ning: New evidence from the Rand American Life Panel. Michigan Retirement Research Center Research Paper No. WP, 157.
Ostrovsky-Berman, E., & Litwin, H. (2018). Social Network and Financial Risk Tolerance Among Investors Nearing and During Retirement. Journal of Family and Economic Issues, 1-13.
Powell, M., & Ansic, D. (1997). Gender differences in risk behavior in finan-cial decision-making: An experimental analysis. Journal of economic psychology, 18(6), 605-628.
Prabhakaran, K., Karthika, P. (2011). A study on risk perception and portfo-lio management of equity investors in Coimbatore city. Journal of Management and Science, 1(2), 1-13.
Riley, N. F., Russon, M. G. (1995). Individual asset allocation and indicators of perceived client risk tolerance. Journal of Financial and Strategic Decisions, 8(1), 65-70.
Rozkrut, M., & Rozkrut, D. (2019). Towards Measurement Framework of Digital Skills in Finance. In Effective Investments on Capital Mar-kets (pp. 121-133). Springer, Cham.
Salman, M., Saleem, I. (2017). Role of Digital Competence in Cashless Econo-my. IOSR Journal of Business and Management (IOSR-JBM), 2017, Volume 19, Issue 11. Ver.III, PP 49-53.
Sulaiman, E. K. (2012). An empirical analysis of financial risk tolerance and demographic features of individual investors. Procedia Economics and Finance, 2, 109-115.
Sung, J., & Hanna, S. (1996). Factors related to risk tolerance. Journal of Finan-cial Counseling and Planning, 7, 11.
Swiecka, B., Yeşildağ, E., Özen, E., Grima, S. (2020). Financial Literacy: The Case of Poland. Sustainability, 12(2), 700.
Van Rooij, M. C., Lusardi, A., & Alessie, R. J. (2011). Financial literacy and retirement planning in the Netherlands. Journal of economic psy-chology, 32(4), 593-608.

240
FINANCIAL LITERACY AND DIGITAL COMPETENCE COULD PREDICT FINANCIAL RISK TOLERANCE: A RESEARCH STUDY IN TURKEY
Çağrı HAMURCU
Wilson, C.M. and Oswald, A.J. (2002). How Does Marriage Affect Physical and Psychological Health? A Survey of the Longitudinal Evidence. Mimeo, Warwick University.
Yao, R., & Hanna, S. (2005). The effect of gender and marital status on finan-cial risk tolerance. Journal of Personal Finance, 4(1), 66–85.
Yip, U. Y. (2007). Financial risk tolerance: A state or a trait. Unpublished mas-ter’s thesis, The University of New South Wales, New South Wales, Australia. Retrieved April, 18, 2007.

241
15THE PLACE AND FUTURE OF ISLAMIC BANKING IN THE GERMAN BANKING SYSTEMHatice Elanur Kaplan1
Introduction
With the escalation of the subprime crisis in the USA and the consequences for the real economy in Europe around 2008, Islamic banks and Islamic finance at-tracted a great deal of attention and were intensively researched in the western world. Many market players put their hopes in the alleged crisis resistance. While the real estate bubbles and the consequences of the burst bubbles had Europe and the USA firmly under control, the Islamic banks were almost immune to the neg-ative consequences (Seel, 2012).
In 2009 Dubai experienced a crisis, as the state company Dubai World had to ask its creditors to defer payments, for a total of approximately 60 billion USD to settle liabilities. However, these were essentially liabilities that were based on an intersection of Islamic banking and the classic Western banking system. Just a few months later, the core of the payment crisis was overcome, and the restructuring of the state holding Dubai World began (Matschke et al., 2014).
The core of Islamic banking is the claim to act ethically in every respect, with the ethical and moral canon derived from the Koran itself or the Sharia. Given the resilience to crises and the high ethical standard, it seemed very likely that Is-lamic finance in general and Islamic banking, in particular, would become estab-lished in the western world. Many classic Western banks opened their own ‘Is-lamic windows’ or tried their hand at Sharia-compliant financial products. The positive expectations were reinforced by the steadily increasing absolute number of people of Islamic faith and the even stronger increase in the relative propor-tion of the total population. Further growth impulses from the current expansion of the sales market for Islamic-compliant banks are provided on the one hand by
1 PhD. Ömer Halisdemir University

242
THE PLACE AND FUTURE OF ISLAMIC BANKING IN THE GERMAN BANKING SYSTEM
Hatice Elanur Kaplan
the influx of refugees from the Muslim regions of North and East Africa to the western states, and on the other hand by the lifting of financial sanctions against Iran (Sobol, 2015). The high expectations of the growth of an Islamic financial sector have not yet been fulfilled. The aim of the present study is to identify the market potential of people living in Germany by researching the interest in Is-lamic banking of Muslims who are already economically established in Germany.
Instruments in Islamic Banking
Since the challenges facing the financial sector in the Islamic world are not funda-mentally different from those in the western world, various parallels can be seen in the products, which only differ from one another in their design. The finan-cial instruments in Islamic banking can be divided into debt and equity capital-ized contract forms as well as Islam-compliant leasing transactions. The entirety of the contractual structures is characteristic of a closeness to the real economy. The constant reference to the real economy is another central feature in Islamic banking. In contrast to conventional finance, the task of which is to provide un-tied capital, Islamic banking is based on the real economy. Therefore the prohi-bitions “Riba” and “Gharar” must be observed. These ensure that mutual trade only takes place on the basis of real goods (Kaplan, 2020).
The first fundamental contrast between classical Western finance and Islamic fi-nance is the Riba interest prohibition. The word Riba means “surplus” or “in-terest”. According to Sharia law, all business deals in Islamic finance must be ri-ba-free. Islamic schools of law agree on this prohibition, the scholars derive this prohibition from various suras of the Quran and the Sunna (Kayed, et al., 2012).
According to legal scholars, there is a separation of profits from commercial trans-actions and income from claims. A Muslim is allowed to lend money, but an in-terest claim from the loan is prohibited. The creditor may request a repayment of the loan, but he/she must waive his/her claim as soon as the debtor becomes insolvent (Fritzsch, 2017). In the end, Riba is an interest rate that is not allowed to exist in the Islamic financial system. The term Riba is not clearly defined in either the Quran or the Sunna. There are ongoing discussions about specific and detailed delimitation. As a result, there is a unanimous opinion among legal schol-ars that both the demand for interest and the payment of interest is strictly for-bidden (Shaikh et al., 2017).

PERSPECTIVES ON MODERN ECONOMY
Aizhan KHOICH, Ali Eren ALPER, Ahmet Arif EREN
243
In contrast to the Riba, there is no such clear legal position for the prohibition on Gharar speculation. Gharar is the second major contrast to the western finan-cial system and can be translated into English as “speculation” or “uncertainty/risk”. Gharar itself is also not categorically forbidden, only excessive Gharar is to be avoided (Gassner and Wackerbeck 2010, p. 38). Gharar is often found in short-term investments. There is no special limitation on speculation in finan-cial markets; the prohibition of speculation prohibits any high-risk trade that in-volves contractual uncertainties (Hassan and Aliyu, 2018). In terms of implemen-tation, the prohibition is difficult to interpret, as Islam itself does not explicitly forbid taking risks. The gap in interpretation can be closed by perceiving Gha-rar as the danger that one contractual partner exposes the other to risks without his/her knowledge. This approach is also confirmed by the fact that contracts are forbidden for which fulfillment is already uncertain in principle (Hassan and Mahlknecht, 2011).
Islamic law schools may disagree on the demarcation of gharar, but the unani-mous opinion is that the prohibition on speculation also includes a prohibition on all forms of deception. From the Quran it is deduced that trading is already prohibited as soon as one of the contractual partners achieves a benefit to the det-riment of the contractual partner (Kühn, 2015). The threshold for this is quite low, as speculation about the information deficits of the contractual partner al-ready constitutes a violation (Azarian, 2011).
In practical implementation, every money transaction with a real object must be secured at Islamic Finance. Apart from this commonality, which is a basic require-ment for all contract structures, the financing models differ in structure. In its ba-sic form, the debt-based instrument “Murabahah” is a purchase agreement with buyback. Three parties are involved in such a contract; the bank generates its in-come from the surcharge levied when the goods are resold. From a legal point of view, the financial institution also bears the risk of non-acceptance by the customer (Warninda et al., 2019). The instrument “Mudarabah”, which is an Islamic social contract, differs from this. Here the bank generates its income from the profit of the project and not from a surcharge. With this type of contract, both risks and profits are shared between the bank and the customer (Ashrafania 2016, p. 45).
By comparing the instruments of the Islamic financial system, it can be seen that these can be related to the conventional forms of contract. This is justified by

244
THE PLACE AND FUTURE OF ISLAMIC BANKING IN THE GERMAN BANKING SYSTEM
Hatice Elanur Kaplan
globalization and reinforced by the need to establish contract structures similar to the prevailing conditions in order to adapt to the economic conditions on the market and thus to position oneself competitively.
The respective historical development also plays a decisive role in the similari-ties between the conventional and Islamic contract structures. The western finan-cial system serves as the starting point for Islamic finance. In order to achieve a successful market positioning of an Islamic compliant financial system, a flexi-ble system and adaptability are necessary. The Islamic legal system has developed some mechanisms for adaptation, such as the involvement of Islamic legal schol-ars. The Islamic legal scholars should interpret the Sharia and adjust it to given standards. There are also ongoing adjustments in the Islamic financial system due to the supervision of Sharia boards. Islam-compliant financial products and ser-vices can take into account current standards and circumstances, but at the same time, comply with the principles and norms of Islam (Wilson, 1991).
Potential of Islamic Banking
The business domain of Islamic banking has expanded continuously over the past few years and it can be expected that growth will continue in the future. In order to examine the market chances of Islamic banking in Islamic and non-Is-lamic countries, the market structure is analyzed first. The datasets published by the Islamic Financial Services Board (IFSB) in 2017 and recorded in the Islamic Financial Services Industry Stability Report serve as the basis for this.
The global business domain of Islamic Banking had a volume of 1.89 billion USD in 2016 (IFSB 2017, p. 7). The “The World Islamic Banking Competi-tiveness Report 2012-2013” published in 2012 was very optimistic that the Is-lamic banking business domain would exceed two billion USD in 2014 (The World Islamic Banking Conference, 2015). The average annual growth rate be-tween 2004 and 2011 was up to 40% in individual countries, but this could no longer be achieved after 2011 (IFSB, 2013, p. 10). In 2015, the global growth rate decreased from around 10% to 6% and rose again in 2016 to around 10%. Higher growth rates can only be observed in countries that have relatively young Islamic finance. These include, for example, Nigeria with 24.8% and Oman with 43.9% (IFSB, 2017, p. 11).

PERSPECTIVES ON MODERN ECONOMY
Aizhan KHOICH, Ali Eren ALPER, Ahmet Arif EREN
245
Asset growth in the global Islamic financial services industry stagnated in 2016 for the second year in a row. This was mainly the result of a write-down of global Islamic bank assets in USD due to exchange rate devaluations in important Is-lamic banking markets.
The business domain of Islamic banking developed better in 2016 than in 2015. Sukuk issues rose and Islamic stocks developed positively again. At the same time, there were negative impulses, such as the first failure of a Sukuk issue in 2016. In contrast to previous years, Sharia-compliant stocks achieved lower returns than conventional stocks. The number of Islamic funds has decreased slightly, almost 30% of the funds were discontinued. Sukuks are the best-known form of Islamic securities and they are most likely to be equated with the conventional term of the certificate (Usmani, 2007).
While the Sukuk emissions on the primary market from 2004 to 2012 showed an average annual growth rate of approx. 45% and their value were thus 6.6 bil-lion USD to 131.2 billion USD rose, the global financial crisis led to a significant slump in this business area from 2007 onwards. This is due to the fact that dur-ing this period there was an investment inhibition on the part of both investors and issuers. The growth rate of global Sukuk emissions recovered rapidly; from 2009 an annual growth rate of around 60% followed until 2012 (IFSB, 2013, p. 25). This growth could no longer be achieved after 2012, although the demand for sukuks has also increased in non-Islamic countries such as the UK increased (Failaka Online, 2018). After Sukuk emissions peaked in 2012, the volume fell to 64.3 billion USD in 2015. And rose again on the primary market by 16% to 74.8 billion USD in 2016 due to increased emissions from issuers from states and state-related companies. After the stagnating year 2015 with 300.3 billion USD, the global sukuk in circulation rose by six percent to 318.5 billion USD at the end of 2016. Despite these improvements, the Sukuk market has not been able to regain the dynamism of the past few years (IFSB, 2017, p. 15).
The Middle East and parts of Asia, especially Malaysia, have the largest share of Islamic banking and thus also the largest share of assets. Islamic banks are most strongly represented in these regions (Hassan, 2017, p. 409). One explanation for this is that e.g. Iran is a strictly Muslim state and its financial system is strictly based on Sharia principles. Kuala Lumpur is the most relevant financial market for Islamic banking (IFSB, 2013, p. 7). Since Asia and the Middle East make up

246
THE PLACE AND FUTURE OF ISLAMIC BANKING IN THE GERMAN BANKING SYSTEM
Hatice Elanur Kaplan
the second largest proportion of Muslims worldwide with almost 60%, the geo-graphical focus is to be expected. With a share of 50.8%, Malaysia leads the world, especially with regard to Sukuk emissions (IFSB, 2017, p. 16f.).
Although the Islamic capital market grew considerably between 2004 and 2011 (IFSB, 2013, p. 3), growth in the Islamic banking sector fell to an average of 5.7% in 2015. However, the asset growth rate rebounded in 2016 with a growth of around ten percent. Islamic banking assets expanded by 9.9% between the fourth quarter of 2013 and the second quarter of 2016. This growth was con-centrated in 14 countries which together represent about 94% of the global Is-lamic banking industry. The growth potential of the Islamic banking system is evident from the absolute increase in Muslims. Optimal future prospects for Is-lamic banking can be derived, which will also have an impact on financial mar-kets outside the Islamic states (IFSB, 2017, p. 10).
Problems of raising the potential of Islamic banking in Germany
Since financial products and financial transactions are subject to strict legal reg-ulations in Germany, problems can arise when introducing Islamic-compliant fi-nancial products. For example, accounts according to Islamic Banking cannot be implemented in Germany, since the Deposit Protection and Investor Compensa-tion Act (EAEG) obliges all financial institutions to secure their deposits by be-longing to a statutory compensation scheme. Since the bank does not guarantee deposits in Islamic banking, this form of bank account is not permitted in Ger-many (Section 2 EAEG).
For this problem, there is a possibility in the UK that the customer voluntarily waives the deposit insurance. However, if the customer does not want this, his account will no longer be classified as Islam-compliant, but as a conventional ac-count. Further problems arise when purchasing real estate according to the Is-lamic Musharakah diminishing principle in Germany. Since, with the Mushar-akah diminishing principle, the financial institution first becomes the owner of the property and then sells it to the customer, the real estate transfer tax as well as the notary and legal fees would be due in Germany with every change of own-ership (Arshad and Ismail, 2010).
In the UK, this competitive disadvantage of Islamic-compliant financial insti-tutions compared to conventional financial institutions was eliminated with the

PERSPECTIVES ON MODERN ECONOMY
Aizhan KHOICH, Ali Eren ALPER, Ahmet Arif EREN
247
abolition of double taxation in 2003, which triggered a boom in Islamic-compli-ant building finance in the UK (Karbhari et al., 2004). In order to discuss the le-gal problem with the introduction of Islamic banking in Germany, BaFin held a conference on “Islamic banking” at the end of 2009. BaFin assured that it would support the introduction of Islam-compliant financial products within the frame-work of the legal possibilities and tasks (BaFin, 2012, p. 6).
Overview of services offered by Islamic Banking in Germany
Despite the potential, the Islamic banking market in Germany is only poorly de-veloped, and Islamic banking only forms a niche market (Schönenbach, 2012, p. 3). Until the summer of 2015, there was no full-fledged Islamic financial ser-vice provider in Germany. The “Financial Advice for Muslims and Friends” (FMF GmbH) founded in 2008 has been trading as ZinsFrei since 2015. ZinsFrei does not act as a financial institution, but as a consulting company that provides se-lected Sharia-compliant products to its customers. ZinsFrei currently has a loca-tion in Frankfurt and advises its customers nationwide (ZinsFrei, 2018).
The Kuveyt Türk Beteiligungsbank founded a representative office in Germany in 2004 and opened the first branch in Mannheim in May 2010. However, at this point in time the bank was unable to offer its own banking products, but instead only brokered transactions for third-country deposit brokerage with its Turkish parent company due to the license it received in 2010. In 2012, the Turkish par-ent company, Kuveyt Türk Katilim Bankasi A.S. submitted an application for a banking license to the Federal Financial Supervisory Authority. With the license granted in March to operate the deposit and credit business, KT Bank AG is now a deposit financial institution under German law. As a result, Kuveyt Türk Bank AG started payment transactions on July 1st, 2015, and opened further branches in Berlin and Frankfurt. Due to the great demand that Kuveyt Türk Bank AG sees for Islam-compliant financial products in Germany, the branch network is to be gradually expanded. For example, it is planned to open branches in Es-sen, Düsseldorf, Cologne, and Munich. So far, however, there is only one other branch in Cologne (Kuveyt Türk Bank AG, 2018).
Moreover, the German universal banks Deutsche Bank and Commerzbank main-tain their own “Islamic Windows”. They offer e.g. has its own departments and branches specializing in Islamic Finance, which almost exclusively serve institutional

248
THE PLACE AND FUTURE OF ISLAMIC BANKING IN THE GERMAN BANKING SYSTEM
Hatice Elanur Kaplan
investors from the Near and Middle East (Braham, 2012, p. 52). Commerzbank also has Islamic finance products in the areas of “Financial Institutions” and “Corporate and Investment Banking” and works with Islamic financial advisors to develop Islamic compliant products. Commerzbank’s branches in this area are located in Dubai, Beirut, Cairo, and Kuala Lumpur (Commerzbank, 2018). Deutsche Bank also offers Islamic-compliant investments and financing for pre-dominantly institutional Arab investors through the so-called Islamic Finance Structuring Team of Deutsche Bank Middle East and North Africa. The team serves the state, semi-state and private companies. Deutsche Bank Middle East and North Africa act as book-runners for Sukuk issues (Deutsche Bank, 2018).
On the German market, ETFs from asset managers DB X-Trackers and Ishares can be acquired on Islam-compliant indices such as the DJ Islamic Market Ti-tans 100 or the MSCI World Islamic. Allianz Global Investors offered the Is-lamic managed investment fund “Allianz Islamic Global Equity Opportunities” on the German market until November 2012, but this was dissolved due to in-sufficient demand (German-Emirati Chamber of Commerce and Industry 2010, p. 2). Commerzbank had similar experiences as early as 2005 and liquidated the “Al-Sukoor European Equity Fund” (Soylu, 2019, p. 151).
Advantages and disadvantages of Islamic banking
After analyzing the potential of Islamic banking for Germany as a business loca-tion, particularly with regard to examples and problems with its introduction in Germany, the advantages and disadvantages of this banking system are assessed. There is no doubt that the Islamic Banking segment has grown steadily over the past few years. And this trend is likely to continue, as evidenced by the increas-ing Sukuk emissions and the increasing volume of assets (IFSB, 2013, p. 10).
In this context, it can be assumed that demand will continue to grow for the most part in the Islamic states and less on the German market. It should also be noted that Islamic banking is a niche market in a global comparison, as only one percent of the money market is processed through Islamic banking transactions. Furthermore, only a few western financial institutions participate in this business area. The reasons for this abstention lie in the limited handling options when implementing Islamic compliant products. These basically limit the investment opportunities of the banks, which leads to limited investment options and even

PERSPECTIVES ON MODERN ECONOMY
Aizhan KHOICH, Ali Eren ALPER, Ahmet Arif EREN
249
investment bans in certain industries, such as Alcohol, prostitution, and pork. The Gharar prohibition, which is intended to rule out speculation and uncer-tainty, means that business areas such as derivatives trading and short selling are excluded. The joint profit and loss sharing through equity financing protect against risky trading because it reduces the incentives to invest in speculative transactions. The Islamic compliant financial system has a significantly lower level of risk than the conventional financial system. A more sustainable business orientation that is strived for generates economic efficiency for the entire economy. However, de-spite the social economic orientation and significant growth in recent years, Is-lamic banking lacks competitiveness in global comparison (Alam et al., 2017).
One reason for the lack of competitiveness of the Islamic compliant banks is the Islamic principles, which are used as the basis for the Islamic conformity of the contractual structures. Particular attention is paid to the Riba prohibition, as this means that all contractual structures must contain the avoidance of interest. Ac-cordingly, the drafting of contracts is shaped by Islamic values, which leads to clear differences between conventional and Islam-compliant banking products. This discrepancy is also the reason why Islamic banking finds it difficult to com-pete with the conventional financial system in an international comparison. The possible disagreement on legal issues between Islamic legal scholars has a negative impact on competitiveness. For example, the legal scholars represent widely di-vergent positions on individual contracts relating to the Maysir and Qimar gam-bling prohibition. There is disagreement here as to whether investments in the stock market fall under the prohibition of Maysir and Qimar (Mihajat, 2016).
Another disadvantage is that the implementation of Islamic banking is time-con-suming for financial institutions and requires long-term educational work. The installation of a Sharia board to ensure that the products conform to Islam, for example, means an effort for financial institutions. Organizations such as Ac-counting and Auditing Organization for Islamic Financial Institutions (AAO-IFI), International Islamic Financial Market (IIFM), and the Islamic Financial Services Board (IFSB) have contributed to some degree to standardization in Is-lamic banking. But despite the international adjustment process, the young Is-lamic financial system lacks popularity and comparability (BAMF, 2017, p. 5). Al-though the constant competitive pressure from the conventional financial system is constantly driving the expansion of Islamic financial products, the dynamically designed legal system can only moderate the differences to the Western financial

250
THE PLACE AND FUTURE OF ISLAMIC BANKING IN THE GERMAN BANKING SYSTEM
Hatice Elanur Kaplan
system. Accordingly, it is difficult for banks that conform to Islam to be compet-itive in the context of competition (Sacarcelik, 2016).
Possible demand from Muslims living in Germany
The following information relates to the study carried out on behalf of the Ger-man Islam Conference from 2016 with the title “How many Muslims live in Ger-many?”. According to this study, on December 31, 2015, between 4.4 and 4.7 million of the approx. 82.5 million people living in Germany supporters of the Muslim faith (Federal Statistical Office, 2017). This makes up a relative share of approx. 5.5% of the total population. Due to various factors such as dual citizen-ship and family memberships as well as the increased immigration of refugees be-tween 2014 and 2017, which are essential criteria for estimating the Muslim pop-ulation, only imprecise information can be given about the actual current number. For example, the religious affiliation of the refugees from 2016 was clearly dom-inated by Islam with 76% (BAMF, 2017, p. 25). A Muslim is often counted as someone who comes from an Islamic country. It remains unclear whether the person actually sees himself as Muslim. The “Research Group Weltanschauun-gen in Germany” also points out these inaccuracies. It assumes that in Germany 3.6 million. There were “denominational Muslims” - about a million fewer than the Federal Office assumes. This reduces the relative share of Muslims in the to-tal German population to 4.4% (FOWID, 2016).
Consolidation of the research results
The majority of Muslims describe themselves as “believers” and live their reli-gion in everyday life and their personal environment by means of prayers, ob-serving religious holidays, and observing fasting regulations more than people of non-Muslim religious affiliation (Stichs and Rotermund, 2017). These findings are also reflected in the study. In general, the results of the Muslims and the com-parison group can be described as opposing. This was clearly shown both in the questions about the religious orientation of a bank and in the questions about the Riba or Gharar prohibition. While only a few respondents from the compar-ison group consider a bank’s religious orientation important, around half of Mus-lim respondents share this view.

PERSPECTIVES ON MODERN ECONOMY
Aizhan KHOICH, Ali Eren ALPER, Ahmet Arif EREN
251
More than 50% of the Muslims describe the prohibitions as important or indis-pensable. This is also due to the fact that these prohibitions are an essential part of Islamic principles and are therefore part of the everyday life of every devout Muslim (Gassner and Wackerbeck, 2007). Furthermore, the survey showed that Muslims advocate a stronger influence of religion on the economy, in this case on the financial sector. It can thus be stated that the Islamic compliant banking sys-tem due to the considerable potential target group, an estimated 4.5 million. Mus-lims could theoretically have great potential in Germany (Zimmer et al., 2017).
Conclusion
The present study gave an insight into the instruments used in Islamic banking. The study explored the potential of Islamic banking. The potential of Islamic banking from the perspective of German financial institutions, examples of Is-lamic banking in Germany, and problems with the introduction of Islamic bank-ing in Germany were discussed.
Outside of the Muslim target group, Islamic banking does not play a role within Germany and has no relevant potential. This “rejection” of the Islamic banking system, or the lack of interest in it, can be seen from the results of the survey ad-dressed to the comparison group. On the one hand, the comparison group con-sidered a bank based on religious principles to be unimportant. On the other hand, many of those surveyed in the comparison group are unimportant or un-known about the principles of Islam, by which Islam-compliant banks are based. It can therefore be assumed that an Islamic-compliant financial system has no potential for the respondents from the comparison group.
A look at the Muslims questioned shows the opposite result. According to the survey, 61% of the Muslims prefer an Islamic-compliant bank to a conventional bank, as this does not charge interest. The proportion of Muslims surveyed for whom the religious orientation of a bank is important is clear at 46%. 37% of the Muslims surveyed said that they prefer an Islamic bank despite the higher price. Islamic principles are also very important to the Muslims surveyed. However, for 87% of the Muslims, the availability of ATMs and branches are also very impor-tant. This can be seen as a disadvantage for the Islamic compliant banks, as the branch network within Germany is not well developed.

252
THE PLACE AND FUTURE OF ISLAMIC BANKING IN THE GERMAN BANKING SYSTEM
Hatice Elanur Kaplan
Accordingly, it can be concluded from the findings that Islamic banking has a large potential target group among the Muslims living in Germany. However, the qualitative factors of this target group with regard to the income structure are less interesting than for the comparison group. That makes it less attractive to replace conventional banks with Islamic offers, also in the private customer segment. Even the classic commercial banks could adapt their OTC products by making small variations in the context of customer care, in order to retain Muslim cus-tomers, for instance, the automatic transfer of interest income as a donation to a non-profit organization. Ultimately, the Muslims living in Germany currently have Western accounts and participate in business life. They are only new cus-tomers in the rarest of cases. Despite all its advantages, Islamic banking will not play a relevant role in the German banking environment for the foreseeable future.
References
Alam, N., Gupta, L., & Shanmugam, B. (2017). Prohibition of Riba and Gha-rar in Islamic banking. In Islamic Finance (pp. 35-53). Palgrave Macmillan, Cham.
Ashrafania, S. (2016). Scharia-konforme Finanzinstrumente – Analyse der Re-chtsnatur von sukuk und die Strukturierung nach deutschem Recht. Wiesbaden: Springer Gabler.
Arshad, N. C., & Ismail, A. G. (2010). Shariah parameters for Musharakah Contract: A comment. International Journal of Business and Social Science, 1(1).
Azarian, R. (2011). Outline of an economic sociology of Islamic banking. Inter-national Journal of Business and Social Science, 2(17).
BaFin (2012). Islamic Finance: Eine gar nicht so fremde Welt. http://www.bafin.de/SharedDocs/ Veroeffentlichungen/DE/Fachartikel/2012/fa_bj_2012_06_islamic_finance.html.
BAMF (2017). Das Bundesamt in Zahlen 2016: Asyl, Migration und Integration. Nürnberg: Bundesamt für Migration und Flüchtlinge.
Braham, A. (2012). Islamic Banking: Moralische und ökonomische Grundsätze. Erfolgsaussichten in Deutschland (1. Aufl.). Hamburg: Diplomica Verlag.

PERSPECTIVES ON MODERN ECONOMY
Aizhan KHOICH, Ali Eren ALPER, Ahmet Arif EREN
253
Commerzbank (2018). Commerzbank. Islamic Finance. https://cbcm.com-merzbank.com/de/ hauptnavigation/client_overview/institution-als/financial_institutions/islamic_finance.html.
Deutsche Bank (2018). Deutsche Bank. Islamic Finance. https://www.db.com/mea/en/content/ islamic_finance.html. Zugegriffen.
Failaka Online (2018). Rising uncertainly for the sukuk market in 2018. http://failaka.com/2018/ 01/.
Federal Statistical Office (2017). Bevölkerung auf Grundlage des Zensus. https://www.destatis. de/DE/ZahlenFakten/GesellschaftStaat/Bevoelkerung/Bevoelkerungsstand/Tabellen/Zensus_Geschlecht_Staatsangehoerigkeit.html.
FOWID (2016). Forschungsgruppe Weltanschauungen in Deutschland. https://fowid.de/meldung/ religionszugehoerigkeiten-deutschland-2016.
Fritzsch, H. (2017). Islamic Banking. Bedeutung und Marktchancen für deutsche Kreditinstitute unter Berücksichtigung einer wachsenden muslimischen Bevölkerung. GRIN Verlag.
German-Emirati Chamber of Commerce and Industry (2010). Islamic Finance in Germany – Factsheet. http://vae.ahk.de/uploads/media/Islam-ic_Finance_in_Germany_Factsheet.pdf.
Gassner, M., & Wackerbeck, P. (2007). Islamic finance: islam-gerechte Finanzan-lagen und Finanzierungen. Linde Verlag Wien.
Hassan, K. (2017). Handbook of empirical research on Islam and economic life. Northampton: Edward Elgar Pub.
Hassan, K. ve Mahlknecht, M. (2011). Islamic capital markets: products and strategies (C. 609). John Wiley & Sons.
Hassan, M. K., & Aliyu, S. (2018). A contemporary survey of Islamic banking literature. Journal of Financial Stability, 34, 12-43.
IFSB (2013). Islamic Financial Services Industry: Stability Report 2013. Kuala Lumpur, Malaysia: Islamic Financial Services Board.
IFSB (2017). Islamic Financial Services Industry: Stability Report 2017. Kuala Lumpur, Malaysia: Islamic Financial Services Board.
Kaplan, H. E. (2020). Islamic Financial Institutions in The World and Turkey. JOEEP: Journal of Emerging Economies and Policy, 5(1), 89-100.

254
THE PLACE AND FUTURE OF ISLAMIC BANKING IN THE GERMAN BANKING SYSTEM
Hatice Elanur Kaplan
Karbhari, Y., Naser, K., & Shahin, Z. (2004). Problems and challenges facing the Islamic banking system in the west: The case of the UK. Thun-derbird International Business Review, 46(5), 521-543.
Kayed, R. N., Mahlknecht, M., & Hassan, M. K. (2012). The Current Finan-cial Market Crisis: Lessons Learned, Risks and Strengths of Islamic Capital Markets Compared to the Conventional System. Islamic Capital Markets: Products and Strategies, 359-384.
Kuveyt Türk Bank (2018). KT Bank AG. https://www.kt-bank.de/ueber-uns/kt-bank/.
Kühn, M. (2015). Islamic Banking: Die zinslose Ökonomie. Igel Verlag RWS.
Matschke, M. J., Hering, T., Olbrich, M., & Klingelhöfer, H. E. (2014). Finan-zwirtschaft, Unternehmens-bewertung & Revisionswesen.
Mihajat, M. I. S. (2016). Contemporary practice of Ribā, Gharar and Maysir in Islamic banking and finance. International Journal of Islamic Man-agement and Business, 2 (2), 1-19.
Sacarcelik, O. (2016). Geld und Glaube im islamischen Wirtschaftsdenken. In Geld, Gott und Glaubwürdigkeit (pp. 75-84). Verlag Ferdinand Schöningh.
Schönenbach, R. (2012). Intrinsische Hindernisse des islamischen Finan-zwesens. http://www. stresemann-stiftung.de/wp-content/up-loads/2012/11/Stresemann-Stiftung-SchoenenbachIslamic-Fi-nanceWWW2012-07-26.pdf.
Seel, G. (2012). Das Liquiditätsrisiko der Banken in der Finanzkrise: künftige Regulierungsvorschriften und ihre Auswirkungen. Springer-Verlag.
Shaikh, S. A., Ismail, M. A., Shafiai, M. H. M., Ismail, A. G., & Shahimi, S. (2017). Role of Islamic banking in financial inclusion: prospects and performance. In Islamic Banking (pp. 33-49). Palgrave Mac-millan, Cham.
Sobol, I. (2015). Islamic banking in the European Union countries. European Integration Studies, 9(1), 184-197.
Soylu, U. (2019). Status of Islamic Finance in Germany in 2019. In Islamic Finance in Europe (pp. 149-158). Palgrave Macmillan, Cham.
Stichs, A., & Rotermund, S. (2017). Vorschulische Kinderbetreuung aus Sicht muslimischer Familien: eine Untersuchung über die In-

PERSPECTIVES ON MODERN ECONOMY
Aizhan KHOICH, Ali Eren ALPER, Ahmet Arif EREN
255
anspruchnahme und Bedürfnisse in Hinblick auf die Ausstattung; im Auftrag der Deutschen Islam Konferenz.
The World Islamic Banking Conference (2015). World Islamic Banking Com-petitiveness Report 2014–15. Participation Banking 2.0. http://www.ey.com/Publication/vwLUAssets/EYworld-islamic-bank-ing-competitiveness-report-2014-15/$FILE/EY-world-islam-ic-bankingcompetitiveness-report-2014-15.pdf.
Usmani, M. T. (2007, May). Sukuk and their contemporary applications. In Translated from the original Arabic by Sheikh Yusuf Talal DeLorenzo, AAOIFI Shari’a Council meeting, Saudi Arabia.
Warninda, T. D., Ekaputra, I. A., & Rokhim, R. (2019). Do Mudarabah and Musharakah financing impact Islamic Bank credit risk differently?. Research in International Business and Finance, 49, 166-175.
Wilson, R. (1991). Islamic financial instruments. Arab Law Quarterly, 6(2), 205-214.
Zimmer, V., Ceylan, R., & Stein, M. (2017). Religiösität und religiöse Selbst-verortung muslimischer Religionslehrer/innen sowie Lehramtsan-wärter/innen in Deutschland. Theo-Web. Zeitschrift für Religion-spädagogik, 16(2), 347-367.
ZinsFrei (2018).Zinsfreie Historie. https://zinsfrei.de/ueber-uns/zinsfreie-his-torie/.


257
16THE ROLE OF IFRS AND AUDITING IN CORPORATE GOVERNANCEMehmet Nuri SALUR1
Introduction
The concept of corporate governance took great attention after international fi-nancial crisis and started to be talked in financial markets. Especially the com-pany scandals which showed up in 90’s increased the need of corporate govern-ance. The Enron and WorldCom scandals in USA, the Parmalat scandal in Italy, the Ahold scandal in Holland and the Yanguangxia scandal in China suddenly made corporate governance and its control draw all attention to themselves. Be-sides that, global financial crises that increased their effect with the integration of financial markets made corporate governance applications a current issue for a more durable company structure against these crises. Moreover, with interna-tional capital activities gaining speed, investors started to be interested not only in the companies in their own countries but also in the companies and invest-ment ways all over the world and so companies make effort to be able to adjust more to corporate governance arrangements which are trusted and generally ac-cepted to attract the aforementioned capital. (Aktan, 2013: 3)
On the other hand, the weaknesses in internal and independent audits behind the mentioned company scandals revealed the vital importance of auditing and ac-counting discipline. Within this scope, the subject of audits in private and pub-lic spaces is more focused anymore and the importance of the accounting prin-ciples which are generally accepted increased. The importance of a strong audit mechanism and a harmony in accounting standards for a good corporate govern-ance system came into prominence.
1 Asst. Prof. Dr., Necmettin Erbakan University, Faculty of Political Sciences, Department of Business Administration, Konya, TURKEY, [email protected], ORCID: https://orcid.org/0000-0003-1089-1372

258
THE ROLE OF IFRS AND AUDITING IN CORPORATE GOVERNANCE
Mehmet Nuri SALUR
In this study, the concept of corporate governance is primarily introduced and the importance and benefits of that is mentioned. After, the role of audit in cor-porate governance is referred by shortly discussing the audit mechanism in com-panies. In the third chapter, the importance of compliance of IFRS for corporate governance is explained by shortly referring to the international financial report-ing standards (IFRS).
1. The Concept of Corporate Governance and Its Importance
Corporate Governance is set of rules which coordinate the relationships between company management and shareholders and stakeholders. In other words, it is a kind of a management philosophy targeting to exhibit the responsibilities and obligations of company management and to preserve the rights of all stakehold-ers directly or indirectly related to the actions which companies run, including shareholders in any company (Aktan, 2013: 5). Corporate governance is a form of management that enables the investors to provide financing to businesses to feel that they are safe in the decisions they make about financing which man-agers provide with the point of earning money with these investments (Shleifer and Vishny, 1997: 737). Corporate governance can also be described as the set of principles which all stakeholders must follow and which prioritize businesses to achieve their goals by preventing possible conflicts for interest among these stake-holders. (Ataman and Cavlak, 2016: 214). In summary, corporate governance ac-tually means “good business management”. For a good business management to previously determine not only the responsibilities and obligations of the board of directors and company senior management but also the rights of stakehold-ers which are out of and inside of the company and to legalize these are highly important but not enough. Beyond these, for good company management it’s pretty necessary to implement change management, strategic management, syner-gistic management, total quality management, human recourses management etc. management techniques in the company in an effective way. (Aktan, 2013: 7).
Good corporate governance within the frame of literature and approximations accepted in general was built on the 4 primary principles. (Donker and Zahir, 2008: 84-85). These principles are explained below:
The Principle of Fairness expresses the company behaving fair towards every re-lated stakeholders and every rights-holders meanwhile preserving the interests

PERSPECTIVES ON MODERN ECONOMY
Aizhan KHOICH, Ali Eren ALPER, Ahmet Arif EREN
259
of partners. According to this principle, it should be assured to treat fairly to all stakeholders by not allowing violating in a way that would break the equality in opportunity among the shareholders and by not discriminating among the stake-holders. The right of getting compensation and restoration should be given in the case of a possible breach. (Pamukçu, 2011: 135).
The Principle of Responsibility expresses the company treating respectfully to the arrangements which reflect legislation and social values while doing their actions. In their corporate social responsibility activities which have been rising in impor-tance in the recent years, companies not only follow the legal reforms, but also take behaving respectfully and sensibly towards society to forefront by going be-yond these. In this context, decisions made and activities done create an impact on society and this should be considered. (Alp and Kılıç, 2014: 60-62). Institu-tional social responsibility activities contribute to society and besides this, these activities also make a great contribution to companies, enhance the perception of society about companies, provide positive returns about areas of either consumer behaviors or human recourses and financing to companies.
The principle of Transparency expresses every kind of data either financial or nonfinancial except for the ones which commercial secrets about the company involves in are presented to all shareholders and stakeholders of the company in a correct, complete, solid, understandable, analyzable, easily accessible, punctual and affordable way (Güngör Tanç and Cingöz, 2011: 208).
The Principle of Accountability expresses a person or an organ that makes de-cisions, uses power, takes action, functions about an issue is responsible for his decision, the power he uses, his action, his functions and is expected to give an explanation about those. For this principle to be applied successfully, it’s impor-tant to determine authorities, duties and responsibilities at all levels in the com-pany in a clear way, and it’s also important to have proportional authorities and responsibilities, internal audit and independent external audit mechanisms with a strong and effective internal control structure. (Alp and Kılıç, 2014: 59-61).
1.1. The Benefits of Corporate Governance
Especially accounting and auditing scandals happening in global companies and international financial crises decreased the trust which is put in firms and capital

260
THE ROLE OF IFRS AND AUDITING IN CORPORATE GOVERNANCE
Mehmet Nuri SALUR
markets. A good corporate governance system has a critical role in gaining back the trust in respect of investors and stakeholders.
Corporate governance is one of the key factors of increasing economic efficiency, providing a sustainable growth and also gaining trust of investors. Corporate gov-ernance has been presenting a structure that the targets of the companies are deter-mined. It has been determining the ways of how to achieve these goals and how to control the performance. In this context, good corporate governance should ensure suitable promotions to the top management to go towards the targets in the direction of advantages of companies and shareholders and it should ease ac-tive control. (OECD, 2004).
Besides; the effective management mechanism established as a result of good cor-porate governance practices results in an increase in company performance and efficient use of resources. Likewise, effective corporate governance encourages the establishment of systems to ensure that the board of directors and senior man-agement operate in line with the company’s objectives. Also, the corporate gov-ernance principles emphasize the benefits of stakeholders to be reviewed in the decision-making process, explain the necessary methods for this and help the ben-efits of different stakeholders to be represented to the company strategies in a balanced way. Thus, a unity of purpose is achieved between the company man-agement and stakeholders for the success of the company (TKYD and Deloitte).
The benefits of good corporate governance practices for companies have also been reflected in the results of many quantitative and qualitative studies conducted in recent years. In companies that are successful in corporate governance, it has been observed that financial performance increases, employees and managers at all levels adopt the company more, and business performance increases, and cus-tomer loyalty is positively affected. As a result, it can be said that good corporate governance practices help for sustainable growth for companies in the long run.
2. The Role of Audit in Corporate Governance
In terms of accounting auditing, auditing can be defined as the analysis of the fi-nancial statements and accounting records of the companies. With a broader ex-planation, the audit aims to determine the degree of compliance and accuracy of a particular economic unit or a specific period of a financial statements and other information with sufficient and appropriate independent audit evidence to

PERSPECTIVES ON MODERN ECONOMY
Aizhan KHOICH, Ali Eren ALPER, Ahmet Arif EREN
261
provide reasonable assurance. For this purpose, audit is the process of gathering evidence carried out by an independent expert, evaluating the collected evidence by comparing them with the bases through book records and documents, and presenting the result with a report (Haftacı, 2016: 2).
In today’s increasingly globalized world, the interaction of different economic units with each other more, the increase of company mergers and the rapid movement of international capital according to the changing conditions force the compa-nies, which are the dynamos of the economy, to adapt to changing conditions. This situation necessitates the preparation of transparent, comparable and accu-rate financial statements by making their current accounting systems more effec-tive in order for companies to increase their competitiveness and keep up with developing capital markets and the enhancement of their reliability by subject-ing them to auditing. In addition to this, due to the complexity of economic ac-tivities and transactions, the abundance of data, and the unfair attitudes of the information providers in recent years, the reliability of the information provided by the businesses has been questioned more and the needs of information users for reliable information have been increasing (Selimoğlu et al., 2014: 1-2). These developments increase the importance of auditing in business management. The need for auditing is increasing day by day due to the complexity of the account-ing system with the increasing business volume and the increasing possibility of making mistakes, the insufficiency of the company internal control and account-ing system, the separation of financial information users from the company, and conflicts of interest between company managers and financial information users. (TÜRMOB-TESMER, 2013). All stakeholders of the business such as inves-tors, partners, employees, managers, analysts, credit institutions, suppliers, cus-tomers and relevant public institutions will be able to access transparent, compa-rable, timely and accurate information about the business through the audit. In this way, the interests of all parties will be preserved and the long-term profita-bility and sustainability of businesses will be ensured.
The success that businesses can achieve by managing them with effective corpo-rate governance practices can only be possible with effective audit practices. Cor-porate governance practices and integration of these practices with auditing; It is extremely important for businesses to achieve sustainable growth and global stand-ards. In addition, this situation is important for the stakeholders of the business to access accurate, impartial and reliable information (Karadeniz, 2015: 321).

262
THE ROLE OF IFRS AND AUDITING IN CORPORATE GOVERNANCE
Mehmet Nuri SALUR
Proper financial reporting is used as a good tool for the application of corporate governance principles. In order for the principle of accountability to be imple-mented, the public should be informed about the company’s activities in certain periods, which can be achieved through financial reporting. Again, in accordance with the principle of transparency, the sharing of the company’s performance and strategy expectations with stakeholders can be achieved with financial reporting tools. In order to balance conflicts of interest within and outside the institution and to protect minority rights, the relevant groups must be accurately informed, which can also be achieved through financial reporting. The information con-tained in financial reporting comes through various processes within the com-pany. The soundness of these processes depends on proper internal audit and in-dependent audit (Arı, 2008: 50). Therefore, a good control mechanism ensures correct financial reporting and correct financial reporting increases the level of corporate governance.
The ability of businesses to build trust in their stakeholders depends on financial reporting in accordance with national and international standards. These stand-ards ensure that financial information users are presented with the information appropriate to their needs in a truthful manner. The independent audit process expresses its opinion on whether the financial statements prepared by the man-agement are prepared in accordance with these standards. In this way, the accu-racy and honesty of the information contained in the financial statements will serve the stakeholders to have an idea about whether the company reflects its fi-nancial status in a realistic way. Therefore, it will contribute to the preservation of the principle of equality by protecting the rights of the stakeholders, and the provision of the principle of transparency through the fact that the financial state-ments reflect the status of the enterprise faithfully. With this aspect, independent audit is effective in establishing and maintaining corporate governance in com-panies. (Memiş, 2016: 42)
In this context, it can be said that, in terms of corporate governance, independ-ent auditing provides reasonable assurance to investors, creditors and other stake-holders about that financial statements are free from significant errors, frauds, and mistakes. By providing a substantially accurate information flow to outside the company through financial statements; By contributing to the elimination of the information asymmetry between the business management and other stakeholders,

PERSPECTIVES ON MODERN ECONOMY
Aizhan KHOICH, Ali Eren ALPER, Ahmet Arif EREN
263
it also has an efficient role in the solution of the real commissionaire conflict of interest problem. (Arı, 2008: 63)
Internal control system, which is one of the important elements of audit, is also a driving force in the implementation of corporate governance perspective and principles. An effective internal control system directly serves the purposes of cor-porate governance. Internal control ensures that information about the business is transmitted to the relevant parties in a correct, timely and complete manner, which brings along the principles of equality, transparency, accountability and re-sponsibility. In order to achieve equality between shareholders and stakeholders in the business, information concerning the parties of the business must be dis-closed. Transparency is the transmission of necessary and sufficient information to shareholders, stakeholders and other relevant parties. The effectiveness of the internal control system also requires accurate, complete and timely sharing of in-formation. Therefore, an effective internal control system serves both the princi-ple of equality and the principle of transparency, which contributes significantly to the success of corporate governance. (Baskıcı, 2012: 115-116)
On the other hand, an effective internal control system to be established within the company will ensure that everyone acts within this authority and responsi-bility by determining the authorities and responsibilities of the company em-ployees. Again, the internal control system will establish an effective accounting system to record financial movements, thus it will prevent unrecorded transac-tions and as a result it will ensure reliability in data. In addition, an effective in-ternal control system will determine to what extent the employees of the com-pany work actively and effectively in line with the objectives set by the company. Therefore, the internal control system will determine who is responsible for fi-nancial or non-financial transactions in the company and may call these persons to account. Thus, the principles of transparency, equality, accountability and re-sponsibility will work and as a result, corporate management will be established in the business (Usul et al., 2011:50)
Today, in addition to the function of increasing the reliability of the financial statements, additional value creating functions are also expected from the audit process for business activities such as detecting irregularities within the company and reporting to the management and providing consultancy services to the man-agement regarding the problems and corrective suggestions in the internal control
264
THE ROLE OF IFRS AND AUDITING IN CORPORATE GOVERNANCE
Mehmet Nuri SALUR
systems. In this way, managerial errors will be minimized and the corporate man-agement system will be strengthened (Memiş, 2016: 42).
Audit plays an important role in the corporate management system in terms of risk management in businesses. Sound corporate governance practices should em-body good risk management. Risk management should be considered as a pro-cess that takes all risks into account in order to protect the continuity of the ac-tivities of the organization. In addition, in order to implement risk management practices, an internal and corporate structure should be developed that takes into account the special structure of the organization rather than a standard method. At this point, internal audit plays an important role. Internal audit ensures the understandability and controllability of risks within the organization, establishes an effective risk management system by establishing the necessary infrastructure for risk management and thus strengthens the corporate management system. (Abdioğlu, 2007: 290)
Finally, it will be necessary to mention the contribution of auditing to corporate management in the context of creating social responsibility awareness in busi-nesses. The understanding of corporate governance directs companies to act with social responsibility awareness within the framework of ethical values. The inter-nal auditor plays an extremely important role in the application and develop-ment of ethical principles within the company. The internal auditor builds trust by overseeing ethical priorities and applying ethical behavior. In this respect, the responsibility of the internal auditor in protecting the public interests is possible by reporting illegal contracts to the relevant persons. This situation is a result of corporate transparency and accountability regarding the understanding of cor-porate governance by internal auditors. Therefore, it can be said that an effective internal audit function is an important element of good corporate governance and supports internal corporate governance elements in the formation of a relia-ble corporate image. (Abdioğlu, 2007: 291)
3. IFRS and The Role of IFRS in Corporate Governance
3.1. International Financial Reporting Standards (IFRS)
Financial reporting is a tool that is produced within the accounting information system and provides the financial information needs of different interest groups in businesses in a timely, accurate, reliable and understandable manner. This tool

PERSPECTIVES ON MODERN ECONOMY
Aizhan KHOICH, Ali Eren ALPER, Ahmet Arif EREN
265
helps users of financial information make the right decisions in their business de-cisions. At the same time, it is a very important tool that provides managers with the information about the financial performance and financial status of the busi-ness by periods, about how the business is managed during its lifetime. (Palea, 2013: 18; Hatunoğlu and Güneş, 2012: 243).
With the effect of globalization, the modern economy is based on the free move-ment of capital and financial transactions that take place far beyond physical boundaries. While companies want to raise capital around the world, investors try to diversify their investment portfolios by making use of various investment opportunities in these different countries. In this context, many different finan-cial transactions are carried out in many different countries. It will be a complex structure that each company prepares and reports financial statements based on the accounting standards of their own country. A high-quality, internationally comparable and common language accounting and reporting standard is required to assist both companies and investors who want to make certain economic de-cisions (www.ifrs.org; Stolowy et al., 2013: 163).
IFRS aims to provide international comparability to financial markets around the world in addition to the basic principles of corporate governance such as trans-parency and accountability. Many factors such as the elimination of borders, mul-tinational activities of companies, the need for of good quality, understandable, comparable and reliable financial information about the companies that investors want to invest in, the effort to harmonize the accounting and reporting regula-tions in different countries reveal the necessity of IFRS (Elliot and Elliot, 2011: 101; Gökçen et al., 2011: III).
IFRS also provides substantially useful and reliable information about the finan-cial situation, financial performance and cash flows of the enterprise in order to meet the financial information needs of business managers and investors in de-cisions to be made (Alexander et al., 2012: 85).
In line with the features mentioned above, IFRS meets the financial information needs that are useful not only for the managers and investors of the enterprise, but also for all stakeholders of the enterprise. Financial reports created in accordance with IFRS will make a significant contribution to the increase of the quality of financial reporting as it will reduce the level of asymmetric information between
266
THE ROLE OF IFRS AND AUDITING IN CORPORATE GOVERNANCE
Mehmet Nuri SALUR
enterprises and all stakeholders of the enterprises and thus the development of corporate governance practices in that enterprise (Kao and Wei, 2014: 226).
International standardization efforts in financial reporting began with the first World Congress of Accountants (WCOA) meeting held in St. Louis in 1904 by the International Federation of Accountants (IFAC).
It was proposed to establish a committee at the 10th WCOA held in Sydney in 1972, and then a committee called the International Accounting Standards Com-mittee (IASC) was established in London in 1973. Later, this committee was named the International Accounting Standards Board (IASB) in 2001 and con-tinues its activities as an independent regulatory authority that has developed and published IFRSs since then (Aysan, 2007: 20; Kao and Wei, 2014: 228). Adopt-ing to publish standards based on principles rather than rules, this board contin-ues to publish standards regarding financial reporting today by publishing many standards in the historical process. According to a research conducted by the IFRS Foundation in 2017, more than 27.000 of approximately 49.000 local companies traded in 88 major stock exchanges around the world use IFRS. In addition, it has been determined that 900 of the 3.000 foreign companies traded in these 88 large stock exchanges also use IFRS (www.archive.ifrs.org).
3.2. The Role of IFRS in Corporate Governance
The accounting and auditing scandals that emerged in the US and Europe in the 2000s, especially in companies traded on the stock exchange, have led to the questioning of the reliability of the financial reporting of companies. (Karğın et al., 2015: 506). As the reason for these scandals, it is stated that countries and especially enterprises mostly have insufficient corporate governance practices (Alp and Kılıç, 2014: 17). This is because, a well-applicable corporate governance in-creases the quality of the financial reporting process, which is one of the most im-portant reasons of these company scandals, and prevents financial statement ma-nipulations and crucial mistakes in financial statements (Cohen et al., 2004: 87).
The principles of equality, responsibility, accountability and transparency of cor-porate governance serve to increase the quality of financial reporting. A quality financial reporting positively affects the investment, loan and similar resource al-location decisions of the stakeholders, and so this increases market efficiency. Cor-porate governance, which is a very useful tool in terms of establishing investors’

PERSPECTIVES ON MODERN ECONOMY
Aizhan KHOICH, Ali Eren ALPER, Ahmet Arif EREN
267
trust, constitutes the backbone of financial reporting by increasing investors’ per-ception of the reliability of the firm’s financial performance, financial status and cash flows (Norwani et al., 2011: 207; Ebaid, 2013: 264; Özilhan, 2002).
In order to observe the financial reporting process on behalf of the stakeholders, the financial statements should be prepared by the business managers in accord-ance with IFRS and this compliance should be controlled by the independent audit process. Accordingly, considering that the fundamental basis of corporate governance is the protection of stakeholders’ rights, the rights of stakeholders will be protected by reporting in accordance with IFRS. Besides it, in the financial re-porting process, the management will be able to effectively monitored and pre-vented to make material mistakes due to inaccuracies and frauds. (Arsoy, 2008: 20; Karğın et al., 2015: 508). Corporate governance draws its strength from a system that includes accounting applications with these described features. There-fore, it is possible to say that accounting practices and corporate governance prac-tices are in mutual interaction, and good corporate governance must rely on a strong accounting information system that reflects the truths (Aysan, 2007: 17).
The accounting and auditing scandals of the early 2000s made the relationship between corporate governance and IFRS more important, because these scandals revealed the importance of transparency, fair presentation, and a financial report-ing process free from mistakes and frauds for quality financial reporting (Çıtak, 2009: 83; Rezaee, 2003: 1). In this context, IFRS has an important role to com-plement corporate governance practices and at the same time, successful corpo-rate governance ensures quality financial reporting (Lepadatu and Oprea, 2011: 408). Hereby, increasing the quality of financial reporting will be effective in the audit process and as a result, quality financial statements that have been audited will provide an advantage in attracting foreign investors and obtaining low-cost financing. All these statements once again reveal that there is a very close, strong and connected relationship between IFRS and corporate governance (Ataman and Cavlak, 2016: 217-218; Erdikler, 2006: 15).
Conclusion
The understanding of corporate governance reveals a superstructure including all the activities of the companies and emphasizes the necessity to act within the framework of certain principles and rules towards all interest groups involved.

268
THE ROLE OF IFRS AND AUDITING IN CORPORATE GOVERNANCE
Mehmet Nuri SALUR
This understanding reveals the existence of a structuring that emerges as a re-sult of the interaction of all parties. Within this structuring, it is basically pro-jected that companies act within the principles of transparency, accountability, equality and responsibility. Along with the company scandals in the interna-tional arena, fundamental regulations were made in many countries, emphasiz-ing the commitment and loyalty of company employees to the company, and stipulating legal and criminal responsibilities. Countries either make changes in their legislation in order for the corporate governance understanding and principles to be implemented, or regulations such as guidelines, practices and codes for corporate governance understanding are made through self-regula-tory institutions in the country. Thanks to these regulations and intrabusiness improvements, companies that achieve compliance with corporate governance understanding and principles reduce their risk levels, lower capital costs, and companies gain a competitive advantage in the international arena. Thus, com-panies are in a struggle and an effort to take their place in the international fi-nancial system with the awareness of competing in the global world. (Abdi-oğlu, 2007: 282-290).
An indispensable element for a good corporate management system is a solid control mechanism. Internal audit, internal control, independent audit, and all other audit mechanisms help for good corporate governance practices and ensure its continuity. A good control system; ensures that financial information is de-livered to all parties in a timely and accurate manner, enables financial reporting in accordance with standards, thus strengthening the principles of transparency, equality and accountability in businesses. In addition, audit prevents the occur-rence of unrecorded transactions and ensures reliability in data. In addition, an effective auditing system determines how effectively and actively the employees of the company are working, also determines the person responsible for the trans-actions taking place in the company and can call for an account from these per-sons. Thus, the principles of transparency, equality, accountability and responsi-bility will be strengthened and as a result, the level of corporate governance in the business will increase. In addition to all these, auditing allows the establishment and operation of a sound risk management system required for a good corpo-rate management system. Finally, auditing supports corporate social responsibil-ity practices, strengthening internal corporate governance elements in the forma-tion of a reliable corporate image.

PERSPECTIVES ON MODERN ECONOMY
Aizhan KHOICH, Ali Eren ALPER, Ahmet Arif EREN
269
In order for companies to be successful in today’s effective competitive environ-ment emerging with globalization, they need to use corporate governance prac-tices, especially in managerial issues, and IFRS applications in the context of fi-nancial reporting within the accounting information system. Since the use of IFRS in accounting practices and financial reporting will significantly increase the level of demystifying to the public in companies, corporate governance prac-tices will be significantly complied with. The fact that these two applications sup-port each other and then complement each other together with the audit shows that all these applications are in a relationship with each other. It is an undeni-able fact that full implementation of IFRS is needed for a successful audit, and corporate governance principles and practices are needed for the full implemen-tation of IFRS. Many academic studies conducted to reveal the relationship be-tween corporate governance, audit and IFRS also reveal this reality.
As a result, ensuring the sustainability of companies, maintaining their assets in an effective competitive environment will be possible by making financial report-ing on the basis of IFRS based on corporate governance principles in accounting sense and built on these principles. Along with all these practices, the comple-tion of both elements of the audit activities within this framework will add value to the companies in terms of meeting the need for reliable financial information and will contribute to the companies to reach their targets. In order for compa-nies to achieve the goals they set in line with their mission and vision, they must assimilate the supportive and complementary relationship between corporate gov-ernance, IFRS and audit, and shape their managerial and accounting / financial functions within the framework of this internalized relationship.
Moreover, the existence of corporate governance practices in companies will pro-vide significant contributions to the development of capital markets. This is be-cause, companies that have made financial reporting in accordance with IFRS and have good corporate governance practices will be among the companies pre-ferred by investors, as the level of public disclosure and transparency, which are the basic principles of corporate governance, will increase. As a result of these companies being subject to IFRS, having their financial reports audited will also increase the reliability level of financial reports. This will make positive contribu-tions to both companies and the national economy.

270
THE ROLE OF IFRS AND AUDITING IN CORPORATE GOVERNANCE
Mehmet Nuri SALUR
References
Abdioğlu H. (2007). İşletmelerde Kurumsal Yönetim Anlayışı Kapsamında İç Denetimin Rolü ve İMKB-100 Örneği. (Doktora Tezi). Marmara Üniversitesi Sosyal Bilimler Enstitüsü, İstanbul.
Aktan, C., (2013). Kurumsal Şirket Yönetimi. Organizasyon ve Yönetim Bilim-leri Dergisi, 5(1), 150-161. Retrieved from https://dergipark.org.tr/tr/pub/oybd/issue/16341/333493
Alexander, D., Bonaci, C., G., & Mustata, R., V. (2012). Fair Value Measure-ment in Financial Reporting. Procedia Economics and Finance, 3, 84-90. https://doi.org/10.1016/S2212-5671(12)00124-4
Alp, A., & Kılıç, S. (2014). Kurumsal Yönetim Nasıl Yönetilmeli? İstanbul: Doğan Egmont Yayıncılık.
Ataman, B., & Cavlak, H. (2016). Uluslararası Finansal Raporlama Standart-ları ve Kurumsal Yönetim İlişkisi: Borsa İstanbul Kurumsal Yöne-tim Endeksi’ne Tabi Halka Açık Şirketlerde Bir Anket Çalışması. Muhasebe ve Vergi Uygulamaları Dergisi, 9(3), 209-240.
Arı, M., (2008). Kurumsal Yönetim ve Finansal Raporlamanın Güvenirliliği. Eskişehir Osmangazi Üniversitesi İİBF Dergisi, 3(2), 43-68.
Arsoy, A. P. (2008). Kurumsal Şeffaflık ve Muhasebe Standartları. Afyon Ko-catepe Üniversitesi İİBF Dergisi, 10(2), 17-35.
Aysan, M., A. (2007). Muhasebe ve Kurumsal Yönetim. Muhasebe ve Finans-man Dergisi, (35), 17-24.
Baskıcı Ç. (2012). İç Kontrol Sisteminin Kurumsal Yönetim Anlayışındaki Yeri: İMKB Şirketlerinde Bir Uygulama. (Yüksek Lisans Tezi). Ankara Üniversitesi Sosyal Bilimler Enstitüsü, Ankara.
Cohen, J. R., Krishnamoorthy, G., & Wright, A. (2004). The Corporate Governance Mosaic and Financial Reporting Quality. Journal of Accounting Literature, 87-152. Retrieved from http://ssrn.com/ab-stract=1086743
Çıtak, N. (2009). Yaratıcı Muhasebe Hileli Finansal Raporlama Mıdır? Mali Çözüm Dergisi, (91), 81-109.
PERSPECTIVES ON MODERN ECONOMY
Aizhan KHOICH, Ali Eren ALPER, Ahmet Arif EREN
271
Donker, H., & Zahir, S. (2008). Towards an Impartial and Effective Corporate Governance Rating System. Corporate Governance. 8(1), 83-93. https://doi.org/10.1108/14720700810853428
Ebaid, E., I. (2013). Corporate Governance and Investors’ Perceptions of Earn-ings Quality: Egyptian Perspective. Corporate Governance, 13(3), 261-273. https://doi.org/10.1108/CG-02-2011-0011
Elliott, B., & Elliott, J. (2011). Financial Accounting and Reporting, (14th edi-tion). Harlow: Pearson Education.
Erdikler, Ş. (2006). Kurumsal Yönetim ve Uluslararası Yatırımcıların Beklen-tileri. Retrieved from http://www.denetimnet.net/Userfiles/Docu-ments/pdf/sabanerdikler.pdf
Gökçen, G., Ataman, B., & Çakıcı, C. (2011). Türkiye Finansal Raporlama Standartları Uygulamaları. İstanbul: Türkmen Kitabevi.
Haftacı, V. (2016). Muhasebe Denetimi (4. Baskı). Kocaeli: Umuttepe Yayınları.
Hatunoğlu, Z., & Güneş, N. (2012). Kurumsal Yönetim Uygulamalarının Muhasebe Bilgi Sistemine Etkileri, II. Bölgesel Sorunlar ve Türkiye Sempozyumu, 238-244.
Kao, H.S. & Wei, T.H. (2014). The effect of IFRS, information asymmetry and corporate governance on the quality of accounting information. Asian Economic and Financial Review, 4(2), 226-256. Retrieved from http://www.aessweb.com/pdf-files/aefr%204(2),%20226-256.pdf
Karadeniz Y. (2015). 6102 Sayılı TTK Kapsamında Türkiye’de Bağımsız Dene-tim ve Kurumsal Yönetim Uygulamalarının Değerlendirilmesi: Nitel Bir Araştırma. İşletme Araştırmaları Dergisi, 7(4), 313-335.
Karğın, M., Aktaş, R., & Demirel Arıcı, N. (2015). Kurumsal Yönetimin Fi-nansal Raporlama Kalitesindeki Rolü: Borsa İstanbul Üzerine Karşılaştırmalı Bir Uygulama. Yönetim ve Ekonomi: Celal Bayar Üniversitesi İktisadi ve İdari Bilimler Fakültesi Dergisi, 22(2), 501-519.
Lepadatu, G. ve Oprea, A. G. (2011). Corporate Governance and International Financial Reporting Reference (IFRS). The 6th Edition of the In-ternational Conference on European Integration-Realities and

272
THE ROLE OF IFRS AND AUDITING IN CORPORATE GOVERNANCE
Mehmet Nuri SALUR
Perspectives, Romania. Retrieved from http://www.proceedings.univ-danubius.ro/index.php/eirp/article/download/780/707
Memiş, M. Ü. (2016). Kurumsal İşletme Yönetiminde Denetimin Önemi. Ekonomi Bilimleri Dergisi, 8(1), 34-42.
Norwani, N., M., Mohamad, Z., Z., & Chek, I., T. (2011). Corporate Govern-ance Failure and Its Impact on Financial Reporting within Selected Companies. International Journal of Business and Social Sciences, 2(21), 205-213.Retrieved from http://www.ijbssnet.com/journals/Vol_2_No_21_Special_Issue_November_2011/23.pdf
OECD (2004), Retrieved from http://www.tkyd.org/tr/yayinlar-tkyd-yayinlari
Özilhan, T. (2002). Özel Sektörün İhtiyacı: Kurumsal Yönetim. TÜSİAD Görüş Dergisi, No:50, 6-7. Retrieved from https://tusiad.org/tr/yayinlar/gorus-dergisi/item/download/8040_4b4ad0bf1946e0f-0b69248e37b985a45
Palea, V. (2013). Financial Reporting Under IAS/IFRS: Theoretical Background and Capital Market Evidence-A European Perspective. Bern, Swit-zerland: Peter Lang. Retrieved from https://www.researchgate.net/publication/287241619_Financial_reporting_under_IASIFRS_Theoretical_background_and_capital_market_evidence_-_A_Eu-ropean_perspective
Pamukçu, F. (2011). Finansal Raporlama ile Kamuyu Aydınlatma ve Şeffaflık-ta Kurumsal Yönetimin Önemi. Muhasebe ve Finansman Dergisi, (50), 133-148.
Rezaee, Z. (2003). High-Quality Financial Reporting (The Six-Legged Stool), Strategic Finance Magazine. February, 1-4. Retrieved from https://sfmagazine.com/wp-content/uploads/sfarchive/2003/02/High-Quality-Financial-Reporting-The-Six-Legged-Stool.pdf
Selimoğlu, S. K., Özbirecikli, M., Uzay, Ş., Kurt, G., Alagöz, A., & Yanık, S. (2014). Muhasebe Denetimi (4. Baskı). Ankara: Gazi Kitabevi.
Shleifer, A., & Vishny, R. W. (1997). A survey of corporate govern-ance. The journal of finance, 52(2), 737-783. https://doi.org/10.1111/j.1540-6261.1997.tb04820.x

PERSPECTIVES ON MODERN ECONOMY
Aizhan KHOICH, Ali Eren ALPER, Ahmet Arif EREN
273
Stolowy, H., Lebas, M. J., & Ding, Y. (2013). Financial Accounting and Re-porting: A Global Perspective (4th edition). Hampshire: Cengage Learning.
Tanç, G. Ş., & Cingöz, A. (2011). Kurumsal Yönetim ve Çevresel Performans: İMKB’de İşlem Gören Şirketler Üzerine Bir Araştırma. Muhasebe ve Bilim Dünyası Dergisi, 13(4), 203-219.
TKYD ve Deloitte. Retrieved from http://www.tkyd.org/tr/yayinlar-tkyd-yay-inlari.html
TÜRMOB–TESMER, (2013). Mesleki Uyum Eğitimi, Denetim Cilt I, Ankara: Tesmer Yayınları 85.
Usul, H., Titiz, İ., & Burcu, A. (2011). İç Kontrol Sisteminin Kurumsal Yöne-timin Oluşumundaki Etkinliği: Marmara Bölgesi Belediye İşletme-lerine Yönelik Bir Uygulama. Muhasebe ve Finansman Dergisi, (49), 48-54.
www.ifrs.org
www.archive.ifrs.org


SECTION IVMARKETING AND CONSUMER THEORY


277
17REGIONAL DYNAMICS OF PARTNER VIOLENCE AGAINST WOMEN IN TURKEY: AN ECONOMIC PERSPECTIVE Hakan ULUCAN1
Introduction
This study analyzes the regional differences in intimate partner violence against women in Turkey. As a developing country, Turkey has regional diversities in both socio-economic and cultural structures. In the western parts of the country, eco-nomic activities are characterized by industrialization, whereas eastern regions are dominated by more traditional economic activities like agriculture. Sectoral com-position in the region is very important in the regional partner violence rates. Some industries, such as textile and some service sector activities, especially de-mand female labor. Similarly, some agricultural activities also demand more female labor. The intimate partner violence is very sensitive to whether the woman is em-ployed or not. Therefore, living in a region where more female labor is demanded is an important factor determining the dynamics of man-woman relationships.
The regions also vary according to the attitudes towards domestic violence. Pa-triarchal mechanisms remain a significant factor in shaping the dynamics of sex-ual partnerships and marriages. This does not mean that industrialized regions have no patriarchal mechanisms playing a role in partner violence. Although the level is low, intimate partner violence caused by patriarchal mechanisms can also be witnessed in the industrialized regions due to several factors. Firstly, migration flows within the country and also flows from the outside countries in Turkey are very high. This means that the number of people from more traditional struc-tures are not diminishing but growing in the industrialized regions. Secondly, the
1 Assistant Professor, Pamukkale University, Department of Economics, mail:[email protected], phone: +90 258 296 2818, Adresss: Pamukkale University, Kinikli Kampusu,2007, Pamukkale/Denizli.

278
REGIONAL DYNAMICS OF PARTNER VIOLENCE AGAINST WOMEN IN TURKEY: AN ECONOMIC PERSPECTIVE
Hakan ULUCAN
pace of the modernization process in the metropoles is not the same across all so-cio-economic groups. Thus, a part of people still devoted to patriarchal roles even in the industrialized regions.
The development level of the regions is also different across the country. This is not only related to the main economic activities, but also to the institutional quality in the regions. The developed regions require more female labor in more secured conditions, while in underdeveloped regions, there is generally less labor demand for women. Even if equal or more female labor is demanded by the ag-ricultural or informal sector in underdeveloped regions, the job security and in-come of these jobs will be very poor. This means that the household bargain-ing power of the women in the underdeveloped regions are very low. However, this does not necessarily increase domestic violence. Indeed it can actually reduce the violence according to the instrumental theory of violence, which will be dis-cussed in the literature part.
Whatever the results, the regional variation in socio-economic factors create dif-ferent mechanisms influencing the intimate partner violence. This study will ana-lyze both between heterogeneity in intimate partner violence dynamics across the NUTS-1 regions in Turkey and within heterogeneity in the provinces of these regions. In the following section, the literature is covered, and the details about the theoretical economic models about domestic violence are underlined. In the third section, data and methodology issues are discussed. Then, the estimation results are given. The study ends with the conclusion part in which the policy implications are also drawn.
Literature
From a regional perspective, the dynamics of intimate partner violence dynamics change according to the country where the couple lives. In developed countries, the dynamics in the labor market plays the most crucial role. Aizer (2010) shows that, in the US, women living in an area with better labor market conditions ex-perience lower violence in her relationship. By using her household bargaining model, Azier states that the better potential labor market status increases the like-lihood of divorce for women if they are exposed to domestic violence. This is due to the lower costs of exit from marriage in the area with better employment and income opportunities for women. Women, even those who are out of the labor

PERSPECTIVES ON MODERN ECONOMY
Aizhan KHOICH, Ali Eren ALPER, Ahmet Arif EREN
279
force, enjoy better labor market conditions because their husbands should de-crease the violence, foreseeing the probability of divorce. Anderberg et al. (2015) also report a similar finding for the UK, suggesting that a higher female unem-ployment rate increases domestic violence. On the other hand, in underdeveloped or developing countries, some cultural factors such as patriarchal mechanisms, in addition to labor market dynamics, also account for some dynamics in the inti-mate partner violence. Immature institutionalization in these countries results in a lack of mechanisms to empower and protect women against intimate partner violence. Thus, different mechanisms lie behind the dynamics of intimate partner violence in developing countries. Male backlash is one of those mechanisms un-derlined by Chin (2012) in her study using Indian data. Eswaran and Malhorta (2011) emphasize male violence as a tool to get power in the household bargain-ing mechanism in their study for the same country. Both study show that better conditions in the labor market or in income level for women do not necessarily reduce the violence they face from their partners or husbands.
The male backlash mechanism is the negative response of men to empowered women based on a judgment that a more powerful female partner can be a threat to male’s traditional leading role. Patriarchal cultures, which are more dominant in developing or underdeveloped countries, triggers male backlash mechanisms. Maybe, the lack of institutional structure in underdeveloped countries is another reason for the reflection of male backlash in the form of violating behaviors. As an impulse, the male backlash is also included in the minds of westernized men, but the force of law and good institutional structure does not allow them to re-flect this impulse in the form of violence. Eswaran and Malhorta (2011) state that male violence against his partner originates from the evolution process. Ac-cording to this view, males use violence to guarantee his fatherhood of the baby due to the selfishness of the genes. Thus, the woman involved with more inter-actions with the other men will probably be violated more from their husbands. The male backlash mechanism and the mechanism stemming from evolution are very close, both explaining the conditions of the male violence. The evolution perspective explains the origin of the violence, and male backlash is the reflec-tion of the evolutionary origins in today’s world. Education is the most peaceful measure against these kinds of impulses of men, but, due to the problems about the quality and participation of the system, education cannot be effectively used against domestic violence in developing countries.

280
REGIONAL DYNAMICS OF PARTNER VIOLENCE AGAINST WOMEN IN TURKEY: AN ECONOMIC PERSPECTIVE
Hakan ULUCAN
Another study on India, Bloch and Rao (2002) shows that women can even be violated by her husband to seize income from her family. Dowry payments in India are paid by the family of the bride to groom in a manner that payments continue even after the wedding. In this situation, a wife can return to a hostage in the hand of a violent husband, and the dowry payment can return to ransom money demanded from her family. Under this condition, the bribes from wealth-ier families will be violated more. This surprising result shows that a factor, such as having a wealthier family-which is thought to reduce violence in normal life, can be a factor that is actually responsible for the increase in the violence under different customs and patriarchal roles. This also shows the complexity of the problem. The problem is very sensitive to the region of residence.
Heath (2014) shows that female employment increases domestic violence in Bangladesh among those from lower education status and those who are mar-ried at their younger ages. This shows that employment increases the risk of do-mestic violence among women from lower socio-economic classes. These women also have lower bargaining power in the household. Hidrobo (2016) shows that the increased income transfers to the women in Northern Ecuador decreased the probability of being violated by partners.
The general tendency derived from literature is that the game-theoretic and labor market explanations like Aizer (2010) are more prominent in the developed coun-tries, while male backlash, evolutionary perspectives have more explanatory power in the dynamics in the developing countries. However, this does not necessarily mean that there is no male backlash dynamics in the developed countries, and there are no domestic violence trends in the developing countries caused mostly by labor market trends. The countries are regionally segregated. Some regions can be developed while some other regions show the characteristics of a developing country. Besides, some regions can have different cultural attitudes towards do-mestic violence. Also, some trends against feminism, such as the Red-Pill move-ment, can be returned to a massive hate against woman movement even in a de-veloped country. Sometimes, these kinds of movements can explicitly-implicitly be supported by governments even in the developed country, leading to loss of gains of hundreds of years of struggles. In this process, domestic violence can be started to be seen as normal by a mass of people.

PERSPECTIVES ON MODERN ECONOMY
Aizhan KHOICH, Ali Eren ALPER, Ahmet Arif EREN
281
Farmer and Tiefenthaler (1996) show that women who call for shelter protec-tion from the government can be faced with more of domestic violence as a re-sult of reactional behavior from their husbands in the US. Thus, a measure that is assumed to be helpful for violated women can be a reason for being violated more in a mechanism even in a developed country. Farmer and Tiefenthaler’s ex-planation is that the women want shelter protection to show their threat points to their husbands. When a woman without the power to divorce applies to shel-ter protection, the husband can react by using more violence, relying on her in-capability to end the relationship. This means that when an empowered woman, who also has the power to end the relationship, applies to shelter protection, this will be a credible threat to the husband; in the end he should probably re-duce the violence level used on his wife. The study of Farmer and Tiefenthaler is very close to Aizer (2010) in the sense that both studies uses game-theoretical perspectives against domestic violence. On the other hand, the results of Farmer and Tiefenthaler is very intriguing, indicating that even in a developed country, women can be in danger.
Iyengar (2009) shows another evidence of a violent reaction to a policy designed to lower domestic violence. The mandatory arrestment laws in the US increased the female homicides in the families due to two mechanism emerged as a result of the policy. Firstly, women decrease their calls for police even when they are vi-olated to protect their husbands or partners from prison. Thus, without the in-tervention of the police, more incidents result in homicides. Secondly, under the probability of arrest, some men reacted to their partner in retaliation when their wives complained to the police about their violence.
There are few studies using a regional perspective on domestic violence in Tur-key. Tumen and Ulucan (2019) analyze the effects of a policy, panic buttons, on two chosen pilot regions in Turkey, Adana and Bursa. The buttons are distrib-uted to the women in the region by the institutions of the Turkish government in order for them to call for the security forces suddenly in a case of domestic violence against them. According to the study, the policy produced negative re-sults, increasing domestic violence in the region, mainly due to male backlash effects. Erten and Keskin (2019) examine the effects of the Syrian influx to Tur-key, which is initiated with the civil war in Syria and increased throughout the midst of the last decade, on domestic violence against women. By exploiting the the provincial level variation in the number and rates of the Syrian immigrants,

282
REGIONAL DYNAMICS OF PARTNER VIOLENCE AGAINST WOMEN IN TURKEY: AN ECONOMIC PERSPECTIVE
Hakan ULUCAN
they show that although the influx undermined Turkish women in the labor market, domestic violence on Turkish women decreased due to the influx. This is mostly due to the fact that Turkish men use violence on their partners as an instrument to increase their bargaining power. Having excluded from the labor market, Turkish women with lower bargaining power experienced lower domes-tic violence incidents. Erten and Keskin (2018) analyze the effects of education on domestic violence against women by using the discontinuity created by 1998 compulsory education reform in Turkey. They show that the reform increased the completed years of education among the women in Turkey, but psychologi-cal violence on them also increased. They explained this phenomenon by using instrumental theories on violence.
Data And Methodology
2008 and 2014 National Surveys on Domestic Violence against Women (NS-DVW) released by Turkstat are used in the study. The data presents represent-able information about women in Turkey. The information contains socio-eco-nomic characteristics such as education and the labor market status of women. The data also presents information about whether the corresponding respondent is exposed to intimate partner violence from her partner in general and in the last year from the survey date. If the woman reports that she was violated, then the information about the level of violence, how many times she was exposed to vi-olence, is asked. The data set is very rich in terms of the type of violence that it covers. Physical, psychological, sexual, and economic violence types are covered by the survey. In general, physical violence is the main focus of the studies in the literature. This study also follows the literature in this sense by focusing on phys-ical violence. The physical violence question asks whether her partner or husband slapped, pushed, punched, attacked, kicked, beat, or grabbed the respondent or whether pulled her hair, hit with an item to her, threatened her with a gun or knife, or burned a part of her body. If the corresponding woman is faced with at least one of these violent acts from the partner or husband, then the number of times is recorded to the survey. The survey also presents other violence types, sexual, psychological, and economic types. In Table 1, the last year violence rates by NUTS-1 regions are presented. The violence rates calculated according to the intimate partner violence at a point in time is presented in Table 2.

PERSPECTIVES ON MODERN ECONOMY
Aizhan KHOICH, Ali Eren ALPER, Ahmet Arif EREN
283
In Table 1, the changes in intimate partner violence in the last year from the date of the survey can be analyzed. The first two columns represent the physi-cal violence in 2008 and 2014. The following columns are for sexual and eco-nomic violence, orderly. TR7 and, TRA, and TRC regions have the highest phys-ical intimate partner violence in the country. TR2 and TR3 regions experienced a significant increase in intimate partner violence rates. On the other hand, most regions achieved a decline in intimate partner violence in the last year. TRC is the region with the highest decline, from 15.6 percent to 6.2 percent. In TRA, the rate is decreased from 12.9 percent to 6.7 percent. An overall reduction in intimate partner violence in the last year can partly be related to the institutional improvements, such as participation in the Istanbul Convention and the adop-tion of the law on Protection of Family and Prevention of Violence against Fe-males in 2012 (Republic of Turkey Ministry of Family and Services, 2016). The foundation of violence prevention centers based on the law is another improve-ment (Republic of Turkey Ministry of Family and Services, 2016).
The reductions achieved in the physical partner violence could not be achieved in the sexual partner violence, which can be seen in Table 1. TRA, with one of the highest decline in the last year physical violence, shows similar success in sexual violence, which was reduced from 13 percent to 6.7 percent. Economic violence increased from 2008 to 2014 in the regions except for regions TR7, TRA, TRB, and TRC. This can be due to the higher participation of women in economic activities. The partner or the husband of the participated woman increase his ef-forts to seize her income. The negative correlation between economic violence and physical violence can indicate that physical violence is used when economic violence is not used. In other words, the male partner or husband can be using physical violence when he was not able to seize the income of his wife or partner.

284
REGIONAL DYNAMICS OF PARTNER VIOLENCE AGAINST WOMEN IN TURKEY: AN ECONOMIC PERSPECTIVE
Hakan ULUCAN
Table 1: The Last Year Intimate partner Violence Rates by Regions.
Nuts 1 Region Physical Violence
Sexual Violence
Econ. Violence
2008 2014 2008 2014 2008 2014
TR1 (Istanbul) 0.080 0.088 0.035 0.042 0.110 0.124
TR2 (West Marmara) 0.043 0.079 0.031 0.035 0.069 0.089
TR3 (Agean) 0.058 0.098 0.042 0.043 0.068 0.117
TR4 (East Marmara) 0.057 0.051 0.040 0.036 0.111 0.126
TR5 (West Anatolia) 0.096 0.086 0.049 0.044 0.116 0.121
TR6 (Mediternian) 0.099 0.068 0.055 0.046 0.134 0.145
TR7 (Mid-Anatolia) 0.116 0.091 0.093 0.034 0.139 0.116
TR8 (West Black Sea) 0.069 0.072 0.062 0.040 0.107 0.117
TR9 (East Black Sea) 0.049 0.044 0.062 0.044 0.097 0.103
TRA (North-East Anatolia) 0.129 0.067 0.130 0.067 0.152 0.150
TRB (Mid-East Anatolia) 0.103 0.056 0.082 0.043 0.128 0.127
TRC (South-East Anatolia) 0.156 0.062 0.105 0.052 0.153 0.137
Source: Author’s own calculations using NSDVW.
In this study, the incidence of physical domestic violence, rather than the level of it, is focused. This means that a dummy variable is constructed, represent-ing whether the corresponding women are exposed to physical violence. This dummy variable takes the value 0 if the women experience no physical vio-lence. Similarly, the dummy is 1 if the women is exposed to physical violence. In the descriptive analysis, the information on the violence in general and vi-olence in the last year is provided. In the estimation part, the attention is fo-cused on the violence in the last year from the survey date since the violence at a point in time is more cloudy.
The linear probability model is used in the estimations. The last education de-gree held by the women, whether the women is worked in the last week from the

PERSPECTIVES ON MODERN ECONOMY
Aizhan KHOICH, Ali Eren ALPER, Ahmet Arif EREN
285
survey date, the sector of the women in her last job if she has an employment ex-perience, and the NUTS-3 province level of her are included in the equation of estimation. Equation 1 shows the econometric specification. X shows the char-acteristics of the women, including education level, employment status-whether she worked last week from the survey date, her bargaining power variables, and sector of her last job if she has a work experience. are year and province fixed effects respectively.
(1)
The robust estimations are run separately for each NUTS-1 region. Turkey uses the regional classification system according to the standards of the European Un-ion. NUTS-3 classification gives the most detailed regional classification, present-ing the provinces in Turkey. Turkey has 81 provinces. NUTS-2 definition provides one level broader category, separating the country into 26 regions by combining several provinces in the same geographical location. NUTS-1 level is the broad-est category, which combines NUTS-2 regions from the same main area, split-ting the country into 12 regions. This means that 12 different estimations are conducted in the study. By including the provincial fixed effects in each region, the regional dynamics through a more detailed category are observed. Figure 1 shows the NUT-1 regions in Turkey on the map. Table 3, on the other hand, shows the provinces in each region.

286
REGIONAL DYNAMICS OF PARTNER VIOLENCE AGAINST WOMEN IN TURKEY: AN ECONOMIC PERSPECTIVE
Hakan ULUCAN
Table 2: Intimate Partner Violence Rates by Regions.
Nuts 1 Region Physical Violence
Sexual Violence Economic Violence
2008 2014 2008 2014 2008 2014
TR1 (Istanbul) 0.284 0.259 0.094 0.101 0.275 0.243
TR2 (West Marmara) 0.218 0.259 0.074 0.102 0.217 0.234
TR3 (Agean) 0.296 0.331 0.128 0.100 0.217 0.284
TR4 (East Marmara) 0.305 0.268 0.094 0.080 0.267 0.262
TR5 (West Anatolia) 0.389 0.329 0.131 0.107 0.254 0.268
TR6 (Mediternian) 0.342 0.310 0.130 0.104 0.254 0.287
TR7 (Mid-Anatolia) 0.439 0.383 0.195 0.100 0.272 0.257
TR8 (West Black Sea) 0.365 0.332 0.151 0.105 0.256 0.241
TR9 (East Black Sea) 0.299 0.237 0.138 0.081 0.238 0.225
TRA (North-East Anatolia) 0.432 0.335 0.211 0.129 0.259 0.255
TRB (Mid-East Anatolia) 0.370 0.262 0.148 0.089 0.257 0.206
TRC (South-East Anatolia) 0.406 0.260 0.164 0.0922 0.257 0.222
Overall
Source: Author’s own calculations using NSDVW.
Figure 1: Regional classification of Turkey in NUTS-1 level

PERSPECTIVES ON MODERN ECONOMY
Aizhan KHOICH, Ali Eren ALPER, Ahmet Arif EREN
287
Table 3: Provinces in each Nuts-1 Region
Provinces by Regions
TR1 TR2 TR3 TR4 TR5 TR6 TR7 TR8
Istanbul
TR9Artvin
GiresunGumushane
OrduRize
Trabzon
TekirdagEdirne
KirklareliBalıkesir Balıkesir
Çanakkale
TRAErzurumErzincanBayburt
AgriKarsIgdir
Ardahan
AydınDenizliMuğlaManisaAfyon
KütahyaUşak
TRBMalatyaElazigBingolTunceli
VanMusBitlis
Hakkari
Bursa EskişehirBilecik KocaeliSakarya
BoluYalova
TRCAdiyaman
KilisSanliurfa
DiyarbakirMardinBatmanSirnakSiirt
Ankara Konya
Karaman
AntalyaIspartaBurdurAdanaMersinHatay
K.MarasOsmaniye
KirikkaleAksarayNigde
NevşehirKirsehirKayseriYozgat
ZonguldakKarabukBartin
KastamonuCankiriSinop
SamsunTokat
CorumAmasya
Source: TurkStat
Estimation Results
Table 4 and Table 5 show the estimation results. Provincial fixed effects of the same regressions are given by Table 6, 7, and 8. When the educational variables are considered, for almost all regions, intimate partner violence decreases as edu-cation level increases. However, the significance of the parameters is varying ac-cording to the regions. Education level starts to decrease violence significantly with or after a high school degree. It is very surprising that Primary and second-ary schools make no difference in domestic violence except TRB and TRC re-gions, which are among the most underdeveloped regions in the country. This can indicate that in developed regions, education makes a difference only after a level in the labor market. The coefficient of high school education is significant for TR2, TR3, TR4, TR5 regions, which are the regions with industry as a main economic activity. This means that, in industrialized regions, having graduated from high school increases the bargaining power of women, decreasing the level of violence they face. The estimated parameter of a college degree is insignifi-cant for five regions, TR2, TR3, TR5, TR8 TR9. The parameter is negative and

288
REGIONAL DYNAMICS OF PARTNER VIOLENCE AGAINST WOMEN IN TURKEY: AN ECONOMIC PERSPECTIVE
Hakan ULUCAN
significant for the rest of the regions, indicating that a college degree decreases the probability of intimate partner violence for women.
Table 4: Estimation Results for the First 6 Regions
Nuts 1 Region
TR1 TR 2 TR 3 TR 4 TR 5 TR 6
Education Var.
Primary Sch. -0.013 (0.045)
-0.032 (0.032)
0.017 (0.022)
-0.044 (0.029)
0.008 (0.028)
-0.027 (0.021)
Secondary Sch. -0.021 (0.045)
-0.005 (0.037)
0.013 (0.026)
-0.003 (0.035)
-0.006 (0.034)
-0.008 (0.027)
High Sch. -0.029 (0.045)
-0.062* (0.032)
-0.048* (0.027)
-0.063** (0.031)
-0.053* (0.030)
-0.005 (0.025)
College -0.085* (0.043)
-0.036 (0.036)
-0.019 (0.027)
-0.060* (0.033)
-0.052 (0.034)
-0.053* (0.029)
College plus
Labor Market and Bargaining Var.
-0.098** (0.042)
0.115*** (0.032)
-0.054* (0.028)
- -0.104** (0.033)
-0.10*** (0.025)
Worked last week
-0.011 (0.033)
0.009 (0.018)
0.0177 (0.028)
-0.005 (0.024)
-0.099*** (0.0344)
0.007 (0.024)
Spend all income
-0.021 (0.020)
-0.012 (0.016)
0.0166 (0.020)
-0.046 (0.019)
-0.031 (0.025)
-0.041* (0.023)
2014 0.014 (0.018)
0.044*** (0.014)
0.044** (0.014)
-0.005 (0.013)
-0.001 (0.017)
0.028 (0.013)
Sector
Industry 0.047 (0.064)
-0.033 (0.037)
-0.036 (0.045)
0.097* (0.051)
0.064 (0.081)
0.079 (0.089)
Services 0.029 (0.048)
0.014 (0.020)
0.002 (0.029)
0.038 (0.028)
0.039 (0.038)
0.029 (0.029)
# observations 960 1387 1448 1244 1349 1836
Note: *, **, *** show the significance level of 10 %, 5 %, and 1 %, orderly. Standard errors are presented in parenthesis.

PERSPECTIVES ON MODERN ECONOMY
Aizhan KHOICH, Ali Eren ALPER, Ahmet Arif EREN
289
It is interesting to note that working in the survey week does not matter in the regions except the TR5 and TRA regions. This shows that employed women are also vulnerable to violence. In Turkey, women generally participate in the infor-mal sector. Insecure job conditions with very low payments may not have ensured enough bargaining power for women in the household. When the results on ed-ucation variables and labor market variables are considered together, we can see that potential status in the labor market matters more than actual status, validat-ing the hypothesis of Aizer (2010). The coefficients of the variable included in es-timations as a proxy for the power of the woman in the household, whether the corresponding women can spend her own income without any information, are insignificant for the regions only apart from TR6. The sector information about the woman’s last experience shows that only a few sector coefficients are signifi-cant. In the TR4 region, one of the industrialized regions in Turkey, industry in-creases domestic violence relative to agriculture, whereas, in the regions with more agricultural activity, industry decreases domestic violence relative to agriculture.
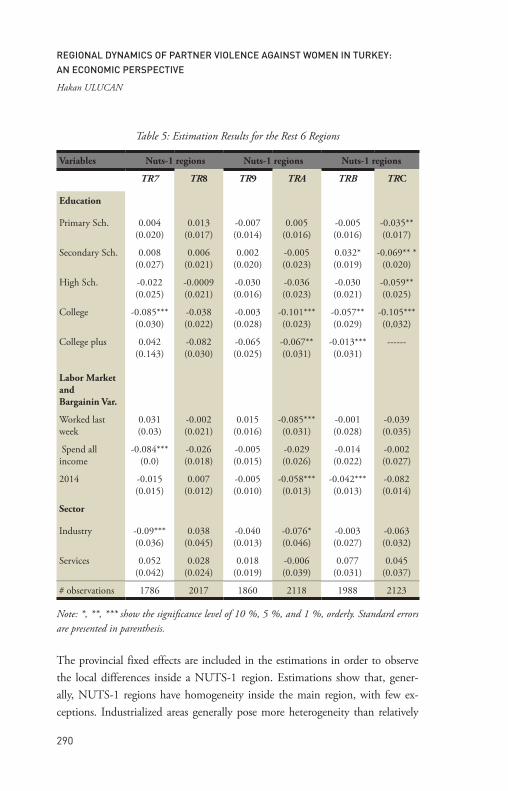
290
REGIONAL DYNAMICS OF PARTNER VIOLENCE AGAINST WOMEN IN TURKEY: AN ECONOMIC PERSPECTIVE
Hakan ULUCAN
Table 5: Estimation Results for the Rest 6 Regions
Variables Nuts-1 regions Nuts-1 regions Nuts-1 regions
TR7 TR8 TR9 TRA TRB TRC
Education
Primary Sch. 0.004 (0.020)
0.013 (0.017)
-0.007 (0.014)
0.005 (0.016)
-0.005 (0.016)
-0.035** (0.017)
Secondary Sch. 0.008 (0.027)
0.006 (0.021)
0.002 (0.020)
-0.005 (0.023)
0.032* (0.019)
-0.069** * (0.020)
High Sch. -0.022 (0.025)
-0.0009 (0.021)
-0.030 (0.016)
-0.036 (0.023)
-0.030 (0.021)
-0.059** (0.025)
College -0.085*** (0.030)
-0.038 (0.022)
-0.003 (0.028)
-0.101*** (0.023)
-0.057** (0.029)
-0.105*** (0,032)
College plus
Labor Market and Bargainin Var.
0.042 (0.143)
-0.082 (0.030)
-0.065 (0.025)
-0.067** (0.031)
-0.013*** (0.031)
------
Worked last week
0.031 (0.03)
-0.002 (0.021)
0.015 (0.016)
-0.085*** (0.031)
-0.001 (0.028)
-0.039 (0.035)
Spend all income
-0.084*** (0.0)
-0.026 (0.018)
-0.005 (0.015)
-0.029 (0.026)
-0.014 (0.022)
-0.002 (0.027)
2014 -0.015 (0.015)
0.007 (0.012)
-0.005 (0.010)
-0.058*** (0.013)
-0.042*** (0.013)
-0.082 (0.014)
Sector
Industry -0.09*** (0.036)
0.038 (0.045)
-0.040 (0.013)
-0.076* (0.046)
-0.003 (0.027)
-0.063 (0.032)
Services 0.052 (0.042)
0.028 (0.024)
0.018 (0.019)
-0.006 (0.039)
0.077 (0.031)
0.045 (0.037)
# observations 1786 2017 1860 2118 1988 2123
Note: *, **, *** show the significance level of 10 %, 5 %, and 1 %, orderly. Standard errors are presented in parenthesis.
The provincial fixed effects are included in the estimations in order to observe the local differences inside a NUTS-1 region. Estimations show that, gener-ally, NUTS-1 regions have homogeneity inside the main region, with few ex-ceptions. Industrialized areas generally pose more heterogeneity than relatively

PERSPECTIVES ON MODERN ECONOMY
Aizhan KHOICH, Ali Eren ALPER, Ahmet Arif EREN
291
underdeveloped regions of central and eastern Anatolia. Table 6, 7, and 8 show the province fixed effects in our estimations. Since the provincial variables are included in the dummy variable form, reference groups are given at the end of each column. In the TR2 region, only Tekirdag have different estimated param-eter from the reference province, Balıkesir. The province is very close to Europe. In the TR3 region, in Aydın, İzmir, and Manisa, domestic violence is lower than the region by approximately 10 percent for all regions. It is not surprising when the fact that these are the developed provinces are the country is taken into ac-count. The surprising one is the higher domestic violence in Denizli and Mugla, which are also the developed provinces in the region. TR4 and TR5 regions are homogenous within their geographical borders, without any provinces showing a statistically different pattern.
Table 6: Provincial Fixed Effects I
Regions Regions Regions
TR2 Coefficients TR3 Coefficients TR4 Coefficients TR5 Coefficients
TekirdagCanakkale
EdirneKirklareliTekirdag
RG:Balikesir
0.23-0.026-0.023-0.034
-0.045***
AydinDenizliİzmir
KutahyaManisaMuglaUsakRG
Afyon
-0.12***-0.031
-0.097**-0.038-0.10**-0.0650.02
BoluBursaDuzceE.SehirKocaeliSakaryaYalova
RG Bilecik
0.0080.0040.0120.0080.000-0.0260.04
Karaman Konya
Rg: Ank
0.082-0.019
Note: *, **, *** show the significance level of 10 %, 5 %, and 1 %, orderly.
In the TR6 region, K. Maras shows a different pattern, higher domestic violence than the other provinces within the region. K.Maras is the closest city in the re-gion to the Southeastern Anatolia, indicating that the province is not only loca-tionally but also culturally closer to southeastern Anatolia. This means that the city poses more patriarchal dynamics. TR6, TR7, TR8, and TR9 regions, central and northern Anatolian regions are homogeneous within their borders, with the cities being very identical in terms of the domestic violence incidents.

292
REGIONAL DYNAMICS OF PARTNER VIOLENCE AGAINST WOMEN IN TURKEY: AN ECONOMIC PERSPECTIVE
Hakan ULUCAN
Table 7: Provincial Fixed Effects II
Regions Regions Regions
TR6 Coefficients TR7 Coefficients TR8 Coefficients TR9 Coefficients
Antalya Burdur HatayIcel
IspartaK.Maras
OsmaniyeRG Adana
-0.014-0.034-0.0000.004-0.0380.047*-0.035
KayseriKirikkaleKirsehirNevsehir
NigdeSivas
YozgatRG Aksaray
0.008-0.004-0.004-0.057-0.027--0.029-0.023
BartinCankiriCorumKarabuk
KastamonuSamsunSinopTokat
ZonguldakRG:
Amasya
-0.0190.0770.023-0.0370.015-0.002-0.0090.004-0.002
Giresun Gumushane
OrduRize
TrabzonRG: Artvin
0.0090.0230.016-0.0210.001
Toplam 998 908
Note: *, **, *** show the significance level of 10 %, 5 %, and 1 %, orderly.
In the TR10 region, Bayburt is lower than, while Igdir is higher than the refer-ence group. The fixed effects of the other provinces are statistically insignificant, indicating that only Bayburt and Igdir is different from the regional average. The provinces of the TR11 region are identical in terms of the domestic violence dy-namics, without any province with a significantly different estimate from the ref-erence group. In TR12, only Gaziantep’s parameter is different from the reference province; domestic violence is higher in this province than the reference prov-ince and regional average. Gaziantep is one of the most affected provinces from the Syrian refugee flow, not only in its region but also in the country. The Syrian workers may have disproportionately excluded a significant number of Turkish women from the market. Although Erten and Keskin (2019) found the opposite, in Antep, Turkish women may have faced with more domestic violence, having lower bargaining power due to exclusion from the employment.

PERSPECTIVES ON MODERN ECONOMY
Aizhan KHOICH, Ali Eren ALPER, Ahmet Arif EREN
293
Table 7: Provincial Fixed Effects III
Regions Regions Regions
TR10 Coefficients TR11 Coefficients TR12 Coefficients
Ardahan BayburtErzincanErzurum
IgdirKars
RG: Agri
-0.035-0.067**-0.034-0.0150.057*0.008
BitlisElazig
HakkariMalatya
MuşTunceli
VanRG Bingol
0.0580.024-0.0110.0300.0080.0020.029
BatmanDiyarbakir Gaziantep
KilisMardin
SanliurfaSiirt
SirnakRG:
Adiyaman
0.0520.014
0.060**-0.024-0.0120.003-0.0030.028
Toplam 998 908
Note: *, **, *** show the significance level of 10 %, 5 %, and 1 %.
Conclusion
In this study, the regional differences in the dynamics of domestic violence are analyzed by using NSDVW data set for the years 2008 and 2014. The regional intimate partner violence rates in terms of physical, sexual, and economic are very high in Turkey, as shown by the descriptive statistics calculated by using the mi-cro data set of the study. The heterogeneity in intimate partner violence against women between the regions is examined by running separate regressions for each NUTS-1 region. In the regressions, only physical violence is focused. In this way, 12 separate regressions are conducted. Province fixed effects are included in the regressions in order to capture within heterogeneity in intimate partner vio-lence dynamics in a NUTS-1 region. The estimations show that there are barri-ers against the violence reducing effects of the education. The levels lower than high school barely reduces the probability of being violated by the partner. Even the high school degree significantly reduces domestic violence only in the west-ern and industrialized parts of the country with the exception of South East Ana-tolia, the TRC region, where even the primary school degree reduces domestic violence relative to the women without any degree. In the central and northern parts of the Anatolia, the education level lower than a college degree hardly re-duces the probability of being violated from husband or partner. This calls for a

294
REGIONAL DYNAMICS OF PARTNER VIOLENCE AGAINST WOMEN IN TURKEY: AN ECONOMIC PERSPECTIVE
Hakan ULUCAN
need to design some policies and establish some institutions helping the women faced with the danger of being violated by their husbands or partners.
Indeed, there were some efforts that deserve attention in the first part of the last decade. Participation as a leading country in the Istanbul Convention was an important step. This was followed by the adoption of the law on Protection of Family and Prevention of Violence against Females in 2012. As the data section shows, these policies are probably the main factor in reducing the physical vio-lence rates in the regions. Istanbul Convention and the law have empowered the women in some specific ways. For example, the law imposed the eviction of the violent husband from the marital home. Precisely for the same reason, the law and convention attracted reactions of some conservative and patriarchal parts of the country. This reaction has returned to an opposition movement against the Istanbul Convention and the law. The opposition defended their ground by ar-guing that the measures against domestic violence have harmed the family, the core of Turkish society. The Turkish government is under a great pressure from these parts of the community. For the time being, the government has not taken any steps satisfying the opposition to the convention and law but the probabil-ity to take a step back is not negligible since the government is also conservative and needs the support of conservative parts of the country. On the other hand, this study shows that the education system has little effect on reducing intimate partner violence, and there is a need for continuation steps like the law and the Istanbul Convention.
References
Anderberg, D., Rainer, H., Wadsworth, J., & Wilson, T. (2016). “Unemploy-ment and domestic violence: Theory and evidence.” The Economic Journal, 126(597), 1947-1979.
Aizer, A. (2010): “The gender wage gap and domestic violence,” American Eco-nomic Review, 100, 1847–59.
Bloch, F. and V. Rao (2002): “Terror as a bargaining instrument: A case study of dowry violence in rural India,” American Economic Review, 92, 1029–1043.

PERSPECTIVES ON MODERN ECONOMY
Aizhan KHOICH, Ali Eren ALPER, Ahmet Arif EREN
295
Chin, Y.-M. (2012): “Male backlash, bargaining, or exposure reduction?: wom-ens working status and physical spousal violence in India,” Journal of population Economics, 25, 175–200.
Erten, B. and P. Keskin (2018): “For better or for worse?: Education and the prevalence of domestic violence in Turkey,” American Economic Journal: Applied Economics, 10, 64–105.
Erten, B. and P. Keskin (2019): “Female Employment and Intimate Partner Violence: Evidence from Syrian Refugee Inflows to Turkey,”.
Eswaran, M. and N. Malhotra (2011): “Domestic violence and women’s auton-omy in developing countries: theory and evidence,” Canadian Jour-nal of Economics/Revue canadienne d” economique, 44, 1222–1263.
Farmer, A. and J. Tiefenthaler (1996): “Domestic violence: the value of services as signals,” The American Economic Review, 86, 274–279.
Heath, R. (2014). Women’s access to labor market opportunities, control of household resources, and domestic violence: Evidence from Bang-ladesh. World Development, 57, 32-46.
Hidrobo, M., A. Peterman, and L. Heise (2016): “The effect of cash, vouchers, and food transfers on intimate partner violence: evidence from a randomized experiment in Northern Ecuador,” American Economic Journal: Applied Economics, 8, 284–303.
Iyengar, R. (2009): “Does the certainty of arrest reduce domestic violence? Ev-idence from mandatory and recommended arrest laws,” Journal of public Economics, 93, 85–98.
Republic of Turkey Ministry of Family, L. and S. Services (2016): “Kadina Yon-elik Siddetle Mucadele Ulusal Eylem Plan 2016-2020,” Tech. rep., Republic of Turkey Ministry of Family, Labour and Social Services.
Tumen, S. and H. Ulucan (2019): “Empowered or Impoverished: The Impact of Panic Buttons on Domestic Violence,” IZA DP No. 12847


297
18THE ROLE OF CONSUMER PERCEPTIONS OF SOCIAL RESPONSIBILITY PROJECTS ON CONSUMER-BASED BRAND EQUITY: AN EXAMPLE OF A LARGE-SCALE COMPANY1
Murat Çakırkaya2
1. Introduction
CSR is the process of treating an organization’s stakeholders in an ethical or re-sponsible manner. “Ethically or responsible” means treating key stakeholders in a way that is considered acceptable to international norms. It also includes “eth-ically or responsible” social, economic, financial and environmental responsibil-ity. The broader purpose of CSR is to establish higher sustainability standards (Hopkins, 2006: 298).
The survival and wealth of a company is determined by its ability to create su-perior value to the market. Poolthong and Mandhachitara (2009: 408) empha-sized that CSR initiatives are a powerful tool in creating quality and brand effect perceived by the consumer. They also revealed that CSR initiatives affect per-ceptions of service quality, and at the same time increase consumers’ trust in in-stitutions and have a positive effect on their emotional attitudes. Employee loy-alty, brand image, customer loyalty and increase in market share are some of the reported positive results of the relationship between CSR and brand influence (Hassan et al., 2013: 121).
A brand can attract consumers or drive them away. The reason behind this is the perception of the value that consumers attribute to this brand. At first, a brand
1 This study was supported within the scope of the project number 201212001 accepted by Necmettin Erbakan University Scientific Research Projects Commission.
2 Necmettin Erbakan University

298
THE ROLE OF CONSUMER PERCEPTIONS OF SOCIAL RESPONSIBILITY PROJECTS ON CONSUMER-BASED BRAND EQUITY: AN EXAMPLE OF A LARGE-SCALE COMPANY
Murat Çakırkaya
can be identified with the product it produces, but this brand may develop asso-ciations and loyalties beyond that product over time. Advertisements and usage experience etc. factors play an important role in the formation of these associa-tions and attachments (Keller & Lehmann, 2006: 745).
The question of whether the consumer perceptions of Turkcell’s corporate social responsibility projects, operating in the mobile communication sector, have any role on Turkcell’s consumer-based brand equity is the main question of the study. Another aim of the study is to determine the effect level of consumer percep-tions of CSR practices on consumer-based brand equity perceptions. Charitable responsibilities, such as generating benefits for the community, making donations to charities and improving the well-being of the local community can positively affect a company’s image (M.C.Kim & Kim, 2014: 120).
2. Literature Review2.1. Corporate Social Responsibility (CSR)
CSR efforts have been analyzed from various angles. For example, some research-ers have discussed the relationship between CSR efforts and corporate financial performance. In studies conducted in this field, the link between CSR efforts and the financial success of a company has been revealed (Lee 2008: 64). On the other hand, marketing researchers primarily focused on the effects of CSR efforts on consumers. In addition, the impact of CSR studies on business to customer (B2C) and business to business (B2B) marketing activities was also examined. In this context, the effects of CSR on customer expectations and perceptions have been investigated (Staudt et al., 2014: 67). In addition, CSR studies have gained importance in other functional areas. For example, CSR efforts in the field of human resources management are regarded as a means of determining best prac-tices for implementing CSR activities in the workforce, as well as attracting em-ployees (Strandberg 2009: 23).
If it is examined in terms of the parties affected by CSR activities, four types of CSR activities can be mentioned.
2.1.1. Respect for Society (Charity) ActivitiesIn the charity dimension, the aim is to give the company an image of a socially sensitive institution among members of the society. At this point, it should be followed how the company conducts its charity in a way that benefits the society

PERSPECTIVES ON MODERN ECONOMY
Aizhan KHOICH, Ali Eren ALPER, Ahmet Arif EREN
299
(Moreira, 2016: 11). The company’s charitable activities include helping develop-ing countries, supporting social and cultural activities in the countries and regions where it operates, developing projects for poor countries and supporting charity.
2.1.2. Respect for Environment
The essence of this dimension is based on sustainability. On the other hand, al-though it is said that this dimension is a derivative of the environmental move-ment, its scope has expanded much more and has become an indispensable field for stakeholders (Moreira, 2016: 11). If the environmental effects of the activi-ties carried out by the enterprises are in question, they are expected to measure how these activities affect the environment. This is usually done in the form of a cost-benefit analysis while utilizing natural resources (Boachie-Mensah & Ye-boah, 2015:152). The second issue is the evaluation of environmental responsi-bility within the framework of a “win-win” mentality. Uddin et al (2008: 207) stated that companies that are committed to environmental management get the positive results of these activities. There are also studies that show that a respon-sible public image can attract more customers. In addition, environmental aware-ness will offer businesses new market opportunities.
2.1.3. Respect for Consumers
It is observed that customers are becoming more conscious about purchasing products from companies that follow a reliable CSR policy. For this reason, the importance of addressing customers with visible CSR projects is increasing day by day. As a matter of fact, such a strategy positively affects the decisions of the customers and gives an opportunity to gain on brand equity (Torres et al., 2012: 15). As a matter of fact, as a result of a study, the results showed that CSR activ-ities increase brand equity and purchase intention (Park, 2014: 189).
2.1.4. Respect for Employees
Strong CSR performance can lead to employee benefits and increase employee morale (Tuzzolino & Armandi, 1981: 21; Valentine & Fleischman, 2008: 159). Different CSR practices, such as meeting trade union demands, providing bet-ter healthcare and retirement benefits, and paying higher-than-market wages, can help companies build their reputation in increasing employee productivity.

300
THE ROLE OF CONSUMER PERCEPTIONS OF SOCIAL RESPONSIBILITY PROJECTS ON CONSUMER-BASED BRAND EQUITY: AN EXAMPLE OF A LARGE-SCALE COMPANY
Murat Çakırkaya
In addition, it may be possible for more talented and more motivated personnel to turn to the company (Malik, 2015: 429).
2.2. Consumer-Based Brand Equity
There are two different approaches to the concept of brand equity: compa-ny-based brand equity and consumer-based brand equity. The distinction be-tween these perspectives depends on the actors using the concept of brand equity, the measurement goals and the ultimate goal (Atılgan et al., 2009, 116). Com-pany-based brand equity measures the total value of a brand as a separate asset (Christodoulides & de Chernatony, 2010: 45). Atilgan et al. (2009, 115) point out that company-based brand equity mostly uses financial market data. The con-sumer-based brand value perspective focuses on the customer’s brand idea. It is considered the driving force of the brand’s increasing market share and profita-bility and is based on the connotations and beliefs of consumers (Christodoulides and de Chernatony 2010, 44).
Aaker (1992: 125) determined that, in the formation of a brand equity, there were five general categories belonging to the brand’s assets. These are: (1) brand loyalty, (2) brand awareness, (3) perceived quality, (4) brand association in addi-tion to perceived quality, and (5) registered brand assets such as patents, trade-marks, and established channel relationships.
3. The Methodology of The Research3.1. Scale and Hypotheses
The question of whether the consumer perceptions of Turkcell’s corporate social responsibility projects, operating in the mobile communication sector, have any role on Turkcell’s consumer-based brand equity is the main question of the study. Another aim of the study is to determine the effect level of consumer perceptions of CSR practices on consumer-based brand equity perceptions. The universe of the research is composed of Turkcell subscribers residing in Konya. However, within the scope of the research, it is not possible to reach all Turkcell subscribers resid-ing in Konya due to some constraints such as cost, time limit and difficulty in accessing participants. For this reason, the research was carried out by using pur-poseful sampling method from non probabilistic sampling types. Therefore, the generalizability and external validity of research results are limited. Another lim-itation is that the research is a cross-sectional study in the context of handling

PERSPECTIVES ON MODERN ECONOMY
Aizhan KHOICH, Ali Eren ALPER, Ahmet Arif EREN
301
time. Accordingly, the research results are limited to the dates of 15 July 2020 - 15 August 2020. The target audience in the research is Turkcell subscribers re-siding in Konya. The margin of error is set at 5 percent. As a result of the sam-ple size calculation formula, it was aimed to reach at least 384 people and 452 questionnaires were reached between the relevant dates.
In the research, face-to-face questionnaire technique was used in order to reach primary data. For this purpose, a questionnaire consisting of three parts has been prepared. The first part of this questionnaire includes questions about demographic variables. In the second part, CSR Perception main dimension questions are in-cluded. These questions consist of 18 Likert-scale items and four dimensions. In order to determine the perception of CSR, “Consumer Perceptions Scale of a Company’s CSR” prepared by Swaen & Chumpitaz (2008: 18) was used. In the third part, scales (consisting of 17 Likert-scale items and 4 dimensions) prepared by Yoo & Donthu (2001: 14) and Taşkın & Akat (2010) were used to determine “Consumer-Based Brand Equity Perception”. All of the expressions in the scales were scaled according to the Likert (five-point) scale.
There are a total of 41 variables in the questionnaire. CSR perception dimen-sion consists of 18 observed variables and brand equity dimension consists of 17 variables. The remaining 6 variables are classified variables related to demo-graphic characteristics.
3.1.1. Research Model
Figure 1: Research Model of the Relationship Between CSR Perception and Consumer-Based Brand Equity Perception

302
THE ROLE OF CONSUMER PERCEPTIONS OF SOCIAL RESPONSIBILITY PROJECTS ON CONSUMER-BASED BRAND EQUITY: AN EXAMPLE OF A LARGE-SCALE COMPANY
Murat Çakırkaya
3.1.2. Research Hypotheses
The hypotheses developed within the framework of the model created are as follows:
H1 = Perceived Charity Activities Variable, which is one of the sub-dimensions of CSR Perception, is statistically significant in predicting the Consumer-Based Brand Equity Variable.
H2 = Perceived Respect for Environment Variable, one of the sub-dimensions of CSR Perception, is statistically significant in predicting the Consumer-Based Brand Equity Variable.
H3 = Perceived Respect for Consumers Variable, one of the sub-dimensions of CSR Perception, is statistically significant in predicting the Consumer-Based Brand Eq-uity Variable.
H4 = Perceived Respect for Employees Variable, one of the sub-dimensions of CSR Perception, is statistically significant in predicting the Consumer-Based Brand Eq-uity Variable.
H5 = CSR Perception Variable is statistically significant in predicting the Con-sumer Based Brand Equity Perception Variable.
H6 = There is a positive relationship between the Perceived Charity Activities Var-iable and the Consumer-Based Brand Equity Perception Variable.
H7 = There is a positive relationship between the Perceived Respect for Environ-ment Variable and the Consumer-Based Brand Equity Variable.
H8 = There is a positive relationship between the Perceived Respect for Consumers Variable and the Consumer Based Brand Equity Perception Variable.
H9 = There is a positive relationship between the Perceived Respect for Employees Variable and the Consumer-Based Brand Equity Perception Variable.
H10 = There is a positive relationship between the Perceived CSR Perception Variable and the Consumer Based Brand Equity Perception Variable.

PERSPECTIVES ON MODERN ECONOMY
Aizhan KHOICH, Ali Eren ALPER, Ahmet Arif EREN
303
3.2. Analysis and Findings
SPSS program was used to analyze the data. In order to test the reliability of the scales used in the research, Cronbach’s Alpha values, which are the internal con-sistency indicator, were calculated before proceeding with the analysis. Then, frequency analysis, correlation and multiple regression analysis were used in the analysis of the data.
3.2.1. General Statistics (Frequency Analysis)
The demographic characteristics of the 452 people participating in the study are as follows:
Table 1. Frequency Distribution of the Demographic Characteristics of the Participants
Dem
ogra
phic
Va
riab
les
Valu
e
Freq
uenc
y
Perc
enta
ge
Dem
ogra
phic
Va
riab
les
Valu
e
Freq
uenc
y
Perc
enta
ge
Gen
der Male 278 61,5
Mar
ital
Stat
us
Single 231 51,1
Female 174 38,5 Married 221 48,9
Total 452 100 Total 452 100
Age
Under 20 years 53 11,7
Educ
atio
nal S
tatu
s
Elementary School 30 6,6
21–39 317 70,1 High school 68 15,0
40-55 82 18,1 Associate Degree 43 9,5
Total 452 100
University 226 50,0
Master’s degree 85 18,8
Total 452 100
Occ
upat
ion
Special Professionals 97 21,5
Mon
thly
Inco
me
Stat
us 2000 TL or less 162 35,8Artisan 61 13,5
Worker 52 11,5 2001–3500 TL 91 20,1
Officer 82 18,1 3501–5000 TL 85 18,8
Student 120 26,5 5001-7500 TL 71 15,7
Other 40 8,8 7501 TL and above 43 9,5
Total 452 100Total 452 100

304
THE ROLE OF CONSUMER PERCEPTIONS OF SOCIAL RESPONSIBILITY PROJECTS ON CONSUMER-BASED BRAND EQUITY: AN EXAMPLE OF A LARGE-SCALE COMPANY
Murat Çakırkaya
As can be seen from the table, it is seen that the general participant profile con-sists of the Y Generation representatives who are mostly in working life. (70.1% of the participants are in the 21-39 age group.) The main reason for this is that Generation Y has an important place in business life and consumption expendi-tures. The importance of generation Y will increase in the coming period. In ad-dition, the percentage of participants in the age group 20 and under (Genera-tion Z) is only 18-20 years old, so the percentage in the sample is low. The high age range determined for Generation Y participants (18 years) also contributed to the high sample size of this group. Especially the high level of general educa-tion of this active working generation, who have just started their business life or have gained some experience in their work, coincides with the realities of life. (50% of the participants have graduated from the university. 18.8% have a mas-ter’s degree.) It can be said that other demographic data of the participants also reflect the general society. For example, the distribution in occupational groups; Students (26.5%); Special Professionals (21.5%); Civil servants (18.1%); Trades-men (13.5%); It is at the level of workers (11.5%) and can be said to reflect the general society. It is possible to explain the high level of low income (the percent-age of participants with an income of 2000 TL and less is 35.8%) with the high rate of students in the sample.
3.2.2. Correlation and Regression Analysis
Before analyzing, Cronbach’s Alpha coefficient was used to evaluate the reliabil-ity (internal consistency) of the scales in the questionnaire form and these coef-ficients are presented in Table 2.
Table 2. Reliability Coefficients of the Scales Used in Research
Scale Dimensions
Numberof
Questions
Standard(Cronbach)
AlphaMean Standard
Deviation
CSR Perception 18 0,872 3,08 0,74
Consumer Based Brand Equity Perception 17 0,942 3,07 0,89
Charity Activities 4 0,851 2,98 0,75
Respect for the Environment 3 0,846 2,88 0,79
Respect for Consumers 3 0,928 3,03 1,07
Respect for Employees 8 0,938 3,22 0,83

PERSPECTIVES ON MODERN ECONOMY
Aizhan KHOICH, Ali Eren ALPER, Ahmet Arif EREN
305
In the examination of the reliability coefficients of the scales used in the study, the Cronbach’s Alpha Value of the Charity Activities Dimension was found to be 0,851. Cronbach’s Alpha Value of Respect for The Environment Dimension was found to be 0,834. However, Cronbach’s Alpha If Item Deleted Value for the question that “Turkcell reduces the consumption of natural resources”, which is among the questions of this dimension, has been found to be 0.846. In other words, it has been observed that the purpose of asking this question is not similar to the purpose of asking other questions. (Since the value of the relevant question is greater than Cronbach’s Alpha value, it is removed from the question group.) If this question is removed from the analysis, it will be seen that the reliability value increases to 0,846. Cronbach’s Alpha Value of Respect for Consumers, another di-mension of CSR Perception variable, was found to be 0,907. However, one of these questions is “Turkcell look after consumer rights.” (After-sales service, war-ranty) Cronbach’s Alpha If Item Deleted Value for the question was found to be 0.928. If this question is removed from the analysis with the same justification above, it will be seen that the reliability value increases to 0,928. Cronbach’s Al-pha value belonging to Respect for Employees Dimension, which is the last dimen-sion of CSR perception, was found to be 0,934. However, one of these questions is “Turkcell does not operate in countries where human rights are violated.” Cron-bach’s Alpha If Item Deleted Value was found to be 0,938. If this question is re-moved from the analysis with the same justification above, it will be seen that the reliability value increases to 0,938. Although there are different approaches regarding the criterion values of the reliability coefficient, it is generally accepted that the scale is reliable when the Cronbac’s Alpha value is 0.70 and above (Dur-muş et al., 2016: 89). When the Cronbac’s Alpha values given above are exam-ined, it is seen that both the CSR Perception scale (α = 0.87) and the Consumer Based Brand Equity Perception scale (α = 0.94) used in the study have values above 0.70. Therefore, it can be said that the scales used in the study are reliable. After looking at the reliability of the scales used in the study, Pearson Correlation analysis was used in this section to see the relationships between the sub-factors of the scales used in the questionnaire form and the results are shown in Table 3:

306
THE ROLE OF CONSUMER PERCEPTIONS OF SOCIAL RESPONSIBILITY PROJECTS ON CONSUMER-BASED BRAND EQUITY: AN EXAMPLE OF A LARGE-SCALE COMPANY
Murat Çakırkaya
Table 3. Correlation Analysis Results of Scales Used in the Research Model
CSR
Per
cept
ion
Con
sum
er B
ased
B
rand
Equ
ity
Perc
epti
on
Perc
eive
d C
harit
y Ac
tiviti
es
Perc
eptio
n of
Res
pect
fo
r the
Env
ironm
ent
Perc
eptio
n of
Res
pect
fo
r Con
sum
ers
Perc
eptio
n of
Res
pect
fo
r Em
ploy
ees
CSR Perceptionr 1
p
Consumer Based Brand Equity
Perception
r ,802** 1
p ,000
Perceived Charity Activities
r ,810** ,695** 1
p ,000 ,000
Perception of Respect for the Environment
r ,818** ,677** ,716** 1
p ,000 ,000 ,000
Perception of Respect for Consumers
r ,830** ,689** ,522** ,593** 1
p ,000 ,000 ,000 ,000
Perception of Respect for Employees
r ,945** ,719** ,664** ,672** ,733** 1
p ,000 ,000 ,000 ,000 ,000
**. The correlation is significant at the 0,01 level.
As seen in Table 3;
• A positive and significant relationship was found between CSR Perception and Consumer Based Brand Equity Perception (r =, 802, p <0.01). According to these findings, the H10 hypothesis was accepted.
When the relationship is examined in terms of sub-dimensions;
• It is seen that there is a positive significant relationship between Perceived Char-ity Activities and Consumer Based Brand Equity Perception (r =, 695, p <0.01). According to these findings, the H6 hypothesis was accepted.

PERSPECTIVES ON MODERN ECONOMY
Aizhan KHOICH, Ali Eren ALPER, Ahmet Arif EREN
307
• It is seen that there is a positive and significant relationship between Percep-tion of Respect for the Environment and Consumer-Based Brand Equity Percep-tion (r =, 677, p <0.01). According to these findings, the H7 hypothesis was accepted.
• It is seen that there is a positive significant relationship between Perception of Respect for Consumers and Consumer Based Brand Equity Perception (r =, 689, p <0.01). According to these findings, the H8 hypothesis was accepted.
• It is seen that there is a positive significant relationship between Perception of Respect for Employees and Consumer Based Brand Equity Perception (r =, 719, p <0.01). According to these findings, the H9 hypothesis was accepted.
To make a general evaluation; There are medium-level, positive and significant relationships between the 3 sub-dimensions of CSR Perception and Consumer Based Brand Equity Perception. (Perceived Charity Activities 0,695; Respect for the Environment 0,677 and Respect for Consumers 0,689). On the other hand, there is a strong, positive and significant relationship between Consumer Based Brand Equity Perception and Respect for Employees (0,719).
After the correlation analysis, multiple regression analysis was applied to deter-mine to what extent CSR Perception dimensions predicted the Consumer Based Brand Equity Perception variable. Analysis results are given in Table 4.
Table 4. The Effect of Consumer Perception of Turkcell’s CSR Practices on Consumer Based Brand Equity
DependentVariable
R2/ Adjusted
R2
IndependentVariable B Standard
Error t p F p
Consumer Based Brand
Equity
,643 / ,642
CSR Perception 0,966 0,034 28,486 0,000 811,443 0,000
When Table 4 is examined, it has been determined that, in general, Turkcell’s CSR practices are statistically significant in predicting the Consumer Based Brand Equity. Accordingly, the H5 hypothesis was accepted. The model was found to be significant (F=811,443; p=0,000; R2= 0,643). According to these results, ap-proximately 64.3% of the Consumer Based Brand Equity perception can be ex-plained by the CSR Perception variable.

308
THE ROLE OF CONSUMER PERCEPTIONS OF SOCIAL RESPONSIBILITY PROJECTS ON CONSUMER-BASED BRAND EQUITY: AN EXAMPLE OF A LARGE-SCALE COMPANY
Murat Çakırkaya
Table 5. The Effect of Consumer Perception of Turkcell’s CSR Practices Sub-Dimensions on Consumer-Based Brand Equity
DependentVariable
IndependentVariables
Standardized Coefficients t
statisticsp
valueStandard
ErrorBeta
Consumer Based Brand
Equity
Perceived Charity Activities 0,351 6,984 0,000 0,050
Perception of Respect for the Environment 0,175 3,562 0,000 0,049
Perception of Respect for Consumers 0,245 7,084 0,000 0,035
Perception of Respect for Employees 0,218 4,285 0,000 0,051
R2 ,659
Adjusted R2 ,656
F statistics 215,758 (p= ,000)
When Table 5 is examined, it is seen that the model is generally significant. (F=215,718; p=0,000; R2=0,659). In other words, it is statistically possible to es-timate the “Consumer Based Brand Equity” variable with at least one of the 4 sub-dimensions of the “CSR Perception” scale.
As a result, it has been determined that all of the independent variables (Perceived Charity Activities, Perception of Respect for the Environment, Perception of Respect for Consumers and Perception of Respect for Employees) in the model have a sig-nificant effect on perceived Consumer Based Brand Equity. Therefore, H1, H2, H3, and H4 hypotheses were accepted. The R2 value in the table shows the explanatory power of the model. As a result of the regression analysis, the explanation rate of the independent variables for the Consumer Based Brand Equity variable was found to be 65.9%. In addition, when the coefficients table is examined, it is seen that the “ Charity Activities” variable provides the greatest contribution to this explanatoryity.
4. Results and Discussion
In today’s intense global competition world, it is clear that CSR can only be sus-tainable as long as it continues to add value to corporate success. However, not only the company executives but also the society’s sensitivity in this direction and their interest in such projects will contribute to the future interest of CSR projects.

PERSPECTIVES ON MODERN ECONOMY
Aizhan KHOICH, Ali Eren ALPER, Ahmet Arif EREN
309
In addition, the continuation of the increase in global competition will also en-able CSR to continue as an important part of the business world and attract at-tention (Carroll, 2008: 42). As a matter of fact, a study conducted in India has revealed that CSR is an opportunity to provide better corporate value and there-fore should be included at all operational levels (Singh & Verma, 2018: 85). An-other research has shown that CSR communication has a bigger role in creating brand value than company credibility (Mahrinasari, 2019: 317).
As a result of the study, the following results have been reached: There are medi-um-level, positive and significant relationships between the 3 sub-dimensions of CSR Perception and Consumer Based Brand Equity Perception. (Perceived Char-ity Activities 0,695; Respect for the Environment 0,677 and Respect for Con-sumers 0,689). On the other hand, there is a strong, positive and significant re-lationship between Consumer Based Brand Equity Perception and Respect for Employees (0,719). In addition, it has been determined that Turkcell’s CSR prac-tices are statistically significant in predicting the Consumer Based Brand Equity. (F = 811,443; p = 0,000; R2 = 0,643). According to these results, approximately 64.3% of the Consumer Based Brand Equity perception can be explained by the CSR Perception variable. When the role of CSR practices on Consumer Based Brand Equity is evaluated in terms of CSR perception dimensions, it is seen that the model is generally significant. In other words, it is statistically possible to es-timate the “Consumer Based Brand Equity” variable with at least one of the 4 sub-dimensions of the “CSR Perception” scale. As a result of the regression anal-ysis, the explanation rate of the independent variables for the Consumer Based Brand Equity variable was found to be 65.9%. In addition, when the coefficients table is examined, it is seen that the “ Charity Activities” variable provides the greatest contribution to this explanatoryity.
The results of the research generally coincide with the results of the studies in the literature. As a matter of fact, it is possible to come across many studies on the positive impact of CSR activities on consumer-based brand value. For exam-ple; The impact of CSR on consumer-based brand value has been realized on an elite group of US companies with global brands, and as a result of the study, it has been confirmed that CSR is a valid source for intangible competitive ad-vantage (Melo & Galan, 2011: 423). As a result of a research conducted on 10 countries and 57 global brands; showed that CSR perceptions towards each of the stakeholder groups have positive effects on brand equity. In addition, global

310
THE ROLE OF CONSUMER PERCEPTIONS OF SOCIAL RESPONSIBILITY PROJECTS ON CONSUMER-BASED BRAND EQUITY: AN EXAMPLE OF A LARGE-SCALE COMPANY
Murat Çakırkaya
brands that follow local social responsibility policies in the societies in which they operate have achieved significant benefits that increase their brand equity. The reason for this is the positive impressions CSR leaves on other stakehold-ers, especially customers (Torres et al., 2012: 13). In a study conducted over 100 companies included in the Interbrand list, it was concluded that proactive CSR activities increase brand equities (Harjoto & Salas, 2017: 21). The results of a study conducted specifically for Saudi Arabia show that the focus of CSR activ-ities is the nature of CSR, the size of CSR and attitude towards CSR (Ajina, et al., 2020). Analysis results in a study conducted in the USA and South Korea; It has shown that CSR practices regarding product responsibility, economic and environmental issues increase brand equity (Woo & Jin, 2016: 20). Singh & Is-lam demonstrated that some tools could be used to measure the impact of CSR projects on brand value and exemplified this situation through a tool used (Car-roll, 2008:19). In a study conducted using data from 175 companies in Mexico, it was concluded that there is a positive relationship between CSR rating and brand value of a company (Bouvain, 2011: 13).
Although there are many studies supporting the positive impact of corporate so-cial responsibility projects on brand equity, there are also studies with opposite results. For example, in a study conducted by Farooq et al (2015: 2013) based on data belonging to companies in different countries and different sectors, it was emphasized that CSR activities are unnecessary costs paid by companies. It is concluded that these costs negatively affect the current and expected finan-cial performance. Surprisingly, it has been documented that there is a significant and negative relationship between CSR policies and brand equities. In another study conducted on 50 US companies, no relationship was found between CSR and brand equity (Gherghina & Simionescu, 2015: 23). In addition, the results of the study conducted in France and Tunisia showed that CSR actions carried out by luxury brands did not increase the willingness of customers to pay higher prices (Diallo et al., 2020: 1).
In this study, the consumer perception of social responsibility projects was put at the center and the relationship between CSR and consumer-based brand equity was examined. In addition, the existing literature was tried to be expanded by de-termining the role of CSR projects on consumer-based brand equity. Although it is known that CSR projects are one of the effective areas of marketing, previous studies on CSR were generally evaluated on four basic responsibilities (economic,

PERSPECTIVES ON MODERN ECONOMY
Aizhan KHOICH, Ali Eren ALPER, Ahmet Arif EREN
311
legal, ethical and charitable responsibility) that organizations should fulfill. On the other hand, there is a limited number of studies to determine the role of the dimensions of consumer perception of CSR projects on consumer-based brand equity. For this reason, this article contributes to the CSR literature and discusses the role of consumer perception of CSR projects on consumer-based brand equity in the context of “Charity activities”, “Respect for the environment”, “Respect for consumers” and “Respect for employees”. For this reason, it is thought that it will contribute to marketing professionals and academicians, especially profession-als working in the mobile communication sector, which is the basis of the study.
Recommendations for future studies can be summarized as follows: This study has been carried out in the mobile communication sector and the next studies can be done in different sectors. Another suggestion is that the study is carried out in different provinces, regions and countries other than Konya. Finally, in this study, the role of consumer perception of CSR projects on consumer-based brand value was investigated. In the following studies, consumer perception of CSR projects; Customer satisfaction, reputation perception, repeat purchasing in-tention, etc. can be investigated on many variables.
References
Aaker, D. A. (1992). Managing brand equity: Capitalizing on the value of a brand name. Journal of Marketing, 56(2), 125–128.
Ajina, A. S., Roy, S., Nguyen, B., Japutra, A., & Al-Hajla, A. H. (2020). En-hancing brand value using corporate social responsibility initia-tives. Qualitative Market Research: An International Journal.
Atilgan, E., Akinci, S., Aksoy, S., & Kaynak, E. (2009). Customer-based brand equity for global brands: A multinational approach. Journal of Eu-romarketing, 18(2), 115-132.
Boachie-Mensah, F. O., & Yeboah, A.Y.O. (2015). Environmental dimensions of corporate social responsibility and brand equity. European Jour-nal of Applied Business and Management, 1(2), 152-168.
Bouvain, P. (2011). CSR and brand value-is doing good linked to brand value? Expo 2011 Higher Degree Research: book of abstracts, 13-14.

312
THE ROLE OF CONSUMER PERCEPTIONS OF SOCIAL RESPONSIBILITY PROJECTS ON CONSUMER-BASED BRAND EQUITY: AN EXAMPLE OF A LARGE-SCALE COMPANY
Murat Çakırkaya
Carroll, A. B. (2008). A history of corporate social responsibility: Concepts and practices. The Oxford handbook of corporate social responsibility, 19-46.
Christodoulides, G. & de Charnatony, L. (2010). Consumer-based brand eq-uity conceptualization and measurement: A literature review. Inter-national Journal of Research in Marketing, 52 (1), 43–66.
Diallo, M. F., Mouelhi, N. B. D., Gadekar, M., & Schill, M. (2020). CSR actions, brand value, and willingness to pay a premium price for luxury brands: Does long-term orientation matter? Journal of Busi-ness Ethics, 1-20.
Durmuş, B., Yurtkoru, E.S. & Çinko, M. (2016). Sosyal bilimlerde SPSS’le veri analizi. 6. Baskı, Beta Basım Yayım.
Farooq, O., Aguenaou, S., & Amor, M. A. (2015). Corporate social responsi-bility policy and brand value. Journal of Applied Business Research (JABR), 31(6), 2013-2024.
Gherghina, S. C., & Simionescu, L. N. (2015). Does entrepreneurship and corporate social responsibility act as catalyst towards firm perfor-mance and brand value. International Journal of Economics and Finance, 7(4), 23-34.
Harjoto, M. A., & Salas, J. (2017). Strategic and institutional sustainability: corporate social responsibility, brand value, and Interbrand listing. Journal of Product & Brand Management, 26(6), 545-558.
Hassan, G., Abdollahi, S. M., & Chini, M. (2013). An empirical investigation on the impact of corporate social responsibility on brand equity within perceived service quality framework. Mediterranean Journal of Social Sciences, 4(6), 119-119.
Hopkins, M. (2006). What is corporate social responsibility all about? Journal of Public Affairs: An International Journal, 6(3-4), 298-306.
Keller, K.L., Lehmann, D.R., 2006. Brands and branding: Research findings and future priorities. Marketing Science 25(6):740-759.
Kim, M., & Kim, Y. (2014). Corporate social responsibility and sharehold-er value of restaurant firms. International Journal of Hospitality Management, 40, 120-129.

PERSPECTIVES ON MODERN ECONOMY
Aizhan KHOICH, Ali Eren ALPER, Ahmet Arif EREN
313
Lee, M. D. P. (2008). A review of the theories of corporate social responsibility: Its evolutionary path and the road ahead. International Journal of Management Reviews, 10(1), 53-73.
Mahrinasari, M. S. (2019). Determinants of brand equity: Communication of corporate social responsibility (CSR) versus CSR itself and compa-ny credibility. Contemporary Economics, 13(3), 317-335.
Malik, M. (2015). Value-enhancing capabilities of CSR: A brief review of con-temporary literature. Journal of Business Ethics, 127(2), 419-438.
Melo, T., & Galan, J. I. (2011). Effects of corporate social responsibility on brand value. Journal of Brand Management, 18(6), 423-437.
Moreira, A. A. T. D. M. S. (2016). CSR coffee brand value: a retailers perspec-tive. Degree of Master. IBS – ISCTE Business School.
Park, N. G. (2014). A Study on the effect of the corporate social responsibil-ity activities on brand equity and purchase ıntention-focused on moderating effect of the customer’s mobile communication service quality. Journal of Digital Convergence, 12(12), 189-202.
Poolthong, Y., & Mandhachitara, R. (2009). Customer expectations of CSR, perceived service quality and brand effect in Thai retail banking. International Journal of Bank Marketing, 27 (6), 408-427.
Singh, A., & Verma, P. (2017). How CSR affects brand equity of Indian firms? Global Business Review, 18 (3), 52-69.
Staudt, S., Shao, C. Y., Dubinsky, A. J., & Wilson, P. H. (2014). Corporate social responsibility, perceived customer value, and customer-based brand equity: A cross-national comparison. Journal of Strategic In-novation and Sustainability, 10(1), 65-87.
Strandberg, C. (2009). The role of human resource management in corporate social responsibility issue brief and roadmap. Report for Industry Canada. Burnaby, BC: Strandberg Consulting.
Swaen, V., & Chumpitaz, R. C. (2008). Impact of corporate social responsi-bility on consumer trust. Recherche et Applications en Marketing (English Edition), 23(4), 7-34.
Taşkın, Ç., & Akat, Ö. (2010). Tüketici temelli marka değerinin yapısal eşitlik modelleme ile ölçümü ve dayanıklı tüketim malları sektöründe bir araştırma. İşletme ve Ekonomi Araştırmaları Dergisi, 1(2), 1-16.
314
THE ROLE OF CONSUMER PERCEPTIONS OF SOCIAL RESPONSIBILITY PROJECTS ON CONSUMER-BASED BRAND EQUITY: AN EXAMPLE OF A LARGE-SCALE COMPANY
Murat Çakırkaya
Torres, A., Bijmolt, T. H., Tribó, J. A., & Verhoef, P. (2012). Generating global brand equity through corporate social responsibility to key stake-holders. International Journal of Research in Marketing, 29(1), 13-24.
Tuzzolino, F., & Armandi, B. R. (1981). A need-hierarchy framework for as-sessing corporate social responsibility. Academy of management review, 6(1), 21-28.
Uddin, M. B., Hassan, M. R., & Tarique, K. M. (2008), Three dimensional aspects of corporate social responsibility, Journal of Business and Economics, 3 (1), 199-212.
Valentine, S., & Fleischman, G. (2008). Ethics programs, perceived corporate social responsibility and job satisfaction. Journal of Business Eth-ics, 77(2), 159-172.
Woo, H., & Jin, B. (2016). Culture doesn’t matter? The impact of apparel com-panies’ corporate social responsibility practices on brand equity. Clothing and Textiles Research Journal, 34(1), 20-36.
Yoo, B., & Donthu, N. (2001). Developing and validating a multidimensional consumer-based brand equity scale. Journal of Business Research, 52(1), 1-14.

315
19POLITICAL MARKETING PROCESS AND USE OF SOCIAL MEDIASevilay USLU DİVANOĞLU1, Resul ÇELİK2
Introduction
Human beings try to convey their own feelings and thoughts to others through-out their lives and making great efforts to make the other person fit with his/her own ideas. This approach has also gained importance when it comes to pol-itics. In general, those who have the desire for political power feel the desire to influence the target audience in order to reach the position they want, that is, to take power, and to direct them in line with their own ideas and thoughts by get-ting their support. For this reason, political marketing and social media emerge as the most important tools in reaching the target audience. Technological im-provement and the use of new styles of communication in many fields have also affected the development of many fields in recent years. Social media, which al-lows people to connect with each other online, to write their daily thoughts, to discuss these thoughts, and to share and access within mutual permissions, is one of the new styles of communication with the people in political marketing. The use of social media tools, whose usage areas are rapidly growing day by day, are also becoming widespread in political areas. This situation causes all attention to this field and it is seen that the importance given to social media is increasing day by day. When the literature of our country and the world is examined, there are few studies that enable the use of the political marketing process and the use of social media within a certain program and plan. With this study, revealing its importance in terms of political marketing process and social media usage and it is considered important in terms of being a resource to contribute to quantita-tive studies to be carried out later.
1 Assoc. Dr., Aksaray Üniversitesi, Business Administration Faculty of Economics and Administrative Sciences
2 Lecturer, Mersin University, Anamur Vocational School

316
1. Political Marketing Mix
Marketing can be defined as meeting consumer demands, ensuring consumer satisfaction, revealing ideas and products in line with the demands of consum-ers, estimating the economic levels of consumers, and showing the appropriate result by prioritizing the demands and desires of consumers. In addition, these activities continue after the product is delivered to the consumer, and technical support and warranty services are also provided to the consumer. Along with the selection of the market within the concept of marketing, the evaluation of con-sumer demands in marketing emerges as an indicator of the support provided to the consumer. Along with these activities, there is also the purpose of gaining profit (Üste et al., 2007: 213).
When the concept of marketing is used alone, it is generally understood as a com-mercial activity. However, it is seen that marketing is not only a financial gain and sale, but also many non-governmental organizations (NGOs) and state in-stitutions, especially political actors / political parties, benefit greatly from this field. (Gürbüz and İnal, 2004: 50).
Product, price, distribution and promotion, which are the elements of traditional marketing mix, are also preferred within the scope of political marketing activi-ties (Shama, 1976: 765) and the political marketing mix occurs with the compo-nents of political product, political price, political distribution and political pro-motion (Demirtaş and Orçun, 2015: 42).
The concept of product is expressed in traditional marketing as anything brought to the market for capture, consumption, consideration or use in order to meet a desire and need. This concept includes physical objects, places, services, organi-zations, ideas and thoughts (Tek and Özgül, 2005: 288). When the literature on political marketing is examined, definitions that emphasize similar points for the conceptualization of the product are seen. Lees-Marshment (2001: 694; 2009: 459-460) defines the political product as “party members, party candidates, party employees, statutes, symbols belonging to the party, party conferences and ral-lies”. According to Niffenegger (1989: 47), the political product is “the indi-vidual characteristics of the candidate, party programs and past policies of the party”. Butler and Collins (1994: 21-22) stated in their studies that the politi-cal product is a structure that includes strategic features such as “person / party / ideology, commitment, changeability”. Kolovos and Harris (2010: 7) expressed
POLITICAL MARKETING PROCESS AND USE OF SOCIAL MEDIA
Sevilay USLU DİVANOĞLU, Resul ÇELİK

PERSPECTIVES ON MODERN ECONOMY
Aizhan KHOICH, Ali Eren ALPER, Ahmet Arif EREN
317
the political product as a merger consisting of “ideology and political plans, a party leader and candidates, party managers and party members”. In the con-text of these definitions, the political product can be defined as a party leader, party candidates and a party program. İslamoğlu (2002: 25) evaluated the politi-cal product within the scope of the chairman of the political party, the ideologi-cal axis and philosophy of the party, its program and activities, the candidates of the party and its identity. The evaluations made by the electorate from the best to the worst are effective in revealing the total value of the political product. Po-litical choices are also made according to these evaluation criteria. Factors such as the values that make up the society, the place of democracy in practice, and so-cial problems play a role in which of the elements constituting the political prod-uct determine our preferences.
In political marketing, the price is the whole of the votes, donations and other services provided to the candidate or the political party during the election period in return for the services undertaken by the party (Tek, 1999: 495). Membership fees, donations, different services, products can be a price, or it can be in the form of supporting the politics defended by the party or the candidate at the time of the election. Voting is a psychological purchase and there is a similarity between purchasing and voting for the mentioned party (Gürbüz and İnal, 2004: 64).
Distribution is a road between the producer and the consumer and also the to-tality of the activities carried out to deliver the products to the consumer. (Tekin, 2006: 164). In terms of political marketing, distribution is the delivery of polit-ical products and related messages (a party program, a leader, a candidate, prac-tices, an organization, a propaganda) to the electorate in the shortest way, at the most appropriate time, in the most economical and an effective way. This dis-tribution can be done in two different ways. The first is that party cadres can directly reach the voters without using any tools. The second is that party cad-res contact the voters using any tools (İslamoğlu, 2002: 135). While the impor-tance of the first way stands out in terms of preventing the changes of ideas by third parties before the products are delivered to the voters, facilitating control, avoiding incomplete or misunderstanding, unlike the first way, the second way has some disadvantages. However, using communication tools will allow reaching more voters with less cost in a short time (Divanoğlu, 2008: 112).

318
POLITICAL MARKETING PROCESS AND USE OF SOCIAL MEDIA
Sevilay USLU DİVANOĞLU, Resul ÇELİK
Promotion refers to the positive promotion and adoption of products, services, ideas or people to the target market and the scope of promotional activities in traditional marketing (Aytuğ and Özgüven, 2011: 233). Promotion is the mar-keting tool that is the most obvious feature in the political marketing mix with its various forms (Henneberg, 2002: 18). Promotion for consumers undertakes three important tasks. These are informing, encouraging and reminding (Stanton et al., 1994: 459). The most important marketing mix element that increases the influence of political parties against uncontrollable internal and external factors is promotion. The element that conveys the products and services of the party to the voters and ensures the survival, progress and growth of the political party is the promotion marketing mix (Mucuk, 1998: 185).
2. Development of Political Marketing
There is a general consensus among marketers about the development of political marketing and the parallel development of media and technology. Although the emergence of political marketing dates back to ancient times, it can be said that it started in America at the beginning of the 20th century in modern terms. The election campaign carried out by Franklin D. Roosevelt in 1936 is expressed as a historical process in the emergence of modern political communication (Polat et al., 2004: 17). In Turkey, it is observed that the political marketing and politi-cal marketing tools, especially after the transition to multi-party period begins to show itself. It is known that during the 1960s, when political campaigns began to emerge, the election campaigns were carried out through the technology of that day. Another political campaign in this period is seen to be carried out through the printed media (newspaper, poster, etc.) (Aziz, 2003: 83).
Political advertising, which is one of the most important tools of political mar-keting, entered our lives with the election campaigns Cenajans prepared for the Adalet Party in the 1977 elections so the transfer to those skilled in the art of political campaign in Turkey has been accepted as the beginning. In the 1977 and 1983 elections, making political advertisements through experts has provided positive contributions to political parties in the elections and they have proven themselves (Polat et al., 2004: 71). When viewed from the perspective of polit-ical events, political advertisements were made on television for the first time in the 1987 elections. The advertisements prepared by Birikim Agency for ANAP, one of the parties participating in the 1977 elections, and Yorum Agency for the

PERSPECTIVES ON MODERN ECONOMY
Aizhan KHOICH, Ali Eren ALPER, Ahmet Arif EREN
319
Sosyal Demokrat Halkçı Party, had a wide impact. The “squeezed lemon” spot, which has become a political symbol, was also used by the SHP leader and the party at every opportunity. Political advertising has become indispensable in Turk-ish political life with the 1991 elections (Polat et al., 2004: 79).
The rapid development of communication technologies has brought along cur-rent marketing methods. Through the Internet, e-mail and smart phones, mes-sages developed for individuals or groups can be delivered. Effective sound, pic-ture, text and audio images can be used as political marketing tools (Polat et al., 2004: 71). Today, the fact that all political parties have web pages and personal social media accounts of leaders and party members are examples of active use of technology. Today, commercial marketing techniques are benefitted from po-litical marketing practices.
3. Political Marketing Process
The process of political marketing involves the creation of plans for political ac-tors to achieve their goals, and it is a process that includes studies that investigat-ing the political market, identifying opportunities, examining the voter behavior, analyzing the work of rival actors and political parties, and examining the con-ditions of environmental factors (İlarslan, 2017: 32). The stages that include the political marketing process are shown below.
Environmental Analysis. In the political marketing process, all bodies involved in the process, together with the candidates, are affected by external environmental factors. These factors affect the decisions, activities and works of the candidates as well as the behavior of the voters and rival candidates in the market also the political parties. Getting the environmental analysis right is an important factor that opens the door to success. Environmental factors in the political marketing process can be classified as international, socio-economic, socio-cultural, legal, po-litical, competitive and technological environment (İslamoğlu, 2002).
Analysis of Voter Behavior. The voter is the most influential factor in the decisions and behaviors of candidates and parties. For this reason, the factors of voter be-havior should be thoroughly investigated and analyzed.
Voter Segmentation. It is the process of defining and targeting voters by subdi-viding them (Davidson & Binstock, 2012: 20). The beginning of the political
320
POLITICAL MARKETING PROCESS AND USE OF SOCIAL MEDIA
Sevilay USLU DİVANOĞLU, Resul ÇELİK
campaign is the determination of voter groups. Information from selected groups is very important to retain voters and maintain their tendency to vote. For this reason, the separation of voters into groups, in other words, segmentation is re-quired (Braun, 2012: 12). Geographical, behavioral, psychographic and demo-graphic segmentation methods can be used as segmentation methods in deter-mining voter groups (Baines, 1999: 405).
As a result, dividing the voters into sections with the determined criteria, determin-ing the target voter groups and developing a political marketing plan according to these are the fundamentals of the political marketing process (İlarslan, 2017: 35).
Creating the Political Marketing Mix. Political candidates and parties have to im-plement a marketing mix that includes various activities in order to deliver the campaigns they have created in line with the demands and demands of the vot-ers to their target audience. Candidates and parties who want to increase their influence over voters with the marketing mix benefit from many marketing fac-tors (İlarslan, 2017: 35).
It is seen that various models have emerged in the literature in terms of how to carry out the political marketing process successfully and the importance of see-ing and analyzing voter behavior in this process. Commonly used of these emerg-ing models are described below.
The Kotler Model. Kotler (1975) emphasized that political marketing is not a new methodology in which marketing methods are applied to politics, but there is an increase in the use of these methods with confusion. In this context, he de-scribed political marketing as an exchange relationship between the candidate and the voter, where information is received through votes and mutual communica-tion in return for promises.
Niffeneger Model. There are three components in the political marketing process model developed by Niffeneger. The first of these is the candidate or political ac-tors consisting of political parties. The second component is the voters who are affected by environmental factors. It emphasizes the segmentation of the voters in the Niffeneger model. The feedback from voter departments in the model is conveyed to political actors and political actors determine the political marketing programs they present to the target voter groups in line with these feedbacks. The

PERSPECTIVES ON MODERN ECONOMY
Aizhan KHOICH, Ali Eren ALPER, Ahmet Arif EREN
321
third component specified in the model, the political marketing program, includes traditional “4P” marketing mix components (İlarslan, 2017: 37).
Butler and Collins (1994) Model. In this model related to the structural and pro-cess characteristics of political marketing, product, organization and market fac-tors are examined as structural features (Butler and Collins, 1994: 21-30).
The Model of Henneberg (2003). He divided political marketing according to its functions and he proposed a model that includes marketing functions that po-litical candidates or parties can use for different exchange relations in different sub-markets (Henneberg, 2003: 3). This model developed by Henneberg is not a model that directly concerns the political marketing process, but includes vari-ous exchanges and communication processes that classify political marketing ac-cording to product, distribution, cost, communication, news - management, do-nation, parallel campaign management and internal commitment management functions. (Henneberg, 2003: 1118). When the literature is scanned, there are also models that have emerged as a result of various studies developed other than the models mentioned.
4. Social Media
Social media is generally defined as a set of internet-based applications that are built on the technological and ideological infrastructure of web 2.0 and it allows users to create content and update and change the content they have created (Comm & Burge, 2009: 2; Kaplan & Haenlein, 2010: 61.; Kim et al., 2010: 216; Akar, 2011: 21; Victor O. et al., 2017: 15). It is an online application plat-form that facilitates social media interaction, (Vural & Bat, 2010: 3355; O’Leary et al., 2011: 2; Orsburn, 2012: 3) communication and collaboration that allows people to share profiles to connect with each other online, allowing people to see each other as much as they share or allow (Palmer & Koening - Lewis, 2009: 165). Social media are online communication tools that are under user control (Bayraktutan et al., 2014: 62).
4.1 The Concept and History of Social Media
Web 1.0 technology, defined as information networks, is the application, which is the first stage of the World Wide Web, used between 1989 and 2005. As static

322
POLITICAL MARKETING PROCESS AND USE OF SOCIAL MEDIA
Sevilay USLU DİVANOĞLU, Resul ÇELİK
pages and content publishing, the web 1.0 allows only searching and reading infor-mation, providing little opportunity for user intervention.The web 2.0 technology, which has a wide range of features as participatory and collaborative, (Kujur & Chhetri, 2015: 134-135) enables users to share information collected collectively from different sources (Hwang et al., 2009: 1040). Web 2.0 is not just a current version of web 1.0, allowing users to interact more with less control. At the same time, it is a technology that allows the mutual content creation with flexible web and creative design possibilities, which are considered as one of the prominent features of web 2.0. Web 3.0, which provides the accessibility of mobile internet, is important as it is a technology that enables to increase the consumer satisfac-tion and to organize cooperation in social networks (Choudhury, 2014: 8097).
In this context, development through web 1.0 (static), web 2.0 (social), web 3.0 (mobile) offers opportunities along with technology (Chiosa, 2014: 38). It is stated that these important developments in technology will progress as web 3.0 web 4.0-web 5.0, with semantic web applications technology can rapidly inter-fere with people’s lives (Kambil, 2008: 56,58). As a result of all these technologi-cal advances. This process, in which we experience changes in every field such as economy, politics, social relations and culture is named by Castells as “network society” (Castells, 2010: 60).
Looking at the history of the concept of social media, it is seen that it has gone through many different stages until today (Bulut, 2013: 24). Usenet, which pro-vides the opportunity to send messages to active internet users around the world, was founded by Tom Truscott and Jim Ellis in 1979 and lays the foundations of social media. Social media started to be used in 1989, when Bruce and Susan Abelson gathered journalists in an online community on the website Open Diary, and in the same year, the concept of “Weblog” and the next year the concept of Blog emerged. With the rapid development of technology and the increase in in-ternet speed and broadband services, the creation of social networking sites such as MySpace in 2003 and Facebook in 2004 started to create social media used worldwide today (Kaplan & Haenlein, 2010: 60). From a chronological point of view, it is stated that the social network sites are Classmates.com (1995), Six-degrees.com (1997), Myspace and Facebook (2004), Flickr (2004) and Youtube (2005) (Kim et al., 2010: 217).

PERSPECTIVES ON MODERN ECONOMY
Aizhan KHOICH, Ali Eren ALPER, Ahmet Arif EREN
323
The fact that the Internet has a 30-year history and the use of the first websites in the early 1990s reveals that the history of social media is not very old. As a re-sult of technological developments and advances in the software industry, espe-cially the use of web 2.0 technology is seen as a very important step in the de-velopment of social media and therefore social networking sites. It is known that the terms social network and social media are used in the same sense. Since so-cial networks are a category of social media, it is stated that these two terms are different from each other (Safko & Brake, 2009: 26). Social networks can be de-fined as the place where people interact with friends, customers or the target au-dience, while social media can be defined as the place where video, photo, arti-cle or any content is shared even if there is no interaction.
5. Political Marketing and Social Media
Over the past decade, technological improvements and the use of new techno-logical forms and new styles in communication have created a new form of class that each individual must follow to communicate online. Also, social media is the new tool of communication with the people. Therefore, the use of it has spread to political level. Social media has become the main communication tool for ad-vertising and political aim to influence people in order to win voters thanks to its features such as creating dialogue, fast personalized communication and tar-geting the common goal in the best possible way (Yousif & ALsamydai, 2012). The chances offered by social media not only helping the development of com-munication, but also enabling the transfer of ideas and information by engaging citizens with common interests through discussion to accomplish the personal purposes (Shırky, 2011).
Nowadays, digital technology has become an important tool for the political cam-paign of parties especially candidates. As the candidates and the political parties enhance the social media use in order to supply political information, also, citi-zens’ ability to use the tool for political participation is increasing. Political par-ties also use the internet for political campaigns (De Ronde, 2010). websites pro-vide the parties with the opportunıty to communicate directly with the public in order to supply information about political actors and current events. More-over, ın recent years, the political parties’ activities have developed significantly though the use of multimedia tools and features of internet. Although the so-cial media use is not only aimed at young voters, only many young people are

324
POLITICAL MARKETING PROCESS AND USE OF SOCIAL MEDIA
Sevilay USLU DİVANOĞLU, Resul ÇELİK
informed by them. The general purpose is to remove barriers to the participa-tion in politics by making it easier or more attractive for young people to reach the politicians or political parties. Social networking websites such as YouTube / Facebook that provide a good environment to interact with voters and encour-age policies allow users to interact with each other on political issues. These al-low 65% of users aged from 18 to 29 to engage and research at least one of the five political candidates with a political engagement during the election campaign (Smith, 2009). Effing, Hillegersberg, and Huibers (2011) also revealed that the politicians who were more on social media got more votes in the Dutch national elections. A significant positive relationship was found between social media use and the number of votes in 9 of the 16 parties so the importance of potential to increase the policies significantly especially for young audiences becomes evident.
6. Current Social Media Tools
Social media are applications that allow users to create personal accounts or pro-files, access these profiles easily or as a result of their permission, interact by send-ing instant messages and notifications, and that can contain various information, especially photos, videos and information. It is stated that social media tools are tools such as e-mails between consumers, forums, discussion forums on the in-ternet (Mangold & Faulds, 2009: 358). Although there are various types of social media such as Youtube and Facebook in the general definition, it is also stated that different social media tools cannot be classified systematically (Kaplan & Haen-lein, 2009: 61). For this reason, it can be stated that many social media tools are also used as a wide communication network. Social networking sites can be de-fined as websites where users can quickly transmit the content prepared by users in an interactive manner. These contents are transmitted through personal pro-files and blogs within the network formed between individuals (Yağmurlu 2011: 7). Facebook and Twitter are the most well-known and most active social media tools around the world.
6.1 Facebook
Facebook was founded by Mark Zuckerberg in 2004 for Harvard University students. Facebook, which later included schools around Boston, covered all Ivy League schools within two months and all schools in the United States within the first year (Yağmurlu 2011: 7). Today, Facebook has more than 2 billion users

PERSPECTIVES ON MODERN ECONOMY
Aizhan KHOICH, Ali Eren ALPER, Ahmet Arif EREN
325
worldwide and more than 51 million users in our country. 51% of users en-ter Facebook several times every day. Users have around 130 friends on average. Users spend an average of 700 billion minutes per month interacting on Face-book, and their posts reach 30 billion per month. In addition, 200 million us-ers follow Facebook on their mobile phones either over the internet or through the application they download (Aksu et al. 2011: 200-201). The site allows us-ers to have new friends, to share their photos and thoughts, and to share their personal information. This site, which gives users free usage rights, meets its rev-enue from advertisements.
The widespread use of Facebook by reaching a wide audience rapidly and its pop-ularity increasing day by day push marketing researchers and academics to do re-search on this subject (Chen 2014; 1208). Mondal (2013) identified nine factors affecting political participation: psychological and cognitive characteristics, social environment, political environment, modernization and urbanization level, polit-ical socialization, participation modes, voting, campaign and cooperation activi-ties. It is stated that voter participation on Facebook is affected by any of these nine factors. So, it was stated that voters in cities voted for candidates with on-line advertisements in democratic, social and political environments, and they fol-lowed the beliefs and political plans of the candidates during political campaign activities (Salvador et al., 2017: 17).
In this sense, Facebook, the modern communication tool of the age that allows candidates and parties to freely share their promises and ideas with the voters, and it offers a wide range of opportunities in terms of ensuring that the mes-sages given reach the target audience, political interaction and fast information exchange (Yousif & ALsamydai, 2012: 85-86).
Facebook posts and electronic word-of-mouth communication, which are widely used in our country as well as in the world, can be effective on consumer pur-chasing decisions (Yıldız et al., 2016: 161), so it can be said that it is a modern political tool that can bring political parties or candidates together with electoral groups quickly and directly.
6.2 Twitter
Twitter is a social media tool defined as a microblog used to deliver messages to the profile owner’s unique followers, where the messages sent are limited to 140

326
POLITICAL MARKETING PROCESS AND USE OF SOCIAL MEDIA
Sevilay USLU DİVANOĞLU, Resul ÇELİK
characters. On the grounds that the limit of 140 characters creates a lot of diffi-culty in expressing an opinion, it has increased the character limit to 280 since 2017 for Twitter users in order to convey their thoughts more easily with a single tweet. Compared to the more specific area Facebook provides to its users, most of the messages on Twitter are public, searchable, and can be categorized accord-ing to content classification (Kaplan & Haenlein, 2010: 67). In this application, where millions of tweets are sent every day, the number of followers of the users can change, they can be included in popular profiles with millions of followers as well as accounts with very few followers. As a mass communication tool, all groups such as politicians, celebrities, organizations, state institutions and news channels can easily use Twitter actively (Bornfeld et al., 2014: 8).
People use Twitter for various reasons. Kim (2011) stated that the use of Twit-ter is for information seeking, entertainment and social use. Jaidka and Ahmed (2015) stated that successful political parties share their online and offline cam-paign activities with their followers using Twitter, and McCreery and Smith (2011) stated that there are homogeneous clusters on Twitter according to people’s polit-ical opinions (Safiullah et al., 2016: 123). In general, it is stated that using Twit-ter provides personal benefits such as communicating with friends, sharing ideas, having new friendships, commenting on people, and following current events. It is also stated that it has corporate benefits such as advertising, communicat-ing with similar institutions, creating a corporate network, exploring business op-portunities, and creating a brand (Weber, 2009: 9-11). In their study on Twitter, Zhao and Rosson (2009) stated that users use Twitter to communicate with their friends, searching for information and relieve stress, therefore, Twitter is different from other social media applications (Bulut, 2013: 25).
Social media makes it easy to record and share messages containing political opin-ions. For this reason, researchers try to use the data obtained via Twitter to predict the election results or public opinion (Gayo-Avello, 2013: 651; Jungherr, 2016: 72). The use of Twitter, which is an important platform for political parties to share their opinions with target voters or to announce their campaigns (Safiullah et al., 2016: 122), by politicians has been the subject of many studies especially recently (Caplan, 2013: 6).
Twitter activities related to the performance of political candidates or parties in elections are examined and investigations are made regarding the publication of

PERSPECTIVES ON MODERN ECONOMY
Aizhan KHOICH, Ali Eren ALPER, Ahmet Arif EREN
327
the links and messages made on Twitter by the researchers (Pal & Gonavela, 2017: 99). Therefore, Twitter, which allows people to express their political views and opinions (Aharony, 2012: 587; Caplan, 2013: 5; Safiullah et al., 2016: 122), is used by the general public as both a political information source and a political expression tool (McGregor, 2017: 3). For this reason, Twitter, which attracts the attention of politicians, academics who study mass communication and public opinion research, is a powerful platform for the dissemination of many messages through electronic word - of - mouth communication, which allows political par-ties to share their campaigns with the target audience (Bornfeld et al., 2014: 6).
6.3 InstagramInstagram, a free photo and video sharing application, was founded by Kevin Sys-trom and Mike Krieger in October 2010. This application, which allows users to use a digital filter on a photo they took when it was established and to share this photo with social media services including Instagram, was purchased by Face-book in April 2012 (Wikipedia, 2018). According to the statistics of Instagram, which has become popular in a short time, the number of users is 715 million on average, and an average of 52 million photos and 5 million videos are shared daily with this application (Statisticbrain, 2018).
Instagram is an application that allows users to share their photos or videos, to like and to comment on what has been shared, and to interact with each other. Instagram, which is preferred especially for today’s modern youth and offers visual communication, draws attention creating brand and product perception by using images. Instagram is seen as an important social media tool as a political com-munication tool to offer a direct and indirect method to politicians to share their messages and enrich their images, and to help citizens’ loyalty (Glantz, 2013: 695). However, it is seen that there are not enough studies about Instagram as a political communication tool in terms of both political personality and image management (Liebhart & Bernhardt, 2017: 17). Although it is a popular social media application, there is not much research in the literature about Instagram, which is a relatively new application.
RESULT
Marketing, which includes the processes of producing and delivering products and services in the light of the demands and desires of consumers as a priority, is

328
POLITICAL MARKETING PROCESS AND USE OF SOCIAL MEDIA
Sevilay USLU DİVANOĞLU, Resul ÇELİK
a concept that has taken place in different disciplines, which is not only a sub-ject of areas such as economy and business.
The concept of political marketing, which emerged as a result of the adaptations of marketing in the field of politics, includes product, price, distribution, pro-motion traditional marketing mix elements as political product, political price, political distribution and political promotion.
The common view of marketing scientists that developments in political market-ing and media and communication technologies are progressing in parallel has an important place in the field of marketing. Rapid advances in communication technologies have brought new marketing methods and techniques with it. The application of these methods and techniques for the successful management of the political marketing process can be associated with the effectiveness of the use of some political marketing process models. Today, commercial marketing meth-ods are still used in political marketing processes. These can be classified as Kot-ler Model, Niffeneger Model, Butler and Colins Model and Henneberg Model.
In recent years, technological innovations, developments of it and the use of new tools of communication in many areas have also affected the development of many fields. Social media is one of the new styles of communication with the people in political marketing so allowing people to connect with each other online and sharing and accessing within mutual permissions. The use of social media tools, whose usage areas are becoming more widespread, is also becoming widespread in political areas. Social media tools and websites are rapidly taking their place in the political marketing process as basic communication channels for dialogue, in-dividualized communication, mass movements, public formation, influence, in-formation and political advertising. Within this framework, political marketing practitioners, who use communication technologies and social media tools effec-tively, will be able to effectively carry out mass movements in line with common goals by ensuring the interaction between the voter and the party in this process.
References
Aytuğ, S., & ÖZGÜVEN, N. (2011). Pazarlama Yönetimi, Ankara: Detay Yayıncılık.
Aziz A.; (2003), Siyasal İletişim, Nobel Yayın Dağıtım, Ankara.

PERSPECTIVES ON MODERN ECONOMY
Aizhan KHOICH, Ali Eren ALPER, Ahmet Arif EREN
329
Bayraktutan G., BİNARK Mutlu, ÇOMU Tuğrul, DOĞU Burak, İSLAM-OĞLU Gözde, AYDEMİR Aslı Telli; (2014), “Siyasal İletişim Sürecinde Sosyal Medya ve Türkiye’de 2011 Genel Seçimlerinde Twitter Kullanımı”, Bilig, 68, ss.59-96.
Bulut M.; (2013), Gençlik ve Sosyal Medya Araştırma Raporu, T.C. Gençlik ve Spor Bakanlığı, Eğitim, Kültür ve Araştırma Yayın No:79, Gençlik Araştırmaları Yayın No:4.
Butler, P., COLLİNS, N. (1994). Political Marketing: Structure and Process. European Journal of Marketing, 28(1), 19-34.
Castells M.; (2010), The Rise of the Network Society, Wiley-Blackwell, https://deterritorialinvestigations.files.wordpress.com/2015/03/manuel_castells_ he_rise_of_the_network_societybookfi-org.pdf Erişim Tarihi: 20.12.2019
Chıosa A. R.; (2014), “Word of Mouth on Social Media”, Practical Application of Science, 2(4-6), pp.37-42
Choudhury N.; (2014), “World Wide Web and Its Journey from Web 1.0 to Web 4.0”, (IJCSIT) International Journal of Computer Science and Information Technologies, 5(6), pp.8096-8100.
Comm J. and Burge K.; (2009), “Twitter Power, How to Dominate Your Mar-ket One Tweet at a Time”. http://qcseminars.com/files/2011/01/twitterpower.pdf Erişim Tarihi: 20.12.2019
De Ronde, E. (2010). Digital campaigning. In R. Miller (Ed.), New Zealand government & politics (5th ed.) (pp. 312-325). Victoria: Oxford University Press.
DİVANOĞLU S., “Seçim Kampanyalarında Siyasal Pazarlama Karması Ele-manlarının Yeri ve Önemi” Niğde Üniversitesi İktisadi ve İdari Bil-imler Fakültesi Dergisi, Aralık 2008, Cilt: 1, Sayı: 2, ss. 112
Effing, R., Van H., J., & Huibers, T. (2011, August). Social media and political participation: are Facebook, Twitter and YouTube democratizing our political systems?. In International conference on electronic participation (pp. 25-35). Springer, Berlin, Heidelberg.
Gürbüz E., İnal E., “Siyasal Pazarlama Stratejik Bir Yaklaşım”, Nobel Yayın Dağıtım, Ankara, 2004, s. 50-64.

330
POLITICAL MARKETING PROCESS AND USE OF SOCIAL MEDIA
Sevilay USLU DİVANOĞLU, Resul ÇELİK
Henneberg, Stephan C. (2006), “Strategic Postures of Political Marketing: An Exploratory Operationalization”, Journal of Public Affairs, 6(1):15-30.
Hwang J., Altmann J., Kım K.; (2009), “The Structural Evolution of the Web 2.0 Service Network”, Online Information Review, 33(6), pp.10401057.
İlarslan Neslihan Duygu. (2017), Politik Pazarlama Sürecine İlişkin Kavramsal Bir Model: 3p Modeli, Yayınlanmıs Doktora Tezi, Hacettepe Üniversitesi Sosyal Bilimler Enstitüsü.
İslamoğlu A.H., “Siyaset Pazarlaması Toplam Kalite Yaklaşımı”, Beta Basım Yayım Dağıtım AŞ., İstanbul, 2002, s.25.)
Kambıl A.; (2008), “What is your Web 5.0 Strategy?”, Journal of Business Strategy, 29(6), pp.56-58.
Kaplan A. M. and Haenleın M.; (2010), “Users of the World, Unite! The Chal-lenges and Opportunities of Social Media”, Business Horizons, 53, pp.59-68.
Kım W., Jeong Ok-Ran, Lee Sang-Won; (2010), “On Social Websites”, Infor-mation Systems, 35, pp.215–236.
Kolovos, I., & Harris, P. (2005). Political Marketing and Political Commu-nication: The Relationship Revisited. Erişim Tarihi: 20.12.2019, http://otago.ourarchive.ac.nz/handle/10523/1463
Kotler Philip; (1975), “Overview of Political Candidate Marketing”, Advances in Consumer Research, 2, pp.761-769.
Kujur Pranay and CHHETRI Bijoy; (2015), “Evolution of World Wide Web: Journey From Web 1.0 to Web 4.0”, International Journal of Computer Science And Technology, 6(1), pp.134-138.
Lees-Marhsment, J. (2001). The Marriage of Politics and Marketing. Political Studies, 49, 692-713.
Lees-Marhsment, J. (2009). Political Marketing and The 2008 New Zealand Election: A Comparative Perspective. Australian Journal of Politi-cal Science, 44(3), 457-475.
M.C.Demirtaş, Ç.Orçun “Siyasal Pazarlama Uygulamalarının İlk Kez Oy Kul-lanacak Seçmenler Üzerindeki Etkilerine Yönelik Bir Araştırma” KMÜ Sosyal ve Ekonomik Araştırmalar Dergisi 17 (28): 42, 2015

PERSPECTIVES ON MODERN ECONOMY
Aizhan KHOICH, Ali Eren ALPER, Ahmet Arif EREN
331
Mangold Glynn W. and FAULDS David J.; (2009), ”Social Media: The New Hybrid Element of the Promotion Mix”, Business Horizons, 52, pp.357-365. Marketing, Media-Culture-Society, 24(3), pp.345-363.
Mucuk, İ. (1998). Pazarlama İlkeleri, İstanbul: Türkmen Kitabevi.
Newman, Bruce I. And SHETH Jagdish N.; (1985), “A Model of Primary Vot-er Behavior”, Journal of Consumer Research, 12: 178-187.
Nıffenegger Phillip B.; (1988), “Strategies For Success From the Political Mar-keters”, The Journal of Services Marketing, 3(2): pp.15-21.
Niffenegger, P. B. (1989). Strategies For Success From Political Marketers. The Journal Of Consumer Marketing, 6(1), 45-51.
O’leary Daniel E.; (2011), “The Use of Social Media in the Supply Chain: Sur-vey and Extensions”, Intelligent Systems in Accounting, Finance and Management, 18, pp.121-144.
O’cass, A. (2001). “Political Marketing: An Investigation of the Political Mar-keting Concept and Political Marketing Orientation in Australian Politics”. European Journal of Marketing, vol.35, no:9/10, s. 1003-1025.
Tek, Baybars Ö., “Pazarlama İlkeleri: Global Yönetimsel Yaklaşım- Türkiye Uy-gulamaları” Beta Basım Yayım, İstanbul, 1999, s. 495.
Palmer A., Koenıg-Lewıs N.; (2009), “An Experiential, Social NetworkBased Approach to Direct Marketing”, Direct Marketing: An Interna-tional Journal, 3(3), pp.162-176.
Palmer, J. (2002). “Smoke and mirrors: is that the way it is? Themes in political marketing”. Media, Culture & Society, Vol. 24, s.345–363.
Patrickbutler / Collins Neil, “Political Marketing: Structure and Process”, Euro-pean Journal of Marketing, Vol.28, No:1, 1994, s.21-30.
Polat C., Esen G., İnal M.E., Hedef Seçmen-Siyasal Pazarlama Yaklaşımı, No-bel Yayın Dağıtım, Ankara, 2004, s.17-79.
Safko L. and Brake David K.; (2009), The Social Media Bible: Tactics, Tools & Strategies for Business Success, Wiley&Sons, New Jersey.
Stanton, W. J., Etzel, M. J., Walker, B. J. (1994). Fundemantals of Marketing, McGraw Hill. Inc.

332
POLITICAL MARKETING PROCESS AND USE OF SOCIAL MEDIA
Sevilay USLU DİVANOĞLU, Resul ÇELİK
Tek, Ömer B. ve Engin Ö.; (2005). ‘‘Modern Pazarlama İlkeleri Uygulamalı ve Yönetsel Yaklaşım’’, İzmir, Birleşik Matbaacılık.
Tekin, V. N. (2006). Pazarlama İlkeler, Ankara: Seçkin Yayıncılık.
Üste, RB, Yüksel, B, Çalışkan, S. (2007). Seçimlerinde Siyasal Pazarlama Tekniklerinin Kullanımı ve İzmir İli Örnegi, Süleyman Demirel Üniversitesi Fen Edebiyat Fakültesi Sosyal Bilimler Dergisi, 15: 213-232.
Vitak, J., Zube, P., Smock, A., Carr, C. T., Ellison, N., & Lampe, C. (2011). It’s complicated: Facebook users’ political participation in the 2008 election. Cyberpsychology, Behaviour, and Social Networking, 14(3), 107-114.
Vural Z. Beril Akıncı ve BAT Mikail; (2010), “Yeni Bir İletişim Ortamı Olar-ak Sosyal Medya: Ege Üniversitesi İletişim Fakültesine Yönelik Bir Araştırma”, Journal of Yasar University, 20(5), ss.3348-3382.
Yousıf R. and Alsamydai M.; (2012), “The Impact of the Political Promotion via Facebook on Individuals’ Political Orientations”, International Journal of Business and Management, 7(10), pp.85-98.

333
20EFFECTS OF THE CHANGE IN EXCHANGE RATES AND INTEREST RATES ON NON-PERFORMING LOANS: THE CASE OF TURKEYMustafa UYSAL1
Introduction
Financial institutions fulfill the function of financial intermediaries and ensure the efficiency of the system. The banking sector is one of the leading institutions per-forming financial intermediation functions. Banks contribute to the sound per-sistence of the financial system by ensuring the flow of funds between fund sup-pliers and fund demanders. Moreover, banks make those transactions by lending the funds collected from those with savings surplus toward those who have sav-ings deficit, and charge fees such as interest, commission, dividend in return for this transaction. Therefore, repayment of loans extended by banks is of great im-portance in order for banks to function properly and to sustain financial stability. Problems to be experienced in loan payments would lead to problems in asset-li-ability and liquidity management of the banking sector and, ultimately, serious risks in the economy. Pursuant to the Article 5 of “the Regulation on the Princi-ples and Procedure Regarding the Characterization of Loans and Other Receivables and the Reserves to be Allocated for the Same” published in the Official Gazette No. 26333 on 11.01.2006, the loans that are overdue for more than 90 days should be categorized as “non-performing loans” (Official Gazette, 2006). The increase in the NPL ratio brings along some risks for the banking sector. Profitability and liquidity are the most important of these risks. Banks set aside provisions for loans transferred to NPL accounts and write them off as expenses. This situation adversely affects the profitability of the bank. Moreover, in case of default of the borrowed loans on maturity date would increase the NPLs, which may disrupt the cash flow and result in liquidity risk for the bank.
1 Assist. Prof., Artvin Coruh University, School of Applied Sciences, [email protected]

334
EFFECTS OF THE CHANGE IN EXCHANGE RATES AND INTEREST RATES ON NON-PERFORMING LOANS: THE CASE OF TURKEY
Mustafa UYSAL
Besides the mentioned issues, high NPLs also have negative impacts on the real sector. The asset quality of banks with increased NPLs would decrease, and in turn, banks would begin to be less willing to extend loans. This situation would make it difficult for the real sector in the country to acquire resources. On the other hand, banks with decreased profitability due to high NPLs would prefer to increase their deposit interest rates. Subsequently, the resource cost of the real sector would rise (Yüksel, 2016: 42).
Due to the aforementioned reasons, the increase in NPL ratios is one of the most important factors causing deterioration in the asset structure of banks. The de-teriorating asset structure would have adverse impacts on financial stability and economic growth (Hasan et al., 2009; Zhang et al., 2016). It is quite essential to examine and determine the factors that cause an increase in NPLs due to their adverse impacts on financial and economic stability. It has become very impor-tant to be aware of these factors and implement policies accordingly, especially in terms of more effective management of banks’ loan portfolios, determination of capital requirements, and pricing of loan equivalents and loan products that may be highly exposed to default risk (Mileris, 2012: 497). Therefore, NPLs is an important indicator in macroeconomic terms. Upon considering the impor-tance of NPLs, this study attempts to explain the impact of the developments in bank deposit interest rates and exchange rates, which are among the macroeco-nomic factors, on NPLs over the period January 2007 and June 2020. Contri-bution of the study to other studies in the literature involves an investigation of the relationship of NPLs with bank deposit interest rates and foreign exchange rates by performing the FADL cointegration test which derives strong outcomes in spite of the form and number of structural alterations and considers numer-ous structural breaks. Therefore, this study contributes to the literature in a meth-odological sense.
The study is comprised of six parts. In the second part, a literature review of the factors affecting NPLs is presented. Data and methodology are introduced in the third and fourth parts, respectively. In the fifth part, the obtained findings of the analysis are reported, and these findings are interpreted in the conclusion part.

PERSPECTIVES ON MODERN ECONOMY
Aizhan KHOICH, Ali Eren ALPER, Ahmet Arif EREN
335
Literature
Upon examining the national and international literature on NPLs are examined, many studies are found to determine the association of NPLs with the macroeco-nomic and bank-specific variables. By considering the bank-specific variables in determining this relationship, the change in the asset structure of banks can be analyzed (Klein, 2013: 4-9). The bank-specific variables consist of factors such as the total size of bank loan management efficiency and bank capital used in the analysis of NPLs, whereas factors such as growth, gross domestic product, real exchange rate, and unemployment constitute the macroeconomic variables. First of all, several studies dealing with the association between bank-specific variables and NPLs are presented below.
Berger and DeYoung (1997) performed the Granger causality test for NPLs and banks’ capital amounts in the USA over the period 1985-1994 and detected an inverse causal relationship between these two variables. Podpiera and Weill (2008) examined the relationship between NPLs and efficiency covering the pe-riod between 1994-2005 for the banking sector in the Czech Republic. The re-sults obtained from the study supported the “ bad management” hypothesis and indicated that the deterioration in cost-effectiveness led to an increase in NPLs.
Boudriga et al. (2009), using macroeconomic and financial data of 59 countries, investigated the factors affecting NPLs and the potential influence of regulatory factors between 2002-2006. The study, firstly, asserted the presence of a robust association between NPLs and bank-specific factors. Also, it was determined that particularly high capital adequacy ratios reduced NPLs, whereas market discipline and regulatory as well as supervisory mechanisms were not effective on NPLs. Besides, there are studies in the literature that deal with the impacts of bank-spe-cific variables such as credit quality, cost-effectiveness, income sources, and in-come variables before loan loss provision (Hu et al., 2004; Godlewski, 2004).
Studies examining the impact of macroeconomic variables on NPLs are summa-rized as follows. Espinoza and Prasad (2010) analyzed the data of six member countries of the GCC, using the VAR method over the period 1995-2008. The analysis results detected an inverse association between NPL and growth rate.
Yüksel (2011) analyzed the impacts of the general outlook of the economy, growth rate, exchange rate, interest rate, indebtedness of companies, industrial

336
EFFECTS OF THE CHANGE IN EXCHANGE RATES AND INTEREST RATES ON NON-PERFORMING LOANS: THE CASE OF TURKEY
Mustafa UYSAL
production index, and BIST-100 indexes on NPLs. The results concluded that variables such as interest rate, inflation, the share of loans in GDP, and growth had significant impacts on NPLs. Moreover, according to the results obtained from the stress tests, it was determined that the system had become a little more vulnerable to the 2008-2009 Global Financial Crisis. Louzis et al. (2012) expli-cated the relationship of NPLs with growth, interest, and unemployment rates for Greece within the period between January 2003-March 2008. In the study where regression analysis was conducted, a significant relationship was detected between NPLs and those variables.
Castro (2013) investigated the presence of the relationship between macroeco-nomic developments and bank credit risk for the banking sectors of Greece, Por-tugal, Ireland, Italy, and Spain over the period between 1997 and 2011. The data used in the study were analyzed via the dynamic panel data approach. Findings indicated that factors such as the increase in GDP, housing price indexes caused changes in credit risk and also, in the 2008 Global Financial crisis period, credit risk was significantly increased.
Klein (2013) analyzed the determinants of NPLs and their impacts on econo-mies of the Middle, Eastern, and Southeastern European countries using the VAR model. In the study, the panel data of 16 EU member states were analyzed be-tween 1998-2011. The analysis results revealed that growth, inflation, and un-employment rates affected NPLs.
Beck et al. (2013), using the data of banking sector in 75 states between 2000-2010, investigated macroeconomic variables affecting NPLs. In the study using dynamic panel data management to analyze the data, it was concluded that vari-ables such as stock prices, exchange rate, and borrowing interest rates had signif-icant impacts on NPLs. Makri et al. (2014) analyzed the data of 14 EU mem-ber states using the Generalized Method of Moments (GMM) over the period 2000-2008. The study concluded that the unemployment rate, growth rate, and bank capital size are effective on NFLs.
Chaibi and Ftiti (2015) examined the relationship of NPLs for banks in Germany and France with growth, interest rate, unemployment rate, and exchange rates over the period 2005-2011. The study, in which the GMM method was used, deter-mined that macroeconomic variables affected NPLs. Yağcılar and Demir (2015) examined data from 26 deposit banks operating in Turkey with the panel data

PERSPECTIVES ON MODERN ECONOMY
Aizhan KHOICH, Ali Eren ALPER, Ahmet Arif EREN
337
analysis. Findings determined that NPLs and trading in the stock exchange, scale, loan/deposit ratio, and liquidity were inversely correlated, whereas, interest rates, growth, and capital adequacy ratio were positively correlated.
Abdioğlu and Aytekin (2016) pointed out a positive association of NPLs with the NPL ratio in the previous period, and the solvency ratio, whereas an adverse relationship with the interest applied to the loan, the loan/deposit ratio, ineffi-ciency, and activity efficiency. Anastasiou et al. (2016) analyzed both macroeco-nomic variables and banking-specific variables affecting NPLs using panel data and the VAR model. The findings revealed an inverse relationship between macroeco-nomic factors such as unemployment, growth, and taxes, and NPLs after 2008.
Yüksel (2016) examined macroeconomic and bank-specific variables that deter-mine the NPL ratios in the Turkish banking sector using the annual data over the period 1988-2014. Findings determined that the rise in the foreign exchange rates increased the NPLs, whereas the increases in the interest income and growth rates led to a decrease in the NPLs. Gökçe and Sarıtaş (2017) analyzed the im-pact of the items on the balance sheet of private banks in Turkey on the changes in exchange rates. The study, in which the quantile regression method was used, detected a positive and statistically significant, but financially negative association between the change in the exchange rate and the NPLs.
Tekşen and Çelik (2018) investigated the association between loan types and NPLs. In the study, firstly, they detected a negative association between NPLs and housing & commercial vehicle loans, whereas a positive association between NPLs and non-commercial vehicle loans. Also, the results concluded that infla-tion, NPL ratio, and asset size variables had significant and positive impacts on the NPL ratios, whereas the crisis variable had a significant and negative impact.
Kılcı and Baygın (2019) examined the relationship between NPLs and interest rates on loans in Turkey. The obtained data over the period of July 2012-De-cember 2018 were analyzed performing the TAR-MTAR cointegration test. In the study, it was found that loan interest rates had a significant, long-term im-pact on NPLs. Kılcı (2019) investigated the presence of the long-term associa-tion between the real buying exchange rate and the NPL ratio over the period of January 2008 - December 2008 performing the Fourier ADL cointegration test. The result of the study detected an association between NPLs and the real exchange buying rate.

338
EFFECTS OF THE CHANGE IN EXCHANGE RATES AND INTEREST RATES ON NON-PERFORMING LOANS: THE CASE OF TURKEY
Mustafa UYSAL
Kabataş and Karamustafa (2019) investigated the relationship of NPL ratios with macroeconomic and bank-specific variables in the Turkish banking sector utiliz-ing the quarterly data over the period 2005-2016 via the OLS regression analy-sis method. Findings revealed an adverse and statistically significant association of the NPL ratio with the variables of growth, unemployment, and return on equity. Notwithstanding, no statistically significant association of the NPL ratio with the variables of inflation, interest rate, real exchange buying rate, return on assets, and total loans/total deposit rate could be detected. Similarly, Torun and Altay (2019) analyzed the data of 25 deposit banks in Turkey over the period 2008-2015 via a balanced static panel data analysis. Findings concluded that in-flation, real exchange rate, GNP growth rate of the Eurozone and BIST Index were statistically significant on NPLs; whereas microeconomic variables consisted of real effective interest rate, the share of consumer loans, the ratio of deposits to loans, and the bank size.
Poyraz and Arlı (2019) examined the relationship of NPLs with three different currencies such as USD, GBP, and JPY. The obtained data over the period Jan-uary 2008 - August 2018 were analyzed performing the ADF (1981) test, the Johansen cointegration test, and the Granger causality test. The analysis results, firstly, detected a long-term associaiton between the USD exchange rate and NPLs and that the USD exchange rate affects NPLs. Secondly, no clear long-term asso-ciation between the GBP rate and NPLs could be asserted, but it was seen that the GBP exchange rate Granger-caused NPLs. Lastly, no long-term associaiton was observed between the JPY rate and NPLs. Besides the aforementioned stud-ies, unemployment rate, exchange rate, and growth rate were found to be effec-tive on NPLs by several studies in the literature (Vogiazas and Nikolaidou, 2011; Skarica, 2014; Tanaskovic and Jandric, 2015; Konstantakis et al., 2016).
Methodology
In the study, the relationships of NPLs with the USD exchange rate, EURO ex-change rate, and deposit interest rates, which are financial instruments that can have an effect on these loans, are analyzed. To reveal this effect, it is investigated whether or not cointegration exists between NPLs and the USD exchange rate, as well as the EURO exchange rate and deposit interest rates. In this context, the existence of a cointegration relationship of NPLs with the USD exchange rate, EURO exchange rate, and deposit interest rates are examined via Banerjee et al.

PERSPECTIVES ON MODERN ECONOMY
Aizhan KHOICH, Ali Eren ALPER, Ahmet Arif EREN
339
(2017) FADL cointegration test. The variables, which are considered before the cointegration analysis, should be stationary at the same level I (1). Therefore, the ADF (1981) unit root test is performed to determine the level at which variables are stationary. The following equations are utilized in the ADF unit root test:
Equations 1, 2, and 3 above indicate the ADF equations with intercept, with in-tercept and trend, and without intercept and trend, respectively. The ADF unit root test determines whether or not the coefficient is statistically equal to zero. It is determined whether or not the series is stationary by comparing the t statis-tics of the coefficient with the MacKinnon table critical value. If the absolute value of the t statistic is greater than the absolute value of the MacKinnon table critical value, the series is stationary at the level. The FADL cointegration test is performed to investigate the long-term relationships among the variables of the study. The FADL cointegration test, which was obtained through the inclusion of the Fourier functions to the autoregressive distributed lag (ADL) model (Ba-nerjee et al., 2017: 3-4):
In equation 5, denotes the deterministic trend, k denotes the singular fre-quency value, q denotes the frequency, and T denotes the number of samples. The null hypothesis H0 : = 0, which claims that the variables are not cointe-grated, is tested by comparing the obtained t-statistics with the critical values of Banerjee et al. (2017). Furthermore, the Fully Modified OLS (FMOLS) method is used to estimate the coefficients of this relationship among the variables with long-term relationships.

340
EFFECTS OF THE CHANGE IN EXCHANGE RATES AND INTEREST RATES ON NON-PERFORMING LOANS: THE CASE OF TURKEY
Mustafa UYSAL
Dataset
The long-term association of NPLs with fluctuations in exchange rates (USD and EURO buying rate) and interest rates (INT)2 applied to bank deposits are analyzed within the Turkish banking sector. 162 monthly data are utilized in the study over the period of January 2007 - June 2020. Major financial crises on both national and international scales can account for significant volatility of bank loans, ex-change rates, and interest rates. Therefore, the review period of the study is limited to the period between 2007-2020 in order to include the influences of the Global Financial Crisis of 2008 on the variables included in the analyses. The monthly data of the NPL variable in the analysis are obtained from the Monthly Bulletin of the Banking Regulation and Supervision Agency. The data of the exchange rates are obtained from the “Electronic Data Distribution System” of the CBTR.
Table 1. Descriptive Statistics of the Variables
Variables Mean Median Maximum Minimum Std. Dev. Skewness Kurtosis
LNPLs 10.364 10.225 11.858 9.065 0.763 0.241 2.156
LUSD 0.850 0.694 1.938 0.156 0.507 0.610 2.171
LEURO 1.081 0.993 2.035 0.529 0.424 0.776 2.447
LINT 2.457 2.355 3.238 1.924 0.308 0.675 2.384
Table 1 indicates that NPLs has the highest value, whereas the USD exchange rate has the lowest value. The standard deviation value of INT, which is one of the important variables that can affect the cost of NPLs, is lower than of other variables that may be effective on NPLs. Although the USD and EURO ex-change rates yield the lowest return, they have the highest risk among the varia-bles that can affect NPLs.
Findings
Before conducting the unit root and cointegration analyses regarding the varia-bles, the natural logarithm of each variable is taken. Then, the ADF (1981) unit root test results are listed in Table 2.
2 The data used in the study are compiled from Yağcılar and Demir, 2015; Gökçe and Sarıtaş, 2017; Torun and Altay, 2019; Poyraz and Arlı, 2019.

PERSPECTIVES ON MODERN ECONOMY
Aizhan KHOICH, Ali Eren ALPER, Ahmet Arif EREN
341
Table 2. The ADF Unit Root Test Results
I(0) I(1)
Variables Intercept Intercept and Trend Intercept Intercept and Trend
LNPLs -0.208 (2) -3.251c(6) -4.517a (1) -4.496a (1)
LUSD 1.506 (12) -0.990 (12) -4.715a (11) -5.088a (11)
LEURO 1.369 (12) -0.733 (12) -9.739a (1) -4.309a (11)
LINT -2.514 (6) -2.531 (6) -3.622a (10) -3.770b (13)
a, b, and c denote the significance levels at 1%, 5%, and 10%, respectively. Val-ues in parentheses indicate the optimal lag length.
According to Table 2, it is determined that all variables in the study are stationary at the 1st difference. In order to determine whether or not a long-term association of NPLs exists with the USD rate, the EURO rate, and INT, which are determined to be stationary at the 1st difference, the FADL cointegration test is performed.
Table 3. The FADL Cointegration Test Results for the Variables
Frequency Min SSR
The FADL Cointegration Test
Statistic
Independent Variables
Lags of Independent
Variables
4 -5.367 -3.056 LUSD 1
4 -5.336 -2.438 LEURO 1
4 -5.355 -0.490 LINT 1
Critical values for the FADL cointegration test are -3.03, -3.38, and -4.07 at 10%, 5% and 1% significance levels, respectively.
The FADL cointegration analysis results regarding the variables are presented in Table 3. According to the calculated values, the null hypothesis between the EURO rate and INT as well as NPLs cannot be rejected, since the test statistics of all variables except for the USD rate are lower than the critical values. None-theless, it is observed that the USD rate variable and the NPLs have the same trend in the long-run at a 10% significance level. According to the results, it is observed that NPLs is affected by fluctuation in the USD exchange rate, whereas there is no such impact on the EURO rate and INT variables.

342
EFFECTS OF THE CHANGE IN EXCHANGE RATES AND INTEREST RATES ON NON-PERFORMING LOANS: THE CASE OF TURKEY
Mustafa UYSAL
Table 4. The FMOLS Results of the Variables
Variables Coefficient Std. error t-Statistic Probability
LUSD 1.474 0.057 25.715 0.000
R-squared 0.944
According to Table 4, a significant and positive association is observed between the USD rate and NPLs. Based on this, it can be claimed that a 1% increase in the USD exchange rate would cause a 147% increase in NPLs.
Conclusion
Banks, which are among the institutions that fulfill their intermediary function in the financial system, are considered as the most important institutions that have a crucial place and function in terms of economy. Therefore, negative develop-ments in the banking sector may have an adverse influence on the overall economy.
Therefore, ensuring maximum efficiency in the return of loans extended by banks is required for the banking system’s stability as well as the profitability of the banks. Thus, both the risks pertinent to credit and profitability that banks are likely to encounter and the adverse impact of the economy can be prevented. In this study, the monthly data of such variables as non-performing loans (NPLs), the USD exchange rates, the EURO exchange rates, and bank deposit interest rates (INT) are utilized over the period between January 2007- June 2020 in Turkey. In the study aiming to analyze the long-term relationship of NPLs with USD rate, EURO rate, and INT, the ADF (1981) unit root test is performed on the variables first. According to the test results, it is determined that all variables are stationary at the first difference. Then, the presence of a long-term relationship of NPLs with USD rate, EURO rate, and INT is investigated by conducting the FADL cointegration analysis. According to the results of the FADL cointegration analysis, a long-term association is detected between NPLs and the USD rate, whereas no long-term association is detected between the EURO rate and INT. The obtained results regarding the relationship between NPL and USD rate is similar to of several studies in the literature (Beck et al., 2013; Chaibiti and Ft-iti, 2015; Yüksel, 2016; Gökçe and Sarıtaş, 2017; Kılcı, 2019; Poyraz and Arlı, 2019), and the results of the study regarding the relationship between EURO rate and INT complies with of some other studies in the literature (Kabataş and Kar-amustafa, 2019; Poyraz and Arlı, 2019). Moreover, the obtained results regarding
PERSPECTIVES ON MODERN ECONOMY
Aizhan KHOICH, Ali Eren ALPER, Ahmet Arif EREN
343
the relationship between NPLs and INT differ from of certain studies in the lit-erature (Louzis et al., 2012; Yüksel, 2011; Kılcı and Baygın, 2019). Therefore, it can be stated that changes in EURO rates and INT do not have any effect on the amount of NPLs in banks.
The FMOLS method is used to calculate the long-term coefficients of the long-term association between NPLs and the USD exchange rate. According to the results, a significant and positive association is detected between NPLs and the USD rate. In general, according to the results of the analysis, it can be claimed that businesses with foreign exchange liabilities higher than foreign exchange as-sets would suffer financial difficulties along with the increase of the USD exchange rate and they would fail to make their loan payments. Furthermore, as the USD exchange rate causes inflation, it leads to a decrease in purchasing power. Since the decrease in purchasing power adversely affects the sales of the companies, it can be expected that the likelihood of the companies failing to repay their ex-isting loans would increase. It is seen that such a situation has an increasing im-pact on the amount of NPL in banks. Nevertheless, a similar impact is not ob-served for the EURO exchange rate. This situation indicates that the receivables of the companies operating at the EURO rate exceed their debts so that the fluc-tuation in the EURO exchange rate does not cause a problem in repayment of their existing loans.
Besides, the fact that rise or decline in interest rates and as a result of rising or de-clining loan costs do not have any influence on the amount of NPLs in the banks can be interpreted as the banks have established the necessary collaterals, mort-gages, and pledges, as well as making effective loan customer and sector analysis for avoiding from lending to risky customers and sectors. This study can be ex-panded for the same research period by including more or different macroeco-nomic variables in the analyses. Many alternative results can be obtained for dif-ferent periods by differentiating econometric methods.
References
Abdioğlu, N., & Aytekin, S. (2016). Takipteki Kredi Oranını Etkileyen Fak-törlerin Belirlenmesi: Mevduat Bankaları Üzerinde Bir Dinamik Panel Veri Uygulaması. İşletme Araştırmaları Dergisi, 8(1), 538-555.
344
EFFECTS OF THE CHANGE IN EXCHANGE RATES AND INTEREST RATES ON NON-PERFORMING LOANS: THE CASE OF TURKEY
Mustafa UYSAL
Anastasiou, D., Louri, H., & Tsionas, M., G. (2016). Non-Performing Loans in the Euro Area: Are Core-Periphery Banking Markets Fragment-ed?. Bank of Greece Working Paper, http://www.bankofgreece.gr/BogEkdoseis/Paper2016219.pdf (10.08.2020).
Banerjee, P., Arcabic, V., & Lee, H. (2017). Fourier ADL Cointegration Test to Approximate Smooth Breaks with New Evidence from Crude Oil Market. Economic Modelling, 67, 114-124.
Beck, R., Jakubik, P., & Piloiu, A. (2013). Non-performing Loans: What Mat-ters in Addition to the Economic Cycle?. ECB Working Paper Series, No: 1515.
Berger, A., N., & DeYoung, R. (1997). Problem Loans and Cost Efficiency in Commercial Banks. Journal of Banking & Finance. 21(6), 849-870.
Boudriga, A., Taktak, N., B., & Jellouli, S. (2009). Banking Supervision and Nonperforming Loans: a Cross-Country Analysis. Journal of Fi-nancial Economic Policy, 1(4), 286-318.
Castro, V. (2013). Macroeconomic Determinants of the Credit Risk in the Banking System: The Case of the GIPSI. Economic Modelling, 31, 672-683.
Chaibi, H., & Ftiti, Z. (2015). Credit Risk Determinants: Evidence from a Cross-country Study. Research in International Business and Fi-nance, 33, 1-16.
Dickey, D., A., & Fuller, W., A. (1981). Likelihood Ratio Statistics for Autore-gressive Time Series with a Unit Root. Econometrica, 49, 1057-1072.
Espinoza, R., A., & Prasad, A. (2010). Nonperforming Loans in the GCC Banking System and Their Macroeconomic Effects. IMF Working Papers, No:10/224. 1-24.
Godlewski, Christophe J. (2004). Capital Regulation and Credit Risk Taking: Empirical Evidence from Banks in Emerging Market Economies. Large, Universite Robert Schuman Institut d’Etudes Politiques, France, 1-25.
Gökçe, A., & Sarıtaş, H. (2017). Döviz Kurlarındaki Değişmelerin Türkiye’deki Özel Sermayeli Bankaların Bilançoları Üzerine Etkileri. Pamukkale Üniversitesi Sosyal Bilimler Enstitüsü Dergisi, 28, 1-18.

PERSPECTIVES ON MODERN ECONOMY
Aizhan KHOICH, Ali Eren ALPER, Ahmet Arif EREN
345
Hasan, I., Koetter, M., & Wedow, M. (2009). Regional Growth and Finance in Europe: Is There a Quality Effect of Bank Efficiency?. Journal of Banking & Finance, 33, 1446-1453.
Hu, J., L., Li, Y., & Chiu, Y., H. (2004). Ownership and NonPerforming Loans: Evidence From Taiwan’s Banks. The Developing Economies, 42(3), 405-420.
Kabataş, Y., & Karamustafa, C., (2019). Tüketici Kredilerinde Takipteki Kredi Oranlarının Makroekonomik Ve Bankalara Özgü Belirleyicileri: Türkiye Örneği. Marmara Sosyal Araştırmalar Dergisi, 15, 1-17.
Kılcı, E., N. (2019). Türkiye Makro-Finansal Görünümüne İlişkin Bir Değer-lendirme ve Reel Kur-Geri Dönmeyen Krediler İlişkisine Yönelik Bir Analiz. Siyaset, Ekonomi Ve Yönetim Araştırmaları Dergisi, 7(3), 23-38.
Kılcı, E., N., & Baygın, B., K. (2019). Asimetrik Uyarlama Yaklaşımı Kul-lanılarak Türkiye’de Tüketici-Ticari Kredi Faiz Oranları ile Geri Dönmeyen Krediler Arasındaki İlişkinin Analizi. Maliye Dergisi, 177, 104-120.
Klein, N. (2013). Non-Performing Loans in CESEE: Determinants and Mac-roeconomic Performance. IMF Working Paper, WP13/72, 1-27.
Konstantakis, K., N., Michaelides, P., G., & Vouldis, A., T. (2016). Non per-forming Loans (NPLs) in a Crisis Economy: Long-run Equilibrium Analysis with a Real Time VEC Model for Greece (2001– 2015). Physica A: Statistical Mechanics and Its Applications, 451, 149-161.
Louzis, D., P., Vouldis, A., T., & Metaxas, V., L. (2012). Macroeconomic and Bank-specific Determinants of Non-performing Loans in Greece: A Comparative Study of Mortgage, Business and Consumer Loan Portfolios. Journal of Banking & Finance, 36(4), 1012-1027.
Makri, V., Tsagkanos, A., & Bellas, A. (2014). Determinants of Non-perform-ing Loans: The Case of Eurozone. Panoeconomicus, 61(2), 193-206.
Mileris, R. (2012). Macroeconomic determinants of loan portfolio credit risk in banks. Engineering Economics, 23(5), 496-504.
Podpiera, J., & Weill, L. (2008). Bad Luck or Bad Management? Emerging Banking Market Experience. Journal of Financial Stability, 4(2), 135-148.

346
EFFECTS OF THE CHANGE IN EXCHANGE RATES AND INTEREST RATES ON NON-PERFORMING LOANS: THE CASE OF TURKEY
Mustafa UYSAL
Poyraz, E., & Arlı, O., E. (2019). Dövizdeki Volatilitenin Takipteki Krediler Üzerine Etkisi: Türkiye Örneği. Muhasebe ve Finansman Dergisi, 84, 133-148.
Skarica, B. (2014). Determinants of Non-performing Loans in Central and Eastern European Countries. Financial Theory and Practice, 38(1), 37-59.
Tanaskovic, S., & Jandric, M. (2015). Macroeconomic and Institutional De-terminants of NonPerforming Loans. Journal of Central Banking Theory and Practice, 4(1): 47-62
Tekşen, Ö., & Çelik, M. (2018). Kredi Türlerinin Takipteki Krediler Oranı-na Etkisi: Varlık Temelli Krediler Yüksek Takipteki Krediler Oranı İçin Bir Kalkan Mı?. Muhasebe ve Finansman Dergisi, 79, 95-110.
Torun, M., & Altay, E. (2019). Ticari Bankacılık Sektöründe Sorunlu Kredil-eri Etkileyen Faktörlerin Analizi. Yönetim ve Ekonomi Araştırmaları Dergisi. 17(1). 179-200.
Vogiazas, S. D., & Nikolaidou, E. (2011). Investigating the Determinants of Nonperforming Loans in the Romanian Banking System: An Em-pirical Study with Reference to the Greek Crisis. Economics Re-search International, 1-13.
Yağcılar, G., G., & Demir, S. (2015). Türk Bankacılık Sektöründe Takipteki Kredi Oranları Üzerinde Etkili Olan Faktörlerin Belirlenmesi. Ul-uslararası Alanya İşletme Fakültesi Dergisi, 7(1), 221-229.
Yüksel, Ö. (2011). Makroekonomik Değişkenlere Dayalı Kredi Riski Modelle-mesi Ve Stres Testi Analizi. Yüksek Lisans Tezi TOBB Ekonomi Ve Teknoloji Üniversitesi, Ankara.
Yüksel, S. (2016). Bankaların Takipteki Kredi Oranını Belirleyen Faktörler: Türkiye İçin Bir Model Önerisi. Bankacılar Dergisi, 98, 41-56.
Zhang, D., Cai, J., Dickinson, D., G., & Kutan, A.M. (2016). Non Performing Loans, Moral Hazard and Regulation of the Chinese Commercial Banking System. Journal of Banking and Finance, 63, 48-60.

347
21THE INDEPENDENT DUMMY VARIABLE MODELS DEALING WITH CHANGES IN PARAMETERS OF A CONSUMPTION FUNCTIONZeynep OZTURK1
Introduction
In social sciences and behavioral sciences, most of the variables collected for the studies are categorical. When there is not any quantitative relation among cate-gorical variables, independent variable set in regression equation may be formed by the any combination of categorical or quantitative variables. In a study about categorical variables, dummy variables are formed by giving code 1 to the all par-ticipants belong to a certain category and code 0 to the other participants who are not belong to that certain category. (Agresti, 2007: 1-3) divided categorical variables into two types as nominal variables and ordinal variables. Nominal var-iables separate the classes: e.g. for gender [male (0) and female (1)] etc... The score points of the classes are used for distinguishing them from the each other. Ordinal variables have numeric values showing the numerical order. e.g.: for ed-ucation level [low (1), intermediate (2), high (3)], for mobile phone brands (1, 2.3….10 – higher point indicates higher interest) etc. These points are used for ordering the levels of the chosen variable. A regression analysis can be applied not only with quantitative explanatory variables but also with the seasonal-effec-tive variables, area-effective variables, categorical variables or classified explanatory variables with quantitative variables. Dummy variables are specified to integrate these categorical variables into the model. These variables which are included in the regression matrix can be seen as artificial variables representing categorical variables. Classical Economists evaluated the consumption just as the consumer’s good purchase and they did not pay attention to the consumption phenomenon
1 Artvin Coruh University, Hopa Faculty of Economics and Administrative Sciences, Department of Business, Artvin, Turkey, [email protected], https://orcid.org/0000-0003-0475-1357

348
THE INDEPENDENT DUMMY VARIABLE MODELS DEALING WITH CHANGES IN PARAMETERS OF A CONSUMPTION FUNCTION
Zeynep OZTURK
itself. Generally they analyzed income sharing and production. The importance of the consumption was pointed out for the first time by John Maynard Keynes in 1936. A consumption function shows the relationship among the consump-tion and the income and the consumption tendencies of the consumers. It also shows the expected level of the total consumption of the expendable income. As the macro economic data are analyzed, it is seen that the changes in consumption rate and the changes in the income rate move in the same direction in general but the changes in consumption rate is minor. Economic factors, population-based factors and behavioral factors affect the consumption expenditures. Suits (1957: 548-551) stated some of the problems related to the usage of the dummy vari-ables and some of the available alternative procedures briefly. The change in the expenditure groups of university students, who are accepted as private consum-ers and have different income levels, was measured according to gender Zortuk (2009: 25-32). Grotenhuis (2015: 1-18) provided information on how to use and interpret dummy variables and interactions. He had been demonstrated the behavior of dummy variables with examples and applications. The sources dis-cussed by (Hardy, 1993) and (Hardy & Bryman, 2009) can be cited as a basic resource for the regulation of dummy variables, characterization of their distribu-tions, and the statistical results and interpretation of dummy models. The basic and interaction effects of dummy variables showed how it would be more eco-nomically useful and easier to interpret (Suits, 1984: 177-180). How and how much the change in parameters affects the parameters of a dummy variable model has not been compared in the literature. So, in this study, a consumption func-tion model with dummy variable was created, the effects of changes in categori-cal variables on parameters on independent dummy models were observed, and evaluated on three different models (addressing changes in constant term, slope parameter and all coefficients). Independent dummy models were compared and the most suitable model was selected.
Consumption Function
A consumption function shows the desired aggregate consumption degree in each level of the personal disposable income. In this study, estimations of aggre-gate consumption functions are derived by having regard to the Keynesian con-sumption function.
The Keynesian is based on three biased assumptions:

PERSPECTIVES ON MODERN ECONOMY
Aizhan KHOICH, Ali Eren ALPER, Ahmet Arif EREN
349
1. The function of current income is consumption. ( )t tC f Y=
2. The consumption function may change according to the income. When the income drops, consumption decreases while consumption increases when the in-come rises.
3. As consumers spend independently, it is not dependent to the consumptions of the other consumers.
The Keynesian Consumption function is given as 0 dC C cY= + in linear form. It is shown that
C : Total consumption
0C : Autonomous consumption; where is compulsory consumption with no in-come for people.
c : Marginal consumption propensity; that shows the part that people reserve for consumption while their income changes by one unit.
dY : Disposable income; that shows the income which is kept for savings and con-sumption after taxes are deducted from the total income of a person. (Demiral, 2007: 349-366)
Dummy Variable
In social sciences, categorical variables are frequently used that have no real numer-ical relations. The independent variables set in a regression equation may consist of any categorical and quantitative combination. Dummy variables (also known as dual, indicator, and dimidiated, disjoint or categorical variables) are a way to include qualitative information in a regression analyze. Dummy variables are al-ways two variables that use dual (0, 1) coding. Code 1 is assigned to all partici-pants included in a category whereas excluded participants are assigned as code 0.
If the independent categorical variable only has two levels, only one dummy var-iable is sufficient to obtain the information. The other category that is not de-fined as dummy variable is named as the reference group. If there is an inde-pendent categorical variable that have more than two levels, multiple dummy variables are created to replace the original categorical variable. The first step in

350
THE INDEPENDENT DUMMY VARIABLE MODELS DEALING WITH CHANGES IN PARAMETERS OF A CONSUMPTION FUNCTION
Zeynep OZTURK
this process is deciding the number of dummy variables in degree which is the level of the categorical variable. The decision of the un-coded level is gener-ally arbitrary. The un-coded level is the category in which all the other catego-ries are compared. Therefore, the un-coded group is generally the biggest group. The reason to include dummy variables in categorical variable consist of j categories is due to the necessities of linear regression model. Especially, accord-ing to the assumption that there is no relationship between independent varia-bles, none of the explanatory variables may be written as the perfect linear com-bination of the explanatory variables remaining in the model (Wooldridge, 2013).
The reference groups should be selected for the categorical variables before the data coding. Only one category should be defined as the reference group for the each categorical variable. The coefficient added to the dummy variables should be interpreted according to the reference group. The selected reference group should depend on the purpose of the research at hand. Also, if a model has several quali-tative variables with several classes, the determination of dummy variables increases the number of degrees of freedom. For this reason, the number of dummy vari-ables to be countered against the total number of observations available for anal-ysis should be determined accordingly. (Gujarati, 2004; 2014).
The Models with Dummy Variable Approaching to the Changes in Constant Terms
We assume that the factors defined as dummy variables only affect the constant term of the relationship. Thus, these dummy variables are included as a differ-ent variable with their corresponding coefficients. When a regression model is es-tablished, the categorical variable is included by describing the dummy variables. Assuming that the categorical variable has only two categories, they can only be represented by a dummy variable:
In general, quantitative explanatory variables and the model including the cate-gorical variable with two categories can be written as below:
(1)

PERSPECTIVES ON MODERN ECONOMY
Aizhan KHOICH, Ali Eren ALPER, Ahmet Arif EREN
351
The containment of the term lets to distinguish the constant term in two factor or considering a categorical factor as a related parameter. If all normal re-gression assumptions are valid for the equation (1), to see this:
(2)
So, the constant term of first category becomes that shows the differ-ence in between the constant term values of the two categories (Kennedy, 1986: 174-175). After estimating the parameter vector of the model with any estimation method, the hypothesis about the significance of the parameters can be obtained:
1. Testing the statistical significance of the constant term of the first category:
Generally, F test statistics is used to solve this test.
2. Testing the statistical significance of the constant term of the second category:
3. Testing whether there is a statistically significant difference between the con-stant terms:
It might be considered as the test of the constant term. Alternatively, this test may be considered as the test of the statistical significance of the categorical var-iable. The last two tests could be solved with a t–statistic test.
As an alternative, the model is specified as below that is defined with two dummy variables,

352
THE INDEPENDENT DUMMY VARIABLE MODELS DEALING WITH CHANGES IN PARAMETERS OF A CONSUMPTION FUNCTION
Zeynep OZTURK
Thus, the defined model is as below:
(3)
Similar to the equation (2):
(4)
It helps us to distinguish the effect of the constant term in two categories, thus we may call the model (3) correct. However, model (3) causes the “dummy vari-able trap”. If the model (3) is estimated as the dummy variable trap, then X ma-trix is defined as:
Here, the sample observations of the dummy variables is represented the last two columns. It is like below as X matrix is considered:
So, since the values of the first column in the X matrix can be written as a full linear combination of the last two columns, it causes multicollinearity prob-lems. The 'X X matrix is not singular, since it is considered to be less than the rank of the X matrix, so the unknown parameters can’t be obtained. (Poo etc., 2003:102-111).
The Models with Dummy Variable Approaching to the Changes in Slope Parameters
Now, we approach to a model in which explanatory variables of categorical fac-tors affect one or more than one coefficients. In this case, the dummy variables are multiplied as “interactive”, which is the corresponding explanatory variable. A regression model that allows the interaction affecting between a categorical fac-tor and quantitative variable is written as below:

PERSPECTIVES ON MODERN ECONOMY
Aizhan KHOICH, Ali Eren ALPER, Ahmet Arif EREN
353
(5)
Here, it is assumed that the categorical factor only has two categories. The con-ditionally expected value of the model is:
(6)
This slope or trend represents the difference between the slope values of the two categories for and parameters other than , for the first category. Again, the test hypothesis are given as below after the model is estimated:
1. In the first category, testing of the statistical significance of 2x coef-
ficient:
This test can be used the general F test statistics.
2. Testing of the statistical significance of 2x in the second category:
3. Testing for both two categories to find if there is a significant difference be-tween 2x coefficients:
These last two hypothesis can be tested by using a t-statistics similar as in the previous subchapters.
The Models with Dummy Variable Approaching to the Changes in all Coefficients
It is accepted that, the categorical factor showed by the dummy variables affects both the intercept and all the coefficients of the explanatory variables. The dummy variables should be presented in both summation form and multiplicative form to indicate the effect on the slope, so the effect of the categorical factor on the

354
THE INDEPENDENT DUMMY VARIABLE MODELS DEALING WITH CHANGES IN PARAMETERS OF A CONSUMPTION FUNCTION
Zeynep OZTURK
constant term can be reflected. Thus, with the assumption that it has a qualita-tive factor that separates only two categories:
(7)
The conditionally expected value of the variable in the equation (7):
(8)
According to the equation (8), show the constant terms for the first and second categories in order. When , they show the slopes of jx for the first and second categories.
The hypothesis tests are as below to estimate the equation (7):
1. Testing the significance of jx ( 2,3,..., )j k= slope that corresponds to the first category:
This test can be solved with the general F test statistics.
2. Testing the significance of jx ( 2,3,..., )j k= slope that corresponds to the sec-ond category:
3. Testing for both two categories to find if there is a significant difference be-tween jx coefficients.
4. Testing for both two categories to find if there is a significant difference be-tween constant terms.

PERSPECTIVES ON MODERN ECONOMY
Aizhan KHOICH, Ali Eren ALPER, Ahmet Arif EREN
355
The t-test statistics is used to solve these tests:
5. Testing for the significance of the model:
The general F test statistic is used to solve this test.
Results
In this study, the outputs of a study are used which was prepared by Besballi etc. 2017, 2018 that shows Artvin Coruh University students’ income, consumption and contributions on the economy and social structure of Artvin Province, who studied in 2016–2017 educational year. The estimated consumption function for introduction of the relationship between the students’ total consumption and their income is the same as the Keynesian consumption function however, only the notation changes. The econometric model, namely the regression model is:
In this formula;
iY : dependent variable, student’s monthly consumption spending,
iX : independent variable, student’s monthly income,
: Autonomous (independent from the income) consumption,
: Marginal propensity to consume,
: The error term,
are shown. The model is established for the regression analyses and the error term is also included beside the dependent and the independent variable. The error term is expected to be minimum and the least squares method (LSE) is used for the calculation and this method makes the parameter minimum. The LS method is used to obtain an estimator value to make the sum of the squares of differences between the observation values of the dependent variable and the estimation values minimum. The statistical significance of the estimated parame-ters is analyzed with the specificity coefficient in the SPSS

356
THE INDEPENDENT DUMMY VARIABLE MODELS DEALING WITH CHANGES IN PARAMETERS OF A CONSUMPTION FUNCTION
Zeynep OZTURK
Statistics 25 program. The t-test shows whether the estimated parameters are sig-nificant or not, the shows the validity of the model and 2R defines the explanatory power of the model. The specificity coefficient is a measure that in-dicates the percentage of the total changes of the dependent variables explained by the independent variables.
First of all, the consumption function model that shows the relationship be-tween the consumption and income is obtained with linear regression analyses. The parameters, hypothesis test estimations and coefficient of determination of the model are given in the Table 1:
Table 1. The Estimation Results of the Consumption Function.
β1 β2
Coefficient 353,153 0,424
Standard Error 11,148 0,013
T test stat. (Sig.) 31,679 (0,000) 31,863 (0,000)
F test stat. (Sig) 1015,268 (0,000)
R2 0,414
According to these estimation results, the obtained consumption function model is:
The model shows that Artvin Coruh University students’ autonomous (inde-pendent from the income) monthly consumption spending is 353,153 TL and their marginal propensity to consume is 0,42. So, it means that, if these univer-sity students’ income increases by 100 TL, 42 TL of this increase is going to be used for consumption whereas 58 TL of it is going to be saved.
In this model, according to the test that examines the significance of the param-eters against insignificance (t-test), the significance level of coefficients is < 0,05 and it is concluded that the coefficients are statistically significant with 95% confidence. Similarly, the significance of the model is tested with F test sta-tistics, and as significance value of F test statistic is < 0,05, so, the model is valid with 95% confidence.

PERSPECTIVES ON MODERN ECONOMY
Aizhan KHOICH, Ali Eren ALPER, Ahmet Arif EREN
357
The coefficient of determination of the model is found as 41,4%. According to this result, in the consumption function, approximately 41% of the changes in students’ consumption spending are explained by the changes in students’ income, the remaining 59% of the changes are due to different factors. The explanatory power of the model is low.
Income is not the only factor that affects economical behaviors. Also, gender, mar-ital status etc. are such important qualitative variables that explain economical be-haviors. Therefore, the gender is considered as an important variable that affects the consumption, the gender variable is also included in the consumption func-tion model. The model is going to be tested under the dummy variable models that affect the change in the constant term, slope parameters and all coefficients to figure out if there is a difference between autonomous consumption expendi-tures and marginal propensity to consume by gender.
Primarily, it should be checked that whether there is a difference between stu-dents’ average income and average consumption spending according to the gen-der factor. The proper data analyze method for this situation is the independent two samples t-test. The results are obtained in Table 2. According to Table 2, the significance value for both income and consumption level variables is 0,000<0,05, so there is a difference between average income and average consumption level ac-cording to the gender factor. The average income of the female students is 636,22 TL whereas their spending is 610,160 TL. The average amount that female stu-dents keep for monthly savings is 26,06 TL. The male students have 759,502 TL average income and they spend 701,017 TL. The male students keep 58,485 TL for monthly savings.
Table 2. The estimations of the Income and consumption spending of students.
Mean t Sig.
IncomeFemale 636,222
-3,974 ,000Male 759,502
SpendingFemale 610,160
-4,466 ,000Male 701,017
The gender is included in the model as a dummy variable to test whether there is a difference in students’ autonomous consumption spending and marginal

358
THE INDEPENDENT DUMMY VARIABLE MODELS DEALING WITH CHANGES IN PARAMETERS OF A CONSUMPTION FUNCTION
Zeynep OZTURK
propensity to consume according to the gender, and the consumption functions with dummy variable are obtained.
The model 1 is defined as a model that assumes the gender factor affects the re-lationship between students’ income and consumption only through autonomous consumption. The dummy variable is created as Male=1 and Female=0. In this model, the parameter corresponding to the dummy variable is included in the model as an independent variable. The model is defined as below:
Model 1:
In the Model 2, a regression model is established that procures the interaction between the gender variable and the income variable. This model represents the situation that the dummy variable affects one or more parameters. The model is established as the dummy variable and it is multiplied by the corresponding in-dependent variable.
Model 2:
In the Model 3, a joint model is established that procures the interaction be-tween the gender variable and both the autonomous consumption spending and the income variables.
Model 3:
In these models
iY : students’ monthly consumption spending,
iX : students’ monthly income,
D : 0D = female students, 1D = male students as the gender dummy variable.
Z : *Z D X= : it is the dummy variable that shows the difference between male and female students’ marginal propensities to consume.

PERSPECTIVES ON MODERN ECONOMY
Aizhan KHOICH, Ali Eren ALPER, Ahmet Arif EREN
359
Table 3. Expected consumption functions for female and male students and definition of unknowns.
In these functions, the expected functions for female students are the same for all models. However, the functions change for male students who have a reference variable. The analyze results for these models are given below. In below table, the parameter estimations, hypothesis tests, coefficient of determination and adjusted coefficient of determination are given which belong to the model with dummy variable that approaches to the changes in the constant term.
Table 4. The Estimation Results of the Model 1.
β1 β2 β3
Coefficient 342,733 ,420 39,486
Standard Error 11,704 ,013 13,832
T test stat. 29,284 31,374 2,855
Sig ,000 ,000 ,004
F test stat (Sig) 514,236 (,000)
R2 ,417 Adjusted R Square ,417
Model 1 is found as:
342,733 ,420 39,ˆ 486i i iY X D u= + + +

360
THE INDEPENDENT DUMMY VARIABLE MODELS DEALING WITH CHANGES IN PARAMETERS OF A CONSUMPTION FUNCTION
Zeynep OZTURK
According to the model 1, female students’ autonomous consumption spending is 342,773 TL and male students’ autonomous consumption spending is 382,219 TL. Female and male students’ marginal propensity to consume is 0,42. The dif-ference between female and male students’ consumption spending is 39,486 TL. Female students’ ( ) autonomous consumption function, the difference between female and male students’ autonomous consumption spending ( ) are statisti-cally significant with 95% confidence as shown in the table. The model is also statistically significant according to the F test statistics. The explanatory power of the Model 1 is 41,7%.
In below table, the parameter estimations of the model with dummy variable ap-proaching to the changes in slope parameters, hypothesis tests, coefficient of de-termination, adjusted coefficient of determination are obtained.
Table 5. The Estimation Results of the Model 2.
β1 β2 β3
Coefficient 368,114 ,370 ,085
Standard Error 11,397 ,017 ,016
T test stat. 32,299 22,113 5,311
Sig ,000 ,000 ,000
F test stat. (Sig) 531,353 (,000)
R2 ,425 Adjusted R Square ,425
Model 2 is found as:
368,114 ,ˆ 370 0,0850 ( * )i i i iY X X D u= + + +
According to the Model 2, female and male students’ autonomous consumption spending is 368,114 TL. The difference between female students’ and male stu-dents’ marginal propensity to consume is 0,085. So, 0,455 of per unit increase in male students’ income is kept for savings.
Similar to the male students’ Model 1, the parameters of the Model 2 and the model itself are statistically significant with 95% confidence. The explanatory power of the Model 2 is 42,5%.

PERSPECTIVES ON MODERN ECONOMY
Aizhan KHOICH, Ali Eren ALPER, Ahmet Arif EREN
361
In below table, the parameter estimations of the model with dummy variable ap-proaching to the changes in all coefficients, hypothesis tests and coefficient of de-termination are given.
Table 6. The Estimation Results of the Model 3.
β1 β2 β3 β4
Coefficient 391,083 ,344 -53,604 ,135
Standard Error 15,053 ,020 22,996 ,027
T test stat. 25,981 17,122 -2,331 5,043
Sig 0,000 0,000 0,020 0,000
F test stat. (Sig) 357,141 (0,000)
R2 0,428 Adjusted R Square 0,427
The estimated model is as below:
According to the Model 3, the difference between the male and the female stu-dents’ autonomous consumption is observed. The female students’ expected value of consumption is
391,083 0,344Y X+= , the autonomous consumption is 391,083 TL and the mar-ginal propensity to consume is 0,344 (34,4%).
The male students’ expected consumption value is 337,479 0,479Y X+= and the autonomous consumption is 337,479 TL and the marginal propensity to con-sume is 0,479 (47,9%).
Therefore, male students’ marginal propensity to consume is 0,135 (13,5%) more than female students’ marginal propensity to consume. The difference between male students’ and female students’ consumption spending is 53,604 TL. Sim-ilar to the Model 1, the parameters and the model itself are statistically signifi-cant. The explanatory power of the model is 42,8%.

362
THE INDEPENDENT DUMMY VARIABLE MODELS DEALING WITH CHANGES IN PARAMETERS OF A CONSUMPTION FUNCTION
Zeynep OZTURK
Table 7: Comparing Models
AIC BIC Adjusted R2
Model 19931,73 19952,81 0,414
Model 1 19937,87 19953,68 0,417
Model 2 19911,88 19934,97 0,425
Model 3 19908,44 19934,80 0,427
The Akaike Information Criterion (AIC), the Bayesian Information Criterion (BIC) and adjusted R2 are methods for selecting a model. According to Table 7, Model 3 with the lowest AIC and BIC values and the largest R squared is preferred as the best model. The model 3 is also important for the evaluation of all parameters
Discussion
In social science studies, the use of categorical data is more common, in contrast to quantitative data. It is important to evaluate the studies on categorical data statistically. Categorical data can be used both as independent variable and de-pendent variable in regression models. A dummy variable is created by assigning a value of 1 as a reference group to one of the categories of categorical variables and a value of 0 to other categories. Looking at models with dummy variables, it is also divided into two models as independent dummy variable and dependent dummy variable. In this study, models of independent dummy variables; fixed term, slope parameter and effects on interaction effect. Since the data of a study by Besballi etc. 2017 was used, it was not necessary to give the least squares as-sumptions of the models, descriptive statistics of the data, sample selection and number. Models made according to the changes in the parameter of the gender factor were created, so comparisons were made. According to the results of the model made according to the changes in the parameters, it is seen that both the marginal tendencies of male and female students and autonomous tendencies to be consumed are different from each other and the gender factor shows a dis-tinctive feature regarding consumption expenditures. When the models are com-pared, the model approaching the changes in all coefficients is seen as the best model. The study will also inform the researchers who will contribute to the lit-erature of dummy variable models and how to add the parameters to the model.

PERSPECTIVES ON MODERN ECONOMY
Aizhan KHOICH, Ali Eren ALPER, Ahmet Arif EREN
363
References
Agresti, A. (2007). An Introduction to Categorical Data Analysis. Second Edi-tion, JohnWiley & Sons, Inc.
Besballi, S. G. & Ozturk, Z. (2017). Artvin Çoruh Üniversitesi Öğrencilerinin Harcamalarının Artvin Ekonomisine Katkısı, Karadeniz Araştır-maları Dergisi, 56, 135-157.
Besballi, S. G. & Ozturk, Z. (2018), “Doğrudan, Dolaylı ve Uyarılmış Ekono-mik Katkılar: Artvin Çoruh Üniversitesi Örneği”, İşletme Araştır-maları Dergisi (Journal of Business Research-Turk), 10(3) 788--803.
Demiral, M. (2007). “Türkiye Ekonomisi İçin Tüketim Fonksiyonu Tahmini (1980 - 2005)”, Karamanoğlu Mehmetbey Üniversitesi Sosyal ve Ekonomik Araştırmalar Dergisi, 2, 349-366.
Grotenhuis, M. & Thijs, P. (2015), “Dummy variables and their interactions in regression analysis: examples from research on body mass index”, http://arxiv.org/abs/1511.05728, 1-18.
Gujarati, D. N. (2004). Basic Econometrics, Four Edition, The McGraw Hill Companies.
Gujarati, D. N. (2014). Econometrics by Examples, Second Edition, Red Globe Press.
Hardy, M. A. (1993). Regression with Dummy Variable, Newbury Park, CA: Sage.
Hardy, M. & Bryman A. (2009). The Handbook of Data Analysis, Paperback Edition, Sage Publications Inc.
Kennedy, P (1986). “Interpreting dummy variables” Review of Economics and Statistics, 68, 174-175.
Poo, J. R. & In cooperation with Ignacio Moral, M. Teresa Aparicio, Inmac-ulada Villanua, Pavel Cizek, Yingcun Xia, Pilar Gonzalez, M. Paz Moral, Rong Chen, Rainer Schulz, Sabine Stephan, Pilar Olave, J. Tomas Alcala and Lenka Cizkova, (2003), Computer-Aided Intro-duction to Econometrics, Santander, Spain, 102-111.
Suits, D. B. (1957). “Use of Dummy Variables in Regression Equations”. Jour-nal of the American Statistical Association, 52(280), 548-551.

364
THE INDEPENDENT DUMMY VARIABLE MODELS DEALING WITH CHANGES IN PARAMETERS OF A CONSUMPTION FUNCTION
Zeynep OZTURK
Suits, D. B. (1984). “Dummy variables: Mechanics v. interpretation” Review of Economics and Statistics, 66, 177-180.
Wooldridge, J. M. (2013). Introductory Econometrics: A Modern Approach, Fifth Edition, South-Western.
Zortuk, M. (2009). Cinsiyet Değişkeni Bağlamında Harcama Alt Grupları ve Gelir İlişkisi: Dumlupınar Üniversitesi Öğrencileri Üzerine Bir Uy-gulama, Dumlupınar Üniversitesi Sosyal Bilimler Dergisi, 23, 25-3

365
22COVID-19 AND ITS REFLECTION TO CONSUMER BEHAVIORSevilay USLU DİVANOĞLU1, Resul ÇELİK2
Introduction
Epidemics, wars, disasters and other natural events that occur at unexpected times around the world pose great threats to the world. The virus, which was first detected in Wuhan, Hubei city of China in December and called “2019-nCoV”, is known as the Coronavirus (Covid-19). The World Health Organiza-tion (WHO) announced on February 11 that it was declared as a “pandemic”, which means global epidemic, after naming the disease caused by coronavirus as Covid-19 (BBC, 2020).
With the emergence of the new type of Corona virus in China, the rapid spread of the epidemic throughout the world reveals that the epidemic is a global threat. Among the reasons for the rapid spread of Covid-19 on a global scale, it is seen that the international travels of the infected individuals for tourism, trade, educa-tion etc. are effective (Wilson & Chen, 2020: 2). Since the outbreak of Covid-19, the studies and reports published by the World Health Organization are observed with concern by states and citizens (Acar, 2020).
It is estimated that the effects of this epidemic on normal life cannot be fully cal-culated and the uncertainty regarding how long the epidemic will continue will remain for a long time (Atay, 2020). With the global spread of the Covid-19 Pan-demic, various measures are taken by all nation states against the virus with the recommendations of the World Health Organization and the guidance of scien-tists. Among these measures, entry and exit bans between countries, especially social isolation, and many events, concerts, football competitions, congresses have been canceled, and restrictions have been imposed in many sectors such as
1 Assoc. Dr., Aksaray Üniversitesi, Business Administration Faculty of Economics and Admin-istrative Sciences
2 Lecturer, Mersin University, Anamur Vocational School

366
COVID-19 AND ITS REFLECTION TO CONSUMER BEHAVIOR
Sevilay USLU DİVANOĞLU, Resul ÇELİK
tourism, transportation etc. In addition, many commercial businesses, including food and health services, were suspended or restricted on production and services.
It is thought that the Covid-19 pandemic, which has been seen to threaten the economic system to a great extent, will permanently change the way people live and work as a result of measures such as partial or complete curfews in the set-tlements of the countries, entry and exit bans in cities. It is thought that the ef-fects of this worldwide epidemic process on the consumer goods industry will be strong (Yıldız, 2020).
Consumer behavior varies significantly in times of crisis or epidemic that devel-ops globally or on a country basis. The periods when expenses for needs such as food, shelter and health are the highest are the times of crisis. Both employed and unemployed consumers are generally concerned with basic needs such as food, shelter and health (Starr, 2010). Therefore, consumer spending is shifting from an arbitrary purchase drive to purchasing existential needs (Bohlen, Carlotti and Mi-has, 2010). Generally speaking, consumers form the strategy of determining their priorities according to basic needs in the expenses of limited financial resources.
Reed and Crawford (2014) examined consumer spending in situations of eco-nomic crisis, recession, and recovery. The results show that during the recession, the relative importance of home-made food increased, durable goods and sup-plies decreased and the importance of renting increased. It has been observed that the fulfillment of physiological needs is the primary concern of consumers. Ga-nong and Noel (2019), in their study among 27,740 US households consuming unemployment benefits, say that families have the first physiological needs they meet even when they consume their unemployment income. In general, consum-ers are the people who pay more attention to recessions / crises. Also, it is known that consumers act by calculating the long-term consequences of their expenses during epidemic / crisis periods.
It is seen that the main factor of the change in consumer behavior in recent months is the economic contraction caused by the Covid-19 epidemic in the world. Consumers expect businesses to establish a fast and reliable return system in order to act strategically and to make an impact on them. The primary ex-pectation of consumers in this period that detailed technical information about the products, responsible behavior towards public health and and it seems that

PERSPECTIVES ON MODERN ECONOMY
Aizhan KHOICH, Ali Eren ALPER, Ahmet Arif EREN
367
consumers expect support on practical applications that can be performed at home (PazarlamaTürkiye, 2020).
Within the scope of this study, the emergence of the Covid-19 outbreak, other major epidemics worldwide, and the trend of change in consumer behavior were examined. TEPAV (2020), COVID-19 consumer spending by the Central Bank of the Turkish Republic on credit and debit card spending amounts according to expenditure item out of consumers’ weekly/monthly spending and monthly/an-nual changes with supply/demand trends were set out in the sectorial base. This study is important due to the small number of studies investigating consumer behavior during the COVID-19 pandemic period.
Various Epidemic Diseases (Pandemics) and Covid-19 Throughout History
Epidemic diseases can occur in a country or region, and if early isolation meas-ures are not taken, they can affect the whole world in a short time and they cause many people to become infected and die. Epidemic diseases can be trans-mitted from person to person, as well as from other living things to humans or from humans to other creatures. Throughout human history, many epidemic dis-eases such as plague, typhoid, cholera etc. have been seen and these diseases have caused the death of many people. The plague has been one of the epidemic dis-eases that have affected the whole world the most. The disease, which emerged in China in the 1300s, spread to Europe and caused the death of approximately 75 million people (İbiş, 2020).
Spanish Flu is one of the epidemic diseases, which is considered the biggest pan-demic in human history, which has a strong impact on the world. This influenza, originating from the Far East, emerged near the city of Cong-King in the mid-dle of China at the end of 1917 and spread throughout the world and caused the death of approximately 100 million people in a short period of 18 months (Kırık, Var, Özkoçak, Darıcı, 2020). Although the Spanish Flu, which emerged at the end of the First World War, was effective in 1918, its effects continued in the 1920s in some places. This flu, which spread around the world, had seri-ous political, military and social consequences (Yolun, 2012). In addition, scien-tists working on diseases say that the Spanish Flu first appeared in Haskell, Kan-sas State (Acehan, 2020).

368
COVID-19 AND ITS REFLECTION TO CONSUMER BEHAVIOR
Sevilay USLU DİVANOĞLU, Resul ÇELİK
Another epidemic is Swine Flu. This disease, which first appeared in Mexico, spread to America and from here to the world. With the change of a kind of flu virus seen in pigs, it was named Swine Flu (TTD, 2020). If we look at the im-pact of Swine Flu in 2009, it infected approximately 800,000 known people in 191 countries and caused the death of 8238 people (Aslan, 2020).
Cholera Pandemic, the disease called “Asian Cholera”, which emerged in India in the early 19th century, spread throughout the world and caused great trou-bles in the Ottoman Empire (Nizamoğlu, 2020). The disease, which started to be seen in the lands under the Ottoman protection in 1822, caused the recurrence of the disease and the death of many people in the population moving through migrations, wars, commercial activities and pilgrimage, and also left deep eco-nomic effects (Ak, 2011).
Covid-19, which first appeared in Wuhan, Hubei, China in December, according to the latest data announced by the World Health Organization, approximately 20.4 million people have been infected in more than 200 countries worldwide, and this disease has caused over 744 thousand deaths so far. (WHO, 2020).
“Coronaviruses are a large family of viruses that can cause disease in animals or hu-mans. In humans, several coronaviruses are known to cause respiratory infections, rang-ing from the common cold to more severe diseases such as Middle East Respiratory Syndrome (MERS) and Severe Acute Respiratory Syndrome (SARS). The New Coro-navirus Disease is caused by the SAR-CoV-2 virus” (T.C. Sağlık Bakanlığı, 2020).
The virus can also be transmitted by the inhalation of droplets scattered by in-fected individuals, coughing, sneezing, by healthy individuals, or by taking the hands to the face area without washing the hands after touching the surfaces they have previously touched (T.C. Sağlık Bakanlığı, 2020).
Although humanity has seen much worse pictures in terms of fatal cases and the number of people with the disease, what makes the Covid-19 outbreak differ-ent from others is that there are no other cases registered in the last 100 years when economic activities were suspended for a non-war reason and on a large scale (Escarus, 2020).
Multi-layered supply / value chains as a reflection of developed trade relations and intertwined production networks between countries. For this reason, it is
PERSPECTIVES ON MODERN ECONOMY
Aizhan KHOICH, Ali Eren ALPER, Ahmet Arif EREN
369
seen that the fact that countries have established a close network with each other from one end to the other is one of the factors that shocks the economies in the world simultaneously. It is not only the damages caused by the virus that are ex-ported from one country to another, but the disruption of the production and transportation of goods in production and trade is rapidly becoming widespread with devastating effects (Escarus, 2020).
For this reason, epidemic diseases, wars, internal conflicts, terrorist incidents, etc. not only affect the countries where they occur, but can cause the crisis to reach global dimensions. In times of crisis, consumer behavior and needs can change rapidly and panic situations that arise can cause major losses in the economy (Köşker, 2017).
Consumer Behavior in the Covid-19 Era
The truth is that the pandemic period has changed many things about our lives from politics, education, economy to consumption and continues to change rap-idly. It is seen that many behaviors or habits that did not take place in our lives before the pandemic have started to become our new normals. Changes in our thoughts and behaviors after the pandemic that has entered our lives rapidly cause consumer habits to change rapidly (Genç, 2020). It is seen that our changing habits are now accepted by the society as the “New Normal”.
One of the important facts that we have definitely learned with the pandemic is that our brain tries to keep us alive. Although we are modern and advanced in-dividuals with the developing technology, our brain works with its own unique condition. When we have worries about our lives, people move away from ra-tional thinking and start living with the motive to protect their own life. This situation directly affects human behavior and thus consumer behavior. His panic buying during the pandemic period was an example of this. When faced with risky and out-of-control situations during pandemic situations, human nature tries to take control and feel safe.
With Covid-19, the rapid evacuation of the shelves in the markets, the purchase of surplus products from pasta, oil, flour, sugar, etc., is seen as a strong reflec-tion of consumer behaviors that the human brain acts with the instinct of pro-tection (Genç, 2020). A similar situation is observed in the purchase of personal

370
COVID-19 AND ITS REFLECTION TO CONSUMER BEHAVIOR
Sevilay USLU DİVANOĞLU, Resul ÇELİK
health and hygiene products, and the consumer wants to see him/herself safely with this stock.
Business enterprises that want to make the consumer feel safe against their prod-ucts, which place the concept of trust at the center of all economic activities, have started to take some serious steps. Among these, the “Covid-19 Safe Production Certificate” and the “Covid-19 Healthy Tourism Certificate” issued by the Turk-ish Standards Institute (TSE) allow businesses to offer their products and services to the consumers in reaching domestic and foreign markets. TSE (2020) stated that the companies that received the first safe production certificate have been operating in the cities of Gaziantep, Konya, Bursa and Malatya.
For example, Yataş Group, which is entitled to receive Covid-19 Safe Production Certificate, has stated the importance not only for their customers but also for the health and safety of their colleagues and their families. They stated that show-ing the respect to human by strictly taking the necessary precautions and hygiene measures for his staff at all stages of the process from the production process to the delivery of the products (Pazarlama Türkiye, 2020). The new steps taken by busi-nesses can predict changes in consumer behavior during and after the pandemic.
There are deep concerns that COVID-19 may cause a permanent long-term change in consumer spending behavior in the global system. For instance, Haacker (2004) points out a permanent change in consumer behavior resulting from the HIV / AIDS epidemic. It is seen that there are some changes after the black plague epi-demic such as the end of feudalism and serfdom and the inclusion of women in the workforce after World War II and the increase in online shopping after Sars epidemic (Esacarus, 2020). It is seen that changing consumer behavior during the epidemic period and a worldwide decline in spending and domestic demand will pose a great challenge for the global economy.
Research company McKinsey & Company reveals how consumers control their habits in a global study on the spending habits of consumers due to the Covid -19 crisis between March 15 and April 6, 2020. According to the data of this study, it was understood that some sectors developed in the Covid-19 crisis, while a large part of the sector was struggling with the crisis (Jones, 2020).
In the Covid-19 period, it is seen that basic needs are centered in consumer spend-ing. According to the research conducted by McKinsey & Company, consumers

PERSPECTIVES ON MODERN ECONOMY
Aizhan KHOICH, Ali Eren ALPER, Ahmet Arif EREN
371
spent more expenses on their basic needs such as food, health, cleaning and hy-giene during the pandemic period compared to before the epidemic. At the global level, consumers have stated that they will increase their home entertainment spending after the epidemic ends. As the Chinese measures gradually lifted, it is seen that there is a return to consumer expenses before Covid-19 in many items such as health expenses and fuel. However, in their answers to the research, con-sumers say that they will focus on basic needs in their expenses and that they will reduce their expenses in other categories (Jones, 2020).
Covid-19 worldwide epidemic as a result of changing consumer behavior has led to the significant changes on Turkey. Because epidemics or recessions can affect all nations in the globalizing world, not the region where crises occur.
Table 1: Approaches to the public at Covid-19 Crisis in Turkey
Source: (cited in.Vatandaş, 2020).
As indicated in Table 2, McKinsey stated that the pandemic affects 43% of Tur-key’s population income negatively, 47% of the population abstains from pur-chasing new products and making investments, and 56% of the population states that they reduce their expenses.
On the other hand, during the pandemic period, as a result of measures such as people’s attention to physical contact and curfews, physical shopping has declined

372
COVID-19 AND ITS REFLECTION TO CONSUMER BEHAVIOR
Sevilay USLU DİVANOĞLU, Resul ÇELİK
to serious dimensions. Covid-19 has kept consumers away from physical con-tact and directed them to e-commerce and significantly accelerated the transfor-mation process from physical commerce to virtual commerce (Ticimax, 2020). It is known that in the epidemic period, online spending has increased and even if it is limited, the use of cards is preferred instead of paper money in order to prevent the disease.
The first case of supply of consumption curves can be seen in Turkey date March 11, 2020 and can be obtained from a variety of data requested size and In or-der to keep track of data instantly, TCMB Credit Card and Debit Card Spend-ing Amounts allow up-to-date follow-up thanks to regularly presented weekly data. In addition, according to the data of Interbank Card Center (BKM) Card Monitor research 2017, it is known that 7 out of every 10 people use cards for their expenses. It is seen that it is possible to monitor the effects of the Covid-19 pandemic on consumer spending behavior through the data announced weekly on TCMM Credit Card and Debit Card expenditure amounts (TEPAV, 2020).
The number of transactions in card expenses in the week of the first case and the following week of March 20 was 143 million and 123 million, respectively. In these transactions, 21.3 billion TL and 19.6 billion TL were spent. Compared to the week of March 9, the number of transactions increased by 10% and the amount of expenditure increased by 3% compared to the week of March 13, that is, the first week of the case, and in the week of March 20, these rates decreased by 14% and 8%, respectively (Dündar, 2020, 1-2).
As the reason for this decrease seen in the week of March 20, The first week of panic purchase made by consumers, who have seen cases in Turkey, and the need to continue the measures taken are considered to be effectively directed to the ba-sic needs of consumers with the restriction of many activities.
It is seen that the total expenses made in the first 3 weeks of March 2020 increased by 19% compared to the same period of 2019 (Dündar, 2020).

PERSPECTIVES ON MODERN ECONOMY
Aizhan KHOICH, Ali Eren ALPER, Ahmet Arif EREN
373
Table 2: Weekly Value of Credit Card and Debit Card Expenses (Million TL) and Its Change Compared to the Previous Week
Source: (cited in. Dündar, 2020)
According to the CBRT’s TEPAV calculations data, it is seen that consumer ex-penses in the market / shopping center and basic food products increased com-pared to the previous year with the first case in March 2020 and the implemen-tation of the measures / restrictions taken afterwards (Dündar, 2020). According to the data in Table 2, it is seen that the expenses made in the market / shopping center and basic food products in the first week increased by 20% compared to the previous week to 4.413 Billion TL, and in the following week, 4.413 Billion TL was spent by increasing 19%.
Health, personal care and cleaning products are among the changes in con-sumer behavior caused by people closing home during the pandemic process. In statements made especially by Republic of Turkey Ministry of Health Scientific

374
COVID-19 AND ITS REFLECTION TO CONSUMER BEHAVIOR
Sevilay USLU DİVANOĞLU, Resul ÇELİK
Committee and by experts to prevent disease that suggestions such as washing hands and clothes frequently and cleaning surfaces have increased the demand for personal care and cleaning products. As a result of increasing demand, in the first week, the expenses made increased by 11% compared to the previous week and were 953 million TL, in the next week, it is seen that 932 million TL was spent with a decrease of 2%.
With the rapid spread of Covid-19 on a global scale, the spending by consum-ers has started to decrease rapidly as of February, due to the countries closing the borders mutually, airway transportation is risky and the contamination rate is high. It is observed that the expenses made by airlines decreased by 11% in the first week of the case and 35% in the second week. In addition, as a result of re-strictions and cautionary decisions, accommodation expenses decreased by 11% and 40% respectively in the first and second weeks of March compared to the previous week. Dündar (2020) says that when a comparison is made according to 2019 expenses, accommodation expenditure decreased by 9%, airline expend-iture by 20% and agency / transportation expenditure by 22% in March 2020.
Today, with strong investments in technology, users can safely meet their needs in many areas over the internet. Thanks to the importance given to the internet in-frastructures of these institutions, which are frequently used by consumers such as education, health, clothing, banking, online education, transportation has become easier (Localveri, 2020). It is understood that the measures taken for the control of the pandemic and the calls to stay at home have increased the spending of the consumers over the internet or by phone. It is seen that online shopping in card expenses increased by 8% to 4.2 billion TL in the week of March 13, when the epidemic first broke out compared to the first week of March, and reached 4.832 billion TL in the week of May 15 with an increase of 14% compared to the week of March 13. It is understood that the increase in the expenses made on the In-ternet is a strong indicator that consumers are rapidly turning to e-commerce.
In March, it is observed that clothing and accessories expenditures decreased by 47%, food expenditures by 42% and spending in casino / drinking places de-creased by 53%. It is observed that the closure of shopping malls for a certain period of time, removing the seating arrangement in restaurants, providing only package service and temporarily suspending the activities of entertainment centers cause a decrease in the expenses made by consumers in these sectors.

PERSPECTIVES ON MODERN ECONOMY
Aizhan KHOICH, Ali Eren ALPER, Ahmet Arif EREN
375
In general, it is understood that the priorities of purchasing in March caused a rapid change in consumer spending. In this period, it has been observed that con-sumers diverted their expenses, especially health products and basic food, to these products, and rapidly reduced their expenses, especially in the airlines, travel agen-cies / transportation and entertainment sector.
Figure 1: Number of debit and credit card transactions and their expenditure amount, February 7 - May 15, 2020
Source: (TEPAV, 1)
When the values in Figure 1 are examined, it is seen that 17.3 billion TL was spent using the card in the second week of May, and it increased by 4% com-pared to the previous week. It is seen that the number of expenses made increased by 10% to 99 million. When compared to 2019, it is seen that the amount of expenditures made between 13 March - 15 May 2020 is 19%. With the nor-malization plan announced at the beginning of May, when the number of trans-actions decreased by 16%, it is seen that the amount of expenses made by con-sumers caught 2019 in the first week and exceeded the value obtained in the second week of May compared to the same week of 2019.
Among the total expenses of 17.297 billion TL by the consumers in the week of May 15, 4.489 billion markets and shopping centers, 1.650 billion electronic goods, 1.298 billion service sector, 1.408 billion various foods and 947 million clothing and accessories expenses are seen. It has been observed that 4.832 billion of total expenditures were made through the internet and 890 million by telephone. In the week of May 15, when compared to the previous week, the expenses of mar-kets and shopping centers decreased by 0.2% and Electrical-Electronic Appliances and Computers decreased by 1%, so these decreased online shopping by 3%. In the week of May 15, when the normalization plans were announced, there was a decrease in a very small number of sectors compared to the previous weeks. It was understood that the highest decrease was in gasoline and fuel station expenses

376
COVID-19 AND ITS REFLECTION TO CONSUMER BEHAVIOR
Sevilay USLU DİVANOĞLU, Resul ÇELİK
with 7%. In the same week, the highest increase was seen in the expenditures of airlines, private pensions and clothing and accessories, respectively.
Result
The Covid-19 pandemic caused an unexpected crisis in the world, and it is seen that in these periods, consumers’ personal reflexes direct them to the effort of survival and try to ensure “self-sufficiency”. Accordingly, it is seen that the rapid change in the behavior of the consumers also changes in the consumption behav-ior. It is known that the most important change in the pandemic on consumer behavior is that it directs social life and commercial life to digitalization and ar-bitrary expenses to be replaced by existential needs expenses.
Consumers have started to spend their social lives at home due to the measures taken during the pandemic period, and this has shown that e-commerce supports a large increase in the world. Compared to the pre-epidemic period, it is seen that consumers increasingly continue to shop online during the weeks when the epidemic started and during the month of May, as announced by the normaliza-tion plans. It is understood that especially the increasing e-commerce directs even people aged 60 and over who live far from technology to this area and it causes these people to meet with technology.
Due to the panic created by the Covid-19 pandemic around the world, it is seen that the physiological needs expenditures, which consumers give priority to their physiological needs, have increased in March, April and May 2020 com-pared to the same period of 2019. Consumers have increased their spending es-pecially in basic food, health, personal care and cleaning products during the ep-idemic period, and there is a decrease in the demand for airline, accommodation and clothing products.
In this study, the effect of COVID-19, which is a disease with a high rate of trans-mission compared to other epidemic diseases, on consumer behavior has been evaluated according to the product and product groups. In this study, which was carried out by using qualitative research management, current articles and news sources about the current agenda were used along with the literature. For future studies on this subject, what consumers expect from brands and products can be done with a quantitative study to investigate what they will constantly change in their lives with Covid-19.

PERSPECTIVES ON MODERN ECONOMY
Aizhan KHOICH, Ali Eren ALPER, Ahmet Arif EREN
377
References
Acar, Yusuf (2020). Yeni Koronavirüs (Covıd-19) Salgını ve Turizm Faaliyetler-ine Etkisi. Güncel Turizm Araştırmaları Dergisi, 4(1), 15
Acehan, I. (2020). “İspanyol Gribi Zamanında Hayat: Unutulan Salgında Nel-er Yaşanmıştı?”, https://forumusa.com/amerika-usa-amerika-bir-lesik-devletleri/ispanyol-gribi-zamaninda-hayat-unutulan-sal-gin-da-neler-yasanmisti/, Erişim Tarihi: 06.06.2020.
Ak, M. (2011). “19. Yüzyılda Antalya’da Kolera Salgını”, Uluslararası Sosyal Araştırmalar Dergisi, Sayı:17, 254-268
Aslan, Recep (2020). Tarihten Günümüze Epidemiler, Pandemiler ve Koro-navirüs. Göller Bölgesi Aylık Ekonomi ve Kültür Dergisi, 8(85).
Atay, Lütfi (2020). Covid - 19 Salgını ve Turizme Etkileri, Seyahat ve Otel İşletmeciliği Dergisi, 17(1).
BBC (2020). https://www.bbc.com, Erişim Tarihi: 03.06.2020.
Bohlen, B., Carlotti, S., & Mihas, L. (2010). How the recession has changed US consumer behavior. McKinsey Quarterly, 1(4), 17- 20.
DSÖ. (2020). https://covid19.who.int/, Erişim Tarihi: 14.08.2020.
Ganong, P., & Noel, P. (2019). Consumer spending during unemployment: Positive and normative implications. American Economic Review, 109(7), 2383-2424.
Genç, S. (2020). Covid-19: Tüketiciler Ne İstiyor, Markalar Ne Yapıyor? https://hbrturkiye.com/blog/covid-19-tuketiciler-ne-istiyor-markal-ar-ne-yapiyor ,
Haacker, M. (2004) The Impact of HIV/AIDS on Government Finance and Public Services International Monetary Fund, Washington
İbiş, S. (2020). Covid-19 Salgınının Seyahat Acentaları Üzerine Etkisi. Safran Kültür ve Turizm Araştırmaları Dergisi, 3(1): 85-98.
Jones, K. (2020). How COVID-19 Consumer Spending is Impacting Indus-tries. Visual Capitalist. https://www.visualcapitalist.com/consum-er-spending-impacting-industries/ , Erişim Tarihi: 03.06.2020.
Kırık, A. M., Var, S. S. A., Özkoçak, Ö. Ü. V., & Darıcı, Ö. Ü. S. Pandemi Dönemlerinde İletişim Ve Algı Yönetimi: Yeni Koronavirüs Hast-alığı (Covid-19) Örneği Öz.

378
COVID-19 AND ITS REFLECTION TO CONSUMER BEHAVIOR
Sevilay USLU DİVANOĞLU, Resul ÇELİK
Köşker, H. (2017). Krizlerin Turizm Sektörüne Etkileri Üzerine Bir Araştırma: 2016 Yılı Türkiye Örneği. Akademik Bakış Dergisi(62), 216-230.
Reed, S., & Crawford, M. (2014). How does consumer spending change dur-ing boom, recession, and recovery? U.S. Bureau of Labour Statis-tics, 3(15), 1- 6.
Starr, M. A. (2010). Recession and the social economy. In Consequences of Economic Downturn (pp. 189-214). Palgrave Macmillan, New York.
T.C. Sağlık Bakanlığı. (2020). COVID-19 (Yeni Koronavirüs Hastalığı) Ne-dir? https://covid19bilgi.saglik.gov.tr/tr/covid-19-yeni-koronavi-rus-hastaligi-nedir, Erişim Tarihi: 03.06.2020.
TEPAV, 2020. COVID-19’un Tüketici Harcamalarına Etkisi, https://www.tepav.org.tr/upload/mce/2020/bultenler/tuketici_harcamalari/covid19un_tuketici_harcamalarina_etkisi_bulteni_260520.pdf , Erişim Tarihi: 03.06.2020.
Türk Toraks Derneği, (2020) https://www.toraks.org.tr/halk/News.aspx?de-tail=2873, Erişim Tarihi: 06.06.2020.
Vatandaş, S. (2020). McKinsey Araştırması: COVID-19 Kriziyle Değişen Tüket-ici Harcamaları ve Türkiye. Sivil Sayfalar. https://www.sivilsayfalar.org/2020/05/04/mckinsey-arastirmasi-covid-19-kriziyle-degis-en-tuketici-harcamalari-ve-turkiye/
WHO. (2020). Situation Reports. WHO, https://www.who.int/docs/default-source/coronaviruse/situation-reports/20200421-sitrep-92-cov-id-19.pdf?sfvrsn=38e6b06d_4, Erişim Tarihi: 26.05.2020.
Wilson, M.E. ve Chen, L. H. (2020). Travellers Give Wings to Novel Corona-virus (2019-nCoV). Journal of Travel Medicine, 1–3. https://doi.org/10.1093/jtm/taaa015. Erişim Tarihi: 06.06.2020.
Yıldız, S. (2020). COVID-19 ile Değişen Tüketici Davranışları, https://cov-id19.tabipacademy.com/2020/05/18/degisen-tuketici-davranis-lari/ , Erişim Tarihi: 27.05.2020.
Escarus, (2020). Bir Eko-Sosyal Kriz Olarak Covid-19 Salgını Ve Sürdürülebil-irlik Raporu, 8-12 http://escarus.com/i/content/512_2_Escarus_Bir_Eko-Sosyal_Kriz_Olarak_Covid-19_Salgini_ve_Surdurulebil-irlik_052020.pdf, Erişim Tarihi: 07.06.2020

PERSPECTIVES ON MODERN ECONOMY
Aizhan KHOICH, Ali Eren ALPER, Ahmet Arif EREN
379
Pazarlama Türkiye, (2020). Endişe Azaldı, Planlı Alışveriş Dönemi Başladı, https://pazarlamaturkiye.com/endise-azaldi-planli-alisveris-done-mi-basladi/,Erişim Tarihi: 11.06.2020
Ticimax, (2020). Corona Virüsünün E-ticarete Etkisi, https://www.ticimax.com/blog/corona-virusunun-e-ticarete-etkisi, Erişim Tarihi: 11.06.2020
Localveri, (2020). Koronavirüs’ün Etkileri: Her Alanda Dijitalleşme!, https://localveri.com.tr/blog/e-ticaret-2/koronavirusun-etkileri-her-alan-da-dijitallesme/, Erişim Tarihi: 11.06.2020
TSE, (2020). Güvenli Üretimde İlk Belgeler Verildi, https://www.tse.org.tr/Icerik/HaberDetay?HaberID=15867 , Erişim Tarihi: 11.06.2020
Pazarlama Türkiye, (2020). Yataş Grup Güvenli Üretim Belgesi Aldı, https://pazarlamaturkiye.com/yatas-grup-guvenli-uretim-belgesini-al-di/,Erişim Tarihi: 11.06.2020


SECTION VPUBLIC FINANCE


383
23GOVERNMENT REVENUES AND EXPENDITURES NEXUS: NEW EVIDENCE FROM GIIPS COUNTRIESFatih AKÇAY1, Sevinç YARAŞIR TÜLÜMCE2
Introduction
The relationship between public revenues and expenditures in public econom-ics is very important due to the concept of budget deficits. Budget deficits cover both public revenues and expenditures. Public revenues and expenditures are at the center of fiscal policy from a public economics perspective. Fiscal policy aims to ensure macroeconomic stability, economic growth and equality in income dis-tribution. While public expenditures made to achieve these goals reflect the po-litical choices of governments; public revenues constitute the financing aspect of these public expenditures. Most of the public revenues are based on taxes, par-ticularly in developing countries.
The difference between public revenues and expenditures is defined as budget deficit. There are basically two reasons for budget deficits. The first reason is high expenditure and the second one is low revenue. Regardless of the reason, budget deficits have many negative economic, social and political effects. Com-bating with budget deficits is vital to eliminate these negative effects. In order to eliminate the budget deficits, it is necessary either to increase the revenues or to decrease the expenditures. Even two methods can be applied at the same time. However, in order to decide which policy to implement, it is necessary to deter-mine the direction of causality between public revenues and public expenditures.
1 Asst. Prof. Dr., Pamukkale University, Faculty of Economics and Administrative Sciences, Public Finance, Denizli, Turkey, e-mail: [email protected] (ORCID ID: 0000-0001-8542-1127),
2 Assoc. Prof. Dr., Pamukkale University, Faculty of Economics and Administrative Sciences, Public Finance, Denizli, Turkey, e-mail: [email protected] (ORCID ID: 0000-0003-0198-5545)

384
GOVERNMENT REVENUES AND EXPENDITURES NEXUS: NEW EVIDENCE FROM GIIPS COUNTRIES
Fatih AKÇAY, Sevinç YARAŞIR TÜLÜMCE
Governments use the budget as a planning tool to fulfill their functions and in-crease the welfare of society. Therefore, the better they analyze the causality re-lationship and direction between the government’s revenues and the govern-ment’s expenditures, the easier they will be able to manage their budget deficits (Rezaei, 2014: 1-2).
In the following parts of this paper, the theoretical and empirical literature be-tween public revenues and expenditures is discussed. The fourth part represents the data, methodology and includes empirical findings. The last part concludes with policy implications for the causal linkage between public revenues and ex-penditures for GIIPS countries.
Theoretical Background
The role of the government has increased in overcoming the total demand short-age when the Keynesian approach existed. However, the size of the public sector in countries has expanded with the implementation of expansionary fiscal policies during recession periods. In addition, as a result of preventing Keynesian policies with the phenomenon of stagflation, the effects of budget deficits on economic growth and economic stability have begun to be questioned again.
At this point, one of the main problems of public finance is to analyze the rela-tionship between public revenues and expenditures. This is because budget defi-cits that occur as a result of public expenditures exceeding revenues are closely related to revenues and expenditures variables. In this context, determining the direction of causality between public revenues and expenditures is very important in the sustainability of budget deficits. Because the different way of financing high budget deficits has different economic consequences. Budget deficits, especially financed by borrowing or high taxes, bring about various economic problems.
The existence of budget deficit problems in countries brings to mind the follow-ing questions: The first one is whether it is possible to finance the budget defi-cit by increasing taxes. Second, is reducing public expenditures the solution to the budget deficit problem? Thirdly, what should be done if public revenues or public expenditures are determined independently of each other? Finally, if there is an interaction between public revenues and expenditures, how can the budget deficit problem be resolved? All of these issues are discussed in the public reve-nue and expenditure theoretical literature.
PERSPECTIVES ON MODERN ECONOMY
Aizhan KHOICH, Ali Eren ALPER, Ahmet Arif EREN
385
In this context, the tax-spend theoretical literature contains four different hypoth-eses regarding the direction of causality between two variables. These hypotheses are the tax-spend (revenues-expenditures), the spend-tax (expenditures-revenues), fiscal synchronization and institutional separation (fiscal independence) hypothesis.
A) The tax-spend hypothesis: The basis of this hypothesis is based on the studies of Buchanan and Wagner (1977) and Friedman (1978). In the studies of Buchanan and Wagner (1977,1978), it is stated that an increase in tax rates due to finan-cial illusion has effects on public expenditures. According to Friedman (1978), high taxes mean high public expenditures that cause larger budget deficits. It is claimed in this hypothesis that increasing taxes will cause more expenditures and budget deficits cannot be reduced when taxes are increased. Because increasing taxes only increase expenditures (Narayan, 2005: 1205). For this reason, taxes should be reduced. If there is a reduction in taxes, the spending levels of govern-ments also decrease. Otherwise, governments spend more than the tax they col-lect. As a matter of fact, governments like to spend (Rezaei, 2014: 3). The empir-ical finding of this hypothesis is that it shows the existence of a causality running from public revenues to public expenditures.
B) The spend-tax hypothesis: The causality is running from expenditures to rev-enues in spend-tax hypothesis which proposed by Barro (1974,1979) and Peo-cock-Wiseman (1979). It is based on the assumption that expenditures are deter-mined before revenues. Barro (1974, 1979) states that financing budget deficits with borrowing/taxes will have the same effects on the economy. But rational in-dividuals know that increasing public spending today will be financed by future tax increases. Therefore, according to Barro, budget deficits bring future tax in-creases. Peocock-Wiseman (1979) see the reasons for the increase in public ex-penditures as extraordinary cases and crisis. Therefore, it forms the basis of the hypothesis that governments will increase public expenditures and that increased expenditures will be financed by high taxes. Expenditures increasing as a result of crises and extraordinary situations increase taxes. Public expenditures that in-crease in times of crisis are replaced by private expenditures. Increasing public spending does not return to its original level after the crisis. As a result, tax in-creases become permanent (Obeng, 2015: 4).
C) Fiscal Synchronization Hypothesis: In this hypothesis proposed by economists such as Musgrave (1966) and Meltzer and Richard (1981), it is argued that

386
GOVERNMENT REVENUES AND EXPENDITURES NEXUS: NEW EVIDENCE FROM GIIPS COUNTRIES
Fatih AKÇAY, Sevinç YARAŞIR TÜLÜMCE
governments make decisions on public spending and taxes simultaneously or to-gether. In this hypothesis, there is a feedback effect between public revenues and expenditures (Obeng, 2015: 4). To decrease the level of fiscal deficits, raising rev-enues and declining spending simultaneously is the optimal policy (Tashevska, 2018: 469). The existence of a bidirectional causality between the two variables is the empirical finding of this hypothesis.
D) Institutional Separation Hypothesis: The basis of this hypothesis, claimed by economists such as Baghestani and McNown (1994), is that public revenues (taxes) and expenditure decisions are taken independently of each other. The em-pirical assumption of this hypothesis is that there is no causality between the two variables. In addition, in this hypothesis, the relationship between public reve-nues and expenditures is determined by economic growth reflecting the institu-tional distinction (Al-Qudair, 2005: 33). However, the fact that two variables do not affect each other may occur not only from an institutional point of view but also for various reasons.
Each of these hypotheses offers different arguments for the existence of budget deficits and the role of the government in the economy. In addition, each hy-pothesis has different policy implications and benefits. However, the empirical findings of these hypotheses differ in the investigation of the relationship between government revenues and expenditures.
The Overview of Empirical Literature
There is no clear evidence for empirical analysis of the relationship between gov-ernment revenues and expenditures in the literature, and even quite complex re-sults are observed in empirical studies. Although there are many studies on gov-ernment revenues and expenditures nexus, there is no consensus in the empirical literature. Results vary from country to country, as well as within countries.
The studies that put forward the tax-spend hypothesis are; Huang and Tang (1992) for Taiwan, Park (1998) for Korea, Chaudhuri and Sengupta (2009) for In-dia, Etia and Mbazima (2008) for Namibia, Young (2009) for the USA, Gar-cia (2012) for Spain, Rezaei (2014) for Iran, Obeng (2015) for Ghana, Darrat (1998) for Turkey, etc. The studies revealing the validity of the spend-tax hypoth-esis are; Anderson et al. (1986) for the USA, De Haan and Siermann for Neth-erland (1993), Kollias and Makrydakis (1995) for Greece, Hondroyiannis and

PERSPECTIVES ON MODERN ECONOMY
Aizhan KHOICH, Ali Eren ALPER, Ahmet Arif EREN
387
Papapetrou (1996) for Greece, Payne (1997) for Canada, Mithani and Khoon (1999) for Malaysia (1999), for Turkey; Akçoraoğlu (1998), Pınar (1999), Akb-ulut and Yereli (2016), Terzi and Oltulular (2006), Çavuşoğlu (2008) etc. Stud-ies presenting findings on fiscal synchronization hypothesis are; Kimenyi (1990) for Kenya, Hasan and Sukar (1995) for US, Hasan and Lincoln (1997) for UK, Li (2001) for China, Al-Qudair (2005) for Saudi Arabia, Yashobant and Behera (2012) for India, Çiçek and Yavuz (2014) for Turkey, etc. The studies that have reached institutional separation hypothesis findings are; Baghestani and McNown (1994) for the US, Akçağlayan and Kayıran (2010) for Turkey, Richter and Dim-itrios (2013) for Greece, Ndoricimp (2013) for Burundi, etc.
In addition to these studies, there are also some studies involving different country groups but presenting more than one hypothesis findings. Some selected studies from different country groups are listed below in chronological order.
In Owoye study (1995), Income-expenditure hypotheses are tested with coin-tegration, Eangle Granger, ECM methods for the G7 countries between 1961-1990 years. Some findings are; there is a bidirectional causality relationship in 5 out of 7 countries, and there is a causality from public revenues to expendi-tures in Japan and Italy.Chang et al. (2002) analyzes the relationship between public expenditures and taxes by Johansen cointegration method in 10 industri-alized countries. Cointegration between variables is valid in 7 countries. In ad-dition, the existence of a causality from government revenues to expenditures is detected in the USA, South Korea, UK, Japan and Taiwan. In South Africa and Australia, there is a causal relationship from government spending to revenues. It is expressed in the study that incomes and expenditures are determined inde-pendently from each other in New Zealand and Thailand.
Narayan (2005) reveals with ARDL method in 9 Asian countries that the Tax-spend hypothesis is valid in Nepal in the long and short term while it is valid in the short term in Singapore, in Indonesia and Sri Lanka. On the other hand, in the long run, evidence of the Fiscal neutrality hypothesis in other countries as well as the Spend-tax hypothesis in Indonesia and Sri Lanka are also found. In the study conducted by Narayan and Narayan (2006) for 12 developing coun-tries, with Toda Yamamoto causality method it is revealed that there is the valid-ity of the Tax-spend hypothesis for El Salvador, Chile, Venezuela and Mauritius.

388
GOVERNMENT REVENUES AND EXPENDITURES NEXUS: NEW EVIDENCE FROM GIIPS COUNTRIES
Fatih AKÇAY, Sevinç YARAŞIR TÜLÜMCE
It is also pointed out that there is evidence of neutrality for Peru, South Africa, Guetemala, Uruguay and Ecuador.
Wolde-Rufael (2008) tests the validity of income and expenditure hypotheses with Toda Yamamoto causality test in 13 African countries. Findings demon-strates the validity of the tax-spend hypothesis in Ghana, Ethiopia, Kenya, Ni-geria, Mali and Zamnia; the validity of the Fiscal synchronization hypothesis for Mauritius, Swaziland and Zimbabwe; the validity of the Fiscal neutrality hypothe-sis for Rwanda and Burundi. The Spend-tax hypothesis is valid for Burkina Faso. Owoye and Onafowora (2010) analyze the relationship between public revenues and expenditures between 1970-2008 in 22 OECD countries using ARDL and Toda Yamamoto methods. While the Tax-spend hypothesis is valid in 8 out of 22 countries, the Institutional separation hypothesis is valid in 12 countries in the long run according to the causality findings. In the long run, there is no evi-dence to support the Fiscal synchronization hypothesis, and in the short term, evi-dence of Fiscal synchronization is available in only 5 countries. Magazzino (2012), the relationship between public revenues and expenditures between 1980-2011 is analyzed using the panel cointegration method within the scope of panel data analysis for ECOWAS countries. The existence of bi-directional causality is ob-served only in Mali among the countries. The Tax-spend hypothesis for 5 coun-tries and the Spend-tax hypothesis for 5 countries are among the findings. In 4 countries, the Fiscal neutrality hypothesis is supported.
In the government revenue-expenditure nexus literature, Bolat (2014) first at-tempt to analyse EU 10 countries with panel bootstrap casuality test which re-ports individual country results. After that, many other researchers applied the test for different panel data of countries. In addition to Mutascu (2015) study for PIIGS countries, Esener (2019) for 22 developed and developing countries, Tashevska et al. (2020) for 5 countries of Southeast Europe etc., some of panel analysis have the findings of one or more member of PIIGS countries. For in-stance, in Bolat (2014) study, spend-tax hypothesis is valid for Portugal while tax-spend hypothesis is valid for Italy. Similar to Bolat (2014), Mutascu (2015) finds spend-tax hypothesis for Portugal, tax-pend hypothesis for Italy. But Es-ener (2019) finds neutrality for both Italy and Portugal. This result is compati-ble with Gurdal et al. (2020) that examines the tax revenue government expend-iture nexus in G7 countries for the period of 1980-2016 by using panel causality approaches. Their findings show unidirectional causality between tax revenue and

PERSPECTIVES ON MODERN ECONOMY
Aizhan KHOICH, Ali Eren ALPER, Ahmet Arif EREN
389
government expenditure. In terms of individual results, there is not any causal relationship in Italy. Therefore, there is no consensus in the literature and the re-sults may differ due to the differences in group of countries, methodology, time period and variables.
Data, Methodology and Findings
The casual link between government revenue and government expenditure for highly indebt GIIPS countries (Greece, Ireland, Italy, Portugal and Spain) is inves-tigated by using the Toda-Yamamoto (1995) method and Fourier Toda-Yamamoto method which takes structural shifts into account in a causality analysis developed by Nazlioglu et al. (2016). For GIIPS countries, general government expenditure and general government revenue data as a percentage of gdp are obtained from Eurostat database for the period 1995-2019.
Prior to test causal relationship, firstly unit root tests implemented to series. Both conventional unit root test and unit root test that take structural breaks into ac-count were used. There are three types of unit root tests in the literature that take structural breaks into account. The first is the unit root test that takes into ac-count the one sharp break, the second is the unit root test that allows two sharp breaks, and the third is the unit root test, which takes into account the gradual break. In our study, we employ no shift Augmented Dickey-Fuller (ADF) (1979) unit root test and ADF unit roof test with Fourier approximation developed by Enders and Lee (2012). By using a small number of low frequency components from Fourier approximation, it can capture the basic characteristics of a series with one or more breaks without the need to assume that the break number or break dates are known in advance (Enders ve Lee, 2012: 196). Table 1 shows the unit root tests findings, which indicates the strong evidence of stationary for the first difference of variables.

390
GOVERNMENT REVENUES AND EXPENDITURES NEXUS: NEW EVIDENCE FROM GIIPS COUNTRIES
Fatih AKÇAY, Sevinç YARAŞIR TÜLÜMCE
Table 1. Unit Root Tests Results
Level First Difference
ADF ADF
Countries No shift Fourier No shift Fourier
Gov. Exp.
Greece -1.978 -2.496 -6.801*** -2.573
Ireland -1.563 -2.565 -4.830*** -2.827
Italy -3.205 -4.124** -3.775** -4.061**
Portugal -0.822 -2.579 -4.420*** -4.106**
Spain -3.167 -3.144 -3.484* -2.383
Gov. Rev.
Greece -1.743 -2.383 -3.915** -5.182***
Ireland -1.531 -5.443*** -4.340** -3.924**
Italy -3.146 -4.733*** -4.582*** -3.626*
Portugal -4.465*** -4.640*** -4.372** -4.863***
Spain -3.559* -5.105*** -3.697** -4.518***
Note: ***, ** and * indicate the rejection of the null hypothesis of ADF tests at the 1%, 5%, 10% levels of significance, respectively. Critical values of the unit root test that does not consider structural breaks; -4.39 (1%), -3.61 (5%) and -3.24 (10%). Critical values for the Fourier ADF test are taken from Enders and Lee (2012).
Causality Tests
In this study, we examine the relationship between government revenue and gov-ernment expenditure with Toda-Yamamoto and Fourier Toda-Yamamoto causal-ity tests which are developed from Granger causality test. These approaches are based on Granger causality test which is invented VAR ) system. To overcome some problems of traditional Granger causality test, Toda- Yamamoto offered al-ternative approach (Durusu-Ciftci, 2018: 58). The Toda-Yamamoto method is based on the VAR model. Here, is the lag length and is the maximum degree of integration of the variables. This model is written as shown below:

PERSPECTIVES ON MODERN ECONOMY
Aizhan KHOICH, Ali Eren ALPER, Ahmet Arif EREN
391
(1)
where the null hypothesis ( ) is tested. The null hypothesis is tested by the wald statistic with degrees of freedom and asymptotic distri-bution. represents the dependent variable consisting of explanatory varia-bles, represents the intercept terms vector, are the coefficient matrices and are white noise residuals.
Equation (1) does not include any structural breaks. Enders and Jones (2016) stated that if structural breaks are ignored in the VAR model, the null hypoth-esis would be rejected incorrectly. Enders and Jones (2016) employ Fourier ap-proximation in VAR framework to overcome this problem and simplify determi-nation of the date, number and form of breaks.
Nazlioglu et al. (2016) extend the Toda-Yamamoto testing approach with grad-ual structural shifts using a Fourier approximation. The assumption of the in-tercept terms being constant over time is relaxed and the developed version of equation (1) by including gradual structural shifts is redefined:
(2)
Unlike the standard VAR model, is a function of time. In other words, depends on time. The following equation is found by expanding the model with the Fourier approach, which is used for smooth breaks and does not need to know the number and date of breaks:
(3)
where shows the number of frequencies, and is the amplitude and dis-placement of the frequency, respectively. Also as shown in Nazlioglu et al. (2019) Equation (4) is found by substituting equation (3) in equation (2):
(4)
where, the null hypothesis of the test shows the Granger non-causality and it is tested with the Wald statistic. However, Nazlioglu et al. (2016) stated that boot-strap critical values were produced to increase the power of the test in small sam-ples. Akaike or Schwarz information criteria are used to determine the lag length

392
GOVERNMENT REVENUES AND EXPENDITURES NEXUS: NEW EVIDENCE FROM GIIPS COUNTRIES
Fatih AKÇAY, Sevinç YARAŞIR TÜLÜMCE
Tabl
e 2. C
ausa
lity T
ests R
esults
Cou
ntrie
sC
ausa
lity
Test
s
Exp=>Rev
WA
LDχ2
boot
stra
p
Rev=>Exp
WA
LDχ2
boot
stra
pp
kp-
valu
ep-
valu
ep-
valu
ep-
valu
e
Gre
ece
TY
1-
0.08
00.
777
0.07
920.
175
0.67
60.
696
Four
ier T
Y G
C
Si
ngle
freq
uenc
y1
10.
590
0.44
20.
419
0.57
60.
448
0.45
0C
umul
ativ
e fre
quen
cy3
36.
029
0.11
00.
222
3.19
60.
362
0.41
0
Irel
and
TY
1-
0.27
90.
597
0.50
30.
059
0.80
80.
773
Four
ier T
Y G
C
Sing
le fr
eque
ncy
11
0.42
10.
516
0.46
70.
409
0.52
20.
501
Cum
ulat
ive
frequ
ency
33
4.19
60.
241
0.30
820
.382
0.00
0***
0.02
6**
Ital
y
TY
1-
2.85
80.
091*
0.09
9*0.
651
0.42
00.
445
Four
ier T
Y G
C
Sing
le fr
eque
ncy
31
7.79
50.
050*
*0.
096*
4.56
70.
206
0.24
5C
umul
ativ
e fre
quen
cy3
39.
489
0.02
3**
0.09
0*8.
919
0.03
0**
0.11
5
Port
ugal
TY
1-
0.67
50.
411
0.43
11.
316
0.25
10.
276
Four
ier T
Y G
C
Sing
le fr
eque
ncy
11
0.43
60.
509
0.50
50.
945
0.33
10.
339
Cum
ulat
ive
frequ
ency
33
5.32
10.
150
0.24
911
.258
0.01
0***
0.07
3*
Spai
n
TY
1-
2.59
30.
459
0.50
740
.192
0.00
0***
0.00
0***
Four
ier T
Y G
C
Sing
le fr
eque
ncy
31
4.26
30.
234
0.29
123
.113
0.00
0***
0.00
4***
Cum
ulat
ive
frequ
ency
23
10.9
740.
004*
**0.
033*
*19
.247
0.00
0***
0.00
3***
Not
e: T
Y : T
oda-
Yam
amot
o ca
usal
ity te
st. F
ourie
r TY
GC
: Fou
rier T
oda-
Yam
amot
o G
rang
er C
ausa
lity t
est. *
**, *
*, a
nd *
repr
esent
stat
istica
l sig
nific
ance
leve
l of
1, 5
, and
10
perc
ent,
resp
ectiv
ely. M
axim
um k
and
p a
re se
t to
3, th
en A
kaik
e inf
orm
atio
n cr
iterio
n is
used
to d
eter
min
e opt
imal
k a
nd p
. Boo
tstra
p p-
valu
es ar
e ba
sed o
n 10
00 re
plica
tions
. TY
test
is ba
sed o
n eq
uatio
n (1
) and
estim
ated
with
dm
ax eq
ual t
o 1.
Fou
rier T
Y te
st is
based
on
Eq. (
4).

PERSPECTIVES ON MODERN ECONOMY
Aizhan KHOICH, Ali Eren ALPER, Ahmet Arif EREN
393
ρ and can be used t to dtermine the number of frequency k in equation (4) (Na-zlioglu et al., 2016: 172).
Causality test results between government expenditure and government revenue are reported in the Table 2 and Table 3. While the Toda-Yamamoto test ignores the structural breaks and takes only the intercept term as a deterministic term, the Fourier Toda-Yamamoto test can detect the structural breaks with the Fou-rier approximation. According to Gormus et al. (2018), the Toda-Yamamoto test shows less distortion in small samples (such as T is about 20 observations). In ad-dition, when the sample size is around 50, the Fourier Toda-Yamamoto test with a single frequency is appropriate but if the sample size goes around or larger than 100 cumulative frequencies of Fourier Toda-Yamamoto is more reliable. Support-ing that structural breaks occur in longer time periods, as the number of observa-tions increases, it is recommended that the results of the Fourier Toda-Yamamoto test be interpreted if the Toda-Yamamoto test rejects the null hypothesis while the Fourier Toda-Yamamoto test accepts the null hypothesis. However, if To-da-Yamamoto and Fourier Toda-Yamamoto tests reject the null hypothesis to-gether, it can be stated that the robustness of the result is supported (Gormus et al., 2018: 103-104). Therefore, this study considers the single frequency results of Fourier Toda-Yamamoto approach.
Table 3 illustrates the summary of causality results. There is not any causal re-lationship (fiscal independence hypothesis) between government revenue and gov-ernment expenditure for Greece and Ireland. Both TY and Fourier TY single fre-quency indicate same findings which means robustness of results is supported. For Portugal, there is unidirectional causality running from government expend-iture to government revenue that supports spend-tax hypothesis. In Spain, there is also one-way causality but direction of causality is running from government revenue to government expenditure which implies tax-spend hypothesis. TY and Fourier TY results diverge for Italy. Considering the finding of TY, tax-spend hy-pothesis is supported for Italy that causality is running from government revenue to government expenditure. According to the Fourier TY single frequency, in-stitutional separation hypothesis which means non-granger causality finding is ob-tained. Mutascu (2015) investigate the causal relationship for GIIPS countries by using bootstrap panel Granger causality. For Portugal (spend-tax) and Ireland (no causality), same findings are obtained that amplify the power of result. Also

394
GOVERNMENT REVENUES AND EXPENDITURES NEXUS: NEW EVIDENCE FROM GIIPS COUNTRIES
Fatih AKÇAY, Sevinç YARAŞIR TÜLÜMCE
for Italy, TY result (tax-spend) is compatible with panel results. For Greece and Spain findings become different.
Table 3. Summary of Causality Tests
Countries
TY Fourier TY GC
Single frequency Cumulative frequency
Rev … Exp Rev … Exp Rev … Exp
Greece ≠ ≠ ←
Ireland ≠ ≠ →
Italy → ≠ ←
Portugal ← ← →
Spain → → ≠
Conclusion
One of the economic problems especially in developing countries is the exist-ence of budget deficits. Budget deficits are related to both public revenues and expenditures of the state. For this reason, the relationship between public reve-nues and expenditures is of great importance in ensuring macroeconomic balance and sustainability of budget deficits. In this case, we examine the GIIPS countries that face debt crisis with huge budget deficits after global financial crisis, 2008.
In countries with high budget deficits, determining the direction of the relation-ship as well as the relationship between public revenues and expenditures help to solve the problem. If there is a causal relationship from expenditures to taxes, it should be known that today’s expenditures will increase the taxes in the future be-cause increase in spending in the country increases the taxes. However, it should not be ignored that future tax increases may also have negative economic effects. At this point, it should be emphasized that each income-expenditure hypothesis focuses on different policy implications and different points. Therefore, the re-lationship between public revenues and expenditures is considerably important for decision makers in determining economic policies and is also important for economists in understanding and solving the problem.

PERSPECTIVES ON MODERN ECONOMY
Aizhan KHOICH, Ali Eren ALPER, Ahmet Arif EREN
395
In this study, the direction of the relationship between public revenues and ex-penditures for the years 1995-2019 in GIIPS countries is tested with time series techniques by using Toda Yamamoto and Fourier Toda-Yamamoto causality tests. There is strong evidence for unidirectional causal relationship running from gov-ernment expenditure to government revenue in Portugal. The main reason for the budget deficit is primarily the planning of public expenditures in Portugal. In order to reduce budget deficits, these governments should not make unneces-sary expenditures. Budget deficits can be reduced on the basis of efficiency and productivity of expenditures by focusing on spending policies. Spending without creating resources makes the sustainability of budget deficits difficult.
On the contrary, in Spain, causality is running from government revenue to gov-ernment expenditure. The tax policies are more important for budget deficits in Spain. In this case, tax reforms such as tax deduction and widening of the tax base are needed to reduce the budget deficits. For Greece and Ireland there is not any causal relationship between fiscal variables. So that, revenue and expenditure as a tool of fiscal policy should be determined independently. Therefore, in Greece and Ireland, the policy to be implemented regarding budget deficits is based on reducing public expenditures and increasing taxes.
References
Akbulut, H. and Yereli, A. B. (2016). “Kamu Gelirleri ve Kamu Harcamaları Nedensellik İlişkisi: 2006- 2015 Dönemi İçin Türkiye Örneği”, So-syo-ekonomi Dergisi, 24 (27), 103-119.
Akçağlayan, A. and Kayıran, M. (2010). “Türkiye’de Kamu Harcamaları ve Gelirleri: Nedensellik İlişkisi Üzerine Bir Araştırma”, Eskişehir Os-mangazi Üniversitesi İİBF Dergisi, 5(2), 129-146.
Akçoraoğlu, A. (1999). “Kamu Harcamaları, Kamu Gelirleri ve Keynesçi Poli-tikalar: Bir Nedensellik Analizi”, G.Ü.İ.İ.B.F. Dergisi, 2/99, 51-65.
Al-Qudair, K. H. A. (2005). “The relationship Between Government Expend-iture and Revenues in the Kingdom of Saudi Arabia: Testing for Cointegration and Causality”, Econ &Adm., Vol: 19, No:1, 31-43.
Anderson, W., Wallace, M. S. and Warner, J. T. (1986). “Government Spend-ing and Taxation: What Causes What?”, Southern Economic Journal ,56, 24-31.

396
GOVERNMENT REVENUES AND EXPENDITURES NEXUS: NEW EVIDENCE FROM GIIPS COUNTRIES
Fatih AKÇAY, Sevinç YARAŞIR TÜLÜMCE
Baghestani, H. and McNown, R. (1994). “Do Revenue Or Expenditure Re-spond To Budgetary Disequilibria”, Southern Economic Journal, 61, 311–322.
Barro, R. J. (1974). “Are Government Bonds Net Wealth?”, Journal of Political Economy, 82 (6), 1095- 1117.
Barro, R. (1979). “On the Determination of Public Debt”, Journal of Political Economy, 87, 940-971.
Bolat, S. (2014). Bolat (2014). “The Relationship Between Government Reve-nues and Expenditures: Bootstrap Panel Granger Causality Analya-sis on European Countries”, The Economic Research Guardian, 4(2), 58-73.
Buchanan, J. M., and Wagner, R. W. (1977). Democracy İn Deficit: The Political Legacy Of Lord Keynes, New York: Academic Press.
Buchanan J.M and Wagner, R.W. (1978). “Dialogues Concerning Fiscal Reli-gion”, Journal of Monetary Economics, 4, 627-636.
Chang, T., Liu, W. R. and Caudill, S. B. (2002). “Tax-and-Spend, Spend-and-Tax, Or Fiscal Synchronization: New Evidence From 10 Coun-tries”, Applied Economics, 34, 1551–61.
Chaudhuri, K. and Sengupta, B. (2009). “Revenue-Expenditure Nexus for Southern States: Some Policy Oriented Econometric Observations” Madras School of Economics, India, Working Paper 48/2009.
Çavuşoğlu, T.A. (2008). “Türkiye’de Kamu Gelirleri ve Harcamaları Arasındaki İlişki Üzerine Ekonometrik Bir Analiz”, Dumlupınar Üniversitesi Sosyal Bilimler Dergisi, 20, Nisan, 143-159.
Çiçek, H. G. and Yavuz, I. S. (2014). “Vergi-Harcama Paradoksu: Türkiye’de Belediyeler Üzerine Bir Araştırma”, Çağdaş Yerel Yönetimler Dergisi, 23 (4), 17-31.
Darrat, A. 1998. “Tax and Spend, Or Spend and Tax? An Inquiry Into The Turkish Budgetary Process”, Southern Economic Journal, 64 (4), 940-56.
De Haan, J., and Siermann, C. L. (1993). “The Intertemporal Government Budget Constraint: An Application for The Netherlands”, Public Finance, 48 (2), 243-49.

PERSPECTIVES ON MODERN ECONOMY
Aizhan KHOICH, Ali Eren ALPER, Ahmet Arif EREN
397
Dickey, D.A. and Fuller, W.A. (1979). “Distribution of the estimators for au-toregressive time series with a unit root”, Journal of the American Statistical Society, 75, 427-431.
Durusu-Ciftci, D. (2018). “The Twin Deficits Hypothesis: New Evidence From GIIPS Accounting for Structural Shifts In Causal Linkages”, Jour-nal of Management and Economics Research, 16 (3), 51-69.
Eita, J.H. and Mbazima, D. (2008). “The Causal Relationship Between Gov-ernment Revenue and Expenditure in Namibia”, Munich Personal Repec Archive (MPRA), Paper No. 9154.
Enders, W. and Lee, J. (2012) “The flexible Fourier form and Dickey-Fuller type unit root tests”, Economics Letters, 117, 196-199.
Enders, W. and Jones, P. (2016). “Grain prices, oil prices, and multiple smooth breaks in a VAR”, Studies in Nonlinear Dynamics & Econometrics, 20(4), 399-419.
Esener, S. C. (2019). “Gelişmiş ve Gelişmekte Olan Ülkelerde İktisadi Büyüme, Kamu Gelirleri ve Harcamalarının Çift Yönlü Nedenselliğine Dair Ampirik Bir Analiz”, Business and Economics Research Journal, 10(5), 1051-1070.
Friedman, M. (1978). “The Limitations of Tax Limitations”, Policy Review, Summer, 7–14.
Garcia, M. J. (2012). “The Revenues-Expenditures Nexus: A Panel Data Anal-ysis of Spain’s Regions”, International Journal of Academic Research in Economics and Management Sciences, 1(1), 24–38.
Gormus, A., Nazlioglu, S., Soytas, U. (2018). “High-yield bond and energy markets”, Energy Economics, 69, 101-110.
Gurdal, T., Aydin, M. And Inal, V. (2020). “The relationship between tax rev-enue, government expenditure, and economic growth in G7 coun-tries: new evidence from time and frequency domain approach-es”, Economic Change and Restructuring, https://doi.org/10.1007/s10644-020-09280-x
Hasan, M. and Lincoln, I. (1997). “Tax Then Spend or Spend Then Tax? Ex-perience in the UK 1961–1993”, Applied Economics Letters, 4, 237–39.

398
GOVERNMENT REVENUES AND EXPENDITURES NEXUS: NEW EVIDENCE FROM GIIPS COUNTRIES
Fatih AKÇAY, Sevinç YARAŞIR TÜLÜMCE
Hasan, S. Y. and Sukar, A. H. (1995). “Short and Long-Run Dynamics of Expenditures And Revenues and The Government Budget Con-straint: Further Evidence”, Journal of Economics, 22 (2), 35-42.
Hondroyiannis, G. and Papapetrou, E. (1996). “An Examination of The Caus-al Relationship Between Government Spending and Revenue: A Cointegration Analysis”, Public Choice, 89, 363–74.
Huang, C., and Tang, D. P. (1992). “Government Revenue, Expenditure, And National İncome: A Granger Causal Analysis of the Case of Tai-wan”, China Economic Review, 3(2), 135-48.
Kimenyi, M. S. (1990). “The Causal Relationship Between Revenues and Ex-penditures: A Developing Country Case Study”, Journal of Public Finance and Public Choice, 8 (1), 3-11.
Kollias, C. and Makrydakis, S. (1995). “The Causal Relationship Between Tax Revenues And Government Spending in Greece: 1950-1990”, Cy-prus Journal of Economics, 8 (2), 120-35.
Li, X. (2001). “Government Revenue, Government Expenditure and Temporal Causality: Evidence from China”, Applied Economics, 33, 4, 485-497.
Magazzino, C. (2012). “Revenue and Expenditure Nexus: A Case Study of ECOWAS”, Economics-E Journal Discussion Paper, No 2012-57.
Meltzer, A. H. and Richard, S. F. (1981). “A Rational Theory of The Size of The Government”, Journal of Political Economy, 89, 914–27.
Mithani, D. M. and Khoon, G. S. (1999). “Causality Between Government Expenditure and Revenue in Malaysia”, ASEAN Economic Bulletin, 16 (1), 68-79.
Musgrave, R. (1966). “Principles of Budget Determination”, In H. Cameran and W. Henderson (Eds.), Public Finance: Selected readings (pp 15-27). New York: Random House.
Mutascu, M. (2015). “A bootstrap panel Granger causality analysis of govern-ment revenues and expenditures in the PIIGS countries”, Econom-ics Bulletin, 35(3), 2000-2004.
Narayan P.K. and Narayan S. (2006). “Government Revenue and Government Expenditure Nexus: Evidence from Developing Countries”, Ap-plied Economics, 38, 285-291.

PERSPECTIVES ON MODERN ECONOMY
Aizhan KHOICH, Ali Eren ALPER, Ahmet Arif EREN
399
Narayan, P.K. (2005). “The Government Revenue and Government Expendi-ture Nexus: Empirical Evidence from Nine Asian Countries”, Jour-nal of Asian Economics, 15, 1203-1216.
Nazlioglu, S., Gormus, A. and Soytas, U. (2016). “Oil prices and real estate investment trusts (REITs): Gradual-shift causality and volatility transmission analysis”, Energy Economics, 60(1), 168-75.
Nazlioglu, S., Gormus, A. and Soytas, U. (2019). “Oil Prices and Monetary Policy in Emerging Markets: Structural Shifts in Causal Linkages”, Emerging Markets Finance and Trade, 55:1, 105-117.
Ndoricimpa, A. (2013). “Analysis of Asymmetries in the Tax-Spending Nex-us in Burundi: Evidence from Threshold Modelling, TAR, and M-TAR Models”, Work-In-Progress, Submitted to the African Eco-nomic Research Consortium (AERC).
Obeng, S. (2015). “A Causality Test of the Revenue-Expenditure Nexus in Ghana”, Adrrı Journal of Arts and Socıal Scıences, Vol: 11, No.11 (1), February, 1-19.
Owoye, O. (1995). “The Causal Relationship Between Taxes and Expenditure in the G7 Countries: Cointegration and Error Correction Mod-els”, Applied Economic Letters, 2, 19–22.
Owoye, O. and Onafowora, O. A. (2010). “The Relationship Between Tax Revenues and Government Expenditures in European Union and Non-European Union OECD Countries”, Public Finance Review, 39(3), 429-461.
Park, W. K. (1998). “Granger Causality Between Government Revenues And Expenditures İn Korea”, Journal of Economic Development, 23 (1), 145-55.
Payne, J. E. (1997). “The Tax-Spend Debate: The Case of Canada”, Applied Economics Letters, 4, 381–6.
Peacock, A. T. and Wiseman, J. (1979). “Approaches to the Analysis of Gov-ernment Expenditure Growth”, Public Finance Quarterly, 7, 3–23.
Pınar, A. (1999). “A Model of Government Expenditures in Turkey”, Yapı Kredi Economic Review, 9 (2), 55-71.
Richter, C. and Dimitrios, P. (2013). “Tax and Spend, Spend and Tax, Fiscal Synchronization or Institutional Separation? Examining the Case

400
GOVERNMENT REVENUES AND EXPENDITURES NEXUS: NEW EVIDENCE FROM GIIPS COUNTRIES
Fatih AKÇAY, Sevinç YARAŞIR TÜLÜMCE
of Greece”, Romanian Journal of Fiscal Policy, Volume 4, Issue 2(7), July-December, 1-17.
Tashevska, B. (2018). “The Tax-Spend Debate-Review of the Emprical Liter-ature”, Annual of the Faculty of Economics - Skopje, 53, 467-484.
Tashevska, B., Trenovski, B. and Trpkova-Nestorovska, M. (2020). “The Gov-ernment Revenue–Expenditure Nexus in Southeast Europe: A Bootstrap Panel Granger-Causality Approach”, Eastern European Economics, 58(4), 309-326.
Terzi, H. and Oltulular, S. (2006). “Harcama-Vergi Geliri Hipotezi: Türkiye Örneği”, Atatürk Üniversitesi İİBF Dergisi, Cilt:20, Sayı:2, 1-18.
Toda, H. Y. and Yamamoto. T. (1995). “Statistical inference in vector autore-gression with possibly integrated processes”, Journal of Economet-rics, 66, 225–50
Wolde-Rufael, Y. (2008). “The Revenue-Expenditure Nexus: The Experience of 13 African Countries”, African Development Review, 20, 273-283.
Yashobanta, Y. Parida and Behera, S. R. (2012). “Causal Link Between Central Government Revenue and Expenditure: Evidence for India”, Mu-nich Personal RePEc Archive, Paper No. 43072.
Young, A.T. (2009). “Tax-Spend or Fiscal Illusion?”, Cato Journal, Vol:29, No. 3, Fall, 469-485.

401
24FORCE MAJEURE AND ITS EFFECTS IN LINE WITH JUDICAL DECISIONSLecturer Gazi SONKUR1
Introduction
In order to ensure a qualified relationship between the creditor state and the obli-gor or responsible, both parties have some duties. The obligations designed by the state within the framework of the principle of clarity and definities should be fulfilled in a timely manner by the obligor or responsible. Otherwise, public revenues may be interrupted and thus public services may be disrupted. How-ever, in cases such as force majeure, which occur beyond the will of the obligors, the state provides the necessary convenience to the obligors and may go beyond the usual process.
In this study, the concept of force majeure, its factors and the results of the cases that are submitted to the court due to force majeure, will be discussed. Thus, how the force majeure will affect the relationship between the state and the obli-gor will be seen in line with the judicial decisions.
The Concept Of Force Majeure
The concept of “mücbir sebep” in Turkish is the equivalent of the expression of “force majeure” in French. It is also used as the equivalent of the expression “act of God” in English and in Turkish, this expression refers to the natural events that occur as force majeure (Yolcu, 2011: 14)
According to the definition made by the Turkish Language Association, force ma-jeure is expressed as the unexpected events beyond the will of the obligor, which
1 Sivas Cumhuriyet University, Faculty of Economics and Administrative Sciences, Department of Public Finance, Sivas, [email protected]

402
FORCE MAJEURE AND ITS EFFECTS IN LINE WITH JUDICAL DECISIONS
Lecturer Gazi SONKUR
are against the measures to be taken by anybody, unavoidable and constitute an impediment to the payment of the debt.
In line with the above definitions, also in law, force majeure is mentioned as the situations that individuals or legal entities cannot avoid even if they want to (Erol, 2012:202)
As well as being a common concept used in the branches of law in the Turkish legal system, force majeure is dealt with by each branch of law within its own function. For example; while the effect of force majeure on contracts is consid-ered in the legislation of law of obligations2 (Kaya, 2016: 1579), in the regulations on valuable paper in the legislation of commercial law3, in the SSI / Legislation of labor law, in the duration of submission of the SSI premium declarations4, and in the legislation of debt enforcement and bankruptcy law, in the regulations5 on enforcement and bankruptcy proceedings.
Force majeure, which has a significant effect on tax procedures and principles, can often be confused with difficult situation. In article 17 of the Tax Procedure Law, under the heading of “grant a delay”, it is ensured by the Ministry of Fi-nance that those who cannot fulfill their duties related to tax transactions due to being in a difficult situation can be given extra time. However, neither the defi-nition of the difficult situation has been included, nor any sampling counts sim-ilar to the force majeure situation has been performed. While the force majeure is dealt with a more detailed regulation, the difficult situation is mentioned only nominally (Kılıç and Şekerci, 2015: 864).
2 For example, if the parties of the contract agreed on the sale of the whole product to be obtained from an agricultural land, and despite taking all measures, if the product was completely destroyed as a result of the flood before harvesting, then it is called force majeure and the debt is cleared (Kaya, 2016: 1579).
3 If the submission or protest of the check or the equivalent determination within the legally specified periods cannot be achieved due to an obstacle that is impossible to overcome, such as the legislation of a state or any force majeure, the specified periods for these transactions are extended (TCC Article 811/1).
4 Within the scope of force majeure, SSI premiums can be postponed and payment periods can be extended (General Communique of Tax Procedure Law No. 518).
5 Pursuant to the President’s Decree No. 2279, it has been decided to stop the enforcement and bankruptcy proceedings carried out throughout the country on the grounds of force majeure, not to execute the party and follow-up proceedings, new enforcement and bankruptcy proceedings, and the execution and enforcement of precautionary attachment orders.

PERSPECTIVES ON MODERN ECONOMY
Aizhan KHOICH, Ali Eren ALPER, Ahmet Arif EREN
403
According to the article 17 of the Tax Procedure Law the effect of the difficult situation on the durations has been emphasized as follows; “those who will not be able to fulfill their duties regarding tax transactions due to being in a difficult situa-tion, can be granted a delay by the Ministry of Finance as long as it not more than one fold of the legal period and if the legal period is less than one month, not exceed-ing one month.”. In addition to that, for this delay to be granted:
1. Before the deadline expires, a written request must be submitted.
2. The excuse mentioned in the request must be deemed worthy of acceptance by the authority that will grant the delay.
3. If the delay is granted, the collection of the tax should not get in jeopardy.
Unlike the situations considered force majeure, difficult situation refers to subjec-tive situations. Difficult situation is a coincidental event that occurs outside the will and discretion of the person, and it is a special situation only for that person, with a narrower area of influence than force majeure. Therefore, difficult situation can be mentioned as individual events that are impossible to prevent and per-ceive beforehand like force majeure, which can make it difficult or even impossi-ble for individuals to fulfill certain duties and responsibilities (Parlak, 2006: 10).
The differences between force majeure and difficult situations, which have an ef-fect on the fulfillment of obligations by the obligors, can be summarized as fol-lows (Köktaş and Buyrukoğlu, 2015: 52);
• While force majeure situations are included in the law, difficult situations are not included in the law.
• While the effect of force majeure on failure to fulfill the tax duty is absolute, the effect of the difficult situation is relative.
• While the administration has no discretionary power regarding the acceptance of force majeure situations, when they occur, it has the discretionary power in the acceptance of difficult situations.
• While in cases of force majeure, the extension of the period will be determined by the continuation of the force majeure, in difficult situations, the period may be extended by not exceeding one fold of the legal period.

404
FORCE MAJEURE AND ITS EFFECTS IN LINE WITH JUDICAL DECISIONS
Lecturer Gazi SONKUR
Case And Elements Of Force Majeure
Although there is no definition of force majeure in the laws, force majeure situ-ations according to article 13 of TPL are as follows;
• Severe accident, serious illness in a level that will prevent the fulfillment of any of the tax duties and imprisonment.
Although the word “severe” has been used in cases of severe accident and severe illness, which are expressed as force majeure, the definition or degree of the ex-pression mentioned in our laws has not been clarified.
In order to talk about serious accidents and serious illnesses, as well as being di-rectly personally affected, the person must be unable to think, speak or see and continue his daily (Tosuner and Arıkan, 2019: 142). Obligors who are exposed to force majeure must prove their cases of “severe illness, severe accident” in or-der to benefit from their rights of force majeure.
According to the Internal Circular of the Tax Procedure Law dated 12.25.1986 and numbered 1986/9 of the Ministry of Finance, the reports submitted in prov-ing the severe illness;
A- From the Provincial Health Directorates or the Hospital Chief Physicians who have issued the report, whether the disease specified in the reports received from hospitals (including private hospitals) is a severe disease that will prevent the ful-fillment of tax duties;
B- Regarding the reports issued by official health institutions other than hospi-tals (such as Government Medical, Health Center), from Provincial Health Di-rectorates; On the other hand, as the reports submitted to prove the force ma-jeure must have been received from the above-mentioned institutions, the reports received from private doctors will not be taken into consideration. Likewise, al-though the state of imprisonment is considered as force majeure in Article 13, the legislator has not mentioned conviction here. Because conviction is a certain and final decision. Article 407 of the Civil Code stipulates that every adult per-son who receives a punishment binding freedom of one year or more will be re-stricted and accordingly, the authority in charge of executing the penalty has to declare that this convict has begun to serve his sentence and immediately inform

PERSPECTIVES ON MODERN ECONOMY
Aizhan KHOICH, Ali Eren ALPER, Ahmet Arif EREN
405
the wardship authority to take the necessary actions for appointing a custodian fort his convict. (Kılıç and Şekerci, 2015:849).
• Disasters such as fire, earthquake and flood that will prevent the fulfill-ment of tax duties,
In Article 13 of the TPL, disasters such as fire, earthquake and flood are counted as force majeure, but the concept of “disaster” has not been clarified (Kılıç and Şekerci, 2015:851). Although it is a word of Arabic origin in Turkish, disaster is expressed as destruction caused by various natural events and in the dictionary of Turkish Language Association, “natural disaster” is defined as; Each of the disas-ters such as flood, storm, earthquake, hail that cannot be prevented by humans. Although it is not specified in article 13 of the TPL, the fact that the disaster is expressed as “disasters such as” also leads to the conclusion that other natural dis-asters (landslides, avalanches, etc.) can be considered as force majeure. However, force majeure is a controversial issue and some of these reasons are natural disas-ters and can be known by everyone and by tax offices. On the other hand, per-sonal force majeure claims must be documented and proved by the obligors and those responsible (Öner, 2017: 112). The most important thing here is that in order for a disaster to be accepted as force majeure with the presence of force ma-jeure, it has to directly affect the obligor personally, issues about their close rela-tives close relatives will not be considered as force majeure (Taşkan, 2019: 245).
• Mandatory absences that occur against the will of the person,
The lexical meaning of absence is expressed as “non-appearance; disappearance; loss”. Compulsory absence as a force majeure means that the person has to move away from a place due to reasons other than his own will, and cannot fulfill his taxation duties within this period (Berber, 2014: 49). If the obligor, tax officer or criminal addressee is unable to fulfill their tax duties or cannot use their rights due to var-ious reasons (epidemic, quarantine, general strike, lockout, compulsory military service, failure to enter the country, etc.), there is a compulsory absence within the scope of the Tax Law 13/3 ( Erol, 2012: 210). Since the cases of compulsory absence are related to the obligor / responsible personally, similar to other force majeure cases, the person concerned has to prove6 and certify the compulsory ab-sence, in order to benefit from the force majeure institution (Berber, 2014: 51).
6 In the decision based on 2017/428 and numbered 2017/636 of the Council of State Tax Law Offices, “The fact that the notebooks and documents are lost can be proved with a loss

406
FORCE MAJEURE AND ITS EFFECTS IN LINE WITH JUDICAL DECISIONS
Lecturer Gazi SONKUR
• Books and documents that are lost due to reasons beyond the will of the owner,
According to the article 253 of the TPL, those who are obliged to keep a note-book are obliged to keep the notebooks and documents written in the third part for a period of five years, starting from the calendar year following the relevant year. The notebooks, documents and records of the obligor or tax responsible must essentially be in their workplaces and, when requested within the statute of lim-itations, they must be submitted to the tax inspectors or personnel authorized to inspect (Erol, 2012: 211,). The books and documents held by the obligors may be out of control due to unintentional reasons and, as a result, they may not be able to access the notebooks. In these cases, it is possible to apply force majeure against the taxpayer in accordance with Article 13 of the TPL (Çekin, 2016: 60,).
There is no clear definition in our laws regarding the elements of force ma-jeure. According to the TPL article 13, the elements of force majeure can be listed as follows (Tosuner and Arıkan, 2019: 141).
1-Faultlessness (No fault of the obligor)
2-Unforeseeable (Sudden occurrence of the issue)
3-Irresistibility (Inability of the obligor to prevent the event)
4-Reality (Prevention the obligor from fulfilling his tax duty)
In order for the force majeure to occur, the 4 elements listed above must come together. If even one of these elements is absent, it will not be possible to talk about force majeure. For example, if the obligor / tax responsible has a personal fault in the occurrence of the event that causes the force majeure, it will not be considered as force majeure. As a matter of fact, the Supreme Court has defined force majeure in a decision it has given as “in order for an event to be considered as force majeure, it must be unforeseeable, irresistible and must have come from an external factor”7. As an example of this definition, the 13th Department of the Council of State made the following decision8;
certificate that will be obtained from the Commercial Courts, as well as other legally valid authorities such as the Gendarmerie Command, Police Chief, Fire Department and the existence of force majeure in the incident subject to the case is revealed by these documents ”. has been emhasized.
7 Assembly of Civil Chambers, decision dated 03.20.2013, E. 2012 / 11-1096, K. 2013/3828 13. D.K.2017/874, 13.D.K.2017/875

PERSPECTIVES ON MODERN ECONOMY
Aizhan KHOICH, Ali Eren ALPER, Ahmet Arif EREN
407
it was decided as “... as it is seen that the case is filed with the request for the an-nulment of this decision upon the decision that the subject is evaluated within the scope of force majeure within the scope of subparagraph (e) of paragraph 1 of Article 10 of Law No. 4735, ... the case was dismissed on the grounds that the conditions of unforseeblility and unavoidability do not occur together, as there was no contradiction to the law, and this decision was appealed by the plaintiff. APPROVAL of the decision of the court…”
The elements of force majeure has been mentioned in a decision of the General Assembly of the Administrative Law Divisions of the Council of State; `` stat-ing that the plaintiff party suffered damaged due to the demolition of the lodg-ings that they were staying in as a result of the earthquake on 3.13.1992 in …, it is claimed that the damage should be compensated by the administration that has a service defect by purchasing the housing that does not have the necessary technical competence. However, it is clear that the damage should be regarded as force majeure, it is far from fault, unpredictable, irresistible, force majeure, which is a real event that occurs outside the activities of the administration ...”
Effects Of Force Majeure
Possible effects of force majeure on tax law and other branches of law come out as time, penalties, tax cancellation, tax assessment reasons, VAT reduction, pres-ervation and submission duty, late fee and default interest, depreciated goods, ex-traordinary depreciation, real estate tax, special consumption tax, fees and stamp tax (Biyan, 2020: 134-184), in this study, the periods, penalties, tax cancellation, preservation and submission duty of force majeure will be mentioned and the possible effects will be revealed.
Force majeure is an external de facto situation that temporarily removes the will of the parties to fulfill their duties, obligations or obligations depending on a cer-tain period of time (Çekin, 2016: 79). In terms of tax law, the obligor / tax re-sponsible must fulfill his duties and responsibilities regarding tax within the spec-ified periods, and he has the obligation to act within the periods specified in the law in order to benefit from the advantageous situations defined by the law as rights. Likewise, the administration is obliged to do its work and actions within the periods specified in the law. The effect of force majeure on time periods come out in 3 different forms as administrative, legal and judicial periods. Since it is

408
FORCE MAJEURE AND ITS EFFECTS IN LINE WITH JUDICAL DECISIONS
Lecturer Gazi SONKUR
stipulated in Article 15 of the Tax Procedure Law that the periods will not work in cases of force majeure; for an obligor who is faced with a force majeure situa-tion, this situation will stop the processing of the periods, and after the force ma-jeure situation is eliminated, the periods will continue to work from where they left off, and the transactions and assignments will be valid as if they were done on time (Berber, 2014:110).
The effect of force majeure on administrative periods refers to the periods de-fined by the law to the administration. As a matter of fact, in Article 14 of the Tax Procedure Law the administration has been given a responsibility by men-tioning that: “In tax transactions, periods are determined by tax laws. In cases that are not clearly written in the law, this period is determined by the administration that will make the notification and notified to the relevant person, provided that it is not less than 15 days.”
In the presence of force majeure, the application of prescription also plays an important role.
As it is known, the timeout of accrual is regulated in the TPL, while the collec-tion prescription is regulated in the Law No. 6183 on the Procedure for Collec-tion of Public Receivables. According to Article 102 of Law No. 6183, “If the public receivable is not collected within 5 years from the beginning of the calen-dar year following the calendar year in which its maturity coincides, it will ex-pire. The statute of limitations in the special laws regarding fines are reserved. “ In the 103rd article, although the interruption of the statute of limitations is reg-ulated, force majeure is not included among the situations that cut the statute of limitations. Again, in Article 1049, it is stated that the statute of limitations will not work and the force majeure state has not been mentioned.
However, in the 8th article of Law No. 6183 titled “Notifications and calcula-tion of periods”, there is a statement that “Unless there is a provision contrary to this law, the provisions of the Tax Procedure Law are applied in the calculation of the written periods and the notification”. Based on this article of law, the payment pe-riod of the tax accrued late due to force majeure is also prolonged. For this rea-son, a late fee is not charged for tax that is accrued late.
9 Article 104 - If it is not possible to prosecute the obligor due to his being in a foreign country, fraudulent bankruptcy or liquidation of his estate, the statute of limitations shall not apply as long as these circumstances continue.

PERSPECTIVES ON MODERN ECONOMY
Aizhan KHOICH, Ali Eren ALPER, Ahmet Arif EREN
409
For example, in the written statement made by the Ministry of Treasury and Fi-nance on 08.24.2020, “Those who have a obligor registration as of the date of the flood in Giresun due to the last flood disaster in Giresun, will be held in force majeure between 8.22.2020 and 11.30.2020 in terms of the implementation of tax laws” and the effect of force majeure on time periods was emphasized, follow-ing the latest flood in Giresun. The period accepted as force majeure has been de-clared as 3 months and 9 days, and during this period, no penal sanction will be imposed on the obligors due to the obligations that the obligors could not ful-fill. In addition, the time limit and the fulfillment of tax duties will also be ex-tended by the specified period.
For example, the decision of the Council of State regarding the penalties related to force majeure is as follows;
The decision of the 7th Chamber of the Council of State, No. 1998/993 Basis, 1999/3059; ... It is related to the request of reversal of the court decision reject-ing the lawsuit filed with the request of cancellation, based on force majeure, of the irregularity penalty imposed due to the failure to submit the declaration of the Tourism Investment and Foreign Trade Bank regarding the bank and insur-ance transactions tax. Related chamber; “… as the situation causing the declara-tion not to be submitted is not certified or proved by a court decision or a docu-ment issued by authorized public institutions, it has not been considered possible to evaluate the incident within the scope of force majeure, and the court decision is in place as there is no inaccuracy in the infraction penalty.
As seen in the relevant decision, the absence of force majeure does not prevent penalties from being imposed. In the event of a contrary situation, the obligor / responsible will not face penal sanctions.
The decision of the Council of State regarding tax liabilities is as follows;
In the decision of the 3rd Chamber of the Council of State, 1990/2312 ba-sis, 1992/342; Regarding the decision taken by the obliged party that the fi-nal 2-month rest report he received from the day he was discharged would be considered as force majeure in the fulfillment of his tax duties: “… in the case, the plaintiff, who was an income obligor due to his self-employment ac-tivity, on the day of 2.7.1989 ... was operated on with the diagnosis of stomach cancer, was discharged on 3.10.1989, but it was deemed appropriate to come to

410
FORCE MAJEURE AND ITS EFFECTS IN LINE WITH JUDICAL DECISIONS
Lecturer Gazi SONKUR
the clinic every 15 days and rest for two months and foreseen to rest for 20 days from 5.11.1989, in the letter dated 4.6.1990 sent by the relevant health institution upon the interim decision of the courts, it was stated that the patient in question needed rest for 2.5 months, therefore, it was accepted that the severe disease state continued for 2.5 months from the date of 3.10.1989 when the patient was dis-charged, after the end of 2.5 months, the following month should be regarded as the period during which tax duties will be fulfilled and on the other hand, consists of a request for reversing the decision of the Tax Court that annulled the smug-gling penalty by accepting the declaration given on 5.25.1989 and 6.25.1989 on the grounds that it should be accepted that it was given within the legal period.
The effect of force majeure on the judicial process10 can be explained as follows; “if the person proves that he missed the time of filing a lawsuit due to an event other than his fault and if this event meets the conditions of force majeure, then the opportunity to file a lawsuit must be granted. At the same time, considering the functions of administrative cases to ensure that the administration acts in ac-cordance with the law, it can be said that granting a new right to individuals for the right to file a lawsuit that cannot be used due to force majeure is a require-ment of the rule of law and the purpose of existence of administrative cases.” (Gündüz, 2019: 261-262).
Conclusion
Turkish tax laws impose some responsibilities on taxpayers within the framework of the principle of legality in taxation. These responsibilities, which are explained under the heading of the taxpayers’ duties in the tax procedure law, can some-times be interrupted against the will of the taxpayers. As a result of these trou-bles, which are generally described as force majeure and difficult situations, the state has needed to make some regulations. Thus, the penal sanctions, taxation process, statute of limitations, tax duties and judicial process can be redesigned according to the regulations.
With the concept of force majeure defined in the tax procedure law, the Minis-try of Treasury and Finance is authorized to declare force majeure in cases that occur outside the will of the obligor. Using this authority, the ministry also sus-pends the obligations and responsibilities of the obligor during the force majeure
10 For more information see: (Balcı, 2009: 229-243).

PERSPECTIVES ON MODERN ECONOMY
Aizhan KHOICH, Ali Eren ALPER, Ahmet Arif EREN
411
period. In other words, the deadlines delay, the obligations and the judicial pro-cess do not run during the force majeure period. Thus, obligors do not face crim-inal sanctions. Judicial decisions are concluded in favor of the obligor in matters referred to the judiciary in the case of force majeure. This shows that the effect of force majeure on the tax process is certain.
References
Balcı, Mustafa (2009). Force Majeure in Turkish Tax Law and Its Effect on Time, Kazancı Refereed Law Journal, Issue: 53-54, pp.229-243.
Berber, Şayan (2014). Force Majeure Events and Busıness Exigencies In Turkish Law, Istanbul University, Social Sciences Institute, Financial De-partment, Financial Law Science, Master’sThesis, Istanbul.
Biyan, Özgür (2020). TAX LAW Law Amendments No. 7194 Included, Dora Publishing, Bursa.
Çekin, Ertuğrul (2016). Force Majeure In Turkish Tax Law, Gazi University, Social Sciences Institute, Public Law Department, Department Oof Tax Law, Master’sThesis, Ankara.
Erol, Ahmet (2012). Force Majeure As Taxpayer’s Right and Its Outcomes, Union of Turkish Bar Associations Review, Issue: 103, pp.199-222.
Gündüz, F. Ebru (2019). The Effect of Force Majeure on the Term of Admin-istrative Litigation, Ankara Hacı Bayram Veli University Journal of Faculty of Law, Vol:XXIII, Issue:2, pp.237-266.
Kaya, Ümmühan (2016). Changing Conditions in the Adaption of the Con-tract and the Principle of Unpredictability, Marmara University Faculty of Law Journal of Legal Studies, 22 (3), pp. 1569-1593.
Kılıç, Ramazan and Şekerci, Demet (2015). Force Majeure and Hardship in Turkish Tax Law, 30. Turkey Finance Symposium Proceedings, pp. 843-870, 20-24 May 2015, Antalya.
Köktaş, Altuğ Murat ve Buyrukoğlu Selçuk (2015). Tax Law and Turkish Tax System, Sonçağ Publishing, Ankara.
Öner, Erdoğan (2017). Tax Law, Seçkin Publishing, Ankara.
Parlak, Mehmet Ali (2006), Force Majeure and Difficult Situation in Turkish Tax Law, Unpublished Master’s Thesis, Marmara University, In-

412
FORCE MAJEURE AND ITS EFFECTS IN LINE WITH JUDICAL DECISIONS
Lecturer Gazi SONKUR
stitute of Social Sciences, Department of Finance, Financial Law Department, Istanbul.
Taşkan, Yusuf Ziya (2019). Tax Law, Enlarged and Revised 2nd Edition, Adalet Publishing, Ankara.
Tax Procedure Law No. 213
Tosuner, Mehmet ve Arıkan, Zeynep (2019). Tax Procedure Law, The Revised and Refreshed Edition, Kanyılmaz Printing House, İzmir.
Yolcu, Mehmet (2011). Force Majeure and Force Majeure Conditions Assessed Within the Scope of Tax Law, Journal of tax reports, Issue: 144, pp.13-24.

413
25FOREIGN DEBTS AND AIDS: A THEORETICAL RESEARCH IN TERMS OF REASONS AND TYPESHasan TÜRKAL1
Introductıon
State can become indebted, when ordinary revenues, such as taxes, duties and charges which are the resources of public sector finance, cannot be provided in an adequate level, or with economic, financial and social reasons. When invest-ment-saving equality cannot be formed due to the inadequate level of accumu-lations in the country, economy faces with several problems. In these conditions, internal resources are not sufficient to eliminate these problems and foreign re-sources are needed. Together with the improvement of international economic and financial relations, in order to provide the socio-economic developments that public sectors aspires after: when domestic debts are not enough for the devel-opment finance, foreign indebtedness has become a preferable and normal pub-lic revenue. In economy, foreign indebtedness s a type of indebtedness that in-creases current resources but when it is paid, it decreases the national revenues and resources. Underdeveloped countries prefer foreign indebtedness for various reasons such as clearing current accounts deficit, administering the payments of foreign debts regularly and providing new resources. In order to provide and pro-tect the economic balance, developed countries may use foreign aids for earning markets that they can sell their industrial goods and raw materials that they need. It is not easy to separate foreign debts and foreign aids theoretically. However, the major difference of foreign aids from foreign debts is that it can be provided in more favorable terms in comparison with commercial loans. In this study, both foreign debts and aids defined. Furthermore, the reasons in terms of borrowing and creditor nations emphasized and the types of foreign debts and aids analyzed.
1 Dr., Harran University, FEAS, Department of Public Finance, [email protected], ORCID: 0000-0001-8106-3668

414
FOREIGN DEBTS AND AIDS: A THEORETICAL RESEARCH IN TERMS OF REASONS AND TYPES
Hasan TÜRKAL
I. Concept Of Foreign Debts And The Reasons Of Foreign IndebtednessA. Concept Of Foreign Debts
The indebtedness that has been loaned from foreign markets or from people from foreign passports or from the type of foreign currency can be defined as the for-eign indebtedness. (Akdoğan, 2011: 461; Orhaner, 2007: 243). Foreign indebt-edness can be described as providing real or financial revenues from foreign re-sources by a state or a public institution, or, providing foreign credits from resident institutions or people in foreign countries by resident institutions and people in the country. In economy, the type of debt that increases current resources when it has loaned but decreases the national revenues and resources when it is paid, is called foreign indebtedness (Batırel, 2007: 162, Meriç, 1993: 9-22). Foreign debt has similar meaning with “external financing”, “outsourcing” and “foreign aids” (Dikeç, 1989: 43) and it is a resource that a country has provided from a for-eign country with the condition that both principal and interests will be repaid in a given time (Demir, 2009: 42). Nowadays, indebtedness has become one of the most significant resources for the public finance (Can, 1998: 131). In kind transfers and advance loans from the developed countries are considered as for-eign debts as well. Foreign aids are credits that have been given to the develop-ing countries as grants or have been provided in more favorable terms than mar-ket conditions such as low interests and long term. In broad term, foreign aids are the capital flows and all other facilities that have been provided by mostly the developed countries and international institutions to the developing countries in order to support their defenses or economic and social developments. Moreover, all kinds of monetary, capital in kind and services can be provided to the devel-oping countries as foreign aids (Erçel, 1992: 7-17).
B. The Reasons Of Foreign Indebtedness1. In Terms Of Creditor Countries
In terms of creditor or aid donor countries, the reasons of debts can be classified as political, military, economic, cultural and historical, humanitarian and ethical reasons (Tüğen, 1991: 23-24);
i. Political Reasons: Loans can be utilized as a foreign policy instrument in polit-ical credits. There are several examples of loans based on complete political goals.
PERSPECTIVES ON MODERN ECONOMY
Aizhan KHOICH, Ali Eren ALPER, Ahmet Arif EREN
415
The debts that predominates these quality and purpose can be defined as polit-ical debts. Developed countries debit the underdeveloped countries with politi-cal motives deliberatively (Kutlu, 1995: 98). For instance: by driving them into debt, leaders of other countries can be used with political, economic and mili-tary purposes by looking after USA’s commercial interests (Perkins, 2015: x; Ko-rkmaz and Aybarç, 2019: 625).
ii. Military Reasons: Military reasons can take part in aforementioned political reasons predominately. For example, in a speech in American congress, American senator Fulton said that: “reason of giving military aids to Turkey, Greece and Pa-kistan is that these countries provide hundreds of cheap soldiers to United States.” In this regard, in a letter that Nelson A. Rockefeller wrote to US President Eisen-hower, he mentioned about how American policies should be in several regions and how military policies should be conducted in accordance with his sugges-tions: “We must continue the measures designed to create and strengthen our mil-itary alliances. In order to strengthen and, if possible, to broaden these alliances we must draw up a programme of economic development extensive enough for us to have in Asia, Africa and other underdeveloped areas. First of all, we should pick out the countries with anti-communist governments friendly to us, which are already bound to the US through stable long-term military agreements. In this case governmental subsidies and credits may take the form mainly of mil-itary appropriations. The hooked fish needs no bait.” (Değer,1993: 339-346).
iii. Economic Reasons: In economy-based credits, creditor nations pursue to create market and raw material zones for their economies. These type of credits contribute to the protection of economic balance and economic development for the creditor nation. Economic and political reasons intertwine with each other frequently in terms of creditor countries. While Marshall aids emerged as a po-litical aid and a credit system in order to limit the Soviet hegemony in Europe, in the meantime, with President Truman’s quote, it had aims “to prevent trou-bles that could appear in American economy after the war” as well (İnce, 1996: 94). On condition to be used in projects that have higher income than the taxes which will be repaid, level of real national income can be increased through for-eign debts (Şener, 1996: 200; Pınar, 2011: 42).

416
FOREIGN DEBTS AND AIDS: A THEORETICAL RESEARCH IN TERMS OF REASONS AND TYPES
Hasan TÜRKAL
iv. Cultural and Historical Reasons: Religious, lingual, historical and cultural connections between different countries can play an active role for economic re-lations, foreign aids and credit relations.
v. Humanitarian and Ethical Reasons: The aids to the countries that have expe-rienced scarcity, famine and natural disasters are evaluated in the aids and credits due to humanitarian and ethical reasons. The credits due to cultural and histori-cal reasons and humanitarian and ethical reasons are limited. Loans can be trans-formed into a tool of imperialism within the systematic applications of powerful countries. Experiences progress in accordance with the idea that powerful may only be wealthy by exploiting the weak (Birdal, Ulutan, 1992: 7).
2. In Terms Of Borrowing Countries
Foreign debts that have been borrowed by means of receiving credits from official or private institutions (Kirmanoğlu, 2009: 41) contribute to two purposes such as clearing both foreign trade and budget deficits (Bulutoğlu, 2004: 296). Until utilizing and paying the debts, opportunity cost of foreign debts has been delayed (Musgrave, et.al. 234). When foreign debts borrowed, they increase available re-sources while they decrease both national income and national resources when they were paid with principal and interests. In other words, when foreign debts borrowed, foreign resources transferred to the economy but when principal and interests paid for these debts, domestic resources transferred to foreign countries.
There are various reasons for a country to turn towards foreign resources before or instead of domestic resources. These are (Evgin, 2000: 1-4; Acar, 1990: 16-22; Uluatam, 2003: 428-430; Demir, 2009: 23-29; Due, 1963: 533-537; Ulu-soy, 2013: 60-61; İnce, 2000: 11-33; Bülbül, 2019: 363-364; Çapık and Köse-kahyaoğlu, 2019: 415):
i. Inadequacy of Domestic Resources and Impossibility of Supplying National Requirements from Domestic Resources: In underdeveloped countries, low lev-els of real income not only limit savings, by extension, level of investments but also they limit the expansion of markets and capital accumulation develops slowly. This condition clearly reveals how economic growth and development works are conducted in difficult conditions in underdeveloped countries where per capita income and savings are quite insufficient.

PERSPECTIVES ON MODERN ECONOMY
Aizhan KHOICH, Ali Eren ALPER, Ahmet Arif EREN
417
ii. Foreign-Dependency of both National Economy and Demand Structure: If a national economy is lacking foreign exchange reserves that will import invest-ment goods in order to accomplish the developmental aims, it will have to apply foreign debts or sources of credit in order to accomplish this trade.
iii. Other Some Economic and Social Reasons: Countries can apply to foreign debts due to economic and social reasons such as closing budget deficits (Sön-mez, 1987: 31) with resources, savings, foreign trade (Berksoy, 1989: 58-60) or balance of payments (Bakkal and Oktayer, 2003: 218; Keçeligil, 2019: 124), providing finance for defense expenditures, provider and protector effects of eco-nomic balance, financing big investments and reforms (Emil, 2003: 36), creat-ing optimized effects for the distribution and usage of resources, aiming to chan-nelize savings into certain investments, providing finance for debt maturity, and finance of extraordinary expenditures like natural disasters and war (Zıllıoğlu, 1984: 5; Eğilmez, 2019: 107).
Foreign debts, principal and tax payments will be paid as foreign exchange (Bu-lutoğlu, 2008: 423). Following this impact, it will be beneficial to use the foreign debts that have been loaned from foreign countries by enduring certain economic and political burdens, for especially competitive, productive investment fields that will provide foreign exchange inflow (Bilici, 2019: 128). Expenditures-dampening policies will affect the economy growth negatively during the repayment phase of these debts. Furthermore, foreign debts in high numbers may affect investments in a deterrent way (Hjertholm, 2001: 10; Bilginoğlu ve Aysu, 2008: 12). (Please look into the some following examples of empirical studies about the relation-ship between foreign debts and economic growth: Turan, 2019; Woo and Kumar, 2010; Checherita and Rother, 2010; Cecchetti et al., 2011). When loan adminis-tration is not good enough, it will cause the amounts of foreign debts increase to high amounts with each passing day in developing countries (Eker, 1997:3 00).
II. Types Of Foreign Debt
Foreign debts are divided into sometimes two, sometimes three groups in accord-ance with their term. Foreign debts that are divided into two groups are classi-fied as short-term and long-term debts. Foreign debts that are divided into three groups, on the other hand, are classified as short-term (floating), medium-term and long-term loans. If the term of a debt is equal to a year or shorter than a year,

418
FOREIGN DEBTS AND AIDS: A THEORETICAL RESEARCH IN TERMS OF REASONS AND TYPES
Hasan TÜRKAL
then, these credits will be evaluated as a short-term debt. If the term is longer than a year, then, these credits will be evaluated as medium and long-term debts (Merkez Bankası, 1994: 100).
Dividing debts in accordance with terms is significant in terms of the resources of these debts as well. While short-term debts will be met from money markets, long-term debts will be met from capital markets (Tural, 1992: 33).
Within the scope of short-term debts, generally credits that, provide to eliminate payment problems in international trade and trade of goods, take part. Foreign exchange accounts with letter of credit that have been opened by Central Bank of Turkey in a short-term, accounts in commercial banks, short-term policies, ac-ceptance credits and letters of credit are short-term debt instruments for the for-eign residents. Moreover, prefinancing export credits, and banker and mail cred-its are evaluated as short-term foreign debts as well (Merkez Bankası, 1994: 101).
Most frequent and common medium and long-term foreign debts are develop-ment credits, untied and tied credits, export credits, debt discharging and refi-nancing credits (Açba, 1991: 23-29, İnce, 1996: 101-113; İnce, 2000: 158-169);
A. Development Credits
Development credits are the credits that have been loaned to the underdeveloped countries by several countries and international institutions. Moreover, these cred-its have been loaned to these countries in more favorable terms. These develop-ment credits have particular importance to underdeveloped countries but differ-ent type of these credits from the other countries are not even a question. When other credit types stipulated more favorable terms than the market conditions, they have been evaluated within the scope of development credits.
There are two types of development credits as program and project credits (İnce, 1996: 102-103, Açba, 1991: 23-25);
1. Program Credits
Generally, program credits are available for the usage of resident importer in-stitutions within the countries and they are provided with bilateral agreements.

PERSPECTIVES ON MODERN ECONOMY
Aizhan KHOICH, Ali Eren ALPER, Ahmet Arif EREN
419
When importing goods and services from a certain country is stipulated, these type of credits are named as tied program credits (Merkez Bankası, 1994: 101).
Program credits have generally consisted of the credits that have been loaned to developing countries for financing their imports. Relevant countries can reserve these credits to buy products, necessary for their annual requirements, such as raw materials, accessories and machines or semi-products. These credits, depend-ing upon to country and products, have been loaned as untied credits usually. Although they usually have been used for the loaned years, they can be used for the following years for the unused parts.
There are various different opinions about benefits and disadvantages for borrow-ing or creditor countries of program credits (Ulusoy, 2013: 71). Program cred-its are beneficial for the national economy of a borrowing country in terms of balanced development. Thus, required raw materials and accessories for the con-ducted investments can be provided easily.
2. Project Credits
Project credits have been used particularly for certain productive and infrastruc-ture investments in underdeveloped countries. These credits have been loaned to these countries by international institutions or states in order to materialize pri-vate and public investment projects of these countries. (Acar and Dulupçu, 2003: 332-333). Project credits are intended to provide the finance of goods and services imports in order to materialize a project. If those credits are provided by govern-ments with bilateral and multilateral agreements, these project credits are called as “official (senior) project credits”, if those credits are provided from vendors or foreign banks, these are called as “commercial project credits. In the practice of project credits, loan agreements are conducted in three ways (Ulusoy, 2013: 71):
aa. The agreement has been signed between the creditor country or institution and borrowing country. The government that prepares the agreement, on the other hand, transfers the credit to public or private institution that will materi-alize the project.
bb. Creditor country makes agreement separately with the relevant government and public or private institution that make investments. In this regard, the government that has been financed is responsible towards the government that provides finance.

420
FOREIGN DEBTS AND AIDS: A THEORETICAL RESEARCH IN TERMS OF REASONS AND TYPES
Hasan TÜRKAL
cc. There is an agreement between creditor country, the country that has been fi-nanced and investor institution that will tie these three sides. Therefore, the rel-evant government that has been provided with finance and the institution that will materialize the project with the relevant government have been tied with col-lective responsibility to creditor country.
B. Untied Credits – Tied Credits
Whether the usage of credits is dependent upon conditions is significant for di-vision. If these are analyzed separately (İnce, 1996: 25-26; Ulusoy, 2013: 71-72):
1. Untied Credits
If the credits that have been provided to developing countries are paid in for-eign currency by the creditor country, and if borrowing country is completely free to use these funds whatever she desires and whichever country she wants to use, these cases are called as untied credits. Since borrowing country has an op-portunity to provide goods and services that are required for the finance of de-velopment in more favorable terms and at the cheapest price, no problem occurs in untied credits. The real problem emerges in tied credits.
2. Tied Credits
Financing that has been provided as produce loans is tied credits. Tied credits can be divided depending upon country and origin as well. While attachment can be towards the country, it can emerge as attached to the goods as well. Moreo-ver, attachment of both goods and country is possible as well. In this case, debt can only be used for imports of certain goods from the creditor country. In tied credits, if the provided finance is not indicated for the certain goods and borrow-ing country may buy any goods they want from the creditor nations, this type of tied credit will be “credit attached to country”.
If the goods that will be purchased are indicated by the creditor country in ad-vance, this type of tied credit will be “credits attached to both country and goods”. In these type of credits, the determination of goods that will be purchased, by the creditor nation is about the goods that are desired within the export policy of creditor nation.

PERSPECTIVES ON MODERN ECONOMY
Aizhan KHOICH, Ali Eren ALPER, Ahmet Arif EREN
421
C. Export Credits
Export (seller’s) credits are the credits that have been provided by the firms or in-stitutions that have been established with this purpose to the countries that plan to buy goods and services from the developed countries (İnce, 1996: 105). Sell-er’s credits are usually designated as short-term credits. Interest rates, on the other hand, are slightly higher than the other credits. Moreover, in addition to the costs, the direct risks such as insurance expenses on creditors are reflected in the prices as well. In the end, heavy costs emerge in terms of the institutions that bene-fit from these credits. These credits are generally reflected to purchase required equipment for the establishment of industrial facilities.
D. Debt Reliefs And Refinancing Credits
There is a slight difference between debt reliefs and refinancing credits in form and frequently, they have been used similarly in the literature. That difference is: maturing liability is postponed instead of paying the debt in debt reliefs, while maturing liability has been paid with a new finance that has been provided by the creditor nation and this new finance is counted as a new debt. This renewed debt is tied to a certain payment plan (Ulusoy, 2013: 73-74).
The requirement of external financing increases during the terms when balance of payments relapses due to repayments of foreign debts, principal and taxes. More-over, economic environments of a country may not be favorable for payments of foreign debts. The reason is to eliminate temporary troubles and bottlenecks that will be faced in payments of foreign debts and to prevent payments of debts to create alternative demand for the foreign exchange resources of the country. If the debt reliefs and refinancing credits are evaluated as separate headings (İnce, 1996: 105-106, Açba, 1991: 26-27):
1. Debt Reliefs
Debt relief credits are the credits that have been provided to delay unpaid foreign debts although their maturity date is expired or to meet financing of these debts again. Relief credits have materialized to extend the debt dues by not paying in-stallments of principal and taxes that their maturity date is expired.

422
FOREIGN DEBTS AND AIDS: A THEORETICAL RESEARCH IN TERMS OF REASONS AND TYPES
Hasan TÜRKAL
Creditor countries that have accepted the debt reliefs have several reasons to ac-cept these. Once, transformation of a borrowing country into a state that can-not pay all of her debts and burdens of this country whether she applies morato-rium or not may cause crises in terms of her domestic policies. Mostly, a creditor country does not desire such a condition for herself as well.
2. Refinancing Credits
The credits that have been loaned in order to postpone the former debts are called as the refinancing credits. The purpose of these credits are to pay debts that their maturity date is expired and postpone these debts into ensuing years by opening a credit with the same amount in exchange for a low interest rate in comparison with interest in first credit. During the terms that developing countries have dif-ficulties in repayment, it is obligatory for them to apply these debt reliefs and re-financing credits in order to continue investment initiatives that they started or elude the difficulties of balance of international payments. Therefore, when the debts of these countries increased and problems of payment began to manifest, these credits became crucial for developing countries.
E. Foreign Aids
Developed countries can use foreign aids both for providing and protecting eco-nomic balance, and gaining markets that they can sell their industrial products, and resources of raw materials that they have required (İnce, 2000; 142). It is not easy to divide foreign debts and foreign aids certainly (Eker et al., 2005: 86). However, the most significant difference of foreign aids from foreign debts is that they are provided in more favorable terms than commercial loans. Interest rates of foreign aids are mostly lower and their repayment periods are longer as well. Moreover, payments of principal and taxes start after a certain first period without payment. Since grants are the unreturned funds, their feature as an aid is clearer. Since political reasons have been regarded more than the other cred-its (Türk, 1997: 278), the feature of political debts in foreign aids has increased.
Foreign aids can be analyzed as bilateral or multilateral aids, grants, techni-cal aids, financial aids or food aids, and military aids (Açba, 1991: 27-29, İnce, 1996: 101-107).

PERSPECTIVES ON MODERN ECONOMY
Aizhan KHOICH, Ali Eren ALPER, Ahmet Arif EREN
423
1. Bilateral Aids – Multilateral Aids
In respect of institutional resources, foreign aids are divided into bilateral aid and multilateral aids.
a. Bilateral Aids
Bilateral aids are the funds that have been provided from public resources in compliance with an aid agreement that has been made by a donor country and a recipient country. Donor countries usually use these aids to materialize certain goals of their foreign policies. Thus, political pressure are heavy in bilateral aids. Furthermore, these type of aids mostly condition the purchase of export goods of donor country.
b. Multilateral Aids
Multilateral aids are, on the other hand, the aids that have been provided through international financial institutions. The funds in kind of aids that have been pro-vided by these institutions are usually obtained from their equity capitals. World Banks and International Bank for Reconstruction and Development (IBRD) are the spearheads of institutions that have provided multilateral aids. The banks, apart from their equity capital, may provide funds by selling bonds and may give credits to member countries with these funds.
2. Grants
Grants are the aids that has no condition of repayment (Ulusoy, 2013: 71). The grants of developed countries to underdeveloped countries are usually conducted as in kind transfers. The majority of grants are comprised of excess of exports. However, all of them do not have the characteristics of a grant, in fact, most of them have the characteristics of debts with domestic currency. The country with export surplus debits the country that has taken these grants with her domestic currency. And, these provided funds have been used in the expenses that the do-nor country will conduct in recipient country. It is clear that this type of resource is not a grant. An exceptional type of grant is the direct subvention.

424
FOREIGN DEBTS AND AIDS: A THEORETICAL RESEARCH IN TERMS OF REASONS AND TYPES
Hasan TÜRKAL
2. TECHNICAL, FINANCIAL AND FOOD AIDS
a. Technical Aids
Technical aids are supportive activities such as transfer of know-how, project and consultancy services or the education of personnel from underdeveloped coun-tries. United Nations Organization conducts technical aids in various fields such as public health, agriculture, industry and education through specialized agen-cies such as World Health Organization (WHO), Food and Agricultural Organ-ization (FAO), United Nations Industrial Development Organization (UNIDO) and United Nations Development Program (UNDP) (Ulusoy, 2013: 74-75).
b. Financial Aids
Easy terms of international payments that have been provided to underdeveloped countries in order to finance their imports of goods and services form financial aids. Mostly, financial aids have been used as a tool for donor countries, which provide these aids, to increase their exports (For an extensive knowledge about worldwide, international financial institutions, please vide: Önen, 1996: 17-105).
c. Food Aids
Food aids express sold agricultural surplus to underdeveloped countries in ex-change for their own domestic currencies which are not convertible in accord-ance with USA’s P.L. 480 program. These domestic currencies which have been collected for the American government cause negative reactions due to the rea-son that these collection of domestic currencies pave the way for American gov-ernment to intervene the internal affairs of these governments.
For a while, food aids to extremely poor countries have been provided as grant by the developed countries in order to increase their humanitarian and political prestige. The impact of the pressure of public opinion in developed countries to their governments for the realization of these type of foods aids is great.
d. Military Aids
The aids that have been made with military purposes, and amounts and condi-tions have not explained with secret agreements are considered within the military

PERSPECTIVES ON MODERN ECONOMY
Aizhan KHOICH, Ali Eren ALPER, Ahmet Arif EREN
425
aids. The significant part of military aids is comprised of vehicles and equipment which are provided to allied countries.
Evaluation
Financing public activities domestically with ordinary public revenues is essence. However, not being able to establish investment-saving equality due to inade-quacy of accumulations within the country causes several problems in economy. Since internal resources are insufficient to eliminate these problems, foreign re-sources are necessary for the national economy. Foreign dependency of both pro-duction and economy is one of the most significant reasons for the increase of foreign debts and these debts increase with openness. It is necessary to canalize these increasing debts with each passing day to investments and industrialization in order for them not to cause a foreign payments crisis. The priority of invest-ments should be directed to export sectors in order for industrialization and for-eign resources not to be cut. Underdeveloped countries apply foreign indebted-ness in order to clear current accounts deficit, conduct the payments of foreign debts regularly and provide new resources.
The countries that have great amounts of debts have begun to question the issue of foreign debts along with the payment issues. However, due to the increase of foreign debt interests, disadvantageous position of foreign trade rates, the reduc-tion of price in export goods because of excessive desire of selling these goods, this questioning cannot prevent the direct flow of crucial part of value added funds from the indebted developing countries to industrialized countries.
REFERENCES
Acar, İ. A., Dulupçu M. A. (2003). Kamu Borç Yönetiminde Etkinlik Arayışları : Dış Kredilerin Kullanımı ve Geri Ödeme Süreçlerinin İncelenme-si – Süleyman Demirel Üniversitesi Araştırma Uygulama Hastanesi Örneği , XVIII. Türkiye Maliye Sempozyumu, Türkiye’de Kamu Borçlanması, 12-16 Mayıs 2003. Marmara Üniversitesi Maliye Araştırma ve Uygulama Merkezi Yayın No : 16, İstanbul, 317-352.
Acar, Y. (1990). Büyüme Teorileri. UUGV Yayınları, Bursa.
Açba, S. (1991). Devlet Borçlanması. Adım Yayıncılık, Ankara.

426
FOREIGN DEBTS AND AIDS: A THEORETICAL RESEARCH IN TERMS OF REASONS AND TYPES
Hasan TÜRKAL
Akdoğan, A. (2011). Kamu Maliyesi. 14. Baskı. Gazi Kitabevi, Ankara.
Bakkal, U., Oktayer, N. (2003). Dış Borçlanma ve Ödemeler Dengesi İlişkisi, XVIII. Türkiye Maliye Sempozyumu “Türkiye’de Kamu Borçlan-ması, 12-16 Mayıs 2003., Marmara Üniversitesi Maliye Araştırma ve Uygulama Merkezi Yayın No : 16, İstanbul, 217-229.
Batırel, Ö. F. (2007) Kamu Maliyesi ve Yönetimi. İstanbul Ticaret Üniversitesi Yayınları No. 24, İstanbul.
Berksoy, T. (1989). Türkiye’nin Dış Borçlanması, V. Türkiye Maliye Eğitimi Sempozyumu (22-24 Mayıs 1989). Gazi Üniversitesi İİBF Maliye Bölümü, Ankara, 53-73.
Bilginoğlu, M. A., Aysu, A. (2008). Dış Borçların Ekonomik Büyüme Üzer-indeki Etkisi: Türkiye Örneği, Erciyes Üniversitesi İktisadi ve İdari Bilimler Fakültesi Dergisi, 31(Temmuz-Aralık), 1-23.
Bilici, N. (2019). Kamu Maliyesi II (İktisadi Boyut). 10. Baskı. Savaş Yayınevi, Ankara.
Birdal, İ., Ulutan B. (1992). Ekonomik Kalkınma Stratejisi, Milliyet Yayınları, İstanbul.
Bulutoğlu, K. (2004). Kamu Bütçesi Kamu Harcamaları Kamu Borçları. Batı Türkeli Yayıncılık, İstanbul.
Bulutoğlu, K. (2008). Kamu Ekonomisine Giriş, 7. Baskı. Maliye ve Hukuk Yayınları, İstanbul.
Bülbül, D. (2019). Devlet Maliyesi. Savaş Yayınevi, Ankara.
Can, E. (1998). Dış Borçlanmanın Ekonomik Büyüme ve Kalkınma Üzer-indeki Etkisi ve Türkiye’nin 1983–1995/96 Dönemindeki Dış Borçlarının Genel Bir Değerlendirilmesi, M.Ü İktisadi ve İdari Bilimler Fakültesi Dergisi, 14, 131-148.
Cecchetti, S., Mohanty M. S., Zampolli, F. (2011). Achieving Growth Amid Fiscal Imbalances: The Real Effects of Debt, Economic Symposi-um Conference Proceedings, Jackson Hole, 145-96, https://www.kansascityfed.org/publicat/sympos/2011/Cecchetti_final.pdf, 16.6.2020.
Checherita-Westphal, C. D., Hallett, A. H., Rother, P. C. (2012). Fiscal Sus-tainability Using Growth-Maximising Debt Targets, ECB Work-

PERSPECTIVES ON MODERN ECONOMY
Aizhan KHOICH, Ali Eren ALPER, Ahmet Arif EREN
427
ing Paper Series No: 1472, September, https://www.ecb.europa.eu/pub/pdf/scpwps/ecbwp1472.pdf, 16.6.2020.
Çapık, E., Kösekahyaoğlu, L. (2019). Türkiye’de Dış Borç-Büyüme İlişkisi: 1985-2018 Dönemi Üzerine Bir İnceleme, Akademik Araştırmalar ve Çalışmalar Dergisi, 11(21), 411-427.
Değer, M. E. (1993). Emperyalizmin Tuzaklarında Ya da Oltadaki Balık Türki-ye. 2. B., Çınar Yayınları, İstanbul.
Demir, M. (2009). Türkiye’de Kamu Borçlarının Gelişimi ve Sürdürülebilirliği. Çizgi Kitabevi, Konya.
Dikeç, Ü. (1989). Dış Devlet Borçları ve Dünyadaki Son Gelişmeler, V. Türkiye Maliye Eğitimi Sempozyumu (22-24 Mayıs 1989), Gazi Üniversi-tesi İİBF Maliye Bölümü, Ankara, 41-52.
Due, J. F. (1963). Maliye Bir İktisadi Analiz. (Çev. Sevim Görgün ve İzzettin Önder), İstanbul Üniversitesi Maliye Enstitüsü Yayın No : 27.
Eğilmez, M. (2019). Kamu Maliyesi. Remzi Kitabevi, İstanbul.
Eker, A. (1997). Kamu Maliyesi. 2. B., Anadolu Matbaacılık, İzmir.
Eker, A., Meriç, M., Bülbül, D. (2005). Devlet Borçları (Kamu Kredisi). Çağdaş Matbaası, Ankara.
Emil, F. (2003). 1950’den Bu Yana Türkiye’de Kamu Borçlanmasına Yol Açan Nedenlerin Bazı Tarihsel Veriler Işığında İncelenmesi, XVIII. Tür-kiye Maliye Sempozyumu “Türkiye’de Kamu Borçlanması” 12-16 Mayıs 2003. Marmara Üniversitesi Maliye Araştırma ve Uygulama Merkezi Yayın No : 16, İstanbul, 35-53.
Erçel, G. (1992). Türkiye’nin Dış Borç Birikiminin Kaynakları, Maliye Yazıları, 36(Temmuz-Eylül), 7-17.
Evgin, T. (2000). Dünden Bugüne Dış Borçlarımız. Hazine Müsteşarlığı Yayın-ları, Ankara.
Hjertholm, P. (1999). Analytical History of Heavily Indebted Poor Country (HIPC) Debt Sustainability Targets, Discussion Papers Depart-ment of Economics University of Copenhagen, 00-03, https://www.economics.ku.dk/research/publications/wp/2000/0003.pdf/, 12.6.2020.

428
FOREIGN DEBTS AND AIDS: A THEORETICAL RESEARCH IN TERMS OF REASONS AND TYPES
Hasan TÜRKAL
İnce, M. (1996). Devlet Borçlanması (Kamu Kredisi). 5, B. Seçkin Yayıncılık, Ankara.
İnce, M. (2000). Devlet Borçları ve Türkiye. Gazi Kitabevi, Ankara.
Keçeligil, H. T. (2019). Başlangıçtan Günümüze Türkiye’nin Borçları ve Kırıl-gan Beşli, Ufuk Üniversitesi Sosyal Bilimler Enstitüsü Dergisi, 8(15), 103-129.
Kirmanoğlu, H. (2009). Kamu Ekonomisi Analizi, 2. Baskı, Beta Yayınevi, İs-tanbul.
Korkmaz, B., Aybarç, S. (2018). Bir İktidar Aracı Olarak Dış Yardım ve Dış Borçlar: Osmanlı İmparatorluğu’ndan Günümüze Türkiye’nin Dış Borçlanma / Borçlandırılma Serüveni, Dokuz Eylül Üniversitesi İktisadi ve İdari Bilimler Fakültesi Dergisi, 33(2), 623-655.
Kutlu, E. (1995). Dünya Ekonomisi. Anadolu Üniversitesi Basımevi, Eskişehir.
Meriç, M. (1995). Devletin Borçlanma Hakkı ve Yetkisi, Sayıştay Dergisi, 11(Ocak-Mart), 9-22.
Musgrave, R. A. (y.y). Maliye Politikası (Çev. Orhan Şener). Alkım Yayınevi, Ankara.
Orhaner, E. (2007). Kamu Maliyesi. Ankara.
Önen, Z. S. (1996). Uluslararası Mali Kuruluşlar. Gazi Üniversitesi İİBF Yayın No : 51, Ankara.
Perkins, J. (2015). Bir Ekonomik Tetikçinin İtirafları (Çev. Murat Kayı). April Yayıncılık, İstanbul.
Sönmez, S. (1987). Kamu Ekonomisi Teorisi Kamu Harcamalarında Etkinlik Arayışı. Teori Yayınları, Ankara.
Şener, O. (1996). Kamu Ekonomisi. 5. Baskı. Beta Basım Yayım, İstanbul.
Tural, A. (1992). Devlet Borçları. Maliye ve Gümrük Bakanlığı, Ankara.
Turan, T. (2019). Kamu Borcunun Ekonomik Büyüme Üzerindeki Etkileri: Türkiye İçin Eşbütünleşme Analizi, Maliye Dergisi, 177(Tem-muz-Aralık), 1-27.
Tüğen, K. (1991). Gelişmiş ve Gelişmekte Olan Ülkelerde Dış Borçlanmalar, Maliye Yazıları, 31(Temmuz-Ağustos), 23-33.
Türk, İ. (1997). Maliye Politikası. 11. Baskı. Turhan Kitabevi, Ankara.

PERSPECTIVES ON MODERN ECONOMY
Aizhan KHOICH, Ali Eren ALPER, Ahmet Arif EREN
429
Türkiye Cumhuriyet Merkez Bankası. (1994). Ekonomiyi İzleme ve İstatistik Çalışmaları (1988-1992). Ankara.
Uluatam, Ö. (1997). Kamu Maliyesi. 5. B., İmaj Yayınevi, Ankara.
Ulusoy, A. (2013). Devlet Borçlanması. 7. Baskı. Aksakal Kitabevi, Trabzon.
Woo, J., Kumar, M. S. (2010), Public Debt and Growth, IMF Working Pa-per, WP/10/174, https://www.imf.org/external/pubs/ft/wp/2010/wp10174.pdf, 16.6.2020.
Zıllıoğlu, O. N. (1984). Gelişmekte Olan Ülkelerde Dış Borç Sorunu. Anadolu Üniversitesi İktisadi ve İdari Bilimler Fakültesi, Eskişehir.

431
26AN ANALYSIS OF SOCIAL INTERACTION AND SOCIAL MULTIPLIER: JUSTICE SERVICES IN TURKEYSevilay Ece GÜMÜŞ ÖZUYAR1
Introduction
According to Schelling’s critical mass model, some people are always involved in actions, while some people act when enough people do that action and affect the society (Scheinkman, 2007: 1833). This model of Schelling has encouraged so-cial scientists to investigate how human behavior and characteristics as a microe-conomic element affect the society as whole. Based on this idea, life satisfaction theorists have investigated how and in what direction people in a society affect each other with their personality traits and behaviors, and they have reached the social multiplier factor formed as a result of social interactions.
In this manner, the aim of this study is to make social interaction analysis and to identify the existence and size of social multiplier factor for Turkey by using jus-tice service, which is considered as pure public good in literature. The accuracy of the listed objectives are tested using one-way ANOVA, multinominal logistic re-gression and binary probit regression methods. The data set used is obtained from the Life Satisfaction Surveys conducted by TURKSTAT between 2004 and 2012.
This study consists of four chapters.When the first chapter of this study detail ar-gue social interactions and social multiplier concepts, the second section briefly explains the type of public goods and services that the data set used in the assess-ment belongs to. While the third part includes the data and methods applied to achieve the aforementioned goals, the last chapter summarizes the findings of the study and mentions the limitations and opportunities of the study.
1 Asst. Prof., Necmettin Erbakan University, Public Finance Department

432
AN ANALYSIS OF SOCIAL INTERACTION AND SOCIAL MULTIPLIER: JUSTICE SERVICES IN TURKEY
Sevilay Ece GÜMÜŞ ÖZUYAR
Social Interactions and Social Multiplier
In many cases there are certain rules that people living in communities have to follow. These rules are determined by mutual agreement by the groups in which individuals belong, using various political decision-making mechanisms. Even if people who benefit from these rules as well as those who suffer damage due to these rules, if they still want to continue their existence in the group, they have to obey these rules. In other words, if the benefit that a person will obtain individ-ually is maximized by overlapping with the general situation, people continue to act together. Yet, their partnership will also affect each other’s benefits or results.
At this point, the effects of each of the individuals in the society on each other get involved; so on this line social interactions are the effects of individual pref-erences or behavior patterns on a particular group (Scheinkman, 2007: 1). This group can be a family or a circle of friends, settlement or country. The effects of each individual on others are analyzed in terms of the effect on y of an additional unit of change x, which is economically called marginality. Videlicet,the impact that each additional person creates in society due to their personality traits, be-haviors and other reasons is called social multiplier and social interactions that create social multiplier forces are a measure of how a person’s utility is affected by whether other individuals do the same thing (Cutler ve Glaeser, 2007:1). It can change the preferences of individuals, shape their expectations and even interfere with the intensity of the utility to be obtained (Manski, 2000:118). These direct interactions become more visible, especially if there is a spreading effect that af-fects individuals in the same or the same direction (Kroft, 2006: 23).
Social multipliers are also considered to be an indicator of the strategic comple-mentarity of agents interacting with each other, which is also an explanation of how individual traits create social behavior patterns (Burke, 2008:1)2. This mul-tiplier effect can also be calculated by the ratio of the change between the vari-ances of the groups to the change between the within-group variances in a data set. The result found is equal to the F-statistic value found with a standard one-way ANOVA statistic, as long as there is no discarded variable because there is a correlation in the data set (Kroft, 2006: 3, 22). This value is higher than 10 in large sample groups that may correspond to a country (Cutler ve Glaeser, 2007: 3) and the social multiplier effect is relatively smaller for the elements that have a
2 For theoretical mathematical inferences by finding the social multiplier Burke, 2008.

PERSPECTIVES ON MODERN ECONOMY
Aizhan KHOICH, Ali Eren ALPER, Ahmet Arif EREN
433
widespread effect such as crime and education (Glaeser et al., 1996: 508). Graham & Hahn (2005) argues that the multiplier, which has a value significantly greater than 1, has strategic complementarity arising from the internal dynamics and in-teractions of the community. The analysis of the social interactions achieved by the individual responses given by individuals within the framework of their own socio-demographic and economic characteristics and opinions is done through the coefficients of the independent variables used in the models.
For example, Glaser et al. (1996) created a regression model to determine the ef-fect of crime rates in major American cities, and analyzed the effects of human behavior and characteristics by saying 1 for the occurrence of the event and 0 for the non-occurrence. The formula for the model is given below (Glaser et al, 1996: 515-516):
(2.1)
n= Individuals
= Actions of the individuals
= function of normally distributed group variance (limit)
p= mean of the actions (limit)
According to this model, if the individual performs the action, the probability of crime becomes p, if not, it becomes 1-p, and the individual’s action affects the group he / she belongs to as much as the probability of (1- π).
In this case, when two people in the society decide to act,the probability of action of the individuals who act will affect the society they are in as much as the prob-ability of (2- π) divided by group variance multiplied by the individuals’ proba-bility of action. That is, each individual who acts affects the society to a degree varying with the size of the society. Bikhchandani et al (1992), Topa (2001), Du-flo & Saez (2003), Ioannides & Zabel (2003), Graham (2008), Ichino & Falk (2006), Hoxby & Weingarth (2006) make inferences supporting the aforemen-tioned finding by conducting studies in different fields (fashion, workforce, etc.) but similarly for social interaction and social multipliers.
So, if each individual affects the society, and the society in general affects the in-dividual, the existence of a strategic interaction created by actions for personal

434
AN ANALYSIS OF SOCIAL INTERACTION AND SOCIAL MULTIPLIER: JUSTICE SERVICES IN TURKEY
Sevilay Ece GÜMÜŞ ÖZUYAR
benefit maximization should not be denied. Although strategic behavior extends the subject to game theory based on trade-offs, the notion of strategic behav-ior enables individuals to emerge in their social preferences in the set of situa-tions where the notion will show itself at the lowest level. For this reason, in this study, it was preferred to make an analysis over a pure public good and service.
Justice Service as a Pure Public Good
Even though there is no consensus of opinion on how to classify the goods and services produced by the public sector (Rosen & Gayer, 2008: 53), goods and services for which no one is excluded from their consumption, no competition in their consumption, and which are subject to common consumption are called pure public goods and services (Samuelson, 1954: 387-388, Trogen, 2005: 173). Very few goods carry the mentioned characteristics; which can be listed as na-tional defense, diplomacy, public order and social order and justice as public goods and services in the economic literature (Musgrave, 1959: 44; North, 1981: 23; Holcombe, 1997: 11).
Among these mentioned pure public goods, the only good that has no private equivalent in the market is justice. In addition, since the justice service is sub-ject to the collective and equal consumption of the whole society, it has a supe-riority compared to other goods and services in order to reveal social perceptions (Gümüş Özuyar et al,2020: 301) . Also, the justice service provides special utility to individuals who benefit while providing social utility to the whole community (Cohn, 1985). In this context, it is more related to individual value judgments compared to other public goods. Since it is the subject of philosophy which sit-uation an individual considers as fair, the concept of justice changes according to the environment in which a person grows up and where he or she lives, per-sonality traits, education level, social status or religion in which he or she defines himself. However, the provision of justice services is carried out only by the pub-lic in a uniform manner. So here, in this study, the reason for choosing the jus-tice service is all the nuances explained above.
Data and Methodology
“Development of an informative, cumulative body of empirical research on social in-teractions will require clear thinking and adequate data” (Manski, 2000: 132). To

PERSPECTIVES ON MODERN ECONOMY
Aizhan KHOICH, Ali Eren ALPER, Ahmet Arif EREN
435
carry out this work, for exactly this reason, TÜİK 2004-2012 Life Satisfaction (LS) questionnaires are selected for social impact analysis, where direct questions are not asked and therefore no strategic behavior is displayed. Also another rea-son for using LS data is the absence of any other data set which consist the re-sponses regarding both to what extent citizens are satisfied with the provision of public goods, to what extent these individual satisfaction levels affect each other and what kind of effects they have on society in Turkey.
In fact, although surveys on life satisfaction have been conducted by TURKSTAT since 2003, there is no similarity between the questions asked in the 2003 sur-vey and the survey questions of the following years. For this reason, 2003 data are not included in the analysis for this study. In the years after 2012, LSS is not defined by the urban-rural distinction across Turkey, it has been carried out in some provinces. In short, the questionnaire, which has a two-level clustering layer, has been made 81 stratified. In addition, the number of individuals sur-veyed in 2013 has increased approximately 28 times compared to 2012. There-fore, throughout this study, only the surveys conducted between 2004 and 2012 are used in order to ensure integrity between the obtained data sets and to avoid statistical Type I3 problem.
A total of 62.933 people participated in the LSS held between 2004 and 2012, but 39.924 of these participants answered all questions in the questionnaire. The least participation in the survey was in 2010 with 3,818 people, while the high-est participation was in 2012 with 5,064 people. The number of participants in other years is very close to each other.
3 Type I error arises when the null hypothesis rejected even though it was correct. Such errors are called “risk” or “probability of first type error” and are denoted by the “α” level. The probability of error of the greatest permissible “α” is usually the starting point of the hypothesis testing (Büyüköztürk, 1993: 418). In stratified (subset) sampling; total sample divided into units and after measurements such as mean and variance for each stratum separated, the units are combined for the total sample. Therefore, the possibilities vary depending on the choice of different subset (layer) in each stratification method (Duflo et al., 2008: 3934). Both the enlargement of the sample width and the change in the stratification system in 2013, when evaluated together with the analyzes before this date (2003-2012), can change the statistical power values (Type I Error). Yet, in order for a sample to find its explanatory value, it must reach at least 80% power value (ie. Hsieh et al, 1998: 1623-1624). Therefore, the year of 2013 is excluded from the analysis due to the strong opinion that the inclusion of the 2013 data in the 2004-2012 data may decrease the power value.

436
AN ANALYSIS OF SOCIAL INTERACTION AND SOCIAL MULTIPLIER: JUSTICE SERVICES IN TURKEY
Sevilay Ece GÜMÜŞ ÖZUYAR
Table 1. Number of people participating in the survey between 2004 and 2012, according to their satisfaction level
Satisfaction with Justice Services Year Total
2004 2005 2006 2007 2008 2009 2010 2011 2012
1 113 82 120 122 110 155 198 167 141 1.208
2 2.858 2.675 2.769 3.023 2.811 2.832 2.379 2.652 3.381 25.380
3 987 878 854 684 771 689 581 586 790 6.820
4 684 642 578 489 532 508 476 498 552 4.959
5 171 184 130 96 117 243 184 232 202 1.559
Total 4.813 4.461 4.451 4.414 4.341 4.427 3.818 4.135 5.066 39.924
19,107 of the participants are women and 20,818 of them are men. It is believed that the close participation of the genders ensures that the effects of the gender factor on the perception of quality and satisfaction in public services can be re-vealed with a very low margin of error. While 30.067 of the individuals partici-pating in the survey are married; 6,747 of them are single. The spouse of 1,947 participants died and 824 participants were divorced. And 0.85% of the respond-ents stated that they live separately from their spouses. In addition, 28,920, or 72.4% of the participants reside in urban areas and 27.56% in rural areas. Con-sidering the educational status of the individuals participating in the question-naire, it was seen that the majority of the participants consisted of people who have not completed any school / cannot read and write / can read and write but cannot finish school, and individuals who graduated from primary and open pri-mary school or primary education / open primary education / general secondary school / vocational secondary school. Among these, the number of graduates of primary school and open primary school is 15,426. In total, only 6% of the in-dividuals participating in the questionnaire consist of at least college graduates that can be qualified as highly educated. When the income levels of the indi-viduals who participated in the survey are examined, it is found that the partici-pants generally have very low, low, low-medium or high-medium earnings. Most of these people are low-income individuals with 9,353 people. Individuals with very high income have the lowest percentage with 5.97%.
One-way ANOVA statistics are applied in order to determine the social multiplier values. The status of each satisfaction level which has been evaluated according to the “satisfaction” level, which is the dense frequency, as well as the transition between

PERSPECTIVES ON MODERN ECONOMY
Aizhan KHOICH, Ali Eren ALPER, Ahmet Arif EREN
437
satisfaction levels is determined by the multinominal logistic regression method4. With the multinomial logistics model, it is aimed to determine how individuals’ socio-demographic characteristics and expectations and the thoughts of feeling safe at home differ according to each level of satisfaction with the provision of justice service. With the Hausman-McFadden (1984) test, it is tried to observe whether there is a difference between the parameters of the model and the parameters of the models obtained by removing the levels of the satisfaction with justice services from the model separately. For this purpose, the second level with the highest fre-quency of satisfaction with forensic services from “1” to “5”, ie “I am satisfied with the level of justice service provided” is taken as the base and the test is conducted.
In addition to all these, the principal component analysis should not be con-ducted within the scope of this study, since the data have a fragile normal dis-tribution structure and are found to be linear. Since the binary probit model is a regression analysis type that can be applied for both normally distributed and non-showing data, it does not conflict with principal component analysis and can be seen as an alternative. With the robust White test, it is determined that there was no changing variance problem and the dependent variable structure is given a structure with 1 and 0 in the case of “Satisfied - Not Satisfied” from the 5-point Likert scale, and the dual probit method can be used.
As it was mentioned before, the analysis of the social interactions achieved by the individual responses given by individuals within the framework of their own socio-demographic and economic characteristics and opinions is done through the coefficients of the independent variables used in the models. For this reason, the utility function is extracted with binary probit regression5 analysis and de-
4 Since the p values (Prob> Chi2) shown for satisfaction levels are greater than 5%, it is concluded that there is no significant difference between the predicted parameters. In this case, since the IIA assumption is not broken, it is certainly determined that the multinomial logit regression method can be chosen in this study. In addition, when the dependent and independent variables and the frequency densities of these variables are examined, it is seen that the frequencies of some variables are lower than the frequencies of the other dependent and independent variable levels. However, it has been understood that the reliability of the multinomial regression to be established is not in jeopardy due to the fact that the crossover frequencies can compensate this difference. Therefore, it is understood that multinomial logit regression analysis can be used because the dependent variable, satisfaction with justice services, is a qualitative variable in a categorical structure with more than two levels and the frequency values of the independent variables are quite high.variable levels. Since the value of _hatsq for the relevant regression model is 0.608> 0.10, the null hypothesis is accepted. In other words, no variables required in the model are left out, and no unnecessary variables are included in the model. As a result, there is no specification error in the model.
5 Since the value of _hatsq is 0.384> 0.10, the null hypothesis is accepted. The “fitstat” statistics

438
AN ANALYSIS OF SOCIAL INTERACTION AND SOCIAL MULTIPLIER: JUSTICE SERVICES IN TURKEY
Sevilay Ece GÜMÜŞ ÖZUYAR
mand components are determined. Demand components are also elements of so-cial interaction that show how the satisfaction of individuals with the provision of individual justice services has an impact on society. Social interaction factors enable the determination of the social multiplier for each demand component within the scope of this study.
The model considered as the basis for the utility function is established as follows6:
(4.1)
Since the main objective of this study is to reveal the factors affecting the citi-zens’ satisfaction with the justice service, the socio-demographic and economic characteristics, which are considered as independent variables, are also included in the analysis7:
(4.2)
Thus, social interactions (marginal effects) are detected.
Findings
In this study, the dependent variable of the multinomial regression analysis, the citizen satisfaction levels for the provision of justice services areclassified as “very satisfied”, “satisfied”, “moderate”, “dissatisfied” and “so dissatisfied”. In order to con-struct the model, the dependent variable level with the highest frequency value “satisfied” is taken as the base outcome (cornerstone). Therefore, since the esti-mated number of regression equations is one less than the number of satisfaction levels, which is the dependent variable, the result of four separate multinomial
of the Probit model are checked. Fitstat statistics includes the fit statistics of the established model and suggests choosing models with larger artificial R2, lower AIC and BIC information criteria, and smaller “Variance of y *” value expressing the variance of the estimated values. Depending on the comparison of the models established according to both methods, the dual probit method is adopted in the light of the reasons mentioned above.
6 Similarly, in field studies such as Mitchell and Careson (2005) Levinson (2009) and Lora (2016), the utility function from the model was defined. JSS satisfaction with justice services for the person responding to the questionnaire, , derivative of income to find marginal effects, socio-demographic characteristics for each individual i, error term
7 future expectation for the person i responding to the questionnaire, derivative to find marginal effects of income, socio-demographic characteristics for each individual i, error term

PERSPECTIVES ON MODERN ECONOMY
Aizhan KHOICH, Ali Eren ALPER, Ahmet Arif EREN
439
equations are created. The chi-square value (Wald Chi2) was calculated to be 5245.99 and the p value (Probe> Chi2) to be 0.00 <0.01. These values indicate that the model is statistically significant.
In this context, the coefficients of the multinomial logit regression of the estab-lished model and the relative risk ratios (RRR) showing marginal effects are shown in Table 2 for each dependent variable level.
Table 2. Relative risk ratios (RRR) showing coefficients and marginal effects of multinomial logit regression
VariablesCoefficient RRR Coefficient RRR Coefficient RRR Coefficient RRR
Constant (-1.869)*** 0.154*** (-1.639)*** 0.194*** (-2.469)*** 0.0084*** (-3.874)*** 0.020***Year2005 (-0.185) 0.831 (-0.042) 0.959 (-0.012) 0.988 0.102 1.1072006 0.133 1.142 (-0.124)** 0.882** (-0.169)*** 0.844*** (-0.275)** 0.758**2007 0.071 1.073 (-0.412)*** 0.662*** (-0.384)*** 0.680*** (-0.627)*** 0.534***2008 0.015 1.016 (-0.322)*** 0.724*** (-0.398)*** 0.671*** (-0.579)*** 0.560***2009 0.454*** 1.575*** (-0.350)*** 0.704*** (-0.235)*** 0.790*** 0.462*** 1.586***2010 0.837*** 2.309*** (-0.276)*** 0.758*** (-0.039) 0.962 0.486*** 1.625***2011 0.570*** 1.769*** (-0.404)*** 0.667*** (-0.155)** 0.855** 0.572*** 1.771***2012 0.094 1.099 (-0.241)*** 0.785*** (-0.024) 0.977 0.466*** 1.593***IncomeLow Income (-0.126) 0.882 (-0.073) 0.929 (-0.060) 0.942 (-0.110) 0.895Middle Income (-0.030) 0.971 0.071 1.074 0.118** 1.124** (-0.074) 0.929Middle-High Income (-0.012) 0.988 0.125** 1.133** 0.156*** 1.169*** 0.118 1.125High Income 0.157 Oca.17 0.118** 1.125** 0.352*** 1.421*** 0.234** 1.264**Very High Income 0.129 1.138 0.48*** 1.616*** 0.608*** 1.836*** 0.647*** 1.910***SettlementRural (-0.022) 0.978 (-0.203)*** 0.816*** (-0.224)*** 0.799*** (-0.254)*** 0.775***GenderWoman (-0.169)*** 0.844*** (-0.124)*** 0.883*** (-0.436)*** 0.646*** (-0.526)*** 0.59***Maritial StatusMarried 0.085 1.089 (-0.138)*** 0.871*** (-0.001) 0.999 0.056 1.057Widow 0.102 1.108 (-0.221)*** 0.801*** (-0.05) 0.951 0.151 1.163Divorced 0.169 1.184 (-0.022) 0.978 0.323*** 1.380*** 0.57*** 1.767***Separated (-0.381) 0.683 0.058 1.060 0.633*** 1.882*** 1.053*** 2.866***EducationPrimary school/open primary school (-0.043) 0.958 0.130*** 1.138*** 0.397*** 1.487*** 0.475*** 1.608***primary education/open primary educationgeneral secondary school/vocational secondary school (-0.229)** 0.794** 0.424*** 1.528*** 0.892*** 2.439*** 1.056*** 2.876***general high school/vocational high school/open high school (-0.160) 0.852 0.630*** 1.877*** 1.316*** 3.726*** 1.521*** 4.577***two or three year college (-0.292) 0.747 0.785*** 2.191*** 1.660*** 5.261*** 2.080*** 8.006***four-year college or faculty (-0.148) 0.862 0.863*** 2.370*** 1.659*** 5.253*** 2.008*** 7.446***Ms/PhD 0.21 1.234 1.476*** 4.376*** 1.939*** 6.948** 2.909*** 18.34***ExpectationsSame (-0.465)*** 0.627*** 0.330*** 1.391*** 0.206*** 1.228*** 0.178*** 1.194***Worse (-0.156) 0.855 0.598*** 1.818*** 0.886*** 2.425*** 1.143*** 3.136***No idea (-0.137) 0.872 0.116* 1.122* 0.493*** 1.637*** 0.484*** 1.622***Feeling Safe at HomeSecure (-1.810)*** 0.163*** 0.044 1.045 (-0.136)*** 0.040*** (-0.468)*** 0.625***Neutral (-1.464)*** 0.231*** 0.690*** 1.994*** 0.529*** 0.095*** 0.355*** 1.425***Not-secure (-1.148)*** 0.317*** 0.541*** 1.717*** 1.071*** 0.183*** 0.841*** 2.318***Very insecure (-0.399)* 0.670* 0.673*** 1.959*** 1.118*** 0.348*** 1.963*** 7.123***
*** statistically significance at 0.01 level, ** significant at 0.05 level * significance at 0.1 level.
MLR according to Satisfied with the Provision of Justice ServicesVery Satisfied Moderate Dissatisfied So Dissatisfied

440
AN ANALYSIS OF SOCIAL INTERACTION AND SOCIAL MULTIPLIER: JUSTICE SERVICES IN TURKEY
Sevilay Ece GÜMÜŞ ÖZUYAR
The fixed values represented in the model and the positive and significant coef-ficients of the independent variables indicate that there is a shift from the basic level of satisfaction with justice services, which is the dependent variable, to the relevant level of the independent variable analyzed. Negative but significant co-efficients show that there is a trend from the level of the relevant independent variable to the basic level of the satisfaction with justice.
As a result of the analysis of the individuals who are very satisfied with the pro-vision of the justice service in Table 2, Part 1, according to the satisfied individ-uals, the main coefficient value expressed as constant was calculated as -1.869. This situation reveals that individuals who state that they are very satisfied with the justice service actually have a preference for their satisfaction. In other words, individuals who declared that they are very satisfied with the justice services with a different discourse prefer their satisfaction level 0.154 times more to their very satisfaction level if the justice service is increased by one unit. Similarly, when the delivery of the justice service is improved on a unit, individuals prefer moderate satisfaction to satisfaction, dissatisfied to satisfied, and so dissatisfied to satisfied as well. The most striking finding in this preference is that the desire to be satis-fied is low for the levels who state that they are not satisfied, and the higher the desire to be satisfied for the levels who state that they are satisfied.
When evaluations are made in terms of social interaction, the coefficients of in-dependent variables should be examined. Since satisfaction with justice services has a negative coefficient in 2005, the likelihood of individuals being satisfied with legal services decreases in the mentioned year compared to 2004. Looking at the relative risk ratio (RRR) value, it is seen that this decrease is 0.831 times or 18.5%. However, since the coefficient showing this relationship is not signif-icant (p = 0.215> 0.1), it can be said that there is no significant difference be-tween the satisfaction of individuals who are very satisfied with the provision of justice service in 2005 and those who are satisfied. On the other hand, in 2006, 2007, 2008 and 2012, it is observed that there is no significant difference between the satisfaction of individuals who are very satisfied and those who are satisfied since their p values are meaningless. When looking at the change in satisfaction in 2009, 2010 and 2011, it is seen that the individuals who are very satisfied are approximately 45% to 84% more satisfied than the individuals who declared that they are satisfied. In other words, there is a tendency to be very satisfied with the provision of mentioned services in these years. When the satisfaction levels of the

PERSPECTIVES ON MODERN ECONOMY
Aizhan KHOICH, Ali Eren ALPER, Ahmet Arif EREN
441
individuals who are moderately satisfied with the justice and those who are satis-fied are compared on the basis of years, it has been determined that all coefficients are negative. Negative coefficients show that there is a flow from the relevant ar-gument level to the baseline level. In other words, individuals who are moderately satisfied with legal services tend to be more satisfied with these services over time.
There is a significant and significant change between the satisfaction of individ-uals who are satisfied with the provision of the justice service and those who are moderately satisfied for all other years, except 2005, for which p value is found to be significant. Between 2006 and 2012, moderately satisfied individuals have a desire and tendency to reach a higher level of satisfaction over time. When the satisfaction levels of the individuals who are not satisfied with the justice services between the years 2005 and 2012 are compared with the individuals who are satisfied, it is seen that all the coefficients are negative, as is the moderate level of satisfaction. However, among these years, statistically significant coefficients are obtained only in 2006, 2007, 2008, 2009 and 2011; and the probability of being satisfied with legal services is 16.9%, 38.4%, 39.8%, 23.5% and 15.5% higher than the probability of dissatisfaction, respectively. Considering the situa-tion of individuals who are not satisfied with the provision of the justice service compared to the individuals who are satisfied, it was found that the p values for all years except 2005 were statistically significant. In 2006, 2007 and 2008, in-dividuals were more likely to be satisfied with the justice service than they were not at all; but it is observed that individuals are more likely to be so unsatisfied with the services in 2009, 2010, 2011 and 2012.
In addition, in the light of all these calculations, the transition between satisfac-tion levels in each year is also considered. With the coefficient and relative risk ratios found in the multinomial regression model, these gradation calculations are made in order to understand how many percent of the individuals at which satisfaction level are more likely to switch to the upper or lower satisfaction level in which years. In the case that the rate found in the calculations is greater than 1, it indicates the willingness to remain at the level of satisfaction that we al-ready have compared to 2004, and if it is less than 1, it indicates the willingness to move from the current satisfaction level to the questioned satisfaction level.

442
AN ANALYSIS OF SOCIAL INTERACTION AND SOCIAL MULTIPLIER: JUSTICE SERVICES IN TURKEY
Sevilay Ece GÜMÜŞ ÖZUYAR
Table 3. Satisfaction level transition between 2005-2012 (2004 is the base year)
According to the results given in Table 3, individuals who are not satisfied with the provision of justice in 2005 generally do not tend to move to higher level of satisfaction. However, it is understood that the year 2005 is not useful in terms of comparing the satisfaction trends, as all values for this year are statistically mean-ingless in the model created. Yet, still it has been figured out that especially in 2006, 2007 and 2008, individuals want to move to higher level of satisfaction. In 2009, 2010, 2011 and 2012, individuals who are not satisfied and those who declared that they are moderately satisfied show a willingness to move to a higher level of satisfaction. Those who are not satisfied at all do not want to change their level of satisfaction, except in 2010.
Considering the income levels of the individuals who are very satisfied with the provision of justice and the individuals who are satisfied; it is seen that low, mid-dle and middle-upper income levels have negative coefficients, while high and very high income levels have a positive coefficient. In this case, low-income and middle-income individuals become more willing to be satisfied by leaving their own satisfaction level when their income increases by one unit; but individu-als who are in high and very high income levels do not change and not willing to change their level of satisfaction as a result of a one-unit increase in their in-come. Additionaly, it is observed that individuals who state that they are moder-ately satisfied with legal services are less sensitive to changes in income. The fact remains that, while a one-unit increase in income increases the level of satisfac-tion for low-income individuals among the moderately satisfied individuals, the clarity of the relationship cannot be mentioned due to the insignificance of the coefficients. When the relationship between income levels and satisfaction is ex-amined for individuals who are satisfied with legal services and those who are

PERSPECTIVES ON MODERN ECONOMY
Aizhan KHOICH, Ali Eren ALPER, Ahmet Arif EREN
443
not, it is understood that individuals with all other income levels, except low-in-come individuals, do not change their level of satisfaction, in other words, they continue to be dissatisfied with legal services.
Considering the satisfaction with the justice service in terms of settlement, it is determined that the individuals living in the city are 0.022 times more satisfied with the justice service than the individuals living in the countryside, but this ef-fect on satisfaction is not statistically significant since the p value is 0.751> 0.01. For the individuals who stated that they were satisfied with the justice at a mod-erate level compare to satisfied individuals, the ones in the city prefer to remain at a statistically significant level (20.3%) compared to the rural ones. In other words, individuals in rural areas who state that they have moderate (almost nötr) satisfaction are 0.816 times more satisfied when the provision of legal services is increased by one unit.
When the satisfaction level of the individuals who are not satisfied with the pro-vision of justice services is evaluated, as can be seen in Table 2 (Section 3), while the individuals in the city insist on not being satisfied with the service level pro-vided, the individuals living in the rural areas increase their satisfaction level by 79.9%. When the satisfaction changes of individuals who are not satisfied with the provision of justice according to the place of residence are examined, it is seen in Table 2, Section 4, which the coefficient is negative and significant for the in-dividuals living in rural areas. This situation shows that those living in rural areas are 77.5% satisfied with legal services compared to those living in urban areas.
To examine the gender-satisfaction relationship, as can be understood from Table 2, Part 1, while men are 15.6% more satisfied with the provision of legal services compared to women, it is seen in Part 2 of the same table that men are 0.117 times more likely to stay at the medium satisfaction level than women. When the satisfaction with justice is examined in terms of gender in general, it is seen that women tend to be satisfied with legal services in each satisfaction level compari-son. When the relationship between marital status of the individuals participat-ing in the questionnaire and their state of being very satisfied and satisfied is ex-amined on the basis of the single variable; it is observed that the coefficients for the levels of “married”, “lost their spouse” and “divorced” were positive and neg-ative for the “separated” level. From this, it can be seen that compared to single

444
AN ANALYSIS OF SOCIAL INTERACTION AND SOCIAL MULTIPLIER: JUSTICE SERVICES IN TURKEY
Sevilay Ece GÜMÜŞ ÖZUYAR
individuals, individuals who are married, have lost their spouses and divorced prefer to remain very satisfied.
When the relationship between the state of being very satisfied, satisfied and the educational status of the individuals is analyzed on the basis of individuals who are considered as the first level in education, “who do not graduate from any school, who are illiterate, who can read and write but cannot finish school”, it is found that the coefficients are negative at all education levels excepts graduate and doctoral level. This shows that as the education level of citizens increases, their tendency to be very satisfied with justice service provision decreases. Also, as the level of ed-ucation increases, individuals’ satisfaction tendencies tend to maintain their satis-faction level or move towards a lower or lower level of satisfaction.
In addition, the dual probit regression method is applied within the scope of this study.
Table 4. Binary Probit Analysis for the Provision of Justice Service
Model 1: Citizen Satisfaction with the Provision of Justice Service
General Satisfaction 1.880194***General Expectations
Year(-0.0125162)***(-0.0032)
Income(-0.0539525)***(-0.14)
Settlement0.1088128***(0.03)
Gender0.2763602***(0.07)
Maritial Status(-0.0737363)***(-0.02)
Education(-0.2253218)***(-0.06)
Feeling Safe at Home(-0.2654457)***(-0.07)
Wald chi2 2517.84Prob> chi2 0.000Numbers in parentheses under the coefficients represent marginal effects*** statistically significance at 0.01 level, ** significant at 0.05 level * significance at 0.1 level.
In order to determine the social multiplier, the change between between-variance and within-variance must be determined, as explained earlier. Since the result found

PERSPECTIVES ON MODERN ECONOMY
Aizhan KHOICH, Ali Eren ALPER, Ahmet Arif EREN
445
is equal to the F statistic value found with a standard one-way ANOVA statis-tic (Kroft, 2008: 723-724), as long as the variances are not correlated with each other in the data set, one-way ANOVA statistics are given in Table 5.
Table 5. One-way ANOVA Test Results
Source SS df MS F Prob>F Source SS df MS F Prob>FBetween groups 102.60 8 12.8344 16.23 0.00 Between groups 1511846 8 302369 38.3 0Within groups 31564.3334 39916 0.7908 Within groups 315168242 39919 0.789499Total 31668.0088 39924 0.7932 Total 31668.0088 39924 0.7932Bartlett's test for equal variances. Chi2 (8)= 217.1700 Prob>chi2 =0.00 Bartlett's test for equal variances. Chi2 (4)= 117.1260 Prob>chi2 =0.00
Source SS df MS F Prob>F Source SS df MS F Prob>FBetween groups 588.466 5 117.6932 151.17 0.00 Between groups 1511846 8 3034879 38.3 0Within groups 31079.5428 39919 0.77854 Within groups 315168242 39919 0.799496Total 31668.0088 39924 0.7932 Total 31668.0088 39924 0.7932Bartlett's test for equal variances. Chi2 (5)= 340.2991 Prob>chi2 =0.00 Bartlett's test for equal variances. Chi2 (6)= 1.1e+03 Prob>chi2 =0.00
Source SS df MS F Prob>F Source SS df MS F Prob>FBetween groups 294.3276 1 294.3276 374.54 0 Between groups 14296679 6 238278 314.56 0Within groups 31373.6812 39923 0.78583 Within groups 30238341 39918 0.7575Total 31668.0088 39924 0.7932 Total 31668.0088 39924 0.7932Bartlett's test for equal variances. Chi2 (1)= 268.7933 Prob>chi2 =0.00 Bartlett's test for equal variances. Chi2 (3)= 300.3096 Prob>chi2 =0.00
Source SS df MS F Prob>F Source SS df MS F Prob>FBetween groups 1972232 1 1972232 250.2 0 Between groups 4076004 3 1358668 173.51 0Within groups 314707856 39923 0.788267 Within groups 312604084 39921 0.78303Total 31668.0088 39924 0.7932 Total 31668.0088 39924 0.7932Bartlett's test for equal variances. Chi2 (1)= 299.2088 Prob>chi2 =0.00 Bartlett's test for equal variances. Chi2 (4)= 718.1059 Prob>chi2 =0.00
Satisfaction of Justice Service Provision and GenderAnalysis of Variance
Satisfaction of Justice Service Provision and Maritial StatusAnalysis of Variance
Satisfaction of Justice Service Provision and EducationAnalysis of Variance
Satisfaction of Justice Service Provision and ExpectationAnalysis of Variance
Satisfaction of Justice Service Provision and Feeling Safe at HomeAnalysis of Variance
Satisfaction of Justice Service Provision and YearAnalysis of Variance
Satisfaction of Justice Service Provision and IncomeAnalysis of Variance
Satisfaction of Justice Service Provision and SettlementAnalysis of Variance
When these statistics are examined, it is seen that the strongest factor in social multiplier in terms of satisfaction with judicial services is the settlement. In other words, the area where citizens’ satisfaction with the property of justice has the highest effect on society is actually related to the place where individuals live. Later, they appear as factors affecting the whole society in terms of expectation for the future, gender, feeling safe at home and income, satisfaction from justice services. Although marital status and education have similar social multiplier ef-fects, the fact that education has a lower social multiplier compared to other in-dependent variables in line with field studies is considered acceptable due to the positive spillover effect on the whole society. The variable with the lowest social impact was calculated as years. Education, feeling of safe at home and income are the strongest factors, respectively, according to the results of the Kruskal Wallis test, which is applied due to the high fragility of normality and the inability to fully prove normality. Social interactions, which show how the benefit of a per-son creating social multiplier forces is affected by whether other individuals do the same thing or not (Cutler & Glaeser, 2008. 1) are expressed with marginal ef-fects on the sample size representing the population in the binary probit regression

446
AN ANALYSIS OF SOCIAL INTERACTION AND SOCIAL MULTIPLIER: JUSTICE SERVICES IN TURKEY
Sevilay Ece GÜMÜŞ ÖZUYAR
method. When evaluated from this point of view, it is determined that one unit increase in income and education levels affects satisfaction with justice services by 14% and 6%, respectively. That is, while a one-unit increase in income decreases citizens’ satisfaction with the provision of justice services by approximately 14%; One-unit improvement in the education status of citizens (for example, becom-ing a secondary school graduate from primary school) reduces satisfaction with justice services by 6%. In addition, a change that will occur if people feel safe at home or not feel safe at home affects the satisfaction of justice services by 7%.
When social interactions are considered in terms of where the citizens live, it is seen that living in the countryside creates a 3% increase in satisfaction with jus-tice services compared to living in the city. When trying to determine the factor that increases the satisfaction of the citizens from justice services by one unit in terms of their gender, it is determined that only being a “woman” affects the sat-isfaction of justice services by 7%.
Looking at the relationship between future expectations and the aforementioned variables, it is observed that as income and education levels increase, people’s ex-pectations for the future improve. Contrary to the satisfaction of the people living in the rural areas with the justice services, it has been observed that their expecta-tions are lower than the individuals living in the city, and living in the country-side has a 4% effect on their expectations. It is understood that women are more optimistic than men in terms of expectations.
Results
According to the findings obtained in this study, the socio-demographic and so-cio-economic characteristics and opinions of the individuals described as the de-mand component generally indicate the presence of a positive multiplier. In fact, the strongest social multiplier effect is the place of residence and gender, while the social multiplier is less than 10 due to the spill-over effect of education. These re-sults are in parallel with the work of Cutler and Glaser (2007) and Kroft (2006). Social interaction coefficients are obtained through the relative risk ratios of bi-nary probit regression analysis. These strong interactions determined in the study confirm the argument of Frank (1997: 1840-1844) that they are very strong in the social interactions created by personal elements in the consumption of goods and services that no one is excluded from their consumption.

PERSPECTIVES ON MODERN ECONOMY
Aizhan KHOICH, Ali Eren ALPER, Ahmet Arif EREN
447
References
Bickhchandani, S., Hirshleifer, D. & Welch, I. (1992). A Theory of Fads, Fash-ion, Custom, and Cultural Exchange as Information Cascades. Journal of Political Economy, 100 (5), 992-1026.
Burke, M. A. (2008). Social Multipliers. S. N. Durlauf & L. E. Blume (Eds.), The New Palgrave Dictionary of Economics (pp. 1-7). 2nd Edition, UK: Palgrave Macmillian.
Büyüköztürk, Ş. (1993). Kestirisel İstatistik. Ankara Üniversitesi Eğitim Bilim-leri Fakültesi Dergisi, 26(2), 409-428.
Cohn, G. (1895). The Science of Finance. (T. B. Veblen, Trans.). Chicago: Uni-versity of Chicago Press
Cutler, D.M., & Glaeser, E.L. (2007). Social Interactions and Smoking. Na-tional Bureau of Economic Research. Working Paper 13477, 1-26.
Duflo, E. & Saez, E. (2003). The Role of Information and Social Interactions in Retirement Plan Decision: Evidence from a Randomized Exper-iment. The Quarterly Journal of Economics, 118(3), 815-842.
Duflo, E., Glennerster, R. & Kremer, M. (2008). Using Randimization in Development Economics Resarch: A Toolkit. Paul Schultz, John Strauss Elsevier (Eds). Handbook of Develeopment Economics, 4(61). Amsterdam: North Holland Publication
Frank, R.H. (1997). The Frame of Reference as a Public Good. The Economic Journal, 107(4), 1832-1847
Glaeser, E., Sacerdote, B., & Scheinkman, J. (1996). Crime and Social Interac-tions. Quarterly Journal of Economics, CXI, 507-548.
Graham, B. & Hahn, J. (2005). Identification and estimation of the line-ar-in-means model of social interactions. Economics Letters, 88 (1), 1–6.
Graham, B. (2008). Identifying Social Interactions through Conditional Vari-ance Restrictions. Econometrics, 76 (3), 643-660.
Gümüş Özuyar, S.E., Başaran A.A. & Bağdadioğlu N. (2020). Adalet Hiz-metlerinde Beklenti Çıpası ve Beklenti Yanlışlaması Hipotezleri: Türkiye Örneği. Optimum Journal of Economics and Management Sciences, 7 (1), 297-314.

448
AN ANALYSIS OF SOCIAL INTERACTION AND SOCIAL MULTIPLIER: JUSTICE SERVICES IN TURKEY
Sevilay Ece GÜMÜŞ ÖZUYAR
Hausman, J.A. & McFadden, D.L. (1984). Specification tests fort he multino-mial logit model. Econometrica, 52(5), 1219-1240.
Holcombe, R. G. (1997). A Theory of the Theory of Public Goods. The Review of Austrian Economics, 10(1), 1-22.
Hoxby, C. & Weingarth, G. (2006). Taking race out of the equation: School reassignment and the structure of peer effects. Mimeo: Harvard Uni-versity Press.
Hsieh, F.Y., Block, D.A. & Larsen, M.D. (1998). A Simple Method of Sample Size Calculation for Linear and Logistic Regression. Statistics in Medicine, 17(14), 1623-1634.
Ichino, A.& Falk A. (2006). Clean evidence on peer effects. Journal of Labor Economics, 24 (1), 39–57.
Ioannides, Y. & Zabel, J.E. (2003). Neighborhood effects and housing demand. Journal of Applied Econometrics, 18 (5), 563–584.
Kroft, K. (2008). Takeup, social multipliers and optimal social insurance. Jour-nal of Public Economics, 92 (3-4), 722–737.
Levinson, A. (2009). Valuing Public Goods Using Happiness Data: The Case of Air Quality. (Working Paper No: 15156). The National Bureau of Economic Research, Cambridge.
Lora, E. (2016). Using Life Satisfaction Data to Identify Urban Problems, Pri-oritize Local Public Expenditures and Monitor the Quality of Ur-ban Life. M. Rojas (Ed.). Handbook of Happiness Research in Latin America (pp. 273-296). Meksika: Springer Publ.
Manski, C.F. (2000). Economic Analysis of Social Interactions. Journal of Eco-nomic Perspectives, 14(3), 115-136.
Mert, M. (2016). Spss, Stata, Yatay Kesit Veri Analizi Bilgisayar Uygulamaları. Ankara: Detay Yayıncılık
Mitchell, R.C., & Carson, T.R. (2005). Using Surveys to Value Public Goods: The Contingent Valuation Method. 4th Edition. Washington: Resources for the Future.
Musgrave, R.A. (1959). Provision of Social Goods. J. Margolis & H. Guitton (Eds.). Public Economics. NewYork: StMartin’s Press.

PERSPECTIVES ON MODERN ECONOMY
Aizhan KHOICH, Ali Eren ALPER, Ahmet Arif EREN
449
North, D.C. (1981). Institutions, Institutional Change and Economic Perfor-mance. Cambridge: Cambridge University Press.
Rosen, H. & Gayer, T. (2008). Public Finance. 8th Edition. New York: McGraw-Hill Companies.
Samuelson, P. (1954). The Pure Theory of Public Expenditure. The Review of Economics and Statistics, 36(4), 387-389.
Scheinkman, J. (2007). Social Interactions. NBER and Princeton Working Pa-per, 1-11. Retrieved from: https://www.princeton.edu/~joses/wp/socialinteractions.pdf
Topa, G. (2002). Social Interactions, Local Spillover and Unemployment. The Review of Economic Studies, 68(2), 261-295
Trogen, C.P. (2005). Public Goods Theory of Public Goods. Donijo Robbins (Ed.), Handbook of Public Sector Economics (pp.169-232), America: Public Administration and Public Policy/112.


SECTION VIECONOMICS OF ENERGY AND HEALTH


453
27TESTING THE POLLUTION HAVEN HYPOTHESIS FOR DEVELOPING COUNTRIES: ECOLOGICAL FOOTPRINT APPROACHAli Eren ALPER1, F. Özlem ALPER2
1. Introduction
Mankind’s relationship with the natural environment began with the existence of the first human and had been maintained in the form of natural balance through-out a long time. Following the natural balance that lasted for a long time, the de-velopment of economic activities along with the agriculture and industrial revo-lution has marched the relationship with the natural environment into different phases. The improvement of economic activities not only fostered the well-being of mankind but also caused the deterioration of its natural balanced relationship with the environment. As a result of the agricultural revolution, which was the first revolution that humanity went through, mankind became an active mem-ber of nature, rather than a passive bystander. The rise in agricultural production and the acceleration of mankind’s transition to settled life boosted urban life and, accordingly, urban economies began to develop. Due to the rise in demand trig-gered by economic development, improvements in production activities result in the processes that lead to natural environment degradation.
Along with the industrial revolution, which is humanity’s second great revolu-tion that laid the foundations of today’s socio-economic life, there has been a great transformation in the economic order. Based on such a transformation pro-cess, changes in the consumption structure required changes in the structure of
1 Assoc. Prof., Niğde Ömer Halisdemir University, Faculty of Economics and Administrative Sciences, e-mail: [email protected], ORCID ID: 0000-0003-0008-1202
2 Assoc. Prof., Niğde Ömer Halisdemir University, Faculty of Economics and Administrative Sciences, e-mail: [email protected], ORCID ID: 0000-0002-7829-8551

454
TESTING THE POLLUTION HAVEN HYPOTHESIS FOR DEVELOPING COUNTRIES: ECOLOGICAL FOOTPRINT APPROACH
Ali Eren ALPER, F. Özlem ALPER
production activities. Along with the changes in the production-consumption structure, there has been a significant increase in the amount of waste dumped into the natural environment. Accelerated natural resource usage, especially in the use of coal, has caused inevitable increases in environmental degradation.
Figure 1: Economic System – Environment Interaction
Source: Hussen, 2004, p.15
In Figure 1, it is seen that the economy is connected to the natural environment through three different channels. The natural environment constitutes the basis of the production and consumption process, which is among the main elements of the economic order, with the production factors and environmental opportu-nities it offers. It affects production through production factors and affects con-sumption directly with the environmental opportunities it offers. Also, wastes generated as a result of production and consumption processes are dumped into the natural environment in various ways (Hussen, 2004).
The liberalization of international trade and capital movements since the 1980s, when globalization movements began to gain momentum, have accelerated the integration of the world economies with each other. Following the First Indus-trial Revolution, two industrial revolutions between 1870 and 1990 and the Industry 4.0 revolution, which we have been in since 2011, have boosted the speed of integration of the world economies. This situation has become a crucial

PERSPECTIVES ON MODERN ECONOMY
Aizhan KHOICH, Ali Eren ALPER, Ahmet Arif EREN
455
opportunity for developing countries that experience capital constraints in their economic growth and development processes, and it has been adopted as the most influential solution regarding foreign direct investments (FDI) in these countries.
FDI contributes to the capital accumulation of host countries, increases the level of employment and national income, and improves the balance of foreign trade and payments. Besides, it promotes global competitiveness by transferring tech-nology, knowledge, and management skills to the host countries. The utilities gen-erated by FDI in the host countries have been examined many times by research-ers. FDI inflows have been detected to increase market access, provide technology transfer, and hence, trigger economic growth (Lee, 2013; Ssali et al., 2019). Due to the opportunities provided by the FDI, developing countries attach impor-tance to these investments and take some incentive measures to attract them to-ward their economies.
Besides the advantages that FDI provides to developing countries, it also brings along some disadvantages. This situation tends to vary according to the compo-sition of foreign investment. If the foreign investment involves pollution-inten-sive production facilities, such investment would reduce the environmental qual-ity in the host country.
Stringent environmental policies implemented in developed countries that adopt an environmentally-friendly development approach impose environmental costs on dirty industries and create certain obstacles for them. Despite this attitude of developed countries, most developing countries apply lenient environmental pol-icies and prioritize economic growth. At this point, countries with lower environ-mental costs are becoming attractive for dirty industries.
As a result of the concerns caused by climate change and global warming issues, it has been claimed that FDI has potential adverse impacts on environmental quality. The pollution haven hypothesis (PHH) claims that multinational com-panies engaging in heavy pollution activities tend to establish factories or shift their existing facilities to developing countries with poor environmental regula-tions. Thus, the increase in FDI entries to these countries would cause higher environmental pollution.
Aliyu (2005) discussed the environmental impacts stemming from the PHH in general terms and examined them in three dimensions. The first dimension refers

456
TESTING THE POLLUTION HAVEN HYPOTHESIS FOR DEVELOPING COUNTRIES: ECOLOGICAL FOOTPRINT APPROACH
Ali Eren ALPER, F. Özlem ALPER
to the relocation of dirty industries in developed countries to other countries that do not maintain environmental regulations or practices as stringent as developed countries. Accordingly, global trade encourages the transfer of dirty industries to countries with poor environmental regulations. The second one involves the pos-sibility that industrial wastes generated in developed countries would be collected in developing countries so that these countries turn into waste storage. The third and last dimension is about the uncontrolled processing of non-renewable nat-ural resources such as petroleum and forest products by multinational corpora-tions in countries with lenient environmental regulations.
Various empirical studies have found that the PHH is prevalent in different de-veloping countries (Pao and Tsai, 2011; Ren et.al., 2014; Shahbaz et.al., 2015; Görüş and Aslan, 2019; Assamoi et. al., 2020). On the other hand, some studies (Al-Mulali and Tang, 2013; Tang and Tan, 2015; Abdouli and Hamami, 2017) asserted contrary findings. According to these studies, FDI makes an affirmative contribution to the environmental quality of the host countries by encouraging the use of energy-efficient technologies and better environmental management practices. Thus, within the framework of the empirical literature, there is no clear consensus about the relationship between environmental pollution and FDI. There-fore, studies that would contribute to this domain are needed.
This study aims to examine the validity of the PHH in the group of developing countries consisting of Mexico, Indonesia, Nigeria, and Turkey (MINT). The main reason for selecting MINT countries as the analysis group is that these countries are classified as the new quadruple of the world economy and countries with very high economic development potential, as stated by the British econo-mist Jim O’Neill, who first introduced this country group.
The study would contribute to the literature in two aspects. The first one is the use of ecological footprint (EF) as an environmental pollution measure. Various studies in the related literature used carbon dioxide ( ) as pollution measure. Nevertheless, analyses based on a single criterion are inadequate to represent a wide variety of pollution sources (sulfur dioxide, suspended particulate matter, destruction of forest lands and fishing grounds, etc.) emerging in today’s produc-tion processes. Therefore, the policy implications about the obtained empirical results of the EF approach developed based on six subcomponents are more re-liable. Secondly, modern time-series techniques that take structural breaks into consideration are utilized instead of conventional time-series methods that do not take structural breaks into account.

PERSPECTIVES ON MODERN ECONOMY
Aizhan KHOICH, Ali Eren ALPER, Ahmet Arif EREN
457
Tabl
e 1:
Sele
cted
liter
atur
e rev
iew3
Auth
or(s
)C
ount
ryPe
riod
of S
tudy
Met
hodo
logy
Varia
bles
PHH
Val
idity
Pao
and
Tsai
(201
1)Br
azil,
Rus
sia, I
ndia
, Chi
na19
80-2
007
Pedr
oni C
oint
egra
tion
, EC
, FD
I, G
DP,
ü
Al-M
ulal
i and
Tan
g (2
013)
Gul
f Coo
pera
tion
Cou
ncil
1980
-200
9FM
OLS
, FD
I, EC
, GD
P X
Om
ri et
. al.
(201
4)54
cou
ntrie
s19
90-2
011
GM
M, F
DI,
GD
P, TO
, UR
, FD
, ER
, CS
ü
Zhu
et.
al. (
2016
)In
done
sia, M
alay
sia,
Phili
ppin
es, S
inga
pore
, Th
aila
nd
1981
-201
1Q
uant
ile R
egre
ssio
n, E
C, F
DI,
GD
P, , T
O, P
OP,
FD, I
S
X
Sark
odie
and
Stre
zov
(201
9)C
hina
, Ind
ia, I
ran,
In
done
sia, S
outh
Afri
ca19
82-2
016
Pane
l Qua
ntile
Reg
ress
ion
, FD
I, G
DP,
ECü
Bakı
taş a
nd Ç
etin
(201
7)M
exic
o, In
done
sia, S
outh
K
orea
, Tur
key,
Austr
alia
1982
-201
1Pa
nel V
AR, E
C, F
DI,
GD
P, ü
Koç
ak a
nd Ş
argü
neşi
(201
8)Tu
rkey
1974
-201
3M
aki C
oint
egra
tion
test
, EC
, FD
I, G
DP,
ü
Des
tek
and
Oku
muş
(2
019)
New
ly in
dustr
ializ
ed
coun
trie
s19
82-2
013
Pane
l dat
aEF
, GD
P, FD
I, , E
Cü
Balsa
lobr
e-Lo
rent
e et
. al.
(201
9)M
INT
1990
-201
3Pa
nel d
ata
EF, F
DI,
GD
P, , R
NW
, UR
ü
Kha
n et
. al.
(202
0)C
hina
, Ind
ia, P
akist
an19
70-2
016
Pane
l and
tim
e se
ries
GD
P, , F
DI,
EC, E
Fü
Mer
t and
Çağ
lar (
2020
)Tu
rkey
1974
-201
8H
idde
n C
oint
egra
tion
, FD
I X
Nad
eem
et.
al. (
2020
)Pa
kista
n19
71-2
014
ARD
L, F
DI,
GD
P, , U
R,
X
Sadi
k-Za
do a
nd F
erra
ri (2
020)
26 O
ECD
cou
ntrie
s19
95-2
011
Pool
ed M
ean
Gro
up
Estim
ator
, EPS
, TO
, GD
Pü
3 EC
, ene
rgy
cons
umpt
ion;
GD
P, g
ross
dom
estic
pro
duct
; TO
, tra
de o
penn
ess;
UR,
urb
aniz
atio
n; F
D, f
inan
cial
dev
elop
men
t; ER
, Exc
hang
e ra
te; C
S, c
apita
l st
ock;
PO
P, p
opul
atio
n; F
D, f
inan
cial
dev
elop
men
t; IS
, ind
ustr
ial s
truc
ture
; EF,
ecol
ogic
al fo
otpr
int;
RNW
, ren
ewab
le e
nerg
y; E
PS, e
nviro
nmen
tal p
olic
y st
ringe
ncy;
√, v
alid
ity o
f PH
H; X
, inv
alid
ity o
f PH
H.

458
TESTING THE POLLUTION HAVEN HYPOTHESIS FOR DEVELOPING COUNTRIES: ECOLOGICAL FOOTPRINT APPROACH
Ali Eren ALPER, F. Özlem ALPER
2. Literature Review
Most empirical studies on the relationship between FDI and environmental pol-lution aim to test the PHH. According to the PHH, multinational corporations operating in sectors with heavy pollution tend to establish or relocate their ac-tivities in developing countries with lenient environmental regulations. There-fore, PHH argues that FDI entries contribute to pollution in developing coun-tries. On the contrary, the pollution halo hypothesis suggests that FDI entries may lead to emission reduction by promoting the use of energy-efficient tech-nologies and better environmental management practices (Grossman and Krue-ger, 1991; Keller, 2004; Keho, 2016).
According to Grossman and Krueger (1991), FDI may affect environmental qual-ity in the host country through changes in the scale of the economy, changes in production techniques and changes in the industrial structure. The first of these impacts, the scale effect, indicates that higher FDI inputs would support more production, and therefore more energy production, leading to increased emissions (Cole and Elliott, 2003). The technical effect states that FDI would increase envi-ronmental quality by allowing the use of advanced and clean technologies (Liang, 2008). Lastly, the composition effect indicates that FDI may have either a posi-tive or negative impact on the environment as FDI entries increase, depending on whether or not the economy shifting towards polluting sectors (Pazienza, 2019).
Empirical evidence for the PHH reveals contradictory results at both the sin-gle-country and multi-country levels. Some studies uphold the PHH, whereas others determined that the PHH does not hold. In Table 1, the studies conducted on the PHH over the past decade are presented.
3. Methodology
3.1. The Fourier Unit Root Test
The fact that the series contains unit roots causes random shocks to have perma-nent impacts on long-term coefficients. Therefore, it is essential to determine the order of integration of the series prior to conducting the regression analysis. For determining the degree of integration of the variables in this study, The Fourier KPSS (FKPSS) test developed by Becker et al. (2006) is performed. The FKPSS test can detect not only sharp structural changes but also smooth changes, and

PERSPECTIVES ON MODERN ECONOMY
Aizhan KHOICH, Ali Eren ALPER, Ahmet Arif EREN
459
the date, number, and form of structural changes do not influence the reliabil-ity of the test. Becker et al. (2006) has taken the data-generating process into ac-count which is specified in Equations 1 and 2.
(1)
(2)
Here, denotes the stationary error term, whereas denotes the independent identically distributed error terms with variance . in-dicates the vector containing trigonometric terms, in which denotes the trend term, denotes the number of observations, and denotes the frequency value.
In order to calculate the test statistics required to test the stationarity null hypoth-esis ( , either one of Equation 3 and 4 is estimated at the first phase and the residuals are obtained.
(3)
(4)
While the null hypothesis of level-stationarity is tested with Equation 3, the null hypothesis of trend-stationarity is tested with Equation 4. Test statistics are cal-culated with the help of Equation 5.
(5)
To determine the optimal frequency value, the value yielding the minimum re-sidual sum of squares (RSS) is chosen. If the data generation process does not involve nonlinear trends, the standard KPSS stationarity test is stronger than the FKPSS stationarity test. Therefore, Becker et al. (2006) proposed to test the null hypothesis ( suggesting the absence of nonlinear trend with the F-test statistic specified in Equation 6.
(6)
(k) denotes the minimum residual sum of squares obtained from either Equa-tion 3 or Equation 4; denotes the minimum residual sum of squares of the regression for which the null hypothesis is valid, and q denotes the number of

460
TESTING THE POLLUTION HAVEN HYPOTHESIS FOR DEVELOPING COUNTRIES: ECOLOGICAL FOOTPRINT APPROACH
Ali Eren ALPER, F. Özlem ALPER
independent variables. The critical values, which are required for F-statistics, take place in Becker et al. (2006).
3.2. Fourier-Shin Cointegration Test
Since Granger (1981) and Engle and Granger (1987), great importance has been given to cointegration tests in order to determine the long-term relationship among variables in the empirical literature. Despite the popularity of cointegra-tion analysis, many methods test the existence of a cointegration relationship in the alternative hypothesis versus the null hypothesis suggesting the absence of a cointegration relationship. Nonetheless, Shin (1994), and Phillips and Ouliaris (1990) claimed that testing the presence of cointegration relationship in the null hypothesis would be conceptually more appropriate. Besides, since cointegration tests determine the long-term relationships among the variables, it would be more appropriate to use datasets that include a wider time interval, but the longer the time interval of the analyzed dataset, the more likely the relationships would un-dergo structural changes. As also stated in Bartley et al. (2001), if an existing break in the deterministic trend is not taken into consideration, the cointegration test would tend to reject the null hypothesis suggesting the existence of a long-term relationship. In order to cope with such a problem, probable breaks are tried to be determined by including a dummy variable to the regression analysis. Car-rion-i-Silvestre and Sanso (2006) followed a similar methodology, allowing for a single break in both deterministic terms and cointegration vectors. Nonethe-less, the performance of the test statistics depends merely on the assumption of a sharp break and the accuracy of the estimated breakpoint. This is a crucial issue since, in fact, macroeconomic variables can exhibit a wide variety of structural breaks in unknown quantity and shape. Since the assumption of an existing sharp break is a subjective and a specific approach to the investigated case, it may lead to a major modeling error as much as neglecting the breaks (Tsong et al., 2016).
The cointegration test, which was introduced to the literature by Tsong et al. (2016) with the Fourier function, investigates the existence of a cointegration relationship in the null hypothesis unlike many cointegration tests [Gregory & Hansen, 1996; Hatemi-J, 2008; Johansen et al., 2000] in the literature. In this respect, the Fourier cointegration test derives reliable results despite the form and number of structural changes (Yılancı, 2017).

PERSPECTIVES ON MODERN ECONOMY
Aizhan KHOICH, Ali Eren ALPER, Ahmet Arif EREN
461
Tsong et al. (2016) developed the Fourier Shin (FSHIN) cointegration test, which derives reliable results despite the breaks whose structure, number, and period are unknown, by including the Fourier trigonometric functions to the test developed by Shin (1994) based on KPSS unit root analysis and that examines the cointe-grated relationship between series in the null hypothesis.
In the FSHIN cointegration test, cointegration regression in Equation 7 is taken into consideration.
(7)
In Equation 7, .
Also, denotes the zero-mean, independent, identically distributed error terms with variance , whereas denotes a random walk process with zero means. in Equation 7 can be defined as if there is a constant term in the model, and if both the constant term and trend value are in-cluded. Here, refers to the Fourier function.
(8)
In Equation 8, k denotes the Fourier frequency value, sin and cos are nonlinear terms, and t and T are the trend value and the number of observations, respec-tively. In the analysis, the null hypothesis is expressed as (existence of cointegration relationship), whereas the alternative hypothesis as (ab-sence of cointegration relationship).
Equations 7 and 8 are revised under the null hypothesis as in Equation 9, and a model is established in which the cointegration relationship is analyzed.
(9)
The term n in Equation 9 denotes the optimal frequency value. The FSHIN test statistics are calculated with the help of Equation 10.
(10)
The term in Equation 10 denotes the partial sum of least squares error terms from Equation 9, whereas the term is the consistent estimator of the long-run variance of the term .

462
TESTING THE POLLUTION HAVEN HYPOTHESIS FOR DEVELOPING COUNTRIES: ECOLOGICAL FOOTPRINT APPROACH
Ali Eren ALPER, F. Özlem ALPER
4. Model and Empirical Results
The model shown in Equation 11 is utilized in the study.
(11)
Information of the variables used in the analysis is presented in Table 2.
Table 2: Dataset
Data Data Period Data Source Abbreviation
Ecological Footprint 1970-2016 Global Footprint Network EF
Foreign Direct Investment 1970-2016 World Bank FDI
GDP per Capita 1970-2016 World Bank GDP
Urbanization (% of Total Population)
1970-2016 World Bank URB
Table 3 presents the FKPSS unit root test results. According to the results of the stationarity test, it is determined that all the variables included in the analysis are not stationary at a 5% significance level. Table 4 presents the stationarity test re-sults at the first differences of the variables. It is seen that all series included in the analysis become stationary at their first differences. F-tests are also performed for the series with the first differences and it is determined that trigonometric terms are significant. Accordingly, it is determined that all variables are station-ary at their first differences [I (1)].

PERSPECTIVES ON MODERN ECONOMY
Aizhan KHOICH, Ali Eren ALPER, Ahmet Arif EREN
463
Table 3: FKPPS Unit Root Test Results (At Level)
Country Series Frequency MinKKT FKPSS F-statistic
Mex
ico
LNEF 1 1.348 0.249 (4) 27.149
LNFDI 1 3.871 0.254 (4) 32.547
LNGDP 2 14.247 0.579 (7) 17.631
LNURB 1 72.597 0.631 (8) 27.893
Indo
nesia
LNEF 1 3.124 0.497 (4) 31.547
LNFDI 1 2.217 0.525 (6) 81.015
LNGDP 1 1.963 0.723 (9) 19.469
LNURB 1 3.079 0.257 (3) 34.579
Nig
eria
LNEF 1 7.257 0.573 (9) 47.501
LNFDI 1 6.214 0.874 (2) 22.497
LNGDP 2 9.031 0.445 (3) 38.214
LNURB 1 5.564 0.381 (4) 36.207
Turk
ey
LNEF 1 19.279 0.314 (8) 54.631
LNFDI 1 4.364 0.749 (7) 17.235
LNGDP 1 21.479 2.647 (5) 11.459
LNURB 1 17.214 1.149 (4) 27.367
Note: The values in parentheses indicate the bandwidth obtained by the Newey-West method. The critical values for the FKPSS test are determined as 0.1720, 0.4152, 0.4480, 0.4592, and 0.4626 at a 5% significance level, and the frequency values of 1, 2, 3, 4, and 5, respectively. The critical value for the F-test, which is performed to determine the significance of trigonometric terms, is 4.929 at a 5% significance level.

464
TESTING THE POLLUTION HAVEN HYPOTHESIS FOR DEVELOPING COUNTRIES: ECOLOGICAL FOOTPRINT APPROACH
Ali Eren ALPER, F. Özlem ALPER
Table 4: FKPPS Unit Root Test Results (1st difference)
Country Series Frequency MinKKT FKPSS F-statistic
Mex
ico
LNEF 2 34.116 0.257 (2) 8.397
LNFDI 2 22.314 0.149 (4) 14.214
LNGDP 2 5.146 0.342 (13) 7.146
LNURB 1 6.192 0.046 (4) 12.679
Indo
nesia
LNEF 1 44.171 0.009 (8) 8.214
LNFDI 1 12.139 0.124 (2) 12.547
LNGDP 2 784.779 0.294 (3) 38.214
LNURB 1 879.013 0.017 (3) 17.214
Nig
eria
LNEF 2 29.047 0.249 (8) 15.223
LNFDI 5 57.157 0.307 (3) 36.214
LNGDP 2 97.022 0.208 (6) 8.214
LNURB 2 96.364 0.309 (4) 63.219
Turk
ey
LNEF 5 78.287 0.297 (3) 36.054
LNFDI 5 46.394 0.313 (19) 44.127
LNGDP 4 91.214 0.201 (36) 14.119
LNURB 2 47.017 0.381 (4) 55.249
Table 5 presents the Fourier-Shin cointegration test results for the countries in-cluded in the analysis. Empirical results indicate that there is a long-term rela-tionship among the variables in all countries except for Singapore. Moreover, the F-test results reveal that the trigonometric terms are significant in all countries with cointegrated relationships.
Table 5: Cointegratipon Test Results
Country Frequency MinKKT Fourier-Shin Cointegration Test Statistic
Shin Cointegration Test Statistic
F-statistic
Mexico 2 2147.5 0.031 0.106 6.579
Indonesia 1 3297.6 0.017 0.099 5.024
Nigeria 1 5478.2 0.054 0.082 7.741
Turkey 2 2861.5 0.078 0.077 6.259
Note: The critical values for the Fourier cointegration test are 0.061, 0.097, and 0.111 at a 5% significance level for the frequency values 1, 2, and 3, respectively. The critical values for the Shin cointegration test are 0.094, 0.121, and 0.208 for 10%, 5%, and 1% significance levels, respectively. At a 5% significance level, the F-statistic value is 4.066.

PERSPECTIVES ON MODERN ECONOMY
Aizhan KHOICH, Ali Eren ALPER, Ahmet Arif EREN
465
Table 6: Long-term Coefficient Estimations
Country LNFDI LNGDP LNURB Causality Test Results
Mexico 0.092 (5.851) 0.343 (2.741) -0.263 (8.665) LNFDI→lnEF
Indonesia 0.025 (7.486) 0.760 (-8.065) 2.474 (18.529) LNFDI↔LNEF
Nigeria 0.252(3.476) 0.041 (5.401) 1.012 (15.214) LNFDI→LNEF
Turkey 0.026 (5.417) 0.014 (7.409) -0.145 (4.247) LNFDI→LNEF
Note: The numbers in parentheses indicate the t-statistic values. → denotes unilateral causality, whereas ↔ denotes bilateral causality.
Table 6 presents the long-term coefficients estimated according to the Dynamic Ordinary Least Squares (DOLS) method. According to the coefficient results ob-tained by the DOLS method, there is a statistically significant and positive rela-tionship between FDI and EF in all countries included in the analysis. In other words, an increase in FDI in all countries also increases EF. Therefore, it is deter-mined that the PHH holds for all countries. Similarly, as the national income per capita increases, the ecological footprint also increases. As the share of the urban population in the total population increases, the ecological footprint decreases in Mexico and Turkey, whereas increases in Indonesia and Nigeria.
5. Conclusion
In this study, the impact of FDI on the environment is tried to be examined within the framework of the pollution haven hypothesis (PHH). In the study utilizing the annual data obtained from the group of developing countries consisting of Mexico, Indonesia, Nigeria, and Turkey over the period 1970-2016, more inclu-sive environmental pollution criteria, namely, ecological footprint (EF) is used as a dependent variable instead of variable which has been used in many studies in the literature. In the analysis, the stationarities of the variables are tested first with the FKPSS unit root test that allows structural breaks, and it is determined that the variables are not stationary at 5% significance level, and they all become stationary upon taking the first differences.
As a result of the FSHIN cointegration test performed with the variables which are determined to be I(1), it is found that the pollution haven hypothesis (PHH) is valid in all countries included in the analysis. Foreign direct investment in these countries deteriorates environmental quality. Foreign direct investments

466
TESTING THE POLLUTION HAVEN HYPOTHESIS FOR DEVELOPING COUNTRIES: ECOLOGICAL FOOTPRINT APPROACH
Ali Eren ALPER, F. Özlem ALPER
having detrimental effects on environmental quality indicate that these invest-ments come from sectors with high pollution intensity instead of environmen-tally-friendly technologies.
Therefore, it is necessary to make regulations to minimize the environmental im-pacts of economic activities with high pollution intensity for fostering the envi-ronmental quality in the countries included in the analysis as well as maintain-ing the strict control of the regulations. Moreover, units that do not adapt to environmentally-friendly production activities due to capital constraints should be provided with incentives and green technology investments should be subsi-dized. Since it is determined that the increase in per capita income also disrupts environmental quality, the use of products with high energy efficiency in both liv-ing spaces and production units should be supported in these countries. Conse-quently, practices such as meetings, symposiums, or conferences should be made to explain the importance of environmental awareness and environmental sensi-tivity in the general society.
REFERENCES
Abdouli, M., & Hammami, S. (2017). Investigating the causality links between environmental quality, foreign direct investment and economic growth in MENA countries. International Business Review, 26(2), 264-278.
Aliyu, M. A. (2005). Foreign direct investment and the environment: Pollution haven hypothesis revisted. In Eight Annual Conference on Global Economic Analysis,
Lübeck, Germany (1-35).
Al-Mulali, U., & Tang, C. F. (2013). Investigating the validity of pollution haven hypothesis in the gulf cooperation council (GCC) countries. Energy Policy, 60, 813-819.
Assamoi, G. R., Wang, S., Liu, Y., & Gnangoin, Y. T. B. (2020). Investigat-ing the pollution haven hypothesis in Cote d’Ivoire: evidence from autoregressive distributed lag (ARDL) approach with structural breaks. Environmental Science and Pollution Research, 1-14.

PERSPECTIVES ON MODERN ECONOMY
Aizhan KHOICH, Ali Eren ALPER, Ahmet Arif EREN
467
Bakirtas, I., & Cetin, M. A. (2017). Revisiting the environmental Kuznets curve and pollution haven hypotheses: MIKTA sample. Environ-mental Science and Pollution Research, 24(22), 18273-18283.
Balsalobre-Lorente, D., Gokmenoglu, K. K., Taspinar, N., & Cantos-Cantos, J. M. (2019). An approach to the pollution haven and pollution halo hypotheses in MINT countries. Environmental Science and Pollu-tion Research, 26(22), 23010-23026.
Bartley, W. A., Lee, J., & Strazicich, M. C. (2001). Testing the null of coin-tegration in the presence of a structural break. Economics Letters, 73(3), 315-323.
Becker, R., Enders, W., & Lee, J. (2006). A stationarity test in the presence of an unknown number of smooth breaks. Journal of Time Series Analysis, 27(3), 381-409.
Carrion-i-Silvestre, J. L., & Sansó, A. (2006). Testing the null of cointegration with structural breaks. Oxford Bulletin of Economics and Statistics, 68(5), 623-646.
Cole, M. A., & Elliott, R. J. (2003). Determining the trade–environment composition effect: the role of capital, labor and environmental regulations. Journal of Environmental Economics and Management, 46(3), 363-383.
Destek, M. A., & Okumus, I. (2019). Does pollution haven hypothesis hold in newly industrialized countries? Evidence from ecological footprint. Environmental Science and Pollution Research, 26(23), 23689-23695.
Engle, R. F., & Granger, C. W. (1987). Co-integration and error correction: representation, estimation, and testing. Econometrica: journal of the Econometric Society, 251-276.
Gorus, M. S., & Aslan, M. (2019). Impacts of economic indicators on environ-mental degradation: evidence from MENA countries. Renewable and Sustainable Energy Reviews, 103, 259-268.
Granger, C. W. (1981). Some properties of time series data and their use in econometric model specification. Journal of econometrics, 16(1), 121-130.

468
TESTING THE POLLUTION HAVEN HYPOTHESIS FOR DEVELOPING COUNTRIES: ECOLOGICAL FOOTPRINT APPROACH
Ali Eren ALPER, F. Özlem ALPER
Gregory, A. W., & Hansen, B. E. (1996). Residual-based tests for cointegration in models with regime shifts. Journal of Econometrics, 70(1), 99-126.
Grossman, G. M., & Krueger, A. B. (1991). Environmental impacts of a North American free trade agreement (No. w3914). National Bureau of economic research.
Hatemi-j, A. (2008). Tests for cointegration with two unknown regime shifts with an application to financial market integration. Empirical Eco-nomics, 35(3), 497-505.
Hussen, A. M. (2004). Principles of environmental economics. Psychology Press.
Johansen, S., Mosconi, R., & Nielsen, B. (2000). Cointegration analysis in the presence of structural breaks in the deterministic trend. The Econo-metrics Journal, 3(2), 216-249.
Khan, A., Chenggang, Y., Xue Yi, W., Hussain, J., Sicen, L., & Bano, S. (2020). Examining the pollution haven, and environmental kuznets hy-pothesis for ecological footprints: an econometric analysis of Chi-na, India, and Pakistan. Journal of the Asia Pacific Economy, 1-21.
Keho, Y. (2016). Do foreign direct investment and trade lead to lower energy intensity? Evidence from selected African countries. International Journal of Energy Economics and Policy, 6(1).
Keller, W. (2004). International technology diffusion. Journal of economic liter-ature, 42(3), 752-782.
Koçak, E., & Şarkgüneşi, A. (2018). The impact of foreign direct investment on CO 2 emissions in Turkey: new evidence from cointegration and bootstrap causality analysis. Environmental Science and Pollution Research, 25(1), 790-804.
Lee, J. W. (2013). The contribution of foreign direct investment to clean ener-gy use, carbon emissions and economic growth. Energy Policy, 55, 483-489.
Mert, M., & Caglar, A. E. (2020). Testing pollution haven and pollution halo hypotheses for Turkey: a new perspective. Environmental Science and Pollution Research, 1-11.
Nadeem, A. M., Ali, T., Khan, M. T., & Guo, Z. (2020). Relationship between inward FDI and environmental degradation for Pakistan: an ex-

PERSPECTIVES ON MODERN ECONOMY
Aizhan KHOICH, Ali Eren ALPER, Ahmet Arif EREN
469
ploration of pollution haven hypothesis through ARDL approach. Environmental Science and Pollution Research, 1-19.
Omri, A., Nguyen, D. K., & Rault, C. (2014). Causal interactions between CO2 emissions, FDI, and economic growth: Evidence from dy-namic simultaneous-equation models. Economic Modelling, 42, 382-389.
Pao, H. T., & Tsai, C. M. (2011). Multivariate Granger causality between CO2 emissions, energy consumption, FDI (foreign direct invest-ment) and GDP (gross domestic product): evidence from a panel of BRIC (Brazil, Russian Federation, India, and China) countries. Energy, 36(1), 685-693.
Pazienza, P. (2019). The impact of FDI in the OECD manufacturing sector on CO2 emission: Evidence and policy issues. Environmental Impact Assessment Review, 77, 60-68.
Phillips, P. C., & Ouliaris, S. (1990). Asymptotic properties of residual based tests for cointegration. Econometrica: Journal of the Econometric So-ciety, 165-193.
Ren, S., Yuan, B., Ma, X., & Chen, X. (2014). International trade, FDI (foreign direct investment) and embodied CO2 emissions: A case study of Chinas industrial sectors. China Economic Review, 28, 123-134.
Sadik-Zada, E. R., & Ferrari, M. (2020). Environmental Policy Stringency, Technical Progress and Pollution Haven Hypothesis. Sustainability, 12(9), 3880.
Sarkodie, S. A., & Strezov, V. (2019). Effect of foreign direct investments, eco-nomic development and energy consumption on greenhouse gas emissions in developing countries. Science of the Total Environment, 646, 862-871.
Shahbaz, M., Nasreen, S., Abbas, F., & Anis, O. (2015). Does foreign direct investment impede environmental quality in high-, middle-, and low-income countries?. Energy Economics, 51, 275-287.
Shin, Y. (1994). A residual-based test of the null of cointegration against the alternative of no cointegration. Econometric theory, 10(1), 91-115.
Ssali, M. W., Du, J., Mensah, I. A., & Hongo, D. O. (2019). Investigating the nexus among environmental pollution, economic growth, en-

470
TESTING THE POLLUTION HAVEN HYPOTHESIS FOR DEVELOPING COUNTRIES: ECOLOGICAL FOOTPRINT APPROACH
Ali Eren ALPER, F. Özlem ALPER
ergy use, and foreign direct investment in 6 selected sub-Saharan African countries. Environmental Science and Pollution Research, 26(11), 11245-11260.
Tang, C. F., & Tan, B. W. (2015). The impact of energy consumption, income and foreign direct investment on carbon dioxide emissions in Viet-nam. Energy, 79, 447-454.
Tsong, C. C., Lee, C. F., Tsai, L. J., & Hu, T. C. (2016). The Fourier approxi-mation and testing for the null of cointegration. Empirical Econom-ics, 51(3), 1085-1113.
Yilanci, V. (2017). Petrol fiyatları ile ekonomik büyüme arasındaki ilişkinin in-celenmesi: Fourier yaklaşımı. Ekonometri ve Istatistik Dergisi, (27), 51-57.
Zhu, H., Duan, L., Guo, Y., & Yu, K. (2016). The effects of FDI, econom-ic growth and energy consumption on carbon emissions in ASE-AN-5: evidence from panel quantile regression. Economic Model-ling, 58, 237-248.

471
28ENERGY CONSUMPTION, CO2 EMISSIONS, AND GDP IN TURKEYNilüfer KAYA KANLI1
1. Introduction And Background
Today, one of the greatest threats to all the living things on earth is climate change (WEF, 2016). In fact, the earth has experienced climate change and has gone through warm and cool phases in the past. However, records indicate that today’s global warming is much faster than ever before. In the past, climate change was a result of natural factors such as volcanic activities, natural concentration of green-house gases, sunlight intensity, etc. These natural factors are still in play, but, af-ter around the 1950s, human activities significantly increased the concentration of the greenhouse gasses and accelerated the climatic warming (NASA, 2010).
The major cause of this over- concentration of greenhouse gasses is the mass con-sumption of fossil fuels. During the post-World War II period, the overall GDP per capita in the world started to increase significantly (Figure 2). The economic boom after the 1950s stimulated the energy demand, most of which has been met by coal, oil, and natural gas (Figure 1). Since energy consumption is the driver of economic growth and at the same time an important cause of pollution, find-ing better ways of growing economies without damaging the environment is an important research topic. This study aims at explaining the possibility of reduc-ing CO2 emissions without sacrificing the economic development of Turkey.
In addition to fossil fuel consumption, the human-related factors that accelerate climate change are deforestation, fertilizer use, livestock production, and some industrial gases. Activities that change the earth’s surface like road construction and agriculture can also cause climate change because they change the sunlight reflectivity of the earth’s surface.
1 Dr., Independent Researcher, Email: [email protected]

472
ENERGY CONSUMPTION, CO2 EMISSIONS, AND GDP IN TURKEY
Nilüfer KAYA KANLI
Figure 1: Global Primary Energy Consumption
Source: Our World in Data
Figure 2: GDP Per Capita, 1870 to 2016
Source: Our World in Data
Since climate change is transforming the ecosystems, it has an impact on everything such as the water we drink, the air we breathe, the places we live, the diseases we face, etc. Saving the lives and livelihoods, especially for future generations, requires urgent decisions and actions to address climate change. United Nation’s 13th Sustainable Development Goal focuses on the “Climate Action” and it involves taking urgent actions to combat climate change and its impacts. World Economic Forum also claims that the failure to adapt the cli-mate change would be “the most impactful risk” for every country in the com-ing decades (WEF, 2016).
International cooperation and collective approach is crucial for addressing climate change and competing with its impacts. In 1992, the adaption of the United Na-tions Framework Convention on Climate Change (UNFCCC) was the first step of international cooperation to stabilize greenhouse gas emissions. In 1997, the Kyoto Protocol, the first legally-binding agreement -with targets to limit the green-house gas emissions- was created. After 7 years, in February 2005 Kyoto protocol went into effect. Kyoto protocol was a reference point in history since it showed that nations of the world can act together to solve a global problem. The first commitment period of the protocol was between 2008 and 2012. Although, the second phase, the Doha Amendment, was planned for 2013 and 2020, this phase couldn’t reach enough number of participants to enter into force. To maintain international cooperation, the Paris Agreement was adopted and it entered into force in October 2016. As of 2020, 197 countries have signed the Paris Agree-ment and 190 of them have ratified it.
Turkey signed the Paris Agreement in April 2016, but she is one of the countries that has not ratified the agreement yet. The agreement classifies the countries as

PERSPECTIVES ON MODERN ECONOMY
Aizhan KHOICH, Ali Eren ALPER, Ahmet Arif EREN
473
“developed” and “developing”, where developed countries financially support the developing countries. Turkey is classified as a developed country and the Turkish government objects to being categorized as a developed country where China, Singapore, South Korea, India, Qatar, Saudi Arabia, Brazil, Argentina and Gulf states are categorized as developing countries.
Turkey and Iran are the only two significant emitters which are not ratified the agreement yet. According to the latest statistics, Turkey’s total greenhouse gas emis-sions reached 520,902 kt, which is 5.5 times its value in 1970 and around 1% of worldwide emissions. Per capita emissions are also increasing. It reached 6.33 mt, which is the 2.34 times of its 1970 value (TURKSTAT and EDGAR, 2019). Since the beginning of the 1990’s, when the first international climate coopera-tion started, the rate of increase in Turkey’s per capita emissions is 50% (Figure 3).
Figure 3: Greenhouse Gas Emissions in Turkey (CO2 equivalent)
Data Source: TURKSTAT
Turkey’s active participation in the Paris Agreement is essential for sustaining international cooperation and balancing the greenhouse gas emissions. In ad-dition to this, as an EU candidate, Turkey needs an environmental policy in line with the EU requirements. On the other hand, ratification of the Paris Agreement and limiting the greenhouse gas emissions would have some eco-nomic consequences for Turkey. The statistics show that the rate of increase in greenhouse gas emissions accelerates during the high-growth periods (2002-2008) and slows down during the economic crisis and recessions (2008-2010). In other words, meeting the environmental requirements may necessitate less growth rates. Then, like every developing country, Turkey is facing a dilemma: limiting the emissions versus enhancing the welfare. The question is “Would

474
ENERGY CONSUMPTION, CO2 EMISSIONS, AND GDP IN TURKEY
Nilüfer KAYA KANLI
it be possible to meet the environmental requirements without sacrificing the economic development?” The first step to answer this question is the identifi-cation of the source of emissions is.
Figure 4: Greenhouse gas emissions by sectors in Turkey, 2018
Data Source: TURKSTAT
Figure 5: CO2, CH4, N2O Emissions and F-gases in Turkey, 2018
Data Source: TURKSTAT
According to Figure 4, the main source of the emissions is the energy sector. In Turkey, 71.62% of the emissions are produced by the energy sector. Industrial processes (12.52 %), agriculture (12.45%) and waste (3.41%) sectors are the other sources of the emissions. To understand the relationship between economic growth and emissions we also need to understand the link between energy, economic growth and emissions. Explaining the causal links between these variables would provide a basis for designing an effective policy to limit greenhouse gas emissions.
Figure 5 shows that, 80.47% of the greenhouse gas emissions in Turkey is the CO2
emissions. Shares of the CH4, N2O and F-gases are 11.05%, 7.47% and 1.01% respectively. Since the share of CO2 emissions is very high, this study analyzes the causal relationship between energy consumption, CO2 emissions and GDP per capita in Turkey. This study aims at contributing to the development of efficient energy and environmental policies for Turkey. The interactions between three var-iables are analyzed by implementing a VAR model and Granger causality tests. The next section of this chapter gives a brief summary of the related literature. The third section explains the data and methodology. The fourth section reports the results of the analysis and the final section concludes.

PERSPECTIVES ON MODERN ECONOMY
Aizhan KHOICH, Ali Eren ALPER, Ahmet Arif EREN
475
2. Literature Review
Economic growth has been the main concern of development until the value of the environment has been recognized a few decades ago. Since then, growing the economies without causing environmental degradation is one of the biggest challenges of the communities. Today both the policymakers and researchers are aware of the importance of achieving sustainable development. In line with this awareness, the concern of the development literature has been shifting from ‘eco-nomic growth’ to ‘environment-friendly growth’ or ‘green growth’.
In this context, the relationship between economic growth and environmental quality has been a subject of research for a long time. There exist two main lines of research around this topic. First one is the Environmental Kuznets Curve (EKC) hypothesis. Grossman&Krueger (1991) and Shafik&Bandyopadhyay (1992) rec-ognized an inverted-U shaped the relationship between GDP per-capita and en-vironmental indicators. This relation is explained by the EKC hypothesis and it is primarily based on data observation. According to EKC hypothesis, environ-mental quality is worsened by economic growth at the early stages of economic development; but over a certain GDP per capita level, as economy grows envi-ronmental indicators start to recover. There are many empirical studies that test the validity of the EKC hypothesis with different environmental indicators. Al-though the literature on EKC hypothesis has grown a lot, there is contradicting results about the validity of this hypothesis. The opponents of this hypothesis also have strong arguments. Dinda (2004), Shahbaz&Sinha (2019), Nahman&Antro-bus (2015), Uchiyama (2016), Dogan&Seker (2016) and Isik et al (2019) are some examples of the studies that review the literature of the EKC hypothesis.
The other line of research is the investigation of the causal relationship between economic performance, environmental indicators and energy consumption. En-ergy consumption is a determining factor in the relationship between economic growth and greenhouse gas emissions. Then, without including the energy con-sumption in the analysis, it wouldn’t be possible to reach a relevant basis for the policy development. In the energy economics literature, the causal relation be-tween energy consumption, economic growth and environmental pollution has taken interest of many researchers. Ang (2008), Omri (2013), Soytas et al. (2007), Soytas&Sari(2009), Soytas&Sari(2003), Sharif et al. (2020) and Karasoy (2019) are some examples of these studies. Tiba&Omri (2016) gives a summary of the literature on the interaction between environmental quality, energy consumption

476
ENERGY CONSUMPTION, CO2 EMISSIONS, AND GDP IN TURKEY
Nilüfer KAYA KANLI
and economic growth. Although the empirical literature on this subject is abun-dant, the results are conflicting for both the existence of the relations and the directions of them. Different methodologies, datasets and time periods of the studies may be a cause of the variation of the outcomes. On top of it, lack of a solid theoretical background for the empirical studies is also an important factor.
3. Data And Methodology
This study analyzes the causal relationship between the primary energy consump-tion per capita (pecpc), CO2 emissions per capita (co2pc) and GDP per capia (gdppc) in Turkey. The analysis covers the 55 years period between 1965 and 2019. GDP per capita values are in constant 2010 US$ and source of the data is World Development Indicators. BP Statistical Review of World Energy is pre-ferred as the data source of the primary energy consumption and CO2 emissions since a longer and a more up to date time series are available in the database. Per capita values of these two indicators are calculated by the author and the units of pecpc and co2pc are gigajoules (gj.) and metric tons (mt.) respectively. Table 1 gives the summary statistics of the three indicators. First line of the Figure 6 shows the line graphs of each indicator.
Table 1: Summary Statistics
Variable # of Obs. Mean Std. Dev. Min. Max.
gdppc 55 7,728.09 3,258.06 3,556.87 15,068.98
pecpc 55 40.53 19.86 10.58 78.56
co2pc 55 2.64 1.15 0.81 4.90
Vector autoregression (VAR) model and Granger causality tests are used in the causality analysis. Before determining the model, stationarity of the series needs to be examined. Because, VAR model and Granger causality tests may be sensi-tive to the stationarity. According to the Augmented Dickey Fuller (ADF) unit root tests, all three series are integrated of order one, I(1), and they are station-ary at their first differences. Figure 6 shows the line graphs of the series at level and their first differences. It is clear that first-differenced series are all stationary.

PERSPECTIVES ON MODERN ECONOMY
Aizhan KHOICH, Ali Eren ALPER, Ahmet Arif EREN
477
Figure 6: Series in level and first-difference, 1965-2019
GDP Per Capita PEC Per Capita CO2 Per Capita
Leve
l
050
0010
000
1500
0G
DP
PC
1960 1980 2000 2020year
020
4060
80P
EC
PC
1960 1980 2000 2020year
12
34
5C
O2P
C
1960 1980 2000 2020year
Firs
t Diff
eren
ce
-500
050
010
00G
DP
PC
, D
1960 1980 2000 2020year
-50
5P
EC
PC
, D
1960 1980 2000 2020year
-.4-.2
0.2
.4C
O2P
C, D
1960 1980 2000 2020year
Since the series are integrated of the same order, we can test for cointegration be-tween series. According to the Johansen cointegration test, there is a cointegrat-ing relation between the series. This result rules out the Granger non-causality but does not give and information about the integrating variables or the direc-tion of the relations. Then, the following VAR model is used to analyze the de-tails of the causal relation. In this model, k is the optimal lag-length; are the intercepts; are the coefficients and itu is the residual.
4. Results
This part reports the results of the estimated VAR model and causality tests. Be-fore estimating the VAR model optimum lag-length needs to be determined by pre-estimation tests. Table 2 shows that the optimum lag-length is one according to the likelihood-ratio (LR), final prediction error (FPE), Akaike’s information

478
ENERGY CONSUMPTION, CO2 EMISSIONS, AND GDP IN TURKEY
Nilüfer KAYA KANLI
criterion (AIC), Schwarz’s Bayesian information criterion (SBIC), and the Han-nan and Quinn information criterion (HQIC).
Table 2: Optimal Lag-Length
lag LL LR df p FPE AIC HQIC SBIC
0 -565.472 964539 22.293 22.3364 22.4067
1 -397.948 335.05* 9 0.000 1927.02* 16.0764* 16.2501* 16.5309*
2 -394.372 7.1513 9 0.621 2393.99 16.2891 16.5931 17.0846
3 -386.193 16.359 9 0.060 2497.62 16.3213 16.7555 17.4577
4 -379.763 12.859 9 0.169 2815.63 16.4221 16.9866 17.8994
After detecting the optimum lag-length, three variable VAR model is estimated. Ta-ble 3 gives the outcomes of the model. According the results, at 10% significance level, primary energy consumption per capita has a positive causal effect on GDP per capita. But, CO2 emissions per capita does not have any causal effect on GDP per capita. Neither GDP per capita nor CO2 emissions per capita has a causal effect on primary energy consumption per capita. Finally, if we look at the causal relation on CO2 emissions per capita, at 1% significance level primary energy consump-tion per capita has a causal effect on CO2 emissions per capita. On the other hand, GDP per capita does not have any causal effect on CO2 emissions per capita. This finding doesn’t support the EKC hypothesis, because, EKC hypothesis is based on the existence of the direct impact of GDP per capita on environmental indicators.

PERSPECTIVES ON MODERN ECONOMY
Aizhan KHOICH, Ali Eren ALPER, Ahmet Arif EREN
479
Table 3: Estimated VAR Model
Variables Coef. Std. Err. z P>IzI 95% Confidence Interval
gdppc
L1.gdppc 0.9590936 0.0709358 13.52 0.000 0.820062 1.098125
L1.pecpc 60.64625 35.69749 1.7 0.089 -9.319552 130.6121
L1.co2pc -850.3057 537.3886 -1.58 0.114 -1903.568 202.9566
Constant 319.7101 223.0964 1.43 0.152 -117.5508 756.971
pecpc
L1.gdppc 0.0002791 0.0004249 0.66 0.511 -0.0005537 0.0011119
L1.pecpc 0.9348731 0.213828 4.37 0.000 0.5157778 1.353968
L1.co2pc 0.4958107 3.218958 0.15 0.878 -5.813231 6.804853
Constant 0.4295767 1.336348 0.32 0.748 -2.189617 3.04877
co2pc
L1.gdppc -0.0000209 0.0000278 -0.75 0.452 -0.0000753 0.0000336
L1.pecpc 0.0491041 0.0139726 3.51 0.000 0.0217183 0.07649
L1.co2pc 0.2100281 0.2103434 1 0.318 -0.2022374 0.6222936
Constant 0.3284592 0.0873239 3.76 0.000 0.1573075 0.4996108
In addition to VAR model estimation, a granger causality test has been imple-mented. All the results that explain the causality between the three variables are summarized in Table 4. The causality test results are same with the VAR model estimation and the results have validated each other. In summary, GDP per cap-ita does not have a direct effect on CO2 emissions per capita where the primary energy consumption has significant effects both on CO2 emissions per capita and GDP per capita. These results are in line with the results of Soytas et al. (2007) and Soytas&Sari (2003).

480
ENERGY CONSUMPTION, CO2 EMISSIONS, AND GDP IN TURKEY
Nilüfer KAYA KANLI
Table 4: Summary of the Causal Relations
Dependent Variable
Independent Variables
t-statistics and Granger Causality Wald Test Decision
gdppc pecpc significant (+) (10%)
Primary energy consumption per capita Granger-causes GDP per capita
co2pc insignificantCO2 per capita does not Granger-cause GDP per capita
pecpcgdppc insignificant
GDP per capita does not Granger-cause Primary energy consumption per capita
co2pc insignificant
CO2 per capita does not Granger-cause Primary energy consumption per capita
co2pcgdppc insignificant
GDP per capita does not Granger-cause CO2 per capita
pecpc significant (+) (1%)
Primary energy consumption per capita Granger-causes CO2 per capita
5. Conclusion
Paris Agreement is the current international treaty in action, which aimed to re-duce the emission of gases that contribute to global warming. This agreement is the most concrete global action to address one of the most vital problems of the world. On the other hand, developing and less developed countries are trying to grow their economies to increase welfare and address unemployment, poverty, hunger, etc. In this context, the tradeoff between growing the economy and de-creasing the emissions puts too much pressure on developing and less developed economies. Developing and less developed countries need assistance and finan-cial support of the more developed economies to address both global warming and poverty. On top of it, all communities need to seek efficient energy and en-vironmental policies which contributes to addressing climate change without de-creasing the incomes. Turkey is one of the significant emitters, with 1% of global emissions in 2018, and at the same time dealing with problems of unemployment and poverty. This chapter analyzed the relationship between CO2 emissions per capita, energy consumption per capita and GDP per capita for Turkey to con-tribute to providing a basis for policy development.
PERSPECTIVES ON MODERN ECONOMY
Aizhan KHOICH, Ali Eren ALPER, Ahmet Arif EREN
481
According to the findings of this chapter, the main statistically significant cause of CO2 emissions is energy consumption. Energy consumption also Granger causes the GDP per capita. The results suggest that there is not a direct rela-tionship between CO2 emissions and income. Therefore, an emission reduction policy does not necessarily lead to a welfare loss. On the other hand, energy consumption and the sources of the consumed energy also have a major role in the relation between economic growth and greenhouse gas emissions. Results in the previous section showed that energy consumption both increases CO2 emissions and income. If the emission limiting policy necessitates a reduction in energy consumption then a welfare loss may occur. But, shifting to cleaner energy sources can decrease energy-related CO2 emissions without reducing en-ergy consumption. Sharif et al. (2020) and Karasoy (2019) also showed that renewable energy consumption has a negative effect on CO2 emissions where non-renewable energy consumption has a positive effect on CO2 emissions in Turkey. Then, for Turkey, it would be possible to meet the environmental re-quirements without sacrificing economic development only if energy policy fo-cuses on shifting to cleaner energy sources.
References
Ang, J.B., 2008. “Economic development, pollutant emissions and energy con-sumption in Malaysia”. Journal of Policy Modeling 30, 271–278
BP, Statistical Review of World Energy, https://www.bp.com/en/global/corpo-rate/energy-economics/statistical-review-of-world-energy.html
Dinda, S. (2004), “Environmental Kuznets Curve Hypothesis: A Survey”, Eco-logical Economics, 49(4), 431-455.
Dogan, E., & Seker, F. (2016). “An investigation on the determinants of car-bon emissions for OECD countries: empirical evidence from panel models robust to heterogeneity and cross-sectional dependence”. Environmental Science and Pollution Research, 23(14), 14646-14655.
EDGAR (2019), Emission Database for Global Atmospheric Research, “Fossil CO2 emissions of all world countries - 2019 Report”, https://ed-gar.jrc.ec.europa.eu/overview.php?v=booklet2019

482
ENERGY CONSUMPTION, CO2 EMISSIONS, AND GDP IN TURKEY
Nilüfer KAYA KANLI
Grossman, G. M., & Krueger, A. B. (1991, “Environmental impacts of a North American free trade agreement”, NBER Working Paper No. 3914, NBER.
Isik, C., Ongan, S. & Ozdemir, D. (2019) “Testing the EKC hypothesis for ten US states: an application of heterogeneous panel estimation method”. Environmental Science and Pollution Research 26, 10846–10853. https://doi.org/10.1007/s11356-019-04514-6
Karasoy, A. (2019). “Drivers of carbon emissions in Turkey: considering asym-metric impacts”. Environmental Science and Pollution Research, 26(9), 9219-9231. Nahman, A., & Antrobus, G. (2005). “The environmental Kuznets curve: a literature survey”. South African Journal of Economics, 73(1), 105-120.
NASA (2010). “Is Current Warming Natural?” Earth Observatory Web Page, Published on Jun 3th, 2010, https://earthobservatory.nasa.gov/fea-tures/GlobalWarming/page4.php
Omri, A. (2013). “CO2 emissions, energy consumption and economic growth nexus in MENA countries: Evidence from simultaneous equations models”. Energy economics, 40, 657-664.
Our World in Data, accessed on September 4th 2020 https://ourworldindata.org/
TURKSTAT, Turkish Statistical Institute, Air Statistics, http://www.turkstat.gov.tr/PreTablo.do?alt_id=1019
Shafik, N., & Bandyopadhyay, S. (1992), “Economic growth and environmen-tal quality: Time series and cross-country evidence”, World Bank Policy Research Working Paper, WPS 904.
Shahbaz, M. and Sinha, A. (2019), “Environmental Kuznets curve for CO2 emissions: a literature survey”, Journal of Economic Studies, Vol. 46 No. 1, pp. 106-168. https://doi.org/10.1108/JES-09-2017-0249
Sharif, A., Baris-Tuzemen, O., Uzuner, G., Ozturk, I., & Sinha, A. (2020). “Revisiting the role of renewable and non-renewable energy con-sumption on Turkey’s ecological footprint: Evidence from Quan-tile ARDL approach”. Sustainable Cities and Society, 102138.

PERSPECTIVES ON MODERN ECONOMY
Aizhan KHOICH, Ali Eren ALPER, Ahmet Arif EREN
483
Soytas, U., & Sari, R. (2003). “Energy consumption and GDP: causality rela-tionship in G-7 countries and emerging markets”. Energy econom-ics, 25(1), 33-37.
Soytas, U., Sari, R., & Ewing, B. T. (2007). “Energy consumption, income, and carbon emissions in the United States”. Ecological Economics, 62(3-4), 482-489.
Soytas, U., & Sari, R. (2009). “Energy consumption, economic growth, and carbon emissions: challenges faced by an EU candidate member”. Ecological economics, 68(6), 1667-1675.
Tiba, S., & Omri, A. (2016). Literature survey on the relationships between energy variables, environment and economic growth. University Library of Munich, Germany.
Uchiyama, K. (2016), Environmental Kuznets Curve Hypothesis and Carbon Dioxide Emissions, Development Bank of Japan Research Series, Springer
WEF, World Economic Forum, (2016). The Global Risks Report 2016, Geneva, http://www3.weforum.org/docs/GRR/WEF_GRR16.pdf
World Bank, World Development Indicators Database, https://databank.worldbank.org/home.aspx


SECTION VIIHISTORY OF ECONOMIC THOUGHT


487
29NURSE TURNOVER AND ITS COSTSSibel Meler1, Şükrü Anıl Toygar2
Introduction
Health spending has increased significantly in recent years (Yereli, Köktaş, & Selçuk, 2014). However, the aging world population increases the demand for the health system with the increase in epidemic and chronic diseases (Roche, Duffield, Homer, Buchan, & Dimitrelis, 2015). Nurses play a key role in health systems, accounting for approximately 56% of long-term healthcare providers (Dall, Chen, Seifert, Maddox, & Hogan, 2009). Considering the aging of the workforce with the increase in nurses’ demands, the crisis is expected to grow even more globally (Haczyński, Skrzypczak, & Winter, 2017). According to the World Health Or-ganization (WHO), health workforce crises make it impossible for all countries to fight diseases and improve health (WHO, 2006).
The lack of nursing workforce negatively affects not only the sustainability of health services but also patient outcomes (Valizadeh et al., 2016). It also reduces nurses’ job satisfaction and quality of patient care (Needleman et al., 2011; Rafferty et al., 2007). It is important to maintain the number of nurses available and to in-crease the number of qualified nurses in order to prevent these problematic situ-ations (Rivers, Tsai, & Munchus, 2005). Some of the measures that can be taken are arranging orientation programs for new employees, ensuring job satisfaction, improving working conditions and living conditions (Rivers, Tsai, & Munchus, 2005). In order to motivate nurses and provide satisfaction, factors such as hav-ing a fair wage policy, ensuring work-private life balance, healthy and safe working environment should be given due importance (Arslan Yürümezoğlu, Kocaman, & Mert Haydar İ, 2019). It is stated that factors such as the society’s development of a positive perspective on nurses and the nurses’ establishing a healthy communica-tion with their top managers positively affect their commitment to the institution
1 Selçuk University2 Selçuk University

488
NURSE TURNOVER AND ITS COSTS
Sibel Meler, Şükrü Anıl Toygar
(Valizadeh et al., 2016). In addition, rights such as social benefits, individual re-tirement, comprehensive health insurance, corporate support in career planning, implementation of job rotations increase commitment to the institution and the employee turnover rate decreases (Dombaycı & Kıvanç, 2020; Halbesleben, Sav-age, Wakefield, & Wakefield, 2010; Valizadeh et al., 2016).
The nursing profession struggles with the ever-increasing needs of the aging pop-ulation, qualified nurse turnover, and complex healthcare changes (Wei, Sewell, Woody, & Rose, 2018). Turnover in nursing is a global problem due to the long-term and ongoing lack of workforce. This global distress is also due to nurses’ intention to quit, leave the profession, or be out of nursing workforce planning (Flinkman, Isopahkala-Bouret, & Salanterä, 2013). Retention of nursing staff is a very important issue for the healthcare system. For this reason, each coun-try should scrutinize the factors associated with nurses’ intention to leave their profession and take the necessary action (Bordignon & Monteiro, 2019). Nurse turnover is a critical issue that attracts international attention due to both human and financial costs (Battistelli, Portoghese, Galletta, & Pohl, 2013). Therefore In this part of the book, the intention of leaving the job will be explained and re-searches on the nursing workforce turnover, importance and costs will be included.
The Turnover Intention
The destructive and active action of nurses as a result of voluntary or involuntary relocation in their working position and their dissatisfaction with their working conditions can be defined as “turnover intention” (Çekmecelioğlu, 2014; Koca-man et al., 2010; Takase, 2010). It is a multi-stage process consisting of psycho-logical, cognitive and behavioral components (Takase, 2010). A study showed that nurses quit their jobs within the first six months after they decided to quit (C. Duffield, Pallas, & Aitken, 2004). A study showed that 80% of nurses who left the profession intended to leave within the last year. The same study found that most of those who quit started the process with serious consideration in the last year before leaving and made the actual decision to leave within six months before the decision was made (Hasselhorn et al., 2005). The final decision on whether to quit the nursing profession is based on an individual thinking pro-cess (Carless & Arnup, 2011; Laine, van der Heijden, Wickström, Hasselhorn, & Tackenberg , 2009), which is estimated to be the result of many reasons (Flink-man et al., 2010; Hasselhorn et al., 2005).

PERSPECTIVES ON MODERN ECONOMY
Aizhan KHOICH, Ali Eren ALPER, Ahmet Arif EREN
489
The new generation of nurses are the group most willing to quit their job and nursing profession (Hayes et al., 2006; Rudman et al., 2010; Salminen, 2012). In a study conducted in the United States, it was reported that the rate of leav-ing the profession for newly graduated nurses in the first two years was 2%, and that of professional nurses was more than 26% (Kovner & Djukic, 2009). Has-selhorn et al. (2005) found that nurses between the ages of 25-35 had a higher rate of turnover intention (Hasselhorn et al., 2005).
In another study, while the turnover intention of the certified, qualified nurses was the highest among 28-year-olds, it was observed to decrease with the increase of age (Robinson, Murrells, & Griffiths, 2008). In a study by Barron and West (2005), it was determined that the rate of leaving the nursing profession for a better job was highest at the age of 32 (Barron & West, 2005). In contrast to the studies in which young nurses have a high intention to leave the profession, there is a study showing that older nurses have higher intention to leave the pro-fession than young nurses (Heinen et al., 2013).
In addition to individual and professional factors, turnover intention has been as-sociated with two demographic variables as being young and male (Chan, Leong, Luk, Yeung, & Van, 2010; De Oliveira, Griep, Portela, & Rotenberg, 2017; Flink-man, Laine , Leino-Kilpi, Hasselhorn, & Salanterä, 2008; Masum et al., 2016). In a study conducted in Iran, it was found that only half of the nurses (53%) had an intention to remain in the nursing profession and this was the main de-terminants of this situation regarding gender, age and nursing (Soudagar, Ram-bod, & Beheshtipoor, 2014).
Problems in the working climate are the issues that should be dealt with by the management (Arslan Yürümezoğlu et al., 2019; Leone et al., 2015; Nantsupawat et al., 2017). These problems contribute to turnover intentions. Occupational fac-tors such as hospital work, poor management support, lack of job satisfaction, role conflicts, lack of job promotion opportunities, job stress, and job-reward imbal-ance can be associated with turnover intention (De Oliveira et al., 2017; Hassel-horn et al., 2005). In other studies, it has been found that work stress factors such as a negative work climate have a negative effect on health services (nursing care).
A study among 857 nurses in Lebanon found that 62.5% of nurses intend to leave, and various factors such as job satisfaction (Alharbi, Wilson, Woods, & Usher, 2016; Heinen et al., 2013) and quality of life (Alshehry et al., 2019), were

490
NURSE TURNOVER AND ITS COSTS
Sibel Meler, Şükrü Anıl Toygar
found to be related to nurses’ turnover intentions (Albougami et al., 2020). In addition, job stress can negatively affect employee productivity and job satisfac-tion, which may lead to an individual’s intention to quit the nursing profession (Najimi et al., 2012).
In a study conducted in Australia, a significant relationship was found between staff turnover rate and low quality of life (Perry et al., 2017). Ibrahim et al. (2016) found that a poor quality of life could lead to a lack of job satisfaction and a high turnover rate, and that these factors could have a negative impact on pa-tient safety (Ibrahim et al., 2016).
The work environment has been seen by health systems to be a strong factor be-tween individuals and work team levels that can affect an organization’s perfor-mance (Olsen, Bjaalid, & Mikkelsen, 2017). In another study conducted in Iran, it was found that increasing the quality of life could increase job performance and job satisfaction (Mohammadi et al., 2011). Chen, Chu, Wang, and Lin (2008) found that distributive justice, workload, resource adequacy, supervision / kin-ship support, and job satisfaction in Taiwan were strongly associated with the in-tention to stay or leave the job (Chen et al., 2008).
Nurse Turnover And Its Importance
Nurses are the largest component of hospitals, public health centers, primary care centers, home care centers, outpatient centers, schools, academia and health research which are long-term healthcare providers (AACN, 2019; US, 2019). For example more than 50% of the healthcare workforce in the USA are nurses (AACN, 2019; WHO, 2018).
Turnover is defined as any business movement in the nursing units of the same hospital or a different institution when the staff leaves the organization or profes-sion altogether (Hayes et al., 2006). In other words, it is defined as the person’s voluntary termination of his / her duty in one environment and transfer to an-other environment, changing the unit in which he / she works in the same envi-ronment or leaving the profession completely (Hayajneh, AbuAlRub, Athamneh, & Almakhzoomy, 2009). When we examine the studies about nurse turnover from different discipline perspectives, we see that economists contribute to studies in this field by examining individual preferences and labor market variables, sociol-ogists by examining the structural characteristics and work content of the work

PERSPECTIVES ON MODERN ECONOMY
Aizhan KHOICH, Ali Eren ALPER, Ahmet Arif EREN
491
environment, and psychologists by identifying individual variables and mental processes (Hayes et al., 2006).
Various formulas are used to calculate the turnover rate. The values based on the formula used in general are the number of the employees, number of employees leaving, number of replacements and average number of personnel. When cal-culating, the unit of time (month, year) should be specified. Generally, the time frame calculated in months is used when making calculations in small enterprises or institutions with low personnel turnover rate. It is calculated as “Turnover rate = Number of employees who left * 100 / the average number of employees dur-ing the period”. The average number of personnel means the average of the to-tal number of staff at the beginning of the term and the number of staff at the end of the term (Erdoğan, 2002). 4–12% nurse turnover rate is low; 12--22% are considered medium and 22--44% high turnover (O’Brien-Pallas et al., 2010).
A global crisis, turnover in nursing, prompts many nurses to quit their jobs or to be out of the nursing workforce (Flinkman, Leino-Kilpi, & Salanterä, 2010). In studies conducted on the turnover rates in nurses, it was found to be 16.4% in America (NSI, 2017), 19.9% in Canada and 15.1% in Australia. In a literature review, Flinkman et al. (2013) revealed that nurses’ intention to leave the profes-sion varies between 4% and 54% in international studies (Flinkman et al., 2013).
In a study conducted in Europe, it was found that 13% of nurses wanted to quit the profession frequently (Hasselhorn, Müller, & Tackenberg, 2005). In a national survey, it was found that the average length of stay of foreign nurses was 2.2 years (Alonazi & Omar, 2013). As a problem affecting many countries, high nursing turnover rates have been defined between 12% and 50%, where staff voluntarily leave or transfer from their initial employment positions to another position in nursing or to another profession (Castle & Engberg, 2005).
In a study conducted according to the number of nurses working in Europe, it was found that the rate of those who intended to leave their current job varied between 49% (Finland, Greece) and 14% (United States) (Aiken et al., 2012). Accordingly, approximately one tenth (9%) of nurses working in Europe intend to leave the profession (Heinen et al., 2013). In another study conducted in Fin-land, it was found that half of the working nurses under the age of 35 intended to leave the profession (Salminen, 2012). In a study conducted in Sweden, it is

492
NURSE TURNOVER AND ITS COSTS
Sibel Meler, Şükrü Anıl Toygar
stated that 10-20% of newly graduated nurses are considering quitting the pro-fession (Rudman, Omne-Pontén, Wallin, & Gustavsson, 2010).
It has been reported that the rate of nurses planning to quit their jobs in the first three years of their professional life in America is 3% (Flinkman et al., 2013; Flinkman et al., 2010). A study conducted in three university hospitals in Tur-key between 2003-2007 found that turnover rates were significantly different be-tween staff nurse (% 2,0- 5,3%) and contracted nurses (2.2% to 17.5%) (Koca-man, Seren, Kurt, Danis, & Erer, 2010). Again in the same country, in the study conducted by Baykal and Eren (2004) in a private hospital, the nurse workforce turnover rate was 16% (Baykal & Eren, 2004). Today, nurse turnover is a major problem for both private and public hospitals.
Basic factors affecting the turnover in nursing are limited career opportunities, the lack of support by the management, the deficiency in defining professional duties-authorities and responsibilities and negative personnel attitudes. In addi-tion, compelling reasons in working conditions (such as excessive working hours, overtime, not being able to use leave, restriction of personal rights, differences in working status), intensive workload, role ambiguity and conflicts, increasing pa-tient demands and workplace bullying are among the factors that affect the turn-over. In addition to leading to an increase in the turnover of nurses, these prob-lems causes the costs to increase by also causing the feeling of worthlessness and weakness, loss of performance, decreased job satisfaction and motivation, com-promising patient safety, decrease in professional commitment, loss of profes-sional commitment, burnout, decrease in quality of nursing care and continuity (presentism and absenteeism) (O’Brien - Pallas et al., 2010; Li & Jones, 2013).
The Cost Of Nurse Turnover
Nurse turnover costs may vary depending on the specific branch and compre-hensive hospital characteristics (Li & Jones, 2013). Rapid staff turnover in nurs-ing increases costs, decreases job satisfaction, and negatively affects the quality and continuity of nursing care (Valizadeh et al., 2016). It has been found that nurse turnover costs are higher in hospitals with more specific services such as intensive care units compared to hospitals that offer less complex services (Li & Jones, 2013). This is because hospitals that provide a wide range of services need a lot of time and money to orient newly employed nurses (Lewin Group, 2009).

PERSPECTIVES ON MODERN ECONOMY
Aizhan KHOICH, Ali Eren ALPER, Ahmet Arif EREN
493
Nursing Turnover Cost Calculation Methodology (NTCCM) is widely used to distinguish between direct costs andindirect costs (Jones, 2004, 2005, 2008). While direct costsare defined as those related to the hiring, temporary replacement and hiring of a new employee, indirect costscan be related to the time spent managing the dismissal and turnover process as well as the orientation, training and pro-ductivity. O’Brien-Pallas et al. (2006) suggested that while turnover accounted for 21% of total costs of direct recruitment costs, indirect costs of lost produc-tivity accounted for 79% of total costs (O’Brien-Pallas et al., 2006). Revised ver-sion of NTCCM reconcepts cost categories as pre-hiring costs and post-hiring costs and includes additional items such as auditor costs that explain more elements of turnover (Jones, 2004, 2005, 2008).
There is limited published information on nursing turnover rates and costs. In a study conducted in Australia, it was reported that there was a 20.2% cost to in-crease and retain nurse potential in rural and remote areas, and a later study re-ported that there was no change in the cost rate (12-31.9%) except for the age of the nurses (Eley, Buikstra, Plank, Hegney, & Parker, 2007). Figures from the North-ern Territory show a 38% turnover rate per nurse using the revised NTCCM and an average turnover cost of $ 10,734 (Australian dollars) (Garnett et al., 2008).
Cost studies related to nurse turnover draw attention (Roche et al., 2015). Fund-ing in the USA, Australia, UK and Canada rates are 16.2%, 15%, less than 15% and 20% respectively (Li & Jones, 2013; O’Brien-Pallas, Murphy, Shamian, Li, & Hayes, 2010; Rondeau & Wagar, 2016).(O’Brien-Pallas, Murphy, Shamian, Li, & Hayes, 2010; Rondeau, Williams, & Wagar, 2008) In Jordan, the estimated costs are higher with a rate of 32% (Al-Maaitah & Shokeh, 2009). Heinen et al. (2013) found that nurses’ turnover intention in European countries affects the costs of the institution between 5-17% (Heinen et al., 2013). A study con-ducted in Australia shows a cost rate of 1-1.4% per month in New South Wales (Cunich & Whelan, 2010).
As a problem affecting many countries, high nursing turnover rates between 12% and 50% (Castle & Engberg, 2005), where staff voluntarily leave or transfer from a primary employment position to another position in nursing or to another pro-fession (Hayes et al., 2006) are seen as turnover losses (Lavoie. -Tremblay, Paquet, Marchionni, & Drevniok, 2011; Rondeau, Williams, & Wagar, 2008). In addi-tion, these aspects of turnover should also be taken into account, as the turnover

494
NURSE TURNOVER AND ITS COSTS
Sibel Meler, Şükrü Anıl Toygar
movement may negatively affect staff training, orientation of new staff, schedul-ing and sustainability of care in nursing services (C.Duffield, Roche, O’Brien-Pal-las, & Catling. -Paull, 2009).
In a pilot study conducted in Australia, the cost of nurse turnover to the health-care facility per nurse is estimated as $ 16,634 (Hayes et al., 2006). Secondly, turnover appears to affect the roles (O’Brien-Pallas et al., 2010)and productiv-ity of remaining personnel and the quality of care negatively by decreasing their motivation and stress level (Hayes et al., 2006; Jones, 2008).
Finally, turnover costs affect patient safety and are affected by the remuneration of nurses, associated with both increased infection rate and subsequent hospital-ization, increasing the likelihood of medical error (Hayes et al., 2006; O’Brien - Pallas et al., 2010) ; reported to reduce patient satisfaction (Zimmerman, Gru-ber - Baldini, Hebel, Sloane, & Magaziner, 2002).
Reducing the stress in the working environment, providing sufficient number of nurses and improving working environments enables to encourage nurses to stay in their institution and to decrease their turnover intention by increasing their job satisfaction (De Oliveira et al., 2017; Fatemeh Şerifard et al., 2019). Factors that contribute to job satisfaction include salary, promotion, and professional de-velopment (Al - Dossary, Vail, & Macfarlane, 2012; Najimi, Goudarzi, & Sha-rifirad, 2012)
In the international literature, the working environment, which is one of the fac-tors affecting nursing costs, has been defined as an important factor in the nure turnover.Another study by Rhéaume and colleagues (Rhéaume, Clément, & Lebel, 2011) found that a key component of the work environment, one of the founda-tions of quality nursing care, was the most important determinant of its variance in turnover (Dawson, Stasa, Roche, Homer, & Duffield, 2014).
Aiken and colleagues found in their research in the US, Canada, England, Scot-land and Germany that low morale and motivation, management problems, workload, and time spent on non-nursing assignments all contribute to the cost (Aiken, Clarke, Sloane, Sochalski, & Silber, 2002). The cost of changing a nurse can range from $ 22,000.00 to $ 64,000.00 (Dawson, Stasa, Roche, Homer, & Duffield, 2014). In Canada, Leiter and Maslach (2009) found that burnout or exhaustion mediates cost formation. In the USA, Johnson and Rea (2009) found

PERSPECTIVES ON MODERN ECONOMY
Aizhan KHOICH, Ali Eren ALPER, Ahmet Arif EREN
495
that workplace bullying is associated with turnover from both the organization and the nursing profession (Johnson & Rea, 2009).
Results & Recommendations
Nursing is a profession group with a high turnover rate. The high turnover rate affects the quality, quantity and cost of patient care. For this reason, the speed of job turnover in nurses and the reasons for their leave remain up-to-date as an issue that health and nurse managers should focus on and develop effective strategies.
Some of the factors that affect the turnover and need to be taken precautions are limited career opportunities, poor support, lack of recognition and negative staff attitudes. Nurses should also be provided with educational opportunities, safe working environments, and social opportunities to maintain work-life bal-ance so that they can recognize and develop themselves. Efforts should be made to increase the organizational commitment of the employee.
The shortage of qualified nurses with the appropriate skills is a global problem. The nursing work environment is characterized by a mixture of inappropriate skill and inadequate patient-staff ratios. Low participation in decision-making processes and increasing patient demands make this process even more diffi-cult. These problems affect heavy workloads and stress levels, making nurses feel worthless and powerless.
Nursing turnover rate is affected by the experiences of nurses. Positive steps can be taken to improve workplace conditions and retain nurses. Improving perfor-mance management and job design are strategies nurse managers can use to re-duce turnover. Performance evaluations should be improved and nurses should be provided with flexible employment options and supportive strategies.
To ensure that nurses do not see nursing as a “dead end job”, it requires changes in the workplace culture, such as the development of performance management and flexible employment options. Nurses need to feel empowered to help guide their careers and contribute to decisions that advance quality healthcare delivery in the hospital settings in which they work.
While leaving jobs, absenteeism and performance decreases cause great economic losses in terms of health institutions, the high turnover rates of nurses affect the

496
NURSE TURNOVER AND ITS COSTS
Sibel Meler, Şükrü Anıl Toygar
quality, continuity and cost of patient care. It is inevitable that this situation re-duces the efficiency and effectiveness of the organization. It should be kept in mind that the decrease in the number of patient care nurses in health institu-tions, which have a high rate of personnel turnover and have to provide services without sacrificing quality, aggravates the working conditions of other colleagues who continue in the institution and makes it difficult for these people to stay in the institution. Continuous replacement of nurses as a result of turnover affects the cost and quality of healthcare services.
References
AACN,(2019). Fact sheets. Nursing faculty shortage. Retrieved from: https://www.aacnnursing.org/News-Information/Fact-Sheets/Nurs-ing-Faculty-Shortage
Aiken, LH, Clarke, SP, Sloane, DM, Sochalski, J., & Silber, JH (2002). Hos-pital nurse staffing and patient mortality, nurse burnout, and job dissatisfaction. Jama, 288 (16), 1987-1993.
Aiken, LH, Sermeus, W., Van den Heede, K., Sloane, DM, Busse, R., McKee, M.,. . . Moreno-Casbas, MT (2012). Patient safety, satisfaction, and quality of hospital care: cross sectional surveys of nurses and patients in 12 countries in Europe and the United States. Bmj, 344, e1717.
Al-Maaitah, R., & Shokeh, D. (2009). The nursing workforce in Jordan: A policy oriented approach. Amman: Jordanian Nursing Council .
Al - Dossary, R., Vail, J., & Macfarlane, F. (2012). Job satisfaction of nurses in a Saudi Arabian university teaching hospital: a cross - sectional study. International Nursing Review, 59 (3), 424-430.
Albougami, AS, Almazan, JU, Cruz, JP, Alquwez, N., Alamri, MS, Adolfo, CA, & Roque, MY (2020). Factors affecting nurses’ intention to leave their current jobs in Saudi Arabia. International Journal of Health Sciences, 14 (3), 33.
Alharbi, J., Wilson, R., Woods, C., & Usher, K. (2016). The factors influencing burnout and job satisfaction among critical care nurses: a study of Saudi critical care nurses. Journal of nursing management, 24 (6), 708-717.

PERSPECTIVES ON MODERN ECONOMY
Aizhan KHOICH, Ali Eren ALPER, Ahmet Arif EREN
497
Alonazi, NA, & Omar, MA (2013). Factors affecting the retention of nurses. Saudi medical journal, 34 (3), 288-294.
Alshehry, AS, Alquwez, N., Almazan, J., Namis, IM, Moreno - Lacalle, RC, & Cruz, JP (2019). Workplace incivility and its influence on profes-sional quality of life among nurses from multicultural background: A cross - sectional study. Journal of Clinical Nursing, 28 (13-14), 2553-2564.
Arslan Yürümezoğlu, H., Kocaman, G., & Mert Haydar İ, S. (2019). Predict-ing nurses’ organizational and professional turnover intentions. Japan Journal of Nursing Science, 16 (3), 274-285.
Barron, D., & West, E. (2005). Leaving nursing: an event-history analysis of nurses’ careers. Journal of Health Services Research & Policy, 10 (3), 150-157.
Battistelli, A., Portoghese, I., Galletta, M., & Pohl, S. (2013). Beyond the tra-dition: test of an integrative conceptual model on nurse turnover. International Nursing Review, 60 (1), 103-111.
Baykal, Ü., & Eren, D. (2004). Investigation of the relationship between nurs-ing staff turnover and nurses’ job satisfaction and patient satisfac-tion in a private hospital. Nursing Journal, 53 (13), 85-100.
Bordignon, M., & Monteiro, MI (2019). Predictors of nursing workers’ in-tention to leave the work unit, health institution and profession. Revista latino-americana de enfermagem, 27 .
Buchan, J. (2010). Reviewing the benefits of health workforce stability. Human resources for health, 8 (1), 29.
Carless, SA, & Arnup, JL (2011). A longitudinal study of the determinants and outcomes of career change. Journal of vocational behavior, 78 (1), 80-91.
Castle, NG, & Engberg, J. (2005). Staff turnover and quality of care in nursing homes. Medical care , 616-626.
Chan, MF, Leong, SM, Luk, AL, Yeung, SM, & Van, IK (2010). Exploring the profiles of nurses’ job satisfaction in Macau: results of a cluster analysis. Journal of Clinical Nursing, 19 (3-4), 470-478.

498
NURSE TURNOVER AND ITS COSTS
Sibel Meler, Şükrü Anıl Toygar
Chen, H.-C., Chu, C.-I., Wang, Y.-H., & Lin, L.-C. (2008). Turnover factors revisited: a longitudinal study of Taiwan-based staff nurses. Inter-national journal of nursing studies, 45 (2), 277-285.
Chiavenato, I. (2008). Gestão de pessoas : Elsevier Brasil.
Cunich, M., & Whelan, S. (2010). Nurse education and the retention of reg-istered nurses in New South Wales. Economic Record, 86 (274), 396-413.
Çekmecelioğlu, HG (2014). The effects of task and human leadership styles on organizational commitment, job performance, and intention to quit.
Dall, TM, Chen, YJ, Seifert, RF, Maddox, PJ, & Hogan, PF (2009). The eco-nomic value of professional nursing. Medical care , 97-104.
Dawson, AJ, Stasa, H., Roche, MA, Homer, CS, & Duffield, C. (2014). Nurs-ing churn and turnover in Australian hospitals: nurses perceptions and suggestions for supportive strategies. BMC nursing, 13 (1), 11.
De Oliveira, DR, Griep, RH, Portela, LF, & Rotenberg, L. (2017). Intention to leave profession, psychosocial environment and self-rated health among registered nurses from large hospitals in Brazil: a cross-sec-tional study. BMC health services research, 17 (1), 21.
Dombaycı, A., & Kıvanç, MM (2020). Strategies for Recruiting and Keeping Generation Y in Nursing Services. Health and Nursing Management Journal, 7 (1), 160-168. doi: 10.5222 / SHYD.2019.93898
Duffield, C., Pallas, LOB, & Aitken, LM (2004). Nurses who work outside nursing. Journal of Advanced Nursing, 47 (6), 664-671.
Duffield, C., Roche, M., O’Brien-Pallas, L., & Catling-Paull, C. (2009). The implications of staff’churn’for nurse managers, staff, and patients. Nursing Economics .
Duffield, CM, Roche, MA, Homer, C., Buchan, J., & Dimitrelis, S. (2014). A comparative review of nurse turnover rates and costs across coun-tries. Journal of Advanced Nursing, 70 (12), 2703-2712.
Eley, R., Buikstra, E., Plank, A., Hegney, D., & Parker, V. (2007). Tenure, mo-bility and retention of nurses in Queensland, Australia: 2001 and 2004. Journal of nursing management, 15 (3), 285-293.

PERSPECTIVES ON MODERN ECONOMY
Aizhan KHOICH, Ali Eren ALPER, Ahmet Arif EREN
499
Erdoğan, H. (2002). A Study To Measure The Relationship Between Employee Turnover And Job Satisfaction And The Thought Of Quitting. (M.Sc., Istanbul University, Istanbul / Turkey, 2011)
Fatemeh Şerifard, Hamid Asayesh, Hossein Rahmani- Anark, Mostafa Qor-bani, Valiollah Akbari, & Jafarizadeh, H. (2019). The Intention to Quit Nursing and Its Relationship with Working Climate and Demographic Features. Ianian Journal of Nursing and Midwifery Research, 24 (6), 457-461. doi: 10.4103 / ijnmr.IJNMR_209_18
Flinkman, M., Isopahkala-Bouret, U., & Salanterä, S. (2013). Young registered nurses’ intention to leave the profession and professional turnover in early career: a qualitative case study. International Scholarly Re-search Notices, 2013 .
Flinkman, M., Laine, M., Leino-Kilpi, H., Hasselhorn, H.-M., & Salanterä, S. (2008). Explaining young registered Finnish nurses’ intention to leave the profession: a questionnaire survey. International journal of nursing studies, 45 (5), 727-739.
Flinkman, M., Leino- Kilpi, H., & Salanterä, S. (2010). Nurses’ intention to leave the profession: integrative review. Journal of advanced nursing, 66 (7), 1422-1434.
Garnett, S., Coe, K., Golebiowska, K., Walsh, H., Zander, K., Guthridge, S.,. . . Malyon, R. (2008). Attracting and keeping nursing professionals in an environment of chronic labor shortage: a study of mobility among nurses and midwives in the Northern Territory of Australia : Charles Darwin University Press.
Haczyński, J., Skrzypczak, Z., & Winter, M. (2017). Nurses in Poland — im-mediate action needed. Engineering Management in Production and Services, 9 (2), 97-104.
Halbesleben, JR, Savage, GT, Wakefield, DS, & Wakefield, BJ (2010). Rework and workarounds in nurse medication administration process: im-plications for work processes and patient safety. Health care man-agement review, 35 (2), 124-133.
Hasselhorn, H.-M., Müller, BH, & Tackenberg, P. (2005). NEXT scientific report July 2005. Wuppertal: University of Wuppertal .
Hayajneh, YA, AbuAlRub, RF, Athamneh, AZ, & Almakhzoomy, IK (2009). Turnover rate among registered nurses in Jordanian hospitals: an

500
NURSE TURNOVER AND ITS COSTS
Sibel Meler, Şükrü Anıl Toygar
exploratory study. International Journal of Nursing Practice, 15 (4), 303-310.
Hayes, LJ, O’Brien-Pallas, L., Duffield, C., Shamian, J., Buchan, J., Hughes, F.,. . . Stone, PW (2006). Nurse turnover: a literature review. Inter-national journal of nursing studies, 43 (2), 237-263.
Heinen, MM, van Achterberg, T., Schwendimann, R., Zander, B., Matthews, A., Kózka, M.,. . . Ball, J. (2013). Nurses’ intention to leave their profession: a cross sectional observational study in 10 European countries. International journal of nursing studies, 50 (2), 174-184.
Ibrahim, NK, Alzahrani, NA, Batwie, AA, Abushal, RA, Almogati, GG, Sat-tam, MA, & Hussin, BK (2016). Quality of life, job satisfaction and their related factors among nurses working in king Abdulaziz University Hospital, Jeddah, Saudi Arabia. Contemporary Nurse, 52 (4), 486-498.
Johnson, SL, & Rea, RE (2009). Workplace bullying: concerns for nurse lead-ers. JONA: The Journal of Nursing Administration, 39 (2), 84-90.
Jones, CB (2004). The costs of nurse turnover: part 1: an economic perspective. JONA: The Journal of Nursing Administration, 34 (12), 562-570.
Jones, CB (2005). The costs of nurse turnover, part 2: application of the nurs-ing turnover cost calculation methodology. JONA: The Journal of Nursing Administration, 35 (1), 41-49.
Jones, CB (2008). Revisiting nurse turnover costs: Adjusting for inflation. JONA: The Journal of Nursing Administration, 38 (1), 11-18.
Kocaman, G., Seren, S., Kurt, S., Danis, B., & Erer, T. (2010). Turnover among nurses at three university hospitals / Nurse turnover at three uni-versity hospitals. Journal of Education and Research in Nursing, 7 (1), 34-39.
Kovner, CT, & Djukic, M. (2009). The nursing career process from applica-tion through the first 2 years of employment. Journal of Professional Nursing, 25 (4), 197-203.
Laine, M., van der Heijden, BI, Wickström, G., Hasselhorn, H.-M., & Tack-enberg, P. (2009). Job insecurity and intent to leave the nursing profession in Europe. The International Journal of Human Resource Management, 20 (2), 420-438.

PERSPECTIVES ON MODERN ECONOMY
Aizhan KHOICH, Ali Eren ALPER, Ahmet Arif EREN
501
Lavoie-Tremblay, M., Paquet, M., Marchionni, C., & Drevniok, U. (2011). Turnover intention among new nurses: a generational perspective. Journal for Nurses in Professional Development, 27 (1), 39-45.
Leiter, MP, & Maslach, C. (2009). Nurse turnover: the mediating role of burn-out. Journal of nursing management, 17 (3), 331-339.
Leone, C., Bruyneel, L., Anderson, JE, Murrells, T., Dussault, G., de Jesus, É. H.,. . . Rafferty, AM (2015). Work environment issues and inten-tion-to-leave in Portuguese nurses: A cross-sectional study. Health Policy, 119 (12), 1584-1592.
Lewin Group. (2009). Evaluation of The Robert Wood Johnson Wisdom at Work: Retaining Experienced Nurses Research Initiative.
Li, Y., & Jones, CB (2013). A literature review of nursing turnover costs. Jour-nal of nursing management, 21 (3), 405-418.
Innocent, AKM, Azad, MAK, Hoque, KE, Beh, L.-S., Wanke, P., & Arslan, Ö. (2016). Job satisfaction and intention to quit: an empirical analysis of nurses in Turkey. PeerJ, 4 , e1896.
Medeiros, CRG, Junqueira, Á. GW, Schwingel, G., Carreno, I., Jungles, LAP, & Saldanha, OM d. FL (2010). A rotatividade de enfermeiros e médicos: um impasse na implementação da Estratégia de Saúde da Família. Ciência & saúde coletiva, 15 , 1521-1531.
Mohammadi, A., Sarhanggi, F., Ebadi, A., Daneshmandi, M., Reiisifar, A., Amiri, F., & Hajamini, Z. (2011). Relationship between psycho-logical problems and quality of work life of Intensive Care Unit Nurses. Iranian Journal of Critical Care Nursing, 4 (3), 135-140.
Najimi, A., Goudarzi, AM, & Sharifirad, G. (2012). Causes of job stress in nurses: A cross-sectional study. Iranian journal of nursing and mid-wifery research, 17 (4), 301.
Nantsupawat, A., Kunaviktikul, W., Nantsupawat, R., Wichaikhum, OA, Thienthong, H., & Poghosyan, L. (2017). Effects of nurse work environment on job dissatisfaction, burnout, intention to leave. International Nursing Review, 64 (1), 91-98.
Needleman, J., Buerhaus, P., Pankratz, VS, Leibson, CL, Stevens, SR, & Harris, M. (2011). Nurse staffing and inpatient hospital mortality. New England Journal of Medicine, 364 (11), 1037-1045.

502
NURSE TURNOVER AND ITS COSTS
Sibel Meler, Şükrü Anıl Toygar
NSI, NSI (2017). Inch. 2015 National Healthcare Retention & RN Staffing Report 2015.
O’Brien - Pallas, L., Murphy, GT, Shamian, J., Li, X., & Hayes, LJ (2010). Im-pact and determinants of nurse turnover: a pan - Canadian study. Journal of nursing management, 18 (8), 1073-1086.
O’Brien-Pallas, L., Griffin, P., Shamian, J., Buchan, J., Duffield, C., Hughes, F.,. . . Stone, PW (2006). The impact of nurse turnover on patient, nurse, and system outcomes: a pilot study and focus for a multi-center international study. Policy, Politics, & Nursing Practice, 7 (3), 169-179.
Olsen, E., Bjaalid, G., & Mikkelsen, A. (2017). Work climate and the mediat-ing role of workplace bullying related to job performance, job sat-isfaction, and work ability: A study among hospital nurses. Journal of Advanced Nursing, 73 (11), 2709-2719.
Perry, L., Xu, X., Duffield, C., Gallagher, R., Nicholls, R., & Sibbritt, D. (2017). Health, workforce characteristics, quality of life and in-tention to leave: The ‘Fit for the Future’survey of Australian nurses and midwives. Journal of Advanced Nursing, 73 (11), 2745-2756.
Rafferty, AM, Clarke, SP, Coles, J., Ball, J., James, P., McKee, M., & Aiken, LH (2007). Outcomes of variation in hospital nurse staffing in Eng-lish hospitals: cross-sectional analysis of survey data and discharge records. International journal of nursing studies, 44 (2), 175-182.
Rhéaume, A., Clément, L., & Lebel, N. (2011). Understanding intention to leave amongst new graduate Canadian nurses: A repeated cross sec-tional survey. International journal of nursing studies, 48 (4), 490-500.
Rivers, PA, Tsai, K.-L., & Munchus, G. (2005). The financial impacts of the nursing shortage. Journal of health care finance, 31 (3), 52-64.
Robinson, S., Murrells, T., & Griffiths, P. (2008). Investigating the dynamics of nurse migration in early career: a longitudinal questionnaire survey of variation in regional retention of diploma qualifiers in England. International journal of nursing studies, 45 (7), 1064-1080.
Roche, MA, Duffield, CM, Homer, C., Buchan, J., & Dimitrelis, S. (2015). The rate and cost of nurse turnover in Australia. Collegian, 22 (4), 353-358.

PERSPECTIVES ON MODERN ECONOMY
Aizhan KHOICH, Ali Eren ALPER, Ahmet Arif EREN
503
Rondeau, KV, & Wagar, TH (2016). Human resource management practices and nursing turnover. Journal of Nursing Education and Practice, 6 (10), 101-109.
Rondeau, KV, Williams, ES, & Wagar, TH (2008). Turnover and vacancy rates for registered nurses: Do local labor market factors matter? Health Care Management Review, 33 (1), 69-78.
Rudman, A., Omne-Pontén, M., Wallin, L., & Gustavsson, PJ (2010). Mon-itoring the newly qualified nurses in Sweden: the Longitudinal Analysis of Nursing Education (LANE) study. Human Resources for Health, 8 (1), 10.
Salminen, HM (2012). Turning the tide: Registered nurses’ job withdrawal intentions in a Finnish university hospital. SA Journal of Human Resource Management, 10 (2), 1-11.
Sherman, RO, Chiang - Hanisko, L., & Koszalinski, R. (2013). The aging nurs-ing workforce: a global challenge. Journal of nursing management, 21 (7), 899-902.
Soudagar, S., Rambod, M., & Beheshtipoor, N. (2014). Intention to stay at nursing profession and its related factors. Sadra Med Sci J, 2 (2nd).
Takase, M. (2010). A concept analysis of turnover intention: Implications for nursing management. Collegian, 17 (1), 3-12.
U.S. Bureau of Labor Statistics.(2019). Occupational outlook handbook. Re-trieved from https:// www.bls.gov/ooh/healthcare/registered-nurs-es.htm
Valizadeh, L., Zamanzadeh, V., Habibzadeh, H., Alilu, L., Gillespie, M., & Shakibi, A. (2016). Experiences of Iranian nurses that intent to leave the clinical nursing: a content analysis. Journal of caring sciences, 5 (2), 169.
Yereli, A. B., Köktaş, A. G., & Selçuk, I. Ş. (2014). Türkiye’de katastrofik sağlık harcamalarını etkileyen faktörler. Sosyoekonomi, 22 (22), 273-296.
Wei, H., Sewell, KA, Woody, G., & Rose, MA (2018). The state of the science of nurse work environments in the United States: A systematic re-view. International Journal of Nursing Sciences, 5 (3), 287-300.
WHO. (2006). Working together for health: the World health report 2006: policy briefs : World Health Organization.

504
NURSE TURNOVER AND ITS COSTS
Sibel Meler, Şükrü Anıl Toygar
WHO. (2018). Fact sheets on HIV / AIDS for nurses and midwives . Retrieved from: https://apps.who.int/iris/bitstream/handle/10665/205044/B0190.pdf?sequence=1&isAllowed=y
Zimmerman, S., Gruber - Baldini, AL, Hebel, JR, Sloane, PD, & Magaziner, J. (2002). Nursing home facility risk factors for infection and hos-pitalization: importance of registered nurse turnover, administra-tion, and social factors. Journal of the American Geriatrics Society, 50 (12), 1987-1995.

505
30EFFECT OF NURSES’ USE OF TECHNOLOGY ON HOSPITAL COSTS Fadime Ulupınar1, Şükrü Anıl Toygar2
Introduction
In recent years, developed countries have shifted their priorities from a produc-tion-based economy to a service-based economy. Health attracts attention as an important sector that is at the center of both production and service activities in today’s society (Li & Benton, 2006). The development of information and com-munication technology is one of the most important factors affecting the health sector. However, it is important that the technologies planned to be used should have a characteristic that can positively affect the needs of the patient (Black et al., 2011). The rate of using advanced technology in the healthcare sector basi-cally determines the effect of the technology used on the bill of health services and patient satisfaction (Buntin, Burke, Hoaglin, & Blumenthal, 2011). In ad-dition, technology should improve communication between patients and health-care providers, increasing efficiency in service delivery and reducing waiting pe-riod (West, 2012). Technology should provide timely evaluation of the patient and allow rapid response to the patient (Meretoja et al., 2012).
Technology is changing so rapidly today that it is very difficult to predict possible health-related change scenarios even for the next decade (Risling, 2017). How-ever, the pace of change is expected to accelerate as the pressures for incremental maintenance costs continue to increase and new maintenance models are devel-oped (Huston, 2013). The increasing cost and quality expectation of healthcare services is one of the major challenges that puts pressure on the healthcare sector (Li & Benton, 2006). One of the reasons for the increase in the cost of diagno-sis and patient follow-up in healthcare services is probably the use of advanced
1 Karamanoğlu Mehmet Bey University2 Selçuk University

506
EFFECT OF NURSES’ USE OF TECHNOLOGY ON HOSPITAL COSTS
Fadime Ulupınar, Şükrü Anıl Toygar
technologies (Gölçek, 2018; Okpala, 2018). This study aims to examine the ef-fect of nurses’ use of technology on hospital costs.
Use of Technology and Costs in Healthcare
It is stated that the increase in technological progress positively affects patient satisfaction by proving that it increases the efficiency, quality, and positive per-ception of patients about the health service provision (Okpala, 2018). One of the main goals of health systems is to reduce the per capita costs of healthcare services (Agha, 2014). Therefore, there is a need to strike a balance between the pursuit of new technology as a way to improve the quality of care and reducing the per capita cost of healthcare (Okpala, 2018). Therefore, it should be evalu-ated whether the technologies adopted in the health system serve the purpose of reducing the cost of care (Okpala, 2018).
In the USA, the Centers for Medicare and Medicaid Services (CMS) predict that national health expenditures will grow 1.1 point faster than the average gross na-tional product in the 2019-2028 period, and the share of health in the economy is estimated to rise from 17.7 percent in 2018 to 19 percent in 2028 (CMS, 2020). It is argued that this unsustainable growth in healthcare services does not reflect the improvement in quality and health outcomes for the US population, and has reached a point where federal and state budgets cannot or cannot meet the expectations of employers and patients (Harris, 2014). The US spends about 2.5 times the average of other high-income countries on health. It is anticipated that financial and structural incentives used in the country may limit the poten-tial for better patient care outcomes and efficient resource allocation. Although the overuse of advanced medical technologies is partially demonstrated in the for-mation of high care costs (Shih et al., 2008), there is a view in the literature that high costs derive from poor quality patient care, excessive administrative costs, unnecessary services, inflated prices, prevention errors, and unrealistic costs (Ber-wick. & Hackbarth, 2012). Health services are considered to be more important than many other goods or services due to their non-postponable structure and their size in budget items. Although it is by far the first in the USA in terms of health expenditures, health metrics are in the opposite ranks in terms of qual-ity, access and efficiency measures (Salmond & Echevarria, 2017). The results of the studies show that the increase in costs is not a determinant alone in the out-comes of health services.

PERSPECTIVES ON MODERN ECONOMY
Aizhan KHOICH, Ali Eren ALPER, Ahmet Arif EREN
507
Technological advances are expected to improve patient and hospital manage-ment. One of the goals of using technology in the health sector is to improve ser-vice delivery (Köktaş & Gölçek, 2019) and increase patient satisfaction (Buntin et al., 2011). The US healthcare system is recognized among the global leaders in the development and adoption of new technologies (Holden & Karsh, 2010; Okpala, 2018). A study analyzing 24 different studies conducted in the USA to understand the impact of technological progress in the healthcare sector on the cost of healthcare services and patient satisfaction shows that there is a signifi-cant increase in the cost of healthcare services due to technological adaptation and other factors (Okpala, 2018). In this study, the cost increase due to the use of technology was found to be significantly higher in diagnosis (63%) and patient follow-up (51%) (Okpala, 2018). However, it was revealed that patients believed that the use of advanced technologies increased the quality of diagnosis (67%), patient follow-up (79%) and data recording (85%, P = 0.032) (Okpala, 2018).
Considering that hospital services constitute approximately 33% of total ex-penditures in the health expenditures category, it is seen that they have a signifi-cant financial impact (CMS, 2017). Hence, hospitals in healthcare have become the focus of increased attention on issues such as financial performance and pa-tient safety (L. Li & Benton, 2006; McFadden, Henagan, & Gowen III, 2009). In hospitals, there are differences in basic factors related to care, such as the de-velopment of equipment and information technology, changes in nursing skills, customer-oriented health initiatives and patient expectations.
Classification of Technology Use in Healthcare
Interactive and complex factors such as technological advances, capital invest-ments, patient outcomes and the need to balance cost savings create health-re-lated outcomes that are difficult to predict (Glasgow, Colbert, Viator, & Cavan-agh, 2018). The process of combining cost-reducing technologies with innovative business models in the business world “Disruptive innovation” and this situation corresponds in the health sector as a desire to transform into a quality but low cost and inclusive sector (Hwang & Christensen, 2008). It is anticipated that technological advancement and transformation will affect the current role of care personnel and will have major impacts on healthcare in terms of cost and quality management (L. Li & Benton, 2006; Salmond & Echevarria, 2017). It is stated that the lack of clinical information systems that have the capacity to

508
EFFECT OF NURSES’ USE OF TECHNOLOGY ON HOSPITAL COSTS
Fadime Ulupınar, Şükrü Anıl Toygar
collect and use digital data to improve care and the inconsistent use of decision support tools increase the quality problems in care (Shih et al., 2008). Value in healthcare can be considered as the ratio of quality and patient outcomes to cost (Salmond & Echevarria, 2017). In order to develop value tools, it is important to avoid costly mistakes and re-hospitalizations, to keep individuals healthy, to reward quality instead of the amount of work done, and to ensure proper pay-ment and task distribution by establishing a health information technology in-frastructure (Burwell, 2015).
Nurses are expected to be an active partner in the new health paradigm created by the trio of improving patient care experience (including quality and satisfac-tion), improving community health, and reducing the per capita cost of health care (Salmond & Echevarria, 2017). How the nursing workforce can be more actively involved in the technology-dependent future within this development and change is among the researches (Glasgow et al., 2018; Salmond & Echevar-ria, 2017). Nurses work in a rapidly changing environment and it is emphasized that they have to take an active role in using technology to improve patient out-comes (Salmond & Echevarria, 2017; Tiffin, 2012). It has been shown in studies conducted by various companies and organizations that Artificial Intelligence ap-plications can contribute to increase the quality of care and reduce costs by sup-porting healthcare services (Mesko, 2017).
The use of new technologies in US hospitals has increased from 16% in 2009 to 80% in 2013 (Charles, Gabriel, & Furukawa, 2013). Main areas of techno-logical advancement in the healthcare industry include storage of patient data (Black et al., 2011), virtual health services such as self-enrolling tele-health and self-service kiosks, remote monitoring tools used to monitor inpatients and dis-charged patients, and sensor technology. (Kang et al., 2010). Technologies used in the field of health services are classified in three different ways according to Locsin (Locsin, 2005).
1) Technology as a complement to human: These are technologies developed to pro-vide missing human parts such as prosthetic devices or to replace non-functional parts such as cardiac pacemakers.
2) Technology as tools and equipment that facilitate the care of people: These tech-nologies make it easier for people to practice caring for others. These technolo-gies are assistive devices designed and developed to improve human healthcare

PERSPECTIVES ON MODERN ECONOMY
Aizhan KHOICH, Ali Eren ALPER, Ahmet Arif EREN
509
activities. For example, the DaVinci Surgical System provides precision in sur-gical interventions (Hamet & Tremblay, 2017). With this tool, surgical inter-vention can be performed in very narrow and deep areas. The images obtained with the robotic surgery system allow the relevant region to be intervened with a three-dimensional image and a sense of depth. The robotic surgery system, with its “tremor scaling” feature, does not transmit the surgeon’s possible hand tremors during the operation to the instruments. In addition, these devices do not work outside the surgeon’s control. Penelope, a surgical robot arm that responds to the surgeon’s voice by working like a surgical nurse, knows surgical instruments such as scalpel, sponges, forceps etc. and can give the products to the surgeon and pre-vent the materials from being forgotten in the patient (Wachs, 2012).
3) Technology that imitates human beings: These technologies, usually with arti-ficial intelligence, are used or planned to be used in various fields in healthcare. These consist of humanoid robots, social assistant robots and devices that facil-itate life and improve health and provide personal treatment (Ekici, 2017). For example, TUG robots, which are among humanoid robots used today to trans-port medicines, materials, sheets and food, work for 16 hours and are charged for 8 hours. It is offered as a cost effective solution especially for the night shift (16-08 hours) (Ekici, 2017). Pepper robots, one of the social assistant robots, can use 20 different languages and are assigned at the reception in some hospitals in Belgium. Also, NAO robots, one of the social assistant robots, are used in patient rehabilitation and motivation in geriatric and pediatric services (Ekici, 2017).
Costs in Using Technology in Nursing Services and Costs of Medical Errors
In recent years, both researchers and practitioners have argued for the importance of investing in technology and enhancing the competence of healthcare profes-sionals (Li & Benton, 2006). Nurses are positioned to play an important role in the delivery and management of healthcare services. Nurses, as a profession group that contributes to all healthcare professionals in the process of change created by technology, provide uninterrupted and patient-centered care in the healthcare sector and direct performance outputs such as cost and quality. For this reason, nurses are recognized as quality and cost effective providers in the hospital envi-ronment (Salmond & Echevarria, 2017). The use of technology should be based on developing nurses’ skills and competencies. For example, the role of nurses in

510
EFFECT OF NURSES’ USE OF TECHNOLOGY ON HOSPITAL COSTS
Fadime Ulupınar, Şükrü Anıl Toygar
the application of information technologies has been recognized as an important factor contributing to the reduction of patient costs and improvement of ser-vice quality (Li & Benton, 2006). Education, skills and attitudes about patient care have changed by increasing the data obtained with technology. Focus is on patient centered care, coordination of care, data analytics and quality improve-ment. This situation in the sector also changes the demand for nurses. That is, hospitals with more technology demand more skilled and knowledgeable nurs-ing staff (Spetz & Maiuro, 2004). Another point that needs to be considered is that the application of technology for nurses should be complementary to their current skills and abilities. Since nurses are an important professional group in shaping this process, they should understand the factors that direct change, and gain the authorities and competencies (knowledge, skills and attitudes) that will be required to accelerate the change process and increase their personal success and team success (Salmond & Echevarria, 2017).
Nurses with sufficient clinical experience and technology competence can provide valuable information on the use and design of information technology. Nurses are task oriented practical professionals; therefore, technology is required in applica-tions such as nurse training, competence, and staff empowerment. Technological practice should be integrated into decisions regarding nursing services manage-ment. The path to better and more effective use of technology is through educa-tion and the development of nurses (Li & Benton, 2006). Moreover, the fact that nursing activities affect two important performance outcomes such as cost and quality increases the importance of using technology in nurses. In terms of nurs-ing services, it is also among the data obtained that management decisions affect customer satisfaction, improve the use of resources, reduce the cost per patient with timely intervention (Siferd & Benton, 1994). When evaluated in terms of nursing care, it is argued that technology improves quality care, improves patient outcomes and reduces costs by providing care coordination. It is argued that ad-verse events such as unnecessary hospitalizations, unnecessary emergency service use, repeated diagnostic tests, repeated medical histories, repeated prescriptions and adverse drug interactions will decrease (Salmond & Echevarria, 2017). Treatment and care costs have become a concern, especially for people with chronic diseases and institutions that finance healthcare services (Salmond & Echevarria, 2017).
The use of technology in nursing services is a result of increasing demands in the health sector despite the lack of personnel (Sandelowski, 1993). Ten years ago,

PERSPECTIVES ON MODERN ECONOMY
Aizhan KHOICH, Ali Eren ALPER, Ahmet Arif EREN
511
practices in care services were carried out by taking advantage of nurses’ own ob-servations and experiences or the experiences of healthcare professionals in their social environment. Today, devices that can make precise measurements are used, but these outputs are interpreted by healthcare professionals based on the elec-tronic data and care services are provided accordingly. Ten years from now, it is planned to use artificial intelligence that integrates data from a large number of devices that can make precise measurements, evaluate them using expanded elec-tronic records and prepare action plans. In this near future, nurses will carry out the task of becoming the implementer of these technological plans and meeting their humanitarian care needs. In the longer future, many actions in maintenance service are predicted to be performed robotically (Williamson, 2015).
In 2015, the National League for Nursing called for action to increase the knowl-edge of technological applications among nurses and to better prepare nursing care services for the future (Caring). Extended electronic records will play an im-portant role in healthcare in the coming years. Technology will provide fast and effective solutions for issues such as protection and storage of collective health-re-lated data, access of healthcare providers, cooperation, contributing, controlling and feedback (Risling, 2017).
Glasgow (2018) emphasized that nurses should not only be users of advanced technology for care in the future, and stated that nurses should take a more pro-active role in the changing clinical environment, in the design of researches, in the planning of new health devices, and in the policies determining care meth-ods (Glasgow et al., 2018). As one of the examples of this situation, the telero-botic smart nursing assistant who carries out patients with infectious diseases and reduces the risk of healthcare providers was designed by Duke University nurs-ing and engineering students in 2014 (Morgan, C. (2016) Akt. (Glasgow et al., 2018). It is thought that the widespread use of this technology, designed after the Ebola epidemic, may be effective in protecting healthcare personnel in the event of COVID-19 and similar infectious diseases that spread all over the world in 2020. At the Beth Israel Deaconess Medical Center, engineers at the Massa-chusetts Institute of Technology have shown that it is a valid method to calcu-late a care requirement independent of the number of patients (claimed to be not the same for each patient) with the help of computer simulation. Similarly, it is recommended to use simulations to improve clinical resource management for nurses, doctors and engineers (Molina et al., 2018)

512
EFFECT OF NURSES’ USE OF TECHNOLOGY ON HOSPITAL COSTS
Fadime Ulupınar, Şükrü Anıl Toygar
Nursing care costs make up a large part of the hospital budget and have become the largest labor cost (Welton, Fischer, DeGrace, & Zone-Smith, 2006). The main reasons for the increase in nursing costs are the increasing complexity of care and the decrease in hospital stay (Graf, Millar, Feilteau, Coakley, & Erickson, 2003). Although the reduced hospitalization periods seem to reduce nursing costs in the first place, the researchers suggest that the care intensity of the patients is higher with shorter periods of stay (Welton et al. 2006). The cost increase in hospitals has created more demand for nurses, resulting in increased nurses’ wages as well as an increase in nurses / patients ratios (Chiang, 2009).
In addition to the lack of healthcare professionals worldwide, it is known that ag-ing personnel also create an additional labor shortage (WHO, 2016). In addition to the increase in life expectancy and the number of chronic patients, the demand for the health system is constantly increasing (Mesko, 2017). Lack of access to care and quality difference in service provision emerges as a worldwide problem. In the lack of workforce, it is observed that the demands of competent nurses to use technological applications increase.Technology is a tool that can be used to transform sick individuals into healthy individuals with reasonable efficiency, rather than being a stand-alone remedy for labor shortages (Li & Benton, 2006).
It is stated that hospitals need to invest in expensive and visible devices and pro-cedures to survive in the competitive market (Spetz & Maiuro, 2004). A study based on data from all hospitals in California over a seven-year period from 2007 to 2013 revealed that the amount of investment in both the care process and nurses and technology was small in competitive markets (Wani, Malhotra, & Venkat-araman, 2018). The results show that the care process has been pushed to the background in more competitive markets because managers focus their priorities on maintaining and increasing their market share by making investments that can be easily demonstrated to doctors and patients (Wani et al., 2018). The im-portant point here is that on the one hand, hospitals use innovative technologies to appeal to patients, doctors and insurers in the short term, on the other hand, they distance nurses from making holistic improvements for the technology-re-lated care process (Wani et al., 2018). The same study highlights that ‘observa-ble’ characteristics of quality may be more important for managers in competi-tive environments than characteristics that cannot be observed or less understood by users (Wani et al., 2018).

PERSPECTIVES ON MODERN ECONOMY
Aizhan KHOICH, Ali Eren ALPER, Ahmet Arif EREN
513
In a study conducted by Li and Benton (2006), it was stated that considering that 10% of the hospitals in the USA had closed in the last 15 years, the effect of following the technology on important indicators such asn consumer satisfac-tion, quality and cost is considerably high (Li & Benton, 2006). It has been found that hospitals in urban centers with large bed capacities tend to invest more in equipment and technology than hospitals with fewer beds or in rural areas, and small hospitals in rural areas tend to pay more attention to staff development (Li & Benton, 2006) . In the same study, it was emphasized that technology and nursing services management is very important for managers to achieve the goal of providing quality services at a reasonable cost (Li & Benton, 2006). Hospitals with a high number of beds have a higher healthcare capacity, so the time to tol-erate the cost of investments in technology is shorter (Carpenter, 2004). Changes in organizational structure, business processes and employee skill requirements with the application of new technologies are also mentioned in different studies (Ball, Weaver, & Abbott, 2003; Carpenter, 2004; Kazahaya, 2005).
Today, the technology demand of hospitals in all categories is increasing. At the same time, many hospitals have experienced difficulties in applying new technol-ogies. Many researchers state that development of labor, skills, and technology are complementary to nursing care and that nurses should improve their compe-tence in the application of information technologies (Ball et al., 2003; Kazahaya, 2005; Roth, Johnson, & Short, 1996). Many studies have revealed that the tech-nologies used in hospitals have positive relationships between nursing manage-ment, cost, quality and performance increase in health services (Ball et al., 2003; Berwick, Godfrey, & Roessner, 1991; Donabedian, 1982; Fetter, Shin, Freeman, Averill, & Thompson, 1980; Kirkman-Liff, 2002; L. Li & Benton, 2003; LX Li & Benton, 1996; Organizations, 1996). When nurses are trained to use technol-ogy effectively, there is a significant reduction in costs and quality improvements in health services (Ball et al., 2003; Kirkman-Liff, 2002). However, technology is not a solution that will directly improve quality. On the contrary, technology is a tool for resolving problems better (Carpenter, 2004).
With the use of current technologies, it is possible to monitor patients with elec-tronic medical record system, computerized order entry system, Radiofrequency identification (RFID) and hospital-independent e-prescription, equipment track-ing, and monitors (Altındiş, 2009). The use of these technologies not only gives the opportunity to reduce errors that may develop in healthcare institutions by

514
EFFECT OF NURSES’ USE OF TECHNOLOGY ON HOSPITAL COSTS
Fadime Ulupınar, Şükrü Anıl Toygar
writing safe and easy prescriptions, but also allows the application of new meth-ods by offering different communication opportunities to healthcare professionals. Wireless technologies that simultaneously provide information exchange within the hospital and put into practice in medical science are other new technologies that support patient safety (Altındiş, 2009). These technologies, which facili-tate patient follow-up, give healthcare professionals the opportunity to intervene quickly with the immediate notification of important (vital) changes in the pa-tient and reduce the risk of medical errors (Altındiş, 2009).
Medical errors also lead to huge financial losses. The cost of medical errors in the UK is estimated to be $ 6 billion annually (Slonim, LaFleur, Ahmed, & Joseph, 2003). According to the American Medical Institute, on the other hand, the phys-ical, financial and social costs of medical errors in the United States are estimated to be between $ 17-29 billion (Donaldson, Corrigan, & Kohn, 2000). Again, in a different study conducted in the USA, it was stated that eighteen patient safety indicators caused an annual expenditure of 9.3 billion dollars (Zhan & Miller, 2003). When we consider the opportunity costs, medical errors have serious neg-ative consequences. The additional costs incurred for the treatment of the adverse health condition caused by repeated laboratory tests, repeated drug treatments and medical error lead to increases in health insurance premiums and therefore these additional expenses cannot be used in alternative areas. Medical errors also cause loss of motivation in healthcare providers, insecurity in patients and physicians, and dissatisfaction with the health system in the community. All of these lead to inefficiency / unproductivity in healthcare workers and ultimately to various problems in the health status of the society (Top, Gider, Taş, & Çimen, 2008).
Conclusion
The use of technology in the health sector is increasing. This situation brings about change and transformation in nurses’ roles. Therefore, nurses should not remain only users of technology, but should take an active role in this changing clinical environment, in the design of researches, in the planning of new health devices, and in policies that determine care methods. Technology should not be seen as a solution to the global nurse crisis. Technology is not a substitute for nursing staff, but is considered as a complement to nurses’ knowledge, skills and competencies.

PERSPECTIVES ON MODERN ECONOMY
Aizhan KHOICH, Ali Eren ALPER, Ahmet Arif EREN
515
The use of technology in nursing services positively affects many indicators such as quality, performance and cost. Technology increases coordination among health-care professions and substantially prevents medical error costs. The use of tech-nology reduces waiting periods, reduces patient intervention time, improves com-munication with the patient, thus increasing patient satisfaction.
Although many positive effects of technology have been proven, the use of tech-nology is suggested as one of the reasons for the increasing costs of healthcare ser-vices. However, the positive effects on quality and performance outcomes such as not evaluating the short-term cost of using technology, ensuring patient satisfac-tion, employee motivation, and eliminating unnecessary practices, repeated hos-pitalizations, and preventing medical errors should not be ignored.
References
Agha, L. (2014). The effects of health information technology on the costs and quality of medical care. Journal of health economics, 34 , 19-30.
Altındiş, S. (2009). Approaches that reduce medical errors. Journal of Health Thought and Medical Culture, 12
Ball, MJ, Weaver, C., & Abbott, PA (2003). Enabling technologies promise to revitalize the role of nursing in an era of patient safety. International Journal of Medical Informatics, 69 (1), 29-38.
Berwick, DM, Godfrey, BA, & Roessner, J. (1991). Curing health care: new strategies for quality improvement. The Journal for Healthcare Quality (JHQ), 13 (5), 65-66.
Berwick, DM, & Hackbarth, AD (2012). Eliminating waste in US health care. Jama, 307 (14), 1513-1516.
Black, AD, Car, J., Pagliari, C., Anandan, C., Cresswell, K., Bokun, T.,. . . Sheikh, A. (2011). The impact of eHealth on the quality and safety of health care: a systematic overview. PLoS med, 8 (1), e1000387.
Buntin, MB, Burke, MF, Hoaglin, MC, & Blumenthal, D. (2011). The bene-fits of health information technology: a review of the recent liter-ature shows predominantly positive results. Health affairs, 30 (3), 464-471.
516
EFFECT OF NURSES’ USE OF TECHNOLOGY ON HOSPITAL COSTS
Fadime Ulupınar, Şükrü Anıl Toygar
Burwell, SM (2015). Setting value-based payment goals — HHS efforts to improve US health care. N Engl J Med, 372 (10), 897-899.
Caring, I. A VISION FOR The Changing Faculty Role: Preparing Students for the Technological World of Health Care.
Carpenter, D. (2004). Capital and IT. Hospitals & health networks, 78 (5), suppl 7.
Charles, D., Gabriel, M., & Furukawa, MF (2013). Adoption of electronic health record systems among US non-federal acute care hospitals: 2008-2012. ONC data brief, 9 , 1-9.
Chiang, B. (2009). Estimating nursing costs — a methodological review. Inter-national journal of nursing studies, 46 (5), 716-722.
CMS (2017). National Health Expenditure Highlights 2017.
CMS 2020 Projected NHE, 2019-2028. Retrieved from https://www.cms.gov/Research-Statistics Gömlek-and-Systems/Statistics-Trends-and-Re-ports/NationalHealthExpendData/NHE-Fact-Sheet
Donabedian, A. (1982). The criteria and standards of quality / Health admin-istration Press. Ann Arbor .
Donaldson, MS, Corrigan, JM, & Kohn, LT (2000). To err is human: building a safer health system (Vol. National Academies Press.
Ekici, D. (2017). Healthcare management (Vol. 106): Sim Matbaacılık Ltd. Sti.
Fetter, RB, Shin, Y., Freeman, JL, Averill, RF, & Thompson, JD (1980). Case mix definition by diagnosis-related groups. Medical care, 18 (2), i-53.
Glasgow, MES, Colbert, A., Viator, J., & Cavanagh, S. (2018). The nurse - engineer: A new role to improve nurse technology interface and patient care device innovations. Journal of Nursing Scholarship, 50 (6), 601-611.
Gölçek, A. G. (2008). The Contribution of the Private Health Sector in Turkish Economy: A Review From 2002-2017. A. Gorecka, A. M. Köktaş, & A. Parlinska (Eds.), In Economic Issues in Retrospect and Prospect II. London: IJOPEC Publication.
Graf, CM, Millar, S., Feilteau, C., Coakley, PJ, & Erickson, JI (2003). Patients’ needs for nursing care: beyond staffing ratios. JONA: The Journal of Nursing Administration, 33 (2), 76-81.

PERSPECTIVES ON MODERN ECONOMY
Aizhan KHOICH, Ali Eren ALPER, Ahmet Arif EREN
517
Hamet, P., & Tremblay, J. (2017). Artificial intelligence in medicine. Metabo-lism, 69 S36-S40.
Harris, MB (2014). Massachusetts Health care reform and orthopaedic trauma: Lessons learned. Journal of orthopedic trauma, 28 S20-S22.
Holden, RJ, & Karsh, B.-T. (2010). The technology acceptance model: its past and its future in health care. Journal of biomedical informatics, 43 (1), 159-172.
Huston, C. (2013). The impact of emerging technology on nursing care: Warp speed ahead. The Online Journal of Issues in Nursing, 18 (2nd).
Hwang, J., & Christensen, CM (2008). Disruptive innovation in health care delivery: a framework for business-model innovation. Health af-fairs, 27 (5), 1329-1335.
Kang, HG, Mahoney, DF, Hoenig, H., Hirth, VA, Bonato, P., Hajjar, I.,. . . Aged, ITWG o. AA t. PM ft (2010). In situ monitoring of health in older adults: technologies and issues. Journal of the American Geriatrics Society, 58 (8), 1579-1586.
Kazahaya, G. (2005). Harnessing technology to redesign labor cost manage-ment reports: labor costs typically represent over 50 percent of a hospital’s total operating expenses. Can the data management process be harnessed to create meaningful labor cost management tools? Healthcare Financial Management, 59 (4), 94-101.
Kirkman-Liff, B. (2002). Keeping an eye on a moving target: quality changes and challenges for nurses. Nursing Economics, 20 (6), 258.
Köktaş, A. M., & Gölçek, A. G. (2019). Globalization and health: an eval-uation on Turkey. A. A. Eren, & A. M. Köktaş (Eds.), Dynamics of Globalization at the Crossroads of Economics. Berlin: Peter Lang.
Li, L., & Benton, W. (2003). Hospital capacity management decisions: Em-phasis on cost control and quality enhancement. European Journal of Operational Research, 146 (3), 596-614.
Li, L., & Benton, W. (2006). Hospital technology and nurse staffing manage-ment decisions. Journal of Operations Management, 24 (5), 676-691.

518
EFFECT OF NURSES’ USE OF TECHNOLOGY ON HOSPITAL COSTS
Fadime Ulupınar, Şükrü Anıl Toygar
Li, LX, & Benton, W. (1996). Performance measurement criteria in health care organizations: Review and future research directions. European Journal of Operational Research, 93 (3), 449-468.
Locsin, RC (2005). Technological competency as caring in nursing: A model for practice : Sigma Theta Tau International Indianapolis, IN.
McFadden, KL, Henagan, SC, & Gowen III, CR (2009). The patient safety chain: Transformational leadership’s effect on patient safety cul-ture, initiatives, and outcomes. Journal of Operations Management, 27 (5), 390-404.
Meretoja, A., Strbian, D., Mustanoja, S., Tatlisumak, T., Lindsberg, PJ, & Kaste, M. (2012). Reducing in-hospital delay to 20 minutes in stroke thrombolysis. Neurology, 79 (4), 306-313.
Mesko, B. (2017). The role of artificial intelligence in precision medicine: Tay-lor & Francis. 2:5, 239-241. doi:10.1080/23808993.2017.1380516
Molina, RL, Gombolay, M., Jonas, J., Modest, AM, Shah, J., Golen, TH, & Shah, NT (2018). Association between labor and delivery unit census and delays in patient management: findings from a comput-er simulation module. Obstetrics & Gynecology, 131 (3), 545-552.
Okpala, P. (2018). Assessment of the influence of technology on the cost of healthcare service and patient’s satisfaction. International Journal of Healthcare Management, 11 (4), 351-355.
Organizations, JC o. A. o. H. (1996). Accreditation manual for hospitals : Joint Commission on Accreditation of Healthcare Organizations.
Risling, T. (2017). Educating the nurses of 2025: Technology trends of the next decade. Nurse education in practice, 22 , 89-92.
Roth, AV, Johnson, SP, & Short, NM (1996). Strategic deployment of technol-ogy in hospitals: Evidence for reengineering Managing technology in healthcare (pp. 189-214): Springer.
Salmond, SW, & Echevarria, M. (2017). Healthcare transformation and chang-ing roles for nursing. Orthopedic nursing, 36 (1), 12.
Sandelowski, M. (1993). Toward a theory of technology dependency. Nursing Outlook, 41 (1), 36-42.

PERSPECTIVES ON MODERN ECONOMY
Aizhan KHOICH, Ali Eren ALPER, Ahmet Arif EREN
519
Shih, A., Davis, K., Schoenbaum, S., Gauthier, A., Nuzum, R., & McCarthy, D. (2008). Organizing the US health care delivery system for high performance (Vol. 59): New York: The Commonwealth Fund.
Siferd, SP, & Benton, W. (1994). A decision modes for shift scheduling of nurses. European Journal of Operational Research, 74 (3), 519-527.
Slonim, AD, LaFleur, BJ, Ahmed, W., & Joseph, JG (2003). Hospital-reported medical errors in children. Pediatrics, 111 (3), 617-621.
Spetz, J., & Maiuro, LS (2004). Measuring levels of technology in hospitals. The quarterly review of economics and finance, 44 (3), 430-447.
Tiffin, C. (2012). Beyond the bedside: The changing role of today’s nurses. Retrieved on March, 23 , 2012.
Top, M., Gider, Ö., Taş, Y., & Çimen, S. (2008). Physicians’ evaluation of fac-tors causing medical errors: A field study from Kocaeli. Hacettepe Journal of Health Administration, 11 (2), 161-200.
Wachs, JP (2012). Robot, pass me the scissors! how robots can assist us in the op-erating room. Paper presented at the Iberoamerican Congress on Pattern Recognition.
Wani, D., Malhotra, M., & Venkataraman, S. (2018). Impact of competition on process of care and resource investments. Journal of Operations Management, 57 , 23-35.
Welton, JM, Fischer, MH, DeGrace, S., & Zone-Smith, L. (2006). Hospital nursing costs, billing, and reimbursement. Nursing Economics, 24 (5), 239.
West, D. (2012). How mobile devices are transforming healthcare. Issues in technology innovation, 18 (1), 1-11.
WHO. (2016). Health Workforce requirements for universal health coverage and the Sustain Dev goals. Retrieved from: https://www.who.int/hrh/resources/health-observer17/en/
Williamson, B. (2015). Algorithmic skin: Health-tracking technologies, per-sonal analytics and the biopedagogies of digitized health and phys-ical education. Sport, education and society, 20 (1), 133-151.
Zhan, C., & Miller, MR (2003). Excess length of stay, charges, and mortality attributable to medical injuries during hospitalization. Jama, 290 (14), 1868-1874.


521
31DOES 19TH-CENTURY FRANCE EXPLAIN LÉON WALRAS?Hüsnü Bilir1, Vural Başaran2
1. Introduction
“Leon Walras is the Isaac Newton of neoclassical economics” (Koppl, 1995, p. 43).
Léon Walras is one of the most significant figures in the history of economics. He was one of the founding fathers of neoclassical economics and wrote three im-portant works: Studies in Social Economics3 (1896), Studies in Applied Economics: Theory of the Production of Social Wealth4 (1898), and Elements of Pure Economics or the Theory of Social Wealth5 (1874). Walras offered three economic categories within the scope of these works: pure economics, applied economics, and social economics. To this end, he argued that pure economics was science, while ap-plied economics as art, and social economics was ethics.
Yet Walras’s most well-known work proves to be Elements. One, thus, firstly thinks of an abstract, mathematical economic analysis when Walras is mentioned.6 In Schumpeter’s words ‘so far as pure theory is concerned, Walras is (…) the greatest of all economists’ (Schumpeter, 1954, p. 827).7 Jaffé, too, characterized Walras’s general equilibrium system as the most general, comprehensive and equable sys-tem up to date (Walker, 1983b, p. 131). As was also stated by Friedman, Walras’s Elements is extremely significant in the development of economics as a scientific
1 Department of Sport Management, Aksaray University, [email protected] Department of the History of Science, Ankara University, [email protected] Original title: Études d’économie sociale; Théorie de la répartition de la richesse sociale. Hereafter
referred to as Social Economics.4 Original title: Études d’économie politique appliquée; Théorie de la production de la richesse
sociale. Hereafter referred to as Applied Economics.5 Original title: Elements d’économie pure, ou théorie de la richesse sociale. Hereafter referred to
as Elements.6 For a study emphasising the social aspects of Walras’ Works see. (Renato, 1984). 7 Schumpeter also characterized Walras as the ‘great master of exact theory’ in another work.
Cited in (Richard, 2002, p. 41)
522
DOES 19TH-CENTURY FRANCE EXPLAIN LÉON WALRAS?
Hüsnü Bilir, Vural Başaran
discipline (Milton, 1955, p. 900). Within this framework Walras has been char-acterized as one of the cornerstones of the process through which economics was born as a ‘scientific’ discipline and has been identified with the general equilib-rium theory. This is the reason why Walras is considered to boil down to the gen-eral equilibrium theory or, in his own words, to ‘pure economics.’
However, not only does an abstract economic construct built on a conception of the individual acting on economic motives –homo-æconomicus- and based on a mathematical formulation secure themselves a place in Walras’s economic analysis, but also one can find an understanding of economics in which a con-ception of a human being who did not sever his/her ties with the society is in-volved along with the contingent presence of economic, social, historical and cultural elements. It can even be argued that Walras’s primary objective was to analyze the conditions within which he lived, in other words, the socio-eco-nomic status of 19th-century France. In that case, did these conditions in ques-tion influence Walras’s economic analysis when he attempted to explain them? The argument of this study refers to the fact that the conditions within which Walras lived had an effect on the emergence and the evolutionary development of his economic analysis. Because Walras started out seeking a solution to the issue of ‘social question’ or ‘social justice’, which he regarded as the most sig-nificant issue of the age, but gave up studying social issues upon his father’s suggestion who was an economist just like him and turned towards a purely mathematical economic analysis.
Thus, Walras started out his analysis with the ‘social justice’ issue in line with the conditions of the age he was living in but focused on the ‘theory of pure econom-ics’ later on. But what were the reasons for this kind of transformation in Walras’s economic thought? How can this transformation be interpreted from the per-spective of history of science? In other words, were the internal dynamics of sci-ence or socio-economic conditions more influential on Walras’s mindset? Within this framework, firstly the internalist and externalist views in the history of sci-ence will be dwelt upon followed by an attempt to answer the question ‘Does 19th-century France explain Walras?’ by studying the ways in which Walras’s eco-nomic analysis was born and shaped.

PERSPECTIVES ON MODERN ECONOMY
Aizhan KHOICH, Ali Eren ALPER, Ahmet Arif EREN
523
2. Approaches in the Historiography of Science
Engaging in the historiography of sciences refers at the same time to writing intel-lectual history. A distinction, however, was placed between the history of sciences and the history of thought having been influenced by positivist philosophy devel-oped by Auguste Comte. With the great accomplishment of natural sciences like physics and chemistry in the 18th and 19th centuries, other scientific disciplines started to adopt the methods of these sciences in question as well. In particular, the 20th century points out to a period when the method, output, and objectiv-ity of science was opened up for discussion from the philosophical and sociolog-ical perspectives. The subject matter of this study is the approaches of those who engaged in such debates rather than the discussions themselves. Therefore, these debates will not be discussed in detail.
Historiography of science in the 20th century was shaped by discussions on the concept of ‘Scientific Revolution.’ This concept was utilized by both those who propounded a gradual and continuous progress and those who argued that there had been great ruptures in the early modern period (Nnaji & Luján, 2016, p. 101). Among those who shaped such debates one can find great figures like Marx-ist historian Boris Hessen, contextualists Robert K. Meton, Joseph Needham, Thomas S. Kuhn and Steven Shapin, representatives of the physico-mathemati-cal wing Herbert Butterfield, Alfred R. Hall and Alexandre Koyré (Nnaji & Lu-ján, 2016, p. 99). Historiography of science was molded on the basis of an in-ternalist-externalist dichotomy with these figures.
2.1. The Internalist Approach
Those who developed the internalist approach to the history of sciences under-lined the necessity that one had to regard the internal operations or the logic of science itself when conducting research in that specific field. Such historians as Alexandre Koyré, Alfred Rupert Hall and Edward Grant adopted this view. The great historian of science, Koyré, clearly put forth this approach:
It (…) seems to me vain to attempt to deduce the existence of Greek science from the social structure of the city state, or even from the agora. Athens does not ex-plain Eudoxus, or Plato, any more than Syracuse explains Archimedes; or Flor-ence, Galileo. (…) The social structure of England in the seventeenth century cannot explain Newton… (Koyré, 1963, p. 855)
524
DOES 19TH-CENTURY FRANCE EXPLAIN LÉON WALRAS?
Hüsnü Bilir, Vural Başaran
Hall is another historian of science who propounded the internalist approach. Ac-cording to Hall, the mathematical structure of science was the moving force rather than its socio-cultural or economic background. Accordingly, science was only able to accomplish a revolutionary leap thanks to the mathematical transforma-tion witnessed in the structure of sciences. The scientific research of Galileo and Newton was shaped over this principle. The physico-mathematical structure of sciences proved to be the distinctive element of the early modern period. Accord-ing to Koyré and Hall, ‘It was no more meaningful to search for the economic and social roots of Newton’s Principia than it was to seek the economic and social roots of Immanuel Kant’s Critique of Pure Reason’ (Nnaji & Luján, 2016, p. 104).
Hall argued in his study on ballistics evaluating Newton’s work that there was no such link between war industry and theory, at least until the 19th century (Hall, 2009). Hall openly stated this in his study on ballistics:
Thus when Hessen wrote that the scheme of seventeenth-century physics ‘was mainly determined by the economic and social tasks which the rising bourgeoi-sie raised to the forefront’ he was guilty of a gross anachronism, since the level of physics which Newton approaches in the Principia was only reached by an original intellectual process, not directly from the empirical industry of his day (Hall, 2009, p. 163).
Edward Grant, in his book on science in the Middle Ages entitled Physical Science in the Middle Ages (1971), hardly mentions the economic or social conditions of the Middle Ages and the ensuing period when he talks about how Copernicus was able to succeed in bringing about a revolution. His primary focus shifts to the problem of scholastics’ dedication to Aristotle and his philosophy. This dedica-tion, however, lies in the failure to develop a scientific understanding that would destroy the Kuhnian paradigm rather than a commitment to that paradigm. Co-pernicus paved the way to revolution as he regarded hypotheses as the fundamen-tal truth of the physical universe. He was succeeded by Galileo, Kepler, Descartes and Newton who finalized the revolution (Grant, 1977). In brief, those who ar-gued that the history of science could be understood through an internalist read-ing put forth that sciences had unique internal dynamics and the stages of scien-tific progress could be determined in the wake of understanding these dynamics.

PERSPECTIVES ON MODERN ECONOMY
Aizhan KHOICH, Ali Eren ALPER, Ahmet Arif EREN
525
2.2. The Externalist Approach
Boris Hessen, speaking on behalf of the Soviet delegation at the history of science congress held in London in 1931, presented a paper capable of igniting a fun-damental change in reading the history of science. Referring to mathematician Whitehead’s argument that ‘our modern civilization is due to the fact that in the year when Galileo died, Newton was born’, Hessen asserted that such a reading of history of science attributed the ‘phenomenon of Newton to the benevolence of divine providence’ and to ‘his personal genius’ (Hessen, 2009, p. 41). The au-thor offered a reading of Newton based on a Marxist theory of history and ap-plied the method of dialectical materialism in this study. One can comprehend Hessen’s approach to the whole better if the events that he drew attention to and established a correlation between in this study, which also functioned as a guide-book for externalist readings, are to be mentioned briefly.
Hessen highlighted economic structure and industry while assessing Newton’s work. Therefore, Hessen endeavored to describe the conditions of ‘economics, technology and physics’ of Newton’s era before talking about Newton himself. He said that what lied in the background of the success of natural sciences was technological progress:8
The dazzling flowering of natural science during the 16th and 17th centuries re-sulted from the disintegration of the feudal economy, the development of mer-chant capital, of international maritime relations and of heavy (mining and met-allurgical) industry (Hessen, 2009, p. 44).
Hessen attributed the development of hydrostatics to maritime trade, of mechan-ics to heavy industry and arms manufacture, trajectory, while he correlated the birth of modern science with overall external factors.
Robert K. Merton, who is also one of the founders of sociology of science, pointed out that it was impossible to think of research conducted by scientists independ-ent of the socio-cultural structure and emerged as a potent tendency within the
8 In the chapter ‘Anteil der Arbeit an der Menschwerdung des Affen’ (The Part Played by Labor in the Transition from Ape to Man) in Dialektik der Natur (Dialectics of Nature), which is one of the most fundamental and classic works in Marxist literature, Engels called attention to the decisive role played by erect posture and use of hands in transition from ape to man. (Engels, 2013, pp. 126–127). This stress on grip and use of tools renders the fact that technology precedes science and mind meaningful for Marxist literature.

526
DOES 19TH-CENTURY FRANCE EXPLAIN LÉON WALRAS?
Hüsnü Bilir, Vural Başaran
externalist approach (Nnaji & Luján, 2016, p. 103).9 Merton in the introduc-tion to his work ‘The Normative Structure of Science’ wrote: ‘Science, like any other activity involving social collaboration, is subject to shifting fortunes’ (Mer-ton, 1973). He, then, went on to argue that there were connections between Eng-lish Puritanism and the rise of modern science, which subsequently became the target of strong criticism (Nnaji & Luján, 2016, p. 103). Moreover, the Mer-tonian perspective came to occupy a significant place in studies in the 20th cen-tury conducted on the social structure of scientific research and scientific ethos.
Kuhn suggested in The Structure of Scientific Revolutions (Kuhn, 2012) that sci-entific activity was a mere puzzle-solving activity undertaken by a community of scholars. Normal science, seeing anomalies, the stage of crisis, conversion of the community of scholars to a new paradigm followed by the same process all over again… The primary motivation during the period of normal science is the very paradigm ascertained by the community of scholars or the epistemic community along with the puzzle-solving activity within this paradigm. In brief, they consider scientific activity to be a social process in sheer opposition to the internalists’ view.
Imre Lakatos discussed internalism and externalism in the historiography of sci-ence in his ‘History of Science and Its Rational Reconstructions’ (Lakatos, 1971). Lakatos stood somewhere in between these two approaches. He suggested writ-ing for the history of science as such:
a) Philosophy of science provides normative methodologies in terms of which the historian reconstructs ‘internal history’ and thereby provides a rational explana-tion of the growth of objective knowledge; b) two competing methodologies can be evaluated with the help of (normatively interpreted) history; c) any rational reconstruction of history needs to be supplemented by an empirical (socio-psy-chological) ‘external history’ (Lakatos, 1971, p. 91).
Lakatos attributed primary significance to internal history while external history could merely assume a complementary role to it. In his own words:
But some of external history’s most crucial problems can be formulated only in terms of one’s methodology; thus internal history, so defined, is primary, and
9 Such a blend of the socio-cultural approach and the internalist understanding may suggest an answer as to why scientific activities in the Ottoman/Islamic world came to a halt as well. For further information see: (Demir, 2015).

PERSPECTIVES ON MODERN ECONOMY
Aizhan KHOICH, Ali Eren ALPER, Ahmet Arif EREN
527
external history only secondary. Indeed, in view of the autonomy of internal (but not of external) history, external history is irrelevant for the understanding of sci-ence (Lakatos, 1971, p. 92).
These two approaches to the historiography of science seem to be reconciled in favor of the internalists by Lakatos. A schematic summary, thus, reveals that inter-nalist history studies the very methodology of science itself while externalist his-tory studies the socio-cultural and economic motivations that underlie the works of scientists. While the former emerges as an intellectual conception of history, the latter emerges as a social conception of history.
3. The Background of Walras’s Economic Analysis
Walras is considered to be the founding father of neoclassical economics in the history of economic thought and is identified with the abstract ‘general equilib-rium analysis.’ Yet it is seen that Walras was interested in the problems of his age and endeavored to find a solution to what he called the ‘social question’ before embarking on this abstract and mathematical kind of analysis. Therefore, one first needs to briefly look at the socio-economic conditions of Walras’s age.
Murray Bookchin, one of the most significant American anarchists and activists of the 20th century, described France on the eve of the 1789 Revolution as ‘cha-otic, often dizzying collage of administrative and religious jurisdictions, traditions inherited from centuries past, enormous disparities in privilege, and cultural ar-chaisms’ (Bookchin, 1996, p. 251). Neither the aristocrats nor the bourgeoisie had a monopoly on the French Revolution that ignited irrevocable changes in al-most all continents, prominently Europe. It was the accomplishment of the lower middle strata of the people in its fullest sense:
Having moved to Paris from rural villages and towns, these people (who joined the Storming of the Bastille) lived in cultural tension between the slower rhythms and natural surroundings of rural life, and the faster, seemingly artificial pace of city life. They would have been inclined to favor a fairly egalitarian society of pro-vincial craftspeople and farmers, who traditionally enjoyed the competence and freedom to create their own chosen lifeways. During the Revolution their sense of independence, whether real or imaginary, would guide them toward a fairly de-centralistic social structure and an economy based on intimate ties between buy-ers and sellers—in short, toward a direct democracy based on a moral economy

528
DOES 19TH-CENTURY FRANCE EXPLAIN LÉON WALRAS?
Hüsnü Bilir, Vural Başaran
rather than a representative republic structured around profit-making and acqui-sition (Bookchin, 1996, p. 280).
This judgment sounds pertinent when one takes into account those who were involved in the Storming of the Bastille, the climax of French Revolution. The assembly founded in France after the revolution adopted and issued the Declara-tion of the Rights of Man and of the Citizen (Déclaration des Droits de l’Homme et du Citoyen). This declaration which was also characterized by its being a guide-book to specifically the struggles in the 19th century –not only in France but vir-tually in all Continental Europe— was shaped around Article 1 which prescribed that ‘men are born and remain free and equal in rights.’ Such issues as equal-ity, social and property rights, freedom of belief comprised the fundamental fea-tures of the declaration.10
The influence of egalitarian and libertarian ideas regarding the social structure along with that of the great figures of French Enlightenment on French society cannot be denied. Voltaire (1694-1778) is probably the greatest of them all. Voltaire was mesmerized by Newtonian physics during his stay in England (1726-1728) and endeavored to popularize English Newton’s conception of science among the French with reference to Descartes’ conception of nature. Voltaire in his Letters Concerning the English Nation (1733) talked about Isaac Newton’s world as such:
A Frenchman who arrives in London, will find philosophy, like everything else, very much changed there. He had left the world a plenum, and he now finds it a vacuum. At Paris the universe is seen composed of vortices of subtile matter; but nothing like it is seen in London. In France, it is the pressure of the moon that causes the tides; but in England it is the sea that gravitates towards the moon; so that when you think that the moon should make it flood with us, those gentle-men fancy it should be ebb [Cited in (Bolles, 1999, pp. 250–251)].
Walras also witnessed the climax of ideas of Enlightenment and equality. He was born in 1834 in Normandy and then went to Paris in 1853 and enrolled in the department of mining engineering. Having been disappointed with mining en-gineering and inspired by his economist father, Walras developed a close inter-est in the ‘social question’, or in other words, how the poor could come out of poverty, while this interest of his led him to the field of literature. Upon this,
10 Declaration of the Rights of Man and of the Citizen, Date of access: 16 December 2018, https://www.britannica.com/topic/Declaration-of-the-Rights-of-Man-and-of-the-Citizen.

PERSPECTIVES ON MODERN ECONOMY
Aizhan KHOICH, Ali Eren ALPER, Ahmet Arif EREN
529
his father suggested Walras that he became a journalist and placed him at Jour-nal des economists as an assistant editor. Further, he provided Walras with an im-mense resource for economic matters by handing him his collected and unpub-lished works and contributed to the development of his ideas on many issues (Van Daal, 2005, pp. xv–xvi).
There were roughly two groups of social scientists in France in Walras’s time: the ‘Socialists’ and ‘Economists.’ Walras, however, did not feel like belonging to ei-ther of these groups. The Socialists generally thought that the current social order was responsible for poverty and challenged freedom of trade and private owner-ship of the means of production. Walras criticized the Socialists as the solutions this group offered for the eradication of poverty was based on ideals rather than well-thought rational principles. The Economists, on the other hand, were the champions of the existing order, as was stated by Walras, they dominated all the posts as heads of departments in economics in higher education institutions in France and these posts as heads of the department were handed down from fa-ther to son or from uncle to niece. Further, Walras accused the Economists of having an economic ‘theory’ merely composed of four words: laisser-faire, laiss-er-passer. The Economists who applied this principle to all the aspects of eco-nomic life propounded that all exchanges should be conducted under free com-petition. They, of course, did not disregard social questions but it seemed as if they laid the burden of responsibility on paupers themselves and accused them of being uneducated and filthy (Van Daal, 2005, p. xviii).
At this point Walras argued that both the Socialists and the Economists failed to come up with a ‘scientific’ solution to the social question. Walras believed that ‘the problem of the distribution of social wealth among the people in a society’ was the most pressing economic problem that begged a solution. This was the reason why he talked about the miserable situation of the French working class both in Paris of the day particularly and in France generally in the introductory section in his Elements. According to Walras, the current social question gave way to invol-untary poverty. Walras argued that the problem of ‘order’, or in other words, ‘the problem of political organization of the government or the society and the prob-lem of liberty and authority’ along with ‘justice’, or in other words, ‘the problem of equality and inequality’ accounted for two significant social questions (Wal-ras, 2010, p. 128). Therefore, the greatest and most urgent problem that needed to be solved was this social question for Walras:

530
DOES 19TH-CENTURY FRANCE EXPLAIN LÉON WALRAS?
Hüsnü Bilir, Vural Başaran
There is a question which is not the Far East question, nor the Roman (the Church of Rome) question, nor the question of the British Alliance; a question much more important than all these and which a great deal more touches us: It is to know the social question [Cited in (Rugina, 1987, p. 535)].
Yet Walras’s inclusion of social questions into his analysis and the idealist per-spective he adopted were later gradually set aside and replaced by his studies on pure theory. One of the reasons why this happened was the fact that Walras was anxious not to be regarded as a person who was complaining about the current social order and suggesting that economy be reorganized in a way to hurt the interests of the ruling class by those who imposed censorship in the Third Em-pire. Thus Walras avoided revealing his theory overtly as a normative layout and headed for pure theory.
Another reason why Walras turned to the theory of pure economics, in spite of his passionate interest in such political and practical problems as the expropria-tion of land, collective action and single tax, was the letter he received from his father while he was writing a book entitled Economics and Justice, A Critical Ex-amination and Refutation of the Economic Doctrines of M. P. J. Proudhon late in 1859. In this letter Walras’s father simply gave the following advice [Cited in (Walker, 1983b, p. 125)]:
If you decide to publish your work, re-read it with care; don’t allow anything to remain in it that could give even the slightest offense from a political point of view. Place yourself and keep yourself always on scientific ground. Arrange mat-ters, in a word, so that if by chance anyone decides to lodge charges against you, the Imperial Prosecutor would be obliged, in order to have you condemned, to maintain that the world does not turn, that the sun is no bigger than a pump-kin, that thunder is a bar of iron forged by the Cyclops11 and hurled by Jupiter.
Although Walras initially endeavored to find a solution to the social question, such matters as the social question and social justice were gradually buried deeper in the analysis and he started to offer an economic analysis through mathemat-ical statements and formulae because of these reasons.12 In other words, Walras
11 The giant having a single round eye in the middle of the forehead in Greek mythology, while Jupiter is the god of the heavens and of weather in Roman mythology.
12 This inclination, stands out in Walras’s works as well. For instance, the first of his three main works Elements was written after 1870 and portrayed a system of necessary economic relations;

PERSPECTIVES ON MODERN ECONOMY
Aizhan KHOICH, Ali Eren ALPER, Ahmet Arif EREN
531
began his analysis endeavoring to find solutions to the problems of the society and the time he was living in and tried to draw people’s attention to such issues but then went on portraying an ideal situation within which he could readily utilize mathematical statements, not the existing conditions both because of his father’s suggestion and because he was anxious about the criticism and punitive actions he might have faced.13 One cannot deny the fact that Walras listed eco-nomics among natural sciences like physics and astronomy along with the fact that he designed his analysis emulating these scientific disciplines played a major role in his not avoiding utilizing mathematical statements and formulae, but far from it, arguing that it was essential to use mathematics.14 Within this context it can also be put forth that Walras was basically Cartesian with regards to his way of analytical thinking.15 Walras used the method which was first defined by Des-cartes and which spectacularly served natural sciences during the Enlightenment in his economic reasoning. Moreover, his biography and correspondence reveal that young Walras read Descartes, Newton and Lagrange. Vito Volterra in his
his second work Social Economics was written in 1896 and studied social ethics questions like communism, individualism, private property, expropriation of land and public finance, while his third work Applied Economics was written in 1898 and discussed practical issues like bimetallism or monometallism, monopoly or free competition, free commerce, the role of banking and loans and use and misuse of stock market speculations. See. (Walker, 1983b, p. 23)
13 It should, at this point, be noted that there are dissenting views on the objective of Walras’s analysis. For instance, Koppl argued that Walras’s analysis generally aimed at depicting an idealized kind of capitalism, insomuch as, scientific socialism. According to Jaffé, on the other hand, the implicit objective of Walras’s general equilibrium theory design was neither depicting or analyzing the modus operandi of the economic system as it was nor merely depicting economic relations in a theoretically perfect free competition regime, it was rather proving the possibility of axiomatically formulating an economic system which was logically consistent and able to meet social justice demands without transgressing the borders imposed by the natural exigencies of the real world (Walker, 1983b, p. 105).. In other words, Walras’s intention was prescriptive and normative even in his ‘pure economics’ rather than positive and descriptive (Walker, 1983b, p. 334). Therefore, according to Jaffé, Walras’s objective was not to examine how the capitalist system worked but to depict the ways in which an imaginary system could operate in concert with principles of justice based on the traditional philosophy of natural law (Jaffé, 1980). Jaffé. In this respect, Elements of Pure Economics or the Theory of Social Wealth is an attempt at realist utopia.
14 Friedman goes a step further. According to Friedman, the reason why Walras’s analysis was considered such a vital and revolutionary one was the change seen in our general philosophical and methodological perspective witnessed particularly in natural sciences which was based on the replacement of Newtonian physics with Einsteinian physics (Milton, 1955).
15 Koppl points out to the Cartesian influence in Walras’s analysis as well and argues that Walras’s Cartesian ontology led him to suggest a mechanical price theory and to assess his theory as a branch of Cartesian physics while his Cartesian epistemology drove him to build an equilibrium theory which was hard to test empirically (Koppl, 1992, p. 17).

532
DOES 19TH-CENTURY FRANCE EXPLAIN LÉON WALRAS?
Hüsnü Bilir, Vural Başaran
article ‘Les mathématiques dans les sciences biologiques et sociales’ (1906) stated that Walras late in his life had only been too happy to read that the new mathe-matical economics, for the rise of which Walras among others played an impor-tant role, had been included in the same scientific accomplishment class meth-odologically as those of Descartes in geometry, Lagrange in mechanics, Maxwell in physics and Helmholtz in physiology (Walker, 1983b, pp. 102–103).
Similarly, the mode of analysis used by Louis Poinsot in his Éléments de statique (1803), which demonstrated interdependence among the pieces of a system pro-posing a theory of equilibrium and the movement of systems with reference to the physical universe, encouraged and influenced Walras to a great extent. The most important progenitor of Walras’s specific economic theories, however, was Achylle-Nicolas Isnard. In Traité des richesses published in 1781, Isnard devel-oped a theory of exchange, a theory of production and the technique of using a numéraire commodity, each of which served as a starting point and model for Walras’s work. Samuel von Pufendorf and Grotius were also the progenitors of Walras’s philosophical views, imbuing him with a conviction of the reality of nat-ural law and the desirability of adhering to it (Walker, 1983a, pp. 3–4). Besides, one can see the traces of such emulation in many of the texts that Walras wrote:
Very few of us are capable of reading Newton’s Philosophiae Naturalis Principia Mathematica or Laplace’s Mécanique Celeste; and yet, on the word of competent scientists, we all accept the current description of the universe of astronomical phenomena on the principle of universal gravitation. Why should the descrip-tion of the universe of economic phenomena based on the principle of free com-petition not be accepted in the same way? There is no reason why the proof of the system, once established, may not be taken for granted, nor why the asser-tions involved may not be used in the study of questions of applied or practical economics (Walras, 1954, p. 428).
So Walras influenced the scientific background of his time and believed that there is a perfect reciprocity and correlation between the method of natural sciences and humanities. Along these lines he divided economics into three categories16 as
16 Jaffé showed that Walras divided his work into three parts in accordance with the philosophical position that it is important to identify what is true –which led him to contribute to economic theory; what is useful– stimulated him to investigate problems in applied economics; and what is just –which motivated his concern with ‘social economics.’ Walras’s economic theory, contained primarily in the Eléments, was principally an analysis of the equilibrium of a

PERSPECTIVES ON MODERN ECONOMY
Aizhan KHOICH, Ali Eren ALPER, Ahmet Arif EREN
533
pure economics, applied economics and social economics and characterized them as science, arts and ethics respectively. In the first part, which constitutes pure economic theory, the problem is to investigate the ineluctable conditions that are imposed by the nature of things. This part consists of an application of logic to economic propositions. In postulating any hypothesis, it must be asked, in pure science, what must necessarily follow from it. Given the fact that economic prop-ositions have in general a quantitative implication, in the sense that they are al-most always concerned with the relationships between quantities, it is natural to use mathematics in seeking these implications (Walker, 1983b, pp. 127–128).
The second part of economics is referred to as applied economics and deals with the main subject from the perspective of what is useful. This part assesses whether the reasoning developed by pure economics theory was applicable for the real world. Walras frames applied economics as such:
The will of man is free to influence the production, as well as the distribution, of social wealth. The only difference is that in distribution, man’s will is guided by considerations of justice, whereas in production his will is guided by considera-tions of material well-being. Moreover, technical production and economic pro-duction, as we have defined them, are not unlike in essence. The two phenom-ena are, in fact, closely connected and interrelated, each being complementary to the other. Not only are they both human and not natural, but they are also both industrial and not social phenomena, for economic production as well as techni-cal production are manifestations of relations between persons and things with a view to the subordination of the purposes of things to the purposes of persons. Thus the theory of the economic production of social wealth, that is, of the organ-ization of industry under a system of the division of labor, is and an applied sci-ence. For this reason we shall call it applied economics (Walras, 1954, pp. 75–76).
multimarket economic system, using the assumptions of pure competition and static certainty. His applied economics, to which he devoted his attention in the articles collected in the Etudes d’économie politique appliquée, was concerned with the development of policies based upon theory, on the assumption that the goals are given. His social economics, exemplified by the essays in his Etudes d’économie sociale, was a normative branch of study, dealing with the formation of desirable goals. Going beyond the scope of modern welfare economics, Walras’s social economics did not merely work out the welfare consequences of trying to achieve different objectives but also evaluated the objectives themselves and formulated new goals. See: (Walker, 1983b, p. 5)

534
DOES 19TH-CENTURY FRANCE EXPLAIN LÉON WALRAS?
Hüsnü Bilir, Vural Başaran
Walras called the third part social economics and dealt with economic phenom-ena from the perspective of justice. In applied economics the investigation be-gins with a given goal, without asking whether the goal is good or bad, just or unjust. Walras postulates various principles of justice, and, in the light of them, judges the different social goals that were proposed during his time. It must be recognized that such an investigation leaves economics proper and enters the do-main of moral inquiry (Walker, 1983b, pp. 128–129). Walras defines social eco-nomics as such:
The appropriation of scarce things or of social wealth is a phenomenon of human contrivance and not a natural phenomenon. (…) (This phenomenon) is shaped, not by separate will of each individual, but by the collective activity of society as a whole. (…) Moreover, the appropriation of things by persons or the distribu-tion of social wealth among men in society is a moral and not an industrial phe-nomenon. (…) What mode of appropriation is good and just (…) is the prob-lem of property. Property consists in fair and rational appropriation, or rightful appropriation. While appropriation by itself is an objective fact, pure and sim-ple, property, on the other hand, is a phenomenon involving the concept of jus-tice; it is a right. Between the objective fact and the right, there is place for moral theory. (…) (W)hat exactly is the object of the problem of property? This object consists essentially in establishing human relations arising from the appropria-tion of social wealth so as to achieve a mutual co-ordination of human destinies in conformity with reason and justice. Appropriation being in essence a moral phenomenon, the theory of property must be in essence a moral science. (…) If any science has for its object to render to each what is properly his, if, therefore, any science espouses justice as its guiding principle, surely it must be the science of the distribution of social wealth, or, as we shall designate it, social economics (Walras, 1954, pp. 76–79).
Namely Walras categorized the subject of economics into three groups as pure eco-nomics, applied economics, and social economics and underlined that although these three categories were interrelated they handled separate problems. For Wal-ras, while pure economics dealt with the nature, causes and laws of social wealth, applied economics was concerned with the production of social wealth. Social economics, to which Walras referred as moral/ethical economics, on the other hand, studies the distribution of social wealth among the members of a society. In this respect, he underlined within this framework that his main interest was in

PERSPECTIVES ON MODERN ECONOMY
Aizhan KHOICH, Ali Eren ALPER, Ahmet Arif EREN
535
science, or pure economics. Indeed, when one studies Walras’s analysis it is seen that he only dealt with things (facts) that could be observed and tested while he resorted to the real world only to put his theory into practice, or in other words, for practical reasons because Walras desired to make economics a physico-math-ematical science, in his own words, and built his analysis on this base:
There is no medical doctor or surgeon who faced with sickness or injuries will start to weep or moan, and if there be such, then they are not the best. The same is true for an economist faced with social evils: he must learn to remain calm, to suppress his emotions in favor of the success of his studies. Finally, as soon as he has crisis -crossed the evil in every sense, he must be ready to leave the field of reality in order to elevate himself to the domain of cold abstraction which is also that of science[Cited in (Rugina, 1987, p. 533)]. Walras, in this regard, chal-lenged the idea that the sole base of science or politics should be empiricism and argued that without theory there would be no science:
Facts are now in fashion: the observation of facts, the investigation of facts, the acceptance of facts as laws. In stormy times, political power falls into the hands of the ignorant masses. Art, science, philosophy are swept away. Facts become masters; empiricism triumphant reigns supreme. Analytical minds closely study the explosion and wait for chaos gradually to take over as an object of fond de-scription and serene glorification. As for me, I will have no part in this [Cited in (Walker, 1983b, p. 349)].
Accordingly, in order to propose an efficient solution to the social question, firs of all the issue should be formulated in a theoretically comprehensible and clear-cut manner. Thus, the use of mathematics is inevitable:
If the object of mathematics in general is to study magnitudes of this kind, the theory of value in exchange is really a branch of mathematics (…) pure theory of economics is a science which resembles the physico-mathematical sciences in every respect. If the pure theory of economics or the theory of exchange and value in ex-change, that is, the theory of social wealth considered by itself, is a physico-math-ematical science like mechanics or hydrodynamics, then economists should not be afraid to use the methods and language of mathematics. (…) This much is cer-tain, however, that the physico-mathematical sciences, in the narrow sense, do go beyond experience as soon as they have drawn their type concepts from it. From real-type concepts, these sciences abstract ideal-type concepts which they define,

536
DOES 19TH-CENTURY FRANCE EXPLAIN LÉON WALRAS?
Hüsnü Bilir, Vural Başaran
and then on the basis of these definitions they construct a priori the whole frame-work of their theorems and proofs. After that they go back to experience not to confirm but to apply their conclusions. (…) From these real-type concepts the pure science of economics should then abstract and define ideal-type concepts in terms of which it carries on its reasoning. The return to reality should not take place until the science is completed and then only with a view to practical appli-cations (Walras, 1954, pp. 70–71).
To put it simply, Walras argued that economics was a natural science like mathe-matics and astronomy, in his own words, a physico-mathematical science; there-fore, it should make use of mathematics as much as possible: ‘It is already per-fectly clear that economics’, for Walras ‘like astronomy and mechanics, is both an empirical and a rational science’ (Walras, 1954, p. 47). Thus, if economics is a rational science like astronomy and mechanics, then economists should not avoid using mathematics because using the language of mathematics is not only useful but also necessary. Since, according to Walras (Walras, 2010, p. 8), sci-ence ‘is the idealization of reality.’ Therefore, perfection or absolute is the found-ing principle of theory and science. Thus, according to Walras, pure theory deals with the ideal, perfect form of reality (Rugina, 1987); in other words, for Walras (1868) ‘in science, our domain is that of ideas, of the ideal, of perfection’ [Cited in (Walker, 1983b, p. 345)].
In this regard, Walras’s domain was the theory of pure economics within which he could readily use mathematical statements and formulae. According to Koppl (Koppl, 1995), if Walras’s classifications of science and economics are to be han-dled together, pure economics, that is, the general equilibrium theory, is science; applied economics, a practical matter of what is more or less useful to us in our industrial pursuits, is not science but art; social economics, a matter of what is more or less just in our relations with each other, is ethics.
All in all, Walras turned to economics in order to propose a solution to the ques-tion of social justice, which he considered to be the most significant problem of 19th-century France within the framework of the conditions in which he lived, but then moved way from dealing with such issues because of the conditions of the period yet again and the pressure exerted by his family. In the following pro-cess he aimed at building a completely mathematical and abstract economic the-ory based on natural sciences –in his own words a ‘physico-mathematical’ theory

PERSPECTIVES ON MODERN ECONOMY
Aizhan KHOICH, Ali Eren ALPER, Ahmet Arif EREN
537
of economics. Today Walras has been identified with this abstract and mathemat-ical ‘general equilibrium analysis’ in the history of economic thought. One can, within this framework, state that the environmental factors were quite determi-nant in both the rise and development of Walras’s economic thought.
4. Conclusion
Walras, who divided his economic analysis into three as pure economics, applied economics and social economics and defined them as science, art, and ethics re-spectively, stated that his primary interest lied in pure economics, that is, in sci-ence. Therefore, Walras has been identified with the abstract and mathematical ‘general equilibrium theory’ in the history of economic thought.
Within this framework, it can be argued that Walras set out seeking a solution to the ‘social question’ having been influenced by the time and conditions within which he lived before embarking on studying pure economics. Accordingly, Wal-ras dealt with the issues of social question and social justice in his early works, then, turned to pure economics and left social questions aside both having been influenced by his father and academic concerns along with the imposition of the conditions he was in. One can say that while Walras’s early works were shaped around the notions of social question and justice, his later works were built in a mathematical and abstract manner based on pure economics. In this case we face two Walrases: a Walras who focused on the ‘social question’ which he him-self called the most significant economic problem of his age and another Wal-ras who left the ‘social question’ aside for the sake of being scientific and got in-volved in pure economics.
Hence one of the factors that underlay Walras’s ideas on equality and socialist structure undoubtedly proved to be the developments in the French society. This issue can be explained within the framework of the externalist approach in the historiography of science since this approach regards scientific activity as a social event and it can be explained through socio-economic processes.
Walras, on the other hand, was also influenced by the Enlightenment philosophy of his age and aimed accordingly at building economics as a physico-mathemat-ical science. For instance, he read and influenced by Descartes, Newton and La-grange and argued that both natural and social sciences should same method. Along these lines, one can argue that the fact that Walras comprehended the internal

538
DOES 19TH-CENTURY FRANCE EXPLAIN LÉON WALRAS?
Hüsnü Bilir, Vural Başaran
modus operandi of science and endeavored to shape it within the context of his own social thought had an effect on the development of his economic analysis as well. This can, in turn, be explained by the internalist approach in the histori-ography of science since the argument of this approach is that the methodology of science is shaped by the internal dynamics of science, not by external sources.
Consequently, both the conditions of his age and the internal dynamics of science influenced the development of Walras’s economic analysis. In this regard, 19th-cen-tury France fails to adequately explain Walras. Scientific developments in the Eng-land and Italy of the age that changed the course of science influenced Walras as well. The internalist and externalist approaches, or in other words, conceptions of intellectual and social history should, therefore, be handled together in order to explain the formation process of Walras’s economic thought.
References
Bolles, E. B. (1999). Galileo’s Commandment. New York: Henry Holt.
Bookchin, M. (1996). The Third Revolution (Volume One): Popular Movements in the Revolutionary Era. London ; New York: Cassell.
Demir, R. (2015). Nerede Hata Yaptık? Ankara: Lotus Yayınevi.
Engels, F. (2013). Dialektik der Natur (Berliner Ausgabe). Retrieved from http://www.zeno.org/Lesesaal/N/9781492105770?page=2
Grant, E. (1977). Physical Science in the Middle Ages. Cambridge: Cambridge University Press.
Hall, A. R. (2009). Ballistics in the Seventeenth Century. Cambridge ; New York: Cambridge University Press.
Hessen, B. (2009). The Social and Economic Roots of Newton’s Principia. In G. Freudenthal & P. Mclaughlin (Eds.), The Social and Economic Roots of the Scientific Revolution (pp. 41–101). Springer.
Jaffé, W. (1980). Walras’s Economics as Others See It. Journal of Economic Lit-erature, 18(2), 528–549. Retrieved from JSTOR.
Koppl, R. (1992). Price Theory as Physics: The Cartesian influence in Walras. Methodos, 4(2), 17–28.

PERSPECTIVES ON MODERN ECONOMY
Aizhan KHOICH, Ali Eren ALPER, Ahmet Arif EREN
539
Koppl, R. (1995). The Walras Paradox. Eastern Economic Journal, 21(1), 43–55.
Koyré, A. (1963). Commentary. In A. C. Crombie (Ed.), Scientific Change (pp. 847–857). London: Heinemann.
Kuhn, T. S. (2012). The Structure of Scientific Revolutions. Chicago ; London: The University of Chicago.
Lakatos, I. (1971). History of Science and its Rational Reconstructions. In R. C. Buck & R. S. Cohen (Eds.), PSA 1970: In Memory of Rudolf Carnap Proceedings of the 1970 Biennial Meeting Philosophy of Sci-ence Association (pp. 91–136). https://doi.org/10.1007/978-94-010-3142-4_7
Merton, R. K. (1973). The Sociology of Science Theoretical and Empirical Investi-gations. Chicago ; London: The University of Chicago.
Milton, F. (1955). Leon Walras and His Economic System. The American Eco-nomic Review, 45(5), 900–909.
Nnaji, J., & Luján, J. L. (2016). The Content of Science Debate in the Histo-riography of the Scientific Revolution. International Studies in the Philosophy of Science, 30(2), 99–109. https://doi.org/10.1080/02698595.2016.1265864
Renato, C. (1984). Léon Walras and Social Justice. American Journal of Eco-nomics and Sociology, 43(1), 53–60.
Richard, A. (2002). Schumpeter on Walras. In A. Richard & C. Dangel-Hag-nauer (Eds.), The Contribution of Joseph Schumpeter to Economics: Economic Development and Institutional Change (pp. 40–65). Lon-don ; New York: Routledge.
Rugina, A. N. (1987). Toward a Third Revolution in Social Economics: The Pathbreaking Role of Walras. Journal of Economics and Business, 37(3), 514–563.
Schumpeter, A. J. (1954). History of Economic Analysis. Taylor & Francis e-li-brary.
Van Daal, J. (2005). Introduction. In Studies in applied economics: Theory of the production of social wealth. Oxon: Routledge.

540
DOES 19TH-CENTURY FRANCE EXPLAIN LÉON WALRAS?
Hüsnü Bilir, Vural Başaran
Walker, D. A. (Ed.). (1983a). Introduction. In William Jaffe’s Essays on Walras (pp. 1–14). https://doi.org/10.1017/CBO9780511664519.002
Walker, D. A. (1983b). William Jaffé’s Essays on Walras. Cambridge: Cambridge University Press.
Walras, L. (1954). Elements of Pure Economics or the Theory of Social Wealth (W. Jaffé, Trans.). London: George Allen and Unwin Ltd.
Walras, L. (2010). Studies in Social Economics (J. Van Daal & D. Walker, Trans.). Oxon: Routledge.

541
32SOCIAL CAPITAL APPROACH IN INSTITUTIONAL ECONOMICSZehra Doğan Çalışkan1
Introduction
The relationship between people is a significant bond that determines the living spaces of individuals in society, the boundaries and characteristics of these spaces and the behaviors of these people in that space. These bonds among people are significantly effective for constructing the individuals and by extension, society. The concept of social capital generally expresses these social bonds as well as for-mal and informal rules (Aktan &Yay, 2020:177).
Several research areas have used the concept of social capital frequently. The pri-mary areas that have used social capital as a concept are education, economic de-velopment, democracy, family, migration, labor market, entrepreneurship, crea-tivity, social exclusion, social movements and health sector. Since social capital can be evaluated in several aspects such as the relationship among individuals, the characteristics of confidence and mutuality in these relations and norms that can be considered as the features of social structure and since social capital has been approached in various levels such as macro, social and individualistic aspects, the concept of social capital is rather difficult to understand (Seçer 2009:104). How-ever, despite its difficulty, social capital involves these distinctive concepts and it has been used in several areas. Moreover, due to the characteristic of social capi-tal that guides and influences the economic, social and political relations of a so-ciety, it is notably significant as well.
Social capital expresses the economic, social and political capacities and conditions in a society. Furthermore, it is a concept that expresses reciprocal dependency and relation of all processes belonging to the society from labor relations to relation-ship between entrepreneur and novelty and from political choice and liberties to traditional and cultural behaviors. While social capital includes both social and
1 PhD. Bolu Abant Izzet Baysal University

542
SOCIAL CAPITAL APPROACH IN INSTITUTIONAL ECONOMICS
Zehra Doğan Çalışkan
real capitals, it can be considered as a superstructure / framework or an institu-tion that uncovers the connection between these two capitals (Bexley 2007: 19).
Social capital is regarded as norms and confidence that aids institutions and or-ganizations to achieve their mutual targets and objectives. Economic explana-tions and interpretations mainly emphasizes institutions, boards and economic transitions in micro and macro levels. In general, social capital is acknowledged as public good rather than individual capital. Social capital can be described as norms, social networks and reputation, confidence and credibility among peo-ple that affects productivity and health of a society. In this regard, social capital is depended upon the characteristic and quality of relationship and connection among the social groups. Social capital is not comprised of individual capital or individualistic qualities. Rather, it emerges from communication capacity and the ability to verbalize certain emotions in groups (ESAM 2005: 9).
There are several studies in the literature about real capital and how the real cap-ital is accumulated in the society. In these studies, the real capital differences be-tween the countries explained with various variables. The first study example from the view of institutional economics was Hanifan’s study (1916). According to Hanifan (1916), social capital can not only be defined with monetary issues or capital goods but also with welfare, tolerance, social consensus and problem solving ability. In essence, social capital is the sum of factors that are effective for a quality life. Like in working organizations, capital accumulation is necessary for constructive jobs to emerge in constructing a society. According to Hanifan, the most significant tools of social capital accumulation are schools and factories. Information and skills that would be taught in these places together with social capital will lead society to be flourished.
The studies of J. S. Coleman, R. Putnam and P. Bourdieu about social capital have been acknowledged as the pioneer studies. The definitions and approaches of these researches about social capital became an instructive path for the later researchers as well.
Bourdieu wondered about why the society could not be transformed and how the dominant classes protected their status-quo in society as upper-class. Accord-ing to Bourdieu, this condition could not be explained only with regarding eco-nomic conditions. In order to explain this condition, cultural codes or rather, the cultural capital of society and the hierarchical order of this capital should be

PERSPECTIVES ON MODERN ECONOMY
Aizhan KHOICH, Ali Eren ALPER, Ahmet Arif EREN
543
regarded as well. He argued that the actors that monopolizes the social capital are the response of this condition. According to this argument, the opportunities that rose from social relations and provided various advantages emphasized in the definition of social capital (Bourdieu, 1986: 249). According to Bourdieu, social capital as the private good of individual or an actor is born with the relations of other actors, which had the potential of development in later. The most significant actors in early stages is identified as the confidence (Özen and Aslan 2006: 134).
According to Coleman, on the other hand, social capital emerges as a result of the reciprocal dependency of a culture, it completely originated in society and it is a concept that belongs to the society. Moreover, for Coleman, social capital is not an element that benefits only a fraction of a society as a superior factor above real and human capital and belonging to society but it also benefits every individ-ual in the society as well. By internalizing the structural relationship among the actors, social capital uncovers what is best for the society (Coleman 1988: 98).
According to Putnam (1993), the concept of social capital consists of three com-ponents. These are: moral obligations, rules (norms) and social values (especially confidence). The basis of Putnam’s thoughts about the social capital is based upon the idea that both well-functioning economy and socially internalized political system will unveil the social capital with information networks and mutual con-fidence. The basis of Putnam’s concept of social capital is the component of con-fidence (Putnam 1993: 123). According to Putnam (1993), if every fractions in society depends each other reciprocally and have confidence towards each other, and if both political and economic processes is organized properly and judiciary system implements rapid and just sanctions, the existence of social capital in a country can be mentioned. Social capital is like a super structure which involves real and human capital and is above them. The existence of a social structure is notably significant for solving the problems such as development, growth, unem-ployment and impoverishment (Putnam 1933; Siisiainen 2000: 5).
The concept of social capital has been discussed frequently after the first half of 20th century. It involves economic, social, cultural and political certain changes belonging to a society as well. In this regard, if a society has a well-functioning economic system, well-constructed political system and confidence to each other culturally, this type of society will be more successful to solve the problems than the other types of societies. Since social capital not only approaches economic

544
SOCIAL CAPITAL APPROACH IN INSTITUTIONAL ECONOMICS
Zehra Doğan Çalışkan
developments but also all the other changes in the society with a holistic approach, it requires an inter-disciplinary study and perception. Moreover, since social cap-ital is a framework above the established structure, it is one of the most signifi-cant field of studies in new institutional economics.
Institutional Social Capital
Institutional economics argues that the basic research subject of economics is people and group behavior, and therefore, while human behaviors shapes insti-tutional structure, institutional structure also shapes human behaviors in time as well. Since human behaviors are depended to their social environment, the ma-jor issue of economics would be to analyze and clarify these social environment conditions. When institutional structure is mentioned, it means that the sum of both production and living modes of a society that is shaped with habits, ideas and behaviors. Without understanding the institutional structure, it is impos-sible to understand and explain the economic events. From this point of view, social capital means that mutual trust, which was occurred through social net-works, among the individuals (Putnam: 2000). In this regard, social capital has become a concept that clarifies both living and production processes within the institutional economics.
Karataş and Seki (2017) researched the impact of social capital differences on re-gional development and they clarified that social capital has an impact on costs, investments, capital activities, income distribution, productivity and innovation capacity. In other words, social capital is in center of the economic activities and it is a major, effective force upon those activities as well (Seki and Karataş, 2017).
North played a significant role for the development of institutional economics and he approached to the concept of social capital institutionally rather than indi-vidually (Seki and Karataş, 2016). From this point of view, social capital was de-fined with mutual trust, confidence to the contracts, commitment to social norms and confidence towards the judiciary system. Social capital determines the rules of the game and it is the sum of informal behaviors and habits (North, 1991).
Social capital includes the continuity of relations among all the social groups in the society, the durableness of bonds, mutual trust among the all individu-als and groups in the society, the formal and informal norms, which will estab-lish such mutual trust, institutions and non-governmental organizations, which

PERSPECTIVES ON MODERN ECONOMY
Aizhan KHOICH, Ali Eren ALPER, Ahmet Arif EREN
545
will be shaped around these institutions (Yay and Şataf, 2018:3). From a differ-ent perspective, there are three significant components in social capital. These are defined as bonds, bridges ve linkages. Bonds or rather, cultural bonds, analyzes people with similar cultural origins (or similar people) and the behaviors of these people. Bridges or social bridges expresses the relationship between close people such as people who graduated from same school, who lived in same neighbor-hood, who sent their children to the same school. Linkages or social networks researches the human behaviors that have been gathered under the leadership of a leader (OECD, 2007:103) From this point of view, social capital is a notably significant concept that affects the process of economics decisions, which shapes the lives of people throughout their lifetime.
Evaluation
Social capital is a concept that harbors economic, social, cultural and political as-pects of a society. Although it is difficult to measure, it is a concept that shapes the entire life in society. In this regard, if a society has a well-functioning economic system, well-constructed political system and confidence to each other culturally, this type of society will be more successful to solve the problems than the other types of societies. Since social capital approaches not only economic development but also all changes in a society with a holistic approach, it requires interdiscipli-nary study and perception. In other words, while social capital is a concept that has been used to explain how the institutions of a society formed in institutional economics, it forms a super frame for institutional structure as well.
For this issue, there are two significant questions that should be asked: How the existence of mutual bonds, confidence, sincerity, welfare and tolerance affects the economic decisions? Is it possible to form a relationship between social capital differences in countries and economic development (growth, development num-bers)? It is possible to express this statement for these questions: it is easier to sell products, produce, finding jobs, starting a business in societies that mutual trust, bona fide and tolerance exist and have a strong social bonds. Furthermore, the lifetime of companies and happiness of employees are more in these societies. From this point of view, state interventions and policies are based on to increase the happiness of their people (in countries that political gain and pursuing per-sonal benefits from politics as well as corruptions are less). In this regard, enrich-ment is more lasting and sustainable in the countries that social bonds are strong.

546
SOCIAL CAPITAL APPROACH IN INSTITUTIONAL ECONOMICS
Zehra Doğan Çalışkan
Moreover, development indicators are expected to be better in societies with rich social capital. It is possible to mention the inclusionary laws for all of the soci-ety in the societies with strong social communication. Economic, judiciary and political institutions with inclusionary and protective aspects work better in so-cieties with strong bonds. So, the ultimate question to be asked for social capital will be: can social capital be increased? Further, whether social capital is increasa-ble or not and if it is increasable, then, how it can be increased? From the point of institutional economics’ view, social consensus and communication can be in-creased well in societies under the administration with more transparent, account-able and liberal. When liberal, reconciliatory and accountable approach is fol-lowed in the corporate management, it is expected that social capital will increase.
References
Aktan C.C. & Yay, S. (2020). Douglas C. North’un İktisat Bilimine İktisadına Katkıları: Yeni İktisat Tarihi ve Kurumsal İktisat, Aktan, Coşkun Can (Ed.), Nobelite: Hukuk ve İktisat Yaklaşımının Öncüleri, İz-mir: SOBİAD Hukuk ve İktisat Araştırmaları Merkezi Yayınları.
Bexley, E. (2007). Social Capital Theory and Practice, Melbourne University Working Paper,
Bourdieu, P. (1986). Forms of Capital, Handbook of Theory And Research For The Sociology Of Education. (drl) Ed. John G. Richardson, Greenwood, NY,
Coleman, J. S. (1988). Social Capital in the Creation of Human Capital. Amer-ican Journal of Sociology. No:94,
Ekonomik Sosyal Araştırmalar Merkezi (ESAM) (2005). Ekonomik Kalkınma-da Sosyal Sermayenin Rolü. Ekonomik ve Stratejik Araştırmalar Merkezi, KOSGEB
Hanifan, L.J. (1916). The Rural School Community Center, The Annals of the American Academy of Political and Social Science, Sep., 67(1), 130-138,
Karataş, İ. & Seki, İ. (2017). Sosyal Sermaye ve Bölgesel Kalkınma İlişkisi: Aksaray Örneği, Ege Akademik Bakış, 17(1), 105-126.
North, D. C., (1991). Institutions, Journal of Economic Perspectives, 5 (1): 97-112.

PERSPECTIVES ON MODERN ECONOMY
Aizhan KHOICH, Ali Eren ALPER, Ahmet Arif EREN
547
OECD (2007). Human Capital: A Bigger Picture, Human Capital, How what you know shapes your life, www.oecd.org/insights/humancapital-howwhatyouknowshapesyourlife
Özen, Ş. & Aslan, Z. (2006). İçsel ve Dışsal Sosyal Sermaye Yaklaşımları Açısından Türk Toplumunun Sosyal Sermaye Potansiyeli: Or-tadoğu Sanayi ve Ticaret Merkezi (Ostim) Örneği. Akdeniz Üniversitesi İİBF Dergisi, Sayı 12, pp.130-142
Putnam, R. D. (2000). Bowling Alone: The Collapse and Revival of American Community, Simon & Schuster, NewYork.
Putnam, R.D. (1993). The Prosperous Community, The American Prospect, 4 (13), 110-123.
Seçer, B. (2009). İşgücü Piyasasında Sosyal Sermaye. Kamu-İş Dergisi 10 (3), 103-131.
Seki, İ. & Karataş, İ. (2016). Kalkınma Zincirinin Kayıp Halkası: Sosyal Ser-maye, Bursa: DoraYayıncılık.
Siisiäinen, M. (2000). Two Concepts of Social Capital: Bourdieu vs. Putnam. Department of Social Sciences and Philosophy University of Jyväskylä
Yay, S. ve Şataf, C. (2018). Yeni Kurumsal İktisat Perspektifinden Sosyal Ser-maye. Bilge Uluslararası Sosyal Araştırmalar Dergisi, 2(1), 1-11.


549
33CHAYANOV’S AGRICULTURAL PRODUCTION MODEL: AN OVERVIEWCumali Bozpinar1
In noncapitalist societies, the market differs. In these societies, it is possible to talk about market-like institutions rather than the market, which we can call “ba-zaar”. The difference between market-like structures, i.e. bazaars, and the market is that in the latter everything is the commodity produced for the market. This includes factors of production (Wood, 2003: 107). Moreover, in noncapitalist so-cieties, bazaar reflects the mode of production of these societies. Indeed, in non-capitalist societies, trade does not cover the whole of society, and a way of living above the subsistence level is observed only in bazaars. Since the subsistence-level living segment of the society does not participate in commercial life, there is no market as an institution in their world. In addition, market actors (lenders, bro-kers, consumers and even traders) are not required to be constantly connected to the bazaar (Ozveren, 2007).
A. V. Chayanov has done studies on noncapitalist agricultural organizations. In his analysis the principles of organization are not of capitalist nature. In this con-text, it can be stated that it does not include the wage category in its analysis. In this study, Chayanov’s model of noncapitalist agrarian organization, i.e. peasant farm, was examined in terms of its general characteristics. In addition, this model has been compared to the Ottoman model, i.e. the çift-hane system, in general and some inferences have been made.
1 PhD., Ministry of Environment and Urbanism (General Directorate of National Estate), [email protected].

550
CHAYANOV’S AGRICULTURAL PRODUCTION MODEL: AN OVERVIEW
Cumali Bozpinar
Chayanov’s Noncapitalist Model: The Theory of Peasant Farm
The toolbox of capitalist economic analysis cannot be used in the analysis of noncapitalism economic structures because the economic categories in capitalist economic theory, namely price, capital, wages, interest and rent, are functionally dependent on each other, and if a brick is removed from the system, the entire structure is destroyed (Chayanov, 1966: 1, 3-4). In other words, in the absence of any of these categories, they cannot even be quantifiably defined as all oth-ers have lost their specific characters and conceptual content. This analysis also applies to noncapitalism agrarian organization because there are no categories of wage labor as a basis in these organizations.
In a noncapitalism economy, economic activity is based on the necessity to satisfy the needs of each productive unit, which is at the same time a consumer unit. In this requirement, the amount is calculated as “sufficient” and “insufficient”; it is so short and therefore the budgeting is exceedingly qualitative2. Therefore, there is no problem such as the comparative profitability of the types of spending. Be-cause “products” cannot be exchanged and substituted, they cannot be expressed in a common standard (Chayanov, 1966: 4). In other words, there is need, not preference; it is satisfied in little or large quantity, that is all.
An economic system in which there is no wage category –a system of farmer and artisan family labor units where there are categories of price and capital - falls out-side the scope of the conceptual system of an economist adapted to capitalist so-ciety. On the family farm, the family uses its own labor force to own the means of production, selling the product it has obtained without using paid labor, re-sulting in a gross income. After the annual cost of raw materials is removed, the equivalent of the annual work is an increase in the value of material goods, which is the product of their labor. This family labor product is the only possible income category of the peasant family labor unit, as there is no way to divide it into its components (income categories) in an analytical or objective way. Since there is
2 In the pre-capitalism era, we cannot talk about the capitalist ideal type “homo economicus”. Acting according to formal rationality, homo economicus is briefly a man of account. In the type of pre-capitalism period, subjective rationality is valid, and in short, it can be assumed that he did not do a quantitative calculation in his economic behavior by using technical means objectively, and that he acted according to tradition in general. See for details Weber (2012: 199-201). These explanations also apply to noncapitalist societies.

PERSPECTIVES ON MODERN ECONOMY
Aizhan KHOICH, Ali Eren ALPER, Ahmet Arif EREN
551
no wage category, there is no net profit category. Hence the calculation of capi-talist profit is impossible (Chayanov, 1966: 5)3.
The family labor product depends on the state of the market, the position of the family unit relative to the market, the availability of the means of production, the size and composition of the family, the quality of the soil, and the other con-ditions of production of the unit (Chayanov, 1966: 5). However, the amount of labor product is mainly determined by the size and composition of the family, the number of members with the capacity to work, the productivity of the fam-ily unit, and the degree of labor effort –the degree of internal exploitation-of par-ticular importance (Chayanov, 1966: 5-6). Chayanov, based on empirical stud-ies on peasant farms in Russia and other countries, recognized that the degree of domestic exploitation would be determined by the specific balance between fam-ily demand satisfaction and labor effort (drudgery). Here, each new ruble of the growing production of family labor can be viewed from two perspectives: the sat-isfaction of family needs (consumption) and the effort taken to acquire the sub-stances that will provide it. It is clear that with the increase in production as a result of hard work, the subjective assessment of the meaning of each newly ac-quired rouble for consumption decreases, but more work that requires internal exploitation increases. As long as the evaluation between the two elements does not reach a balance, i.e. the labor of the work is less than the use of labor required for the satisfaction of the needs, the family must continue its economic activity as usual without wage labor4 (Chayanov, 1966: 6).
According to H. Inalcik, Chayanov’s peasant farm theory provides a compre-hensive framework for understanding the Ottoman agricultural structure. How-ever, the existence of a centralised control over land ownership and family labour seems to be the most important precondition for the continuity of such a sys-tem. Preventing both the encroachment of local gentlemen and the transforma-tion of provincial representatives of the state into centrifugal forces required the continuous and systematic struggle of the state bureaucracy. Another point that Chayanov overlooked in the peasant farm system was the unit’s animal power (the çift öküz, which was eminently mentioned in Ottoman Tahrirs). Just as modern
3 As Teoman (1999) points out, according to Chayanov, this unit is specific to a distinct mode of production, such as capitalist production or feudal production.
4 In Chayanov’s terminology this balance has been called the labor-consumption balance.

552
CHAYANOV’S AGRICULTURAL PRODUCTION MODEL: AN OVERVIEW
Cumali Bozpinar
capitalist agriculture cannot be explained without machines, the çift-hane system cannot be explained without plows and this animal power (Inalcik, 2009: 189).
The difference between these two systems, namely central control, suggested by İnalcık should be evaluated in the context of ceteris paribus in Chayanov’s anal-ysis. In other words, Chayanov laid out a theory and did not include the state in his analysis in the context of ceteris paribus, although he did not explicitly state it. On the other hand, Chayanov counted animal power among the capital of the farm family. Although Inalcik states that Chayanov does not mention plow and that his theory is incomplete in this sense, his criticism is unattractive. Our inference about Inalcik’s criticism of Chayanov is that while Chayanov was es-tablishing a theoretical structure, İnalcik was trying to compare Ottoman prac-tice with this theoretical structure.
It is also possible to mention optimal business size in peasant farm. Since the la-bor force of peasant farm cannot be easily changed, it is imperative to use other factors of production at optimal rates with this constant element. The abundance of the means of production or of the soil according to the optimal level puts an overload on the family (business) and does not result in a higher volume of ac-tivity. Because the concentration of labor beyond the level of self-exploitation is unacceptable for the family. As the capital density of the farm increases and the relative labor density decreases, the productivity of the capital falls steadily. This means that the urge to expand the farm further disappears as it approaches op-timal size (Inalcik, 2009: 191). In this context, population density is important. Population density lowers marginal returns due to the decrease in the productiv-ity of the additional labour force-due to the law of diminishing returns. Despite this, households with insufficient land are forced to increase their work density even though marginal returns fall due to the concern of meeting annual needs (Chayanov, 1966: 7). In other words, if family size increases, this increases the intensity of work.
Here it is understood that the idea that population growth will be massed by in-tensifying agricultural activity is valid. Moreover, Chayanov tacitly acknowledged that it could be increased production for the market and could be increased cap-ital by increasing labor density.
Population density and land use patterns are very important social factors that determine the economic system. Another social factor of less importance is the

PERSPECTIVES ON MODERN ECONOMY
Aizhan KHOICH, Ali Eren ALPER, Ahmet Arif EREN
553
traditional lifestyle determined by tradition and habit. This determines the extent of consumption demands and thus the internal exploitation of labour power. In a region under the conditions of natural economy, some mixed economic processes take place despite the lack of interrelationship within itself and the economic dis-connection of its economic units. The main factor in these processes is demo-graphics-population density and migration (Chayanov, 1966: 12). Changes in all this lead to a new balance, though Chayanov has not made it clear.
The peasant farm generates a single labor income as a result of the family’s own annual labor, and compares its effort with the material results to be obtained (Chayanov, 1966: 41). Here it is accepted that the peasant is not an entrepre-neur in terms of motivation in his economic activities but rather a worker based on a per-part wage system (Chayanov, 1966: 42).
The peasant, on the other hand, is not of a nature that embraces all forms of entrepreneurship, but his behaviour is governed by the balance of labour-con-sumption and his own greed. Besides, the peasant is not principled. If he gets the chance, he’ll want a good steak, a gramophone and Shell shares. However, such opportunities are not encountered much, and the farm family obtains each “ko-pek” through hard work (Chayanov, 1966: 47-8).
According to Chayanov, the pool of labor power of the family, the composition of it, and the degree of work are entirely determined by the composition and size of the family. Therefore, the composition of the family is one of the main factors determining the organization of the peasant farm –proximity to the market, the amount of land used, the availability of means of production, and natural pro-ductivity are also the determining factors. Here the minimum level of economic activity is determined by the sum of the substances required for the absolute ex-istence of the family (Chayanov, 1966: 53).
As mentioned earlier, the economic activity forms of the farm family consist of agriculture, crafts, and trades. These are the family’s annual tasks. Its economic activities are determined by the family’s annual budget opportunities and the sav-ings or capital investment to be made (Chayanov, 1966: 60).
The breadth of the family is not determined by the volume of economic activity of the family, conversely the size of agricultural activity determines the composi-tion of the family. In other words, the breadth of the family is compatible with
554
CHAYANOV’S AGRICULTURAL PRODUCTION MODEL: AN OVERVIEW
Cumali Bozpinar
the livelihood security of the family (Chayanov, 1966: 64). Thus, some determi-nations can be stated: First, the family’s composition determines the organiza-tion of the peasant farm. Second, the level of economic activity is determined by the sum of the items required for the absolute existence of the family. Third and finally, Chayanov acknowledges the existence of a balance at this point, but this balance is not at subsistence level because as we mentioned earlier “if he gets the chance, he’ll want a good steak, a gramophone and Shell shares.”5
Chayanov has stated that the intensity of work is determined by the internal structure of the family. For this, he used the coefficient “ratio of consumers to employees”. As the rate grows, the employee’s annual income grows. This refers to the increase in the working density of farm labor. When the analysis is ex-panded and other things are assumed to be fixed, the employee who is driven to work through the demand of his or her family becomes more energetic as that demand strengthens. Accordingly, Chayanov deduced that the volume of eco-nomic activity of the farm family depends entirely on the number of consumers and does not depend at all on the number of employees (Chayanov, 1966: 76-8).
Chayanov’s statements on the labor-consumption balance are interesting:
“…the subjective evaluation of the values obtained by this marginal labor will depend on the extent of its marginal utility for the farm family. But since marginal utility falls with growth of the total sum of values that become available to the subject run-ning the farm, there comes a moment at a certain level of rising labor income when the drudgery of the marginal labor expenditure will equal the subjective evaluation of the marginal utility of the sum obtained by this labor.
The output of the worker on the labor farm will remain at this point of natural equi-librium, since any further increase in labor expenditure will be subjectively disadvan-tageous. Thus, any labor farm has a natural limit to its output, determined by the proportions between intensity of annual family labor and degree of satisfaction of its demands…” (Chayanov, 1966: 81-2).
As can be seen, Chayanov made use of Marginalist concepts through anology. This is an example of a marginal utility-marginal cost analysis in which there is
5 This pattern of behavior does not match that of the homo economicus type. It can be assumed that the manner of conduct in question is based on the “agha consciousness”peculiar to pre-capitalism/noncapitalist societies. See for details Ulgener (2006).

PERSPECTIVES ON MODERN ECONOMY
Aizhan KHOICH, Ali Eren ALPER, Ahmet Arif EREN
555
a balance and there is no possibility of exploitation above that equilibrium point because working beyond this balance will reduce the total product.
However, Chayanov (1966: 78) has stated that such a exceptional determining influence of the demands of consumption will only occur if other things are as-sumed to be constant. In this context, he analyzed what would happen if the soil and technology restrictions were removed. Better employment conditions arise when there is no land constraint, and hence the amount of output increases; this inevitably raises family and consumer well-being. Moreover, the increase in out-put resulting from the increase in the number of consumers does not lead to a parallel increase in well-being, but may lead to a decrease. If there is an increase in productivity resulting from the improvement of production conditions, this increases well-being. As labor productivity increases, incomes increase signifi-cantly, but at the same time the rate of increase in incomes falls behind the rate of increase in labor productivity. This latter case shows that the increase in labor density lags behind incomes because in order to remain the same, the growth in productivity and the increase in pay per unit of labor must be proportional (Chayanov, 1966: 79-80).
When approaching the organization of an undertaking based on the principles of the peasant farm, we first all find that the labor force is fixed by being pres-ent in the composition of the family. It cannot be increased or decreased at will and other factors also necessarily bind to this factor in an optimal way (91-2). Within the scheme of the harmonically shaped structural elements of the family farm enterprise, the family labor force is constant, and the production elements of the farm come together in accordance with the usual technical harmony among themselves. Under the possibility of acquiring the necessary land and having the necessary means of production, farms are constructed within the technical opti-mal system of production factors according to the relationship between them and their size, in accordance with the optimal level of exploitation of the family labor force. Labor and land exceeding the technical optimal level would be an undue burden on enterprise. In this sense, an increase in the volume of activity is not possible because the concentration of labour beyond its established level of inter-nal exploitation is unacceptable to the family. An increase in productivity result-ing from an increase in capital density cannot be achieved once the optimal ra-tio has been reached (Chayanov, 1966: 92).

556
CHAYANOV’S AGRICULTURAL PRODUCTION MODEL: AN OVERVIEW
Cumali Bozpinar
A similar type to the family farm is the quitrent6 peasant farm, an original com-bination of the family farm with the serf farm. In this type of organization, the family “dedicated its whole labor power only to its own agricultural or other eco-nomic activity. But a noneconomic constraint forced such a unit to hand over to the owner of the laboring serf family a definite amount of the produce won by its labor” (Chayanov, 1966: 16). With the exception of this difference the quitrent farm has the same characteristics as the peasant farm as family farm organization. Al-though the quitrent amount is determined by non-economic factors depending on the owner’s enjoyment, its arbitrariness is not unlimited. The limit here is that the farm is in danger of collapse and therefore deprived of its ability to pay. Quit-rent is considered normal as long as the cost of subsistence and mandatory re-newal expenses are met. If the pressure caused by the quitrent payment brought the farm’s capital renewal to a standstill, the system would begin to undermine itself (Chayanov, 1966: 17). Population growth eradicates the quitrent system. For this, migration or colonization from over-populated places to sparsely popu-lated places is exceedingly advantageous (Chayanov, 1966: 20). The fief system, a special form of feudal style of production in which the peasants who paid trib-ute, corresponds to the quitrent peasant farm system in general terms of its eco-nomic structure. Thus, the capacity to pay tribute here also depends on improving the well-being of the population dependent on property (Chayanov, 1966: 21).
It is understood that the quitrent peasant farm and the çift-hane system are sim-ilar when it is taken into account that the state should not interfere with the or-ganization and take tax from the land used7.
Conclusion
Chayanov has revealed a micro-model that is organized according to the needs of the peasant family. Balance is provided if the needs of the family are met. There are no capitalist categories in this model, such as wage labor. This quality reflects one of the general characteristic of noncapitalist production structures.
6 It is the monetary amount that serfs pay to the feudal lord instead of the services they were previously obliged to perform (Kurmus, 2009: 203). The quitrent is a relic of feudalism. In the Middle Ages, when feudalism began to decline, the feudal obligations of the peasants were translated into an annual monetary payment, which was called the quitrent (Bond, 1912).
7 However, this issue requires more detailed study and should be examined as a separate study.

PERSPECTIVES ON MODERN ECONOMY
Aizhan KHOICH, Ali Eren ALPER, Ahmet Arif EREN
557
On the other hand, it is understood that the quitrent peasant farm and the çift-hane are similar considering that the state should not interfere with the produc-tion organization and take tax from the land used. However, Inalcik has estab-lished a similarity between the peasant farm and the çift-hane. Therefore, it is thought that it would be appropriate to reconsider the theoretical foundations of the çift-hane system.
References
Bond, Jr. B. W. (1912). The quit-rent system in the American colonies. The American Historical Review, 3 (17), 496-516. Retrieved from www.jstor.org/stable/1834386.
Chayanov, A. V. (1966). The theory of peasant economy. In D. Thorner, B. Kerblay & R. E. F. Smith (Eds). A. V. Chayanov on the theory of peasant economy. Illinois: The American Economic Association, 1-386.
Inalcik, H. (1964). The Nature of Traditional Society. In (Eds) R. Ward & D. Rustow, Political Modernization in Japan and Turkey. Princeton: Princeton University Press.
Kurmus, O. (2009). Bir bilim olarak iktisat tarihinin doğuşu. İstanbul: Yordam Kitap.
Ozveren, E. (2007). Bazaars of The Thousand and One Nights. The European Journal of The History of Economic Thought, 14 (4), 629-55.
Teoman, O. (1999). Türk tarımının kapitalizme geçiş sürecinin incelenmesi: Te-knoloji merkezli bir deneme (Unpublished phd thesis). Hacettepe University Graduate School of Social Sciences, Ankara.
Ulgener, S. F. (2006). İktisadi çözülmenin ahlak ve zihniyet dünyası. İstanbul: Derin Yayınları.
Wood, E. M. (2003). Kapitalizmin kökeni: Geniş bir bakış (1. ed.). (Trans. A. C. Aşkın). Ankara: Epos Yayınları.


559
34ÖMER LÜTFI BARKAN IN TURKISH HISTORY OF ECONOMICS: HIS PHILOSOPHY AND METHODOLOGYAslıhan Nakiboğlu1, Sevgül Işık2
Introduction
Evaluating the scientists who are known as the pioneers of the Turkish History of Economics and their studies, discussing the methodological elements of science is very crucial in terms of comprehending the scientific path followed by the Turkish History of Economics. In order to make such an assessment in the Turkish His-tory of Economics, it is essential to consider the people to be addressed, the pe-riod during which they lived, the education they received, and the people affected by their educational processes. It is getting even harder for this type of evaluation which is particularly relevant for economic historians such as Ömer Lütfi Barkan, who took lessons from lecturers such as March Bloch, Maurice Halbwvochs, and Henri Baulig, who have conducted a wide range of studies and dealt with events with a new spirit and approach. Emphasizing that the knowledge of history is very important for both Turkey and the economic domain, Ömer Lütfi Barkan is able to explain what, with which thoughts, why, and how the author did so in order to understand the methodology of science in the economic history in the best way, and how and in what way the scientists who came after him. Thus, it will be easier to evaluate the studies in which the Turkish History of Econom-ics has focused on understanding the Ottoman State system, and the positive or deficient aspects of the methodology and findings would be revealed more pro-foundly. Ömer Lütfi Barkan has conducted more than 200 studies during his lifetime. Assessment of all of his written works is too broad for the scope of this study. In the study, rather than writing the biography of Ömer Lütfi Barkan, the
1 Assoc.Prof.Dr. Niğde Ömer Halisdemir University, FEAS, Orcid: 0000-0002-6825-984X2 Master’s Student, Niğde Ömer Halisdemir University Institute Of Social Sciences, Department Of
Economics, Orcid: 0000-0001-8314-4760,

560
ÖMER LÜTFI BARKAN IN TURKISH HISTORY OF ECONOMICS: HIS PHILOSOPHY AND METHODOLOGY
Aslıhan Nakiboğlu, Sevgül Işık
contributions of the author to Turkish Economic historiography are emphasized. The author’s views, philosophy, and methods in his works are explicated. As a re-sult, with the works of Ömer Lütfi Barkan, as the founder of Turkish History of Economics, his contribution to the Turkish history with a variety of studies, me-ticulous explication of the economic and social structure with the more carefully examined, territorial issues, bringing the Annales the impact of school in Tur-key that successfully implemented their works, archival studies which give much importance, taking up the Ottoman history as a whole, emphasizing the impor-tance of the problems in education and the necessity of applying interdiscipli-nary studies to science along with the importance of history education in which he studied the effect on the Ottoman functioning.
This indicates that Ömer Lütfi Barkan made an important contribution to social and economic history with his new economic ideas and new economic methods by diverging from the narrative history understanding in which the political and military historiography elements in Turkish History of Economics are more in-tense. Thus, the history of Turkish economics got rid of tradition and left it as an important legacy to new generations how to write history with modern method-ology. Ömer Lütfi Barkan has been a pioneer scientist in interdisciplinary studies not only in his own generation but also in the following generations.
Life of Ömer Lütfi Barkan
Because science is a special discipline, it has a certain method and way of work-ing. In his/her studies, the scientist concentrates on observational phenomena in the outside world and tries to reveal causal connections and makes predictions by evaluating the emergence conditions of the phenomena. It tries to explain these connections with universal definitions. For this, scientific studies function with a special scientific discipline and the rules are clear. Scientists turn to the envi-ronment depending on these rules. Human-specific scientific studies aim to pro-vide better living conditions for human life and to make progress. Science is also shaped by the most curious concepts. Every scientist questions mankind and in-vestigates people and nature. Scientists question the concepts they deal with, learn, and try to understand the problems. Scientist upbringing conditions are shaped by society as well as by science and their own curiosity (Unat, 2017: 13).

PERSPECTIVES ON MODERN ECONOMY
Aizhan KHOICH, Ali Eren ALPER, Ahmet Arif EREN
561
Biographies are important in terms of presenting life stories of people according to a certain chronology. Since the people whose biographies are written are not ordinary people, they are the people whose studies and theories that participated in the political social structures of the period during which they lived were in-fluenced by the period they belonged to. Under this title, information regarding the life of Ömer Lutfi Barkan, one of the most important scientists of Turkey’s economic history, is presented.
Ömer Lütfi Barkan was born in 1902 in Edirne. After completing his primary and secondary education there, he finished Edirne Muallim School. He worked as a primary school teacher for three years. After studying for a year at the Sec-ondary Teacher Training School, which was opened in Istanbul in 1923, he en-rolled in the Faculty of Letters and the Higher Teacher Training School. Having graduated from the Faculty of Philosophy in 1927, Barkan was sent to the Uni-versity of Strasbourg Faculty of Letters to be trained as a high school teacher. Af-ter completing an undergraduate program in this faculty with his general philoso-phy, sociology, and psychology certificates from the Faculty of Law, he completed a second undergraduate program and was appointed as a philosophy teacher at Eskişehir High School (Çakır, 2003: 23).
During the higher education reform, Barkan was appointed as an Associate Profes-sor at the Turkish Revolution Institute Istanbul University in 1933, and in 1937 he became an Associate Professor in the Department of Economic History and Economic Geography. He was promoted to a professorship in 1941 and ordinar-ius professorship in 1957. Meanwhile, he served as the Dean of the Faculty of Economics between 1950-1952. Barkan, who was also the chairman of the De-partment of Economic History, has been teaching the History of Turkish Revo-lution at the Faculties of Literature and Science. He has given Turkish Law His-tory courses at the Faculty of Law for six years after 1941 (Kaplan, 2008: 4-5).
Barkan, who founded the Turkish History of Economics Institute in 1950 and made an effort to publish the Faculty Journal’s economic history issues, retired in 1973. He was given the title of “Doctor of Honor” by the University of Stras-bourg in 1943, and in 1968 he was elected as “reporter member” to the Belgrade Academy of Yugoslavia. He was invited for a long time to the University of Paris, the History Institutes of Yugoslavia, Romania, and Bulgaria to hold conferences. Since 1940, he has been the principal member of the Turkish Historical Society

562
ÖMER LÜTFI BARKAN IN TURKISH HISTORY OF ECONOMICS: HIS PHILOSOPHY AND METHODOLOGY
Aslıhan Nakiboğlu, Sevgül Işık
and the chairman of the “Ottoman and Pre-Ottoman History Committee” af-filiated to the International Union of Orientalists. He died on August 23, 1979, in Istanbul and was buried in Edirnekapı Martyrdom on August 28, 1979 (Ka-rahasanoğlu, 2012: 144-145).
A scientist can make universal contributions to science by leaving a certain soci-ety and by developing economically, politically, and socially in that society. Thus, Ömer Lütfi Barkan, as a scientist, also became prominent by preparing the society he lived in for new information. This has been a crucial indicator that Ömer Lütfi Barkan provided the society and its current conditions with his scientific views.
Ömer Lütfi Barkan’s Contributions to History of Economics
Scientific studies have been given with a traditional understanding for years. In or-der to better comprehend the studies about the Ottoman Empire, elements such as the economic activities of the state, socio-cultural values, and demographic structure and should be well apprehended. Ömer Lütfi Barkan, as the founder of economic history in Turkey, examined the economic, social, and cultural ele-ments of the Ottoman Empire using historical studies. With his interdisciplinary studies, he ensured that the history of Turkish Economics is included in univer-sities as a branch of science in Turkey.
The history of economics was accepted as a distinct and independent scientific discipline, apart from history and economics, and entered universities as an ac-ademic discipline, with the establishment of the Department of Economics his-tory for Cunningham and W. J. Ashley at Harvard University in 1892 (Turhan, 2011: 21-22). The founder of the field of economic history has been recognized as Ömer Lütfi Barkan in Turkey. Ömer Lütfi Barkan is undoubtedly the person who brought the science of economic history to Turkey by courtesy of his studies.
Barkan has not studied history. He is a graduate of philosophy. After graduat-ing from Istanbul University, Faculty of Letters, he was sent by Prof. Albert Ga-briel to the French University of Strasbourg to study philosophy and sociology. At the university, he was impressed by March Bloch, the representative of the Annales school. He also took lessons from lecturers such as Maurice Halbwachs and Henri Baulig.

PERSPECTIVES ON MODERN ECONOMY
Aizhan KHOICH, Ali Eren ALPER, Ahmet Arif EREN
563
Barkan began to attract attention with the articles he wrote in the Faculty of Po-litical Sciences and the Ülkü Journal in 1936 and 1937. In 1937, Ömer Celâl Sarac, the dean of the Faculty of Economics, requested Barkan’s attendance to the faculty. Barkan responded positively to this request and was appointed to the Faculty of Economics in 1938. He prepared his associate professorship the-sis on “Land Issues in the Ottoman Empire During the Era of Establishment”. The thesis jury consisted of Fuat Köprülü, Alexandre Von Rüstow, and Ebül ulâ Mardin. He acquired the title of “Associate Professor of General Economics and Economic History” in 1939 (Sahillioğlu, 1985: 3-10).
Following World War II, the socio-economic history defended by the Annales school has come to the fore in the world. Annales History School has emerged with a new understanding of history against the traditional understanding of his-tory. Barkan studied in Strasbourg in such an environment, and the French An-nales School had a great influence on his understanding of history.
The views of the Annales School of History can be briefly summarized as fol-lows. First, the traditional narrative of political events has been replaced by a prob-lem-oriented understanding of history. Second, the activities of societies and people are important rather than politics-oriented history. The third involves the collab-oration between the science of history and other sciences (Burke, 2006: 23-24).
The Annalesists’ understanding of other sciences is as follows: “If history is to be given new blood, it can only be made possible by the conquest or even subjuga-tion of geography, linguistics, economics, demography, political science, clima-tology, and psychology.” (Boratav, 1985: 11).
Barkan, who studied the economic and social history of the Ottoman State, mostly focused on the XVI. and XVII. centuries. His research on the Ottoman budgets, accounting balance sheets of imâret and foundations, and sancakname made great contributions to the enlightenment of the Ottoman economic and social history. Barkan is primarily a scientist who brought innovation to the understanding and examination of history in Turkey. He drew attention mostly with his new and original researches in the field of the Turkish History of Economics. Tahrir note-books were examined systematically by him for the first time and their agricul-tural, social, and demographic importance was revealed. Ottoman budgets and accounting balance sheets are also the issues on which he focused for the first time (Kütükoğlu, 1992: 74-76).

564
ÖMER LÜTFI BARKAN IN TURKISH HISTORY OF ECONOMICS: HIS PHILOSOPHY AND METHODOLOGY
Aslıhan Nakiboğlu, Sevgül Işık
Several articles were published about him after his death. Gevgili (1979) stated in his article that we owe the knowledge of the Ottoman order and its characteristics to Ömer Lütfi Barkan. Güçer (1979) attributes to Barkan’s success in explaining the important problems of the economic and social life of the Ottoman Empire by using a statistical method with archive material. According to Çizakça (1979), Barkan not only represented the Annales school but determined the place of the Ottoman economy in the world economy. Turkey has lost a very valuable scientist.
Barkan, with his interdisciplinary studies conducted on social history, economic history, and historical demography domains, has rescued the conception of history in Turkey from the traditional point of view and has brought up a new method. By conducting research on many subjects, he has produced unique works for the Turkish History of Economics. Barkan has been quite important in the transfor-mation of the Turkish economy into a scientific discipline with the dawn of the Turkish History of Economics having aspects of the development and evolution. The works written in the field of Turkish History of Economics with the inter-disciplinary studies of Ömer Lütfi Barkan have made important contributions in terms of its scientific expression by diverging from the traditional understanding and developing its own methodology with a more modern expression. With his research studies, Ömer Lütfi Barkan explored the history of economics for the Turkish history of economics and showed all scientists with his scientific activi-ties that this field is an important structure to be studied.
Basic Issues Addressed by Ömer Lütfi Barkan in his Works:
Barkan has carried out many studies on economic and social history. Especially, he has concentrated on the XVI. and XVII. centuries. It is seen that Ömer Lütfi Barkan focused more on comprehending the Ottoman State system in his works. In particular, the social and economic structure of the state, conquest (coloniza-tion), the maximum utilization of the conquered lands through assignment and foundations, the land system, the population issue, the military order, and se-curity have been his main concerns. The ultimate goal of Barkan, who studied with primary sources by applying to various Ottoman documents, especially the foundations and records, was to reveal that the Ottoman Empire, like Köprülü and other researchers, had been the heir of a prosperous heritage and to draw at-tention to the depth of its roots (Barkan, 1943: 343-354. ). The topics Ömer Lütfi Barkan generally handled are summarized under the following headings.

PERSPECTIVES ON MODERN ECONOMY
Aizhan KHOICH, Ali Eren ALPER, Ahmet Arif EREN
565
Charitable Foundations
Many social, cultural, religious and economic services in the nature of public ser-vice in the Ottoman state were carried out by foundations. The Ottoman cultural structure and Islam, which left its mark on this structure, in particular, urged peo-ple to participate in charitable activities, to do good to each other, to think not only of their own selfish interests but also of others. Thus, wealthy people were directed to allocate a certain portion of their wealth to help the poor. In this way, mutual aid and solidarity among people in the Ottoman social order became a rule. The most important legal institution providing this is defined as the Foun-dation Institution (Eren, 1988: 195).
Barkan has conducted multidisciplinary studies on charitable foundations in the Ottomans. His examinations on the status, types and functioning of foundations have an important place. As in his other studies, his publications on foundations are not just a document publication, but there are very broad introductory eval-uations at the beginning. As a matter of fact, the examination of the legal status, economic and social problems of foundation facilities at the seminal work enti-tled Istanbul Foundations Tahrîr Ledger 953 (1546) (Istanbul, 1970), which he published with Ekrem Hakkı Ayverdi, is an example of this. Accounting balance sheets belonging to foundations, which are systematically published in the Faculty of Economics Magazine and the Journal of Foundations, are very valuable sources exhibiting the functioning of foundations in the Ottomans. Barkan’s selection of accounting books reflecting the operation of the institution and the way it took in practice, while many researchers before him and in his period published the endowments, which were a static document, reveals his approach to issues and his accuracy in diagnosis (Barkan and Ayverdi, 1970; Kütükoğlu, 1992: 74 -76).
Barkan pointed out that the records of foundations are materials that indicate not only the belief structure of a society, but also, and perhaps rather, its social and economic systems and relationships, customs and family structures. For in-stance, the Tahrir Ledger of the Istanbul Foundations dated 1546, apart from these features, contains very important materials to enlighten the economic and social situation of is the XV. and XVI. centuries. This tahrir ledger has gathered the inspections made to form the inventory of Istanbul foundations (Kaplan, 2008: 19). Barkan examined many population and land registrations and gave information about the foundation revenues of the 16th century. For example, according to the 1530-1540 tahrirs of the Anatolian province, the total income

566
ÖMER LÜTFI BARKAN IN TURKISH HISTORY OF ECONOMICS: HIS PHILOSOPHY AND METHODOLOGY
Aslıhan Nakiboğlu, Sevgül Işık
was 79,784,960 akçe. 13,641,684 akçe, or 17% of this income, belongs to foun-dations. At that time, the salaries and expenses of people working in charities in Anatolia were obtained from these foundation revenues (Barkan, 1962-63: 242). Barkan emphasized the role of foundation facilities in the reconstruction and set-tlement of Istanbul. The imaret (charity) system, which was administered by the foundation previously applied in Bursa and Edirne, was also applied here. Gen-erally, facilities such as madrasahs, armories, hospitals, baths, caravanserai, bak-eries, mills, market places gathered around the big mosque formed the basis of new districts in Istanbul. The best example of the development activities in Istan-bul is the Fatih Mosque and its imaret and Hagia Sophia Mosque foundations, which were established by Fatih Sultan Mehmet himself from his own property (Kaplan, 2008: 21).
So many foundations operated in Istanbul, which was a very large city for its era, and the city’s municipal and civic affairs were realized through these insti-tutions. Moreover, foundations occupied the most important place in the zon-ing and settlement policy following the conquest, enabled the city to be named a “city of domes and minarets” with its new architecture, and laid the founda-tions of newly established neighborhoods. It has been observed that the charita-ble foundations had a great deal of impact on the social and economic aspects of the Ottoman period.
Land Issues and Laws
Land issues have been the area on which Barkan has mostly spent time. In a sense, he would be considered to “devote himself to settle territorial issues of Turkey’s place”. Ömer Lütfi Barkan, who did not want to go beyond the classical period of the Ottoman Empire in other fields on which he studied, focused his studies on land issues on a line that extends to the pre-Ottoman, classical period, mod-ernization periods, as well as the Tanzimat period, even the Republic period.
Ömer Lütfi Barkan began his publishing life with his article entitled “Post-War Agricultural Reform Movements”. In this article, he gave information on land reforms at the end of the war in farming countries such as Bulgaria, Yugoslavia, Romania, Greece, Poland and Russia. Barkan emphasized that agricultural issues have been effective in the collapse and dispersion of states. According to him,

PERSPECTIVES ON MODERN ECONOMY
Aizhan KHOICH, Ali Eren ALPER, Ahmet Arif EREN
567
states that did not attach the necessary importance to land issues have lost at the beginning (Barkan, 1980: 125-149).
Barkan, at first, emphasized systematically on land laws and revealed their im-portance in terms of Ottoman economics and administrative history. He pub-lished his first systematic article on this subject entitled “Tanzimat in the History of Turkish Land Law and Land Law dated 1274 (1858)” (Tanzimat I, Istanbul 1940, p. 321-421). Here, after introducing the subject of land law before the Tan-zimat and the land inheritance and the characteristics of the transition period, he examined the preparation and the principles contained in the 1274 land law.
Barkan’s most extensive study on the Ottoman land law is his work entitled “The Legal and Financial Principles of Agricultural Economy in the Ottoman Empire in the XV. and XVI. Centuries, First Laws (Istanbul 1945)”. In the extensive intro-duction of the work (pp. I-LXXII), the Ottoman laws and statutory laws were emphasized, and the issues such as the religious law of the Ottoman institutions, the quality and lack of a system of the existing laws, the fatwa system and the lawmakers, the state of the sheikhulislam, the lawmaking of the Ottoman sultans were examined. These opinions, which Barkan repeated with small differences in various articles, especially the “Kanunnâme” article (VI, pp. 185-196) in the En-cyclopedia of Islam, brought up the debate on whether or not the Ottoman Em-pire was secular and pioneered the emergence of different opinions. The “Fief” article (XII, 286-333) in the Islamic Encyclopedia about the Ottoman land sys-tem by Barkan is the research he has worked on for a long time and reflects the results of his studies on the land system up to that day. According to his own ex-pression, it is enough to read only this instead of many of his articles on the Ot-toman land regime (Kütükoğlu, 1992: 74-76).
Budgets
“The Ottoman state budgets are defined as the most reliable sources through which the revenues and expenses of the state can be monitored. In accordance with the Ottoman Empire’s conquest policy, the impact of the central treasury on the income structure is monitored through budgets” (Çakır, 2016: 114). Ömer Lütfi Barkan also believed that “a state’s economic, political, social, and mili-tary elements would not mean anything without knowing the financial struc-ture of a state’s tax system, its budget, civil servant salary, monetary policy, the

568
ÖMER LÜTFI BARKAN IN TURKISH HISTORY OF ECONOMICS: HIS PHILOSOPHY AND METHODOLOGY
Aslıhan Nakiboğlu, Sevgül Işık
types of economic crises and their contents” (Barkan, 1953b: 238). Therefore, he switched his attention to the budgets included in the Ottoman archive doc-uments. Barkan, for the first time, prepared material for the Ottoman fiscal his-tory by focusing on the Ottoman budgets and publishing many budgets as they were. Undoubtedly, the first published budgets did not include the materials of modern budgets. These were mostly income-expense accounts indicating some of the costs and revenues of the central state. The first published budget belongs to the fiscal years of 1527-1528 (Barkan, 1953a: 251-329). After that, he pub-lished the budgets for the fiscal years of 1547-1548, 1567-1568, 1660-1661, and 1669-1670, respectively. Besides, the accounting balance sheets also contain the first degree material on this subject.
Barkan drew attention to the importance of budgets in terms of economic and financial history and stated that investigating budgets or state-owned revenue and expenditure records would occupy an important place in the economic-financial history of a state: Because all kinds of organizations and activities of the state must be among the state expenses and must be included and expressed in num-bers as a certain allowance. On the other hand, it is not possible for economic and political crises, famine, epidemics or extraordinary situations such as war to not be reflected in the revenue and expenditure accounts of the state (Barkan, 1953b: 238). Ömer Lütfi Barkan is seen in his studies that he attached impor-tance to controlling the budget figures by comparing them with other sources, or-ganizing the budgets in detail, separating the financial organization of the central government into items, determining the duties and responsibilities of each per-son, paying attention to tax procedures and supporting documents on taxation.
Essays
In the history of the Ottoman Empire, tahrir ledgers have always been impor-tant among archive sources. Tahrir ledgers contained various economic and so-cial data regarding the fief system, demographic structure, determination of the state’s production resources, tax concept. Today, many scientists conducting in-terdisciplinary studies would benefit from different subjects including scientific fields in their studies. Barkan, in order for research studies on the history of Tur-key to reach the desired position, argued that Turkey should be examined utilizing new methods by replacing the old storyteller’s understanding of history. Accord-ing to Barkan, in order to explain the economic and social events in a real sense,

PERSPECTIVES ON MODERN ECONOMY
Aizhan KHOICH, Ali Eren ALPER, Ahmet Arif EREN
569
they must be measured by numbers and compared with statistics. New statisti-cal methods for the implementation of Turkey’s history has significant resources. The most valuable treasures of the archives are population and land tahrir ledg-ers. These ledgers were the main records that contained the results of population and land censuses conducted in the Ottoman Empire every thirty or forty years (Kaplan, 2008: 29).
Based on the records in the tahrir ledgers, he made population estimates for vari-ous cities of the Empire, especially Istanbul. In the meantime, he developed a for-mula, which he discovered in a sense and which was recognized by almost all those researchers who studied in this field; coefficient of 5. According to this formula, the population census is based on households and each household is assumed to have an average of five people (Barkan, 1953c: 1-20). Ömer Lütfi Barkan empha-sized the importance of Ottoman state tahrir ledgers for the first time according to economic, social and demographic terms with his systematic study of registries.
Price Volatility
Research on historical price movements has been very important in the field of economic, financial and social history. Price volatility provides an opportunity for a state to assess the periods of economic development and contraction. Scientists use very abundant archive documents when it comes to the Ottoman Empire. These are “Foundations’ accounting books, charity registers, narh ledgers, narh registers, estate registers, palace kitchen accounts, etc. “(Orbay, 2008: 86). Bar-kan examined the impacts of population and price movements in the world on the Ottoman Empire in the XVI. century using the price index he creates with the records of the accounting books. He has written many articles on this sub-ject in order to write a systematic history of price. He mentioned the price detec-tion procedures in the acquisition regulations in some big cities. On the date of 1501, which was arranged by the order of Sultan Beyazit the Second, he published three acquisition laws of Istanbul, Bursa, and Edirne.” (Barkan, 1942: 326-340).
Barkan replaced the Turkish historiography paradigm with economic historiog-raphy. In this sense, he conducted a study entitled “The Price Movements in Tur-key at the beginning of the XVI. Century” that is paramount of Barkan’s economic history studies (Barkan, 1970: 557-697). In a sense, this study has a special place in the studies of the Turkish and world history of economics.

570
ÖMER LÜTFI BARKAN IN TURKISH HISTORY OF ECONOMICS: HIS PHILOSOPHY AND METHODOLOGY
Aslıhan Nakiboğlu, Sevgül Işık
As in many other fields, Barkan was the first person to emphasize the importance of the Historical Demographic Research or History of Demography for the his-tory of economics. Barkan is also the name that conveys the discussions on the subject to Turkey. Its economic life based on modern Turkey has been striving to clarify all the details of the underlying intellectual heritage. In his studies, Bar-kan has put forth an effort to present available information on the direction and size of the overall change in Turkey. In line with such effort, he continued to question the issues from various aspects on the basis of the persistence of Turk-ish society and put forward detailed studies extending to land issues during the establishment period. Barkan’s work should be evaluated on the basis of a dis-tinct perception of historical persistence from the foundation of the Ottoman Empire to the Republic of Turkey. These resources would not only allow the re-searcher to compare and analyze price data, but also help us to perceive market movements and price analysis.
Ömer Lütfi Barkan’s Methodology
“One of the most important discussion topics of scientific studies has been the concepts of methodology in all branches of science. It is thought that the reason for the scientific thinking process for the scientists who conduct scientific works with difficulties involves the fact that necessary importance is not attached to the philosophy of science in the country. The history of economics, which is very important in social sciences, is also included in this structure.” (Dolgun, ty .: 1). After the History of Economics was accepted as a discipline, it has been attract-ing the attention of many scientists until today. “It has been developed in such a way that it causes the reorganization of the subject, method, and similar features of the economic history studies, which are included in an interdisciplinary field. Economics historians suggest that a non-economic phenomenon would also lead to economic consequences, and it is known that the economic historian should act multidimensionally based on interdisciplinary knowledge, events and facts.” (Özbay ve Varlı, 2009: 344).
Ömer Lütfi Barkan has carried out very important studies on Economics, Eco-nomic History, Demography and social history. With his studies, he liberated the Turkish History of Economics from traditionalism and reshaped the concepts with a brand new methodology and a new history methodology. According to Barkan, in order to explain economic and social events in real terms, it is necessary to

PERSPECTIVES ON MODERN ECONOMY
Aizhan KHOICH, Ali Eren ALPER, Ahmet Arif EREN
571
measure them with numbers and compare them with the help of statistical tables. Ottoman history has an important opportunity to apply the mentioned meth-ods. These opportunities are among the leading tahrirs (Barkan, 1952: 290-294).
By drawing particular attention to the importance of statistics, Barkan expressed the necessity of using population statistics in order to realize these practices. He mentioned the development of ‘Historical Demography’ as an independent dis-cipline. In this respect, tahrirs are also important sources of population statistics.
After 1951, a close friendship was formed between Barkan and Braudel. Braudel mentioned Barkan’s research study in the second edition of his work. Braudel and Barkan’s view that “history cannot be written without documents” is very crucial for historians. Barkan has raised Turkish historiography to the level of Western historiography in terms of subject and methodology. He has brought a social-eco-nomic view of the history of the Annales school in Turkey (Çaykara, 2005: 115).
Barkan, who studied the economic and social history of the Ottoman State, focused mostly on the XVI. and XVII. centuries. His research on the Ottoman budgets, accounting balance sheets of imâret and charitable foundations, and sancaknames has made great contributions to the enlightenment of Ottoman economic and so-cial history. Tahrir ledgers were examined systematically by him for the first time. Barkan argued the examination of the history of Turkey with new methods by re-placing the old storyteller understanding of history in order for the research stud-ies on the history of Turkey to achieve their desired position. According to him, in order to explain economic and social events in a real sense, it is required to meas-ure them with numbers and compare them with statistics. Turkish archives have important resources for the application of new statistical methods. His views on this issue are as follows: “There is a need for population statistics of the relevant period, numbers indicating the composition styles of agricultural revenue sources in various dates, and statistical tools and methods especially used by modern so-cial sciences to interpret these numbers.” (Barkan, 1952: 291).
He utilized a method far from ideology and based on documents in his research study which has reached thousands of pages on the economic and social history of Ottoman history. His studies revealed the economic history behind the Ot-toman history, which appears to be the history of the dynasties. With his stud-ies, he taught how to record history using modern methods by liberating Turk-ish historiography from traditionalism.

572
ÖMER LÜTFI BARKAN IN TURKISH HISTORY OF ECONOMICS: HIS PHILOSOPHY AND METHODOLOGY
Aslıhan Nakiboğlu, Sevgül Işık
Conclusion
Ömer Lütfi Barkan, the founder of the history of economics in Turkey, has brought a different approach to the study of Turkish history with his research studies. This style of approach has brought his name to the fore in the field of social and eco-nomic history. He started his prominent publication life with articles conducted on the land issue in the Ottoman Empire. Although he is not a historian, he dis-covered the history of economics following his education at Strasbourg University.
He initiated economic historiography, in modern terms, in Turkey. He liberated Turkey’s historiography from traditionalism and generated a new methodology of history. Barkan also touched on history education and teaching problems and ar-gued that history teachers should be educated in subjects such as art history, cul-tural history, and history of civilization. This view indicates how much he attached importance to science outside the history discipline. Ömer Lütfi Barkan has con-ducted many studies on land order, agriculture, land law, foundations, budgets, price movements, urbanism, religion-state. Thus, with his studies, he became the founder of the history of economics in Turkey and brought a different approach to the field of the Turkish History of Economics. Stating that there would be no history without undocumented archive documents, he bequeathed the value of statistical studies as a valuable informational legacy to the next generations.
References
BARKAN, Ömer Lütfi (1943). “Osmanlı İmparatorluğunun Teşekkülü Me-selesi”, Ankara Üniversitesi Siyasal Bilgiler Fakültesi Dergisi, 1 (2), 343-354.
BARKAN, Ömer Lütfi (1952). “Tahrir Defterlerinin İstatistik Verimleri Hak-kında Bir Araştırma”, IV. Türk Tarih Kongresi (Tebliğler), 10-14 Kasım, ss. 290-294.
BARKAN, Ömer Lütfi (1953a). “H. 933-934 (M. 1527-1528) Malî Yılına Ait Bir Bütçe Örneği”, İ.Ü. İktisat Fakültesi Mecmuası, 15 (1-4), 251-329.
BARKAN, Ömer Lütfi (1953b). “Osmanlı İmparatorluğu Bütçelerine Dair Notlar”, İ.Ü. İktisat Fakültesi Mecmuası, 15 (1-4), 238-250.

PERSPECTIVES ON MODERN ECONOMY
Aizhan KHOICH, Ali Eren ALPER, Ahmet Arif EREN
573
BARKAN, Ömer Lütfi (1953c). “‘Tarihi Demografi’ Araştırmaları ve Osmanlı Tarihi”, Türkiyat Mecmuası, 10, 1-26.
BARKAN, Ömer Lütfi (1963). “Türkiye Şehirlerin Teşekkül ve İnkişafı Tarihi Bakımından: Osmanlı İmparatorluğu’nda İmaret Sitelerinin Kuru-luş ve İşleyiş Tarzına Ait Araştırmalar”, İstanbul Üniversitesi İktisat Fakültesi Mecmuası, 23 (1-2), 239-296.
BARKAN, Ömer Lütfi (1970). “XVI. Asrın Başlarında Türkiye’de Fiyat Hareketleri”, Belleten, 34 (136), 557-697.
BARKAN, Ömer Lütfi (1980). Türkiye’de Toprak Meselesini Tarihi Esasları” Tür-kiye’de Toprak Meselesi: Toplu Eserler I, Gözlem Yayınları, İstanbul, ss.125-149.
BARKAN, Ömer Lütfi 1(942). “XV. Asrın Sonunda Bazı Büyük Şehirlerde Eşya ve Yiyecek Fiyatlarının Tesbit ve Teftişi Hususlarını Tanzim Eden Kanunlar I”, Tarih Vesikaları Dergisi, 1(5), 326–340.
BARKAN, Ömer Lutfi ve AYVERDİ, Ekrem Hakkı (1970). İstanbul Vakıfları Tahrîr Defteri: 953 (1546) Târîhli, İstanbul Fetih Cemiyeti İstan-bul Enstitüsü, İstanbul.
BORATAV, Ali (1985). (Derleyen) Tarih ve Tarihçi - Annales Okulu İzinde, Alan Yayıncılık, İstanbul.
BURKE, Peter (2006). Fransız Tarih Devrimi: Annales Okulu (çev. Mehmet KÜÇÜK), Doğu-Batı Yayınları, Ankara.
ÇAKIR, Baki (2016). “Osmanlı Devleti’nin Bilinen En Eski (1495-1496) Bütçesi ve 1494-1495 Yılı İcmali”, Osmanlı Araştırmaları , 47 (47) , 113-145 . DOI: 10.18589/oa.582970
ÇAKIR, Çoşkun (2003). “Türkiye’de İktisat Tarihi Çalışmalarının Tarihi Üze-rine Bir Deneme”, Türkiye Araştırmaları Literatür Dergisi, 1 (1), 7-63.
ÇAYKARA, Emine Tarihçilerin Kutbu: Halil İnalcık Kitabı, İş Bankası Yayın-ları, İstanbul, 2005.
ÇİZAKÇA, Murat (1979). “Bir Büyük Hocayı Yitirdik”, 31 Ağustos 1979, Cumhuriyet.
DOLGUN, Uğur (t.y). İktisat Metodolojisi, İstanbul Üniversitesi, Açık ve Uzaktan Eğitim Fakültesi, https://cdn-acikogretim.istanbul.edu.

574
ÖMER LÜTFI BARKAN IN TURKISH HISTORY OF ECONOMICS: HIS PHILOSOPHY AND METHODOLOGY
Aslıhan Nakiboğlu, Sevgül Işık
tr/auzefcontent/19_20_Guz/iktisat_metodolojisi/index.html (15.08.2020).
EREN, Fikri (1987). Eren, Fikret. “Osmanlı Dönemi Vakıfları”. V. Vakıf Haftası Kitabı içerisinde (195-201). Vakıflar Genel Müdürlüğü Yayını, Ankara.
GEVGİLİ, Ali (1979). “Osmanlı Sırları ve Prof. Barkan”, Milliyet, 28 Ağustos 1979.
GÜÇER, Lütfi (1979). “Barkan ile Aydınlanan Tarih”, Milliyet, 30 Eylül 1979.
KAPLAN, Hatice (2008). Ömer Lütfi Barkan’ın Tarih Anlayışı, Yüksek Lisans Tezi, Atatürk Üniversitesi Sosyal Bilimler Enstitüsü, Erzurum.
KARAHASANOĞLU, Cihan Osmanağaoğlu (2012). “Ömer Lütfi Barkan ve Türk Hukuk Tarihi”, İÜHFM, LXX (1), 413- 440.
KÜTÜKOĞLU, Mübahat S. (1992). BARKAN, Ömer Lutfi, TDV İslâm An-siklopedisi, 5. Cilt, İstanbul, İstanbul, 74-76, https://cdn.islaman-siklopedisi.org.tr/dosya/5/C05001828.pdf
ORBAY,Kayhan (2008). “Tarihsel Fiyatların Elde Edilmesi v Endekslenmesi Konusunda Bazı Notlar”, Ankara Üniversitesi Dil ve Tarih Coğrafya Fakültesi Dergisi, 48,1 (1) 85-96
ÖZBAY, D.Rahmi. ve VARLI, Arzu (2009). “İktisat Tarihinde Değer Yarat-mak: Danışman Yöntem Ve Hazırlayan Temelinde Türkiye’de Ikti-sat Tarihi Lisansüstü Çalışmaları Üzerine Bir Değerlendirme” (344 -389) Uluslararası 7. Bilgi, Ekonomi ve Yönetim Kongresi Bildirileri Kitabı. Yalova, Türkiye.
SAHİLLİOĞLU, Halil (1985). “Ömer Lütfi Barkan”, İ.Ü. İ.F.M. 41 (1-4), 3-38.
TURHAN, Rıdvan (2011). Türkiye’de İktisat Tarihi Çalışmalarının Gelişimi, Doktora Tezi, İstanbul üniversitesi Sosyal Bilimler Enstitüsü, İs-tanbul.
UNAT, Yavuz (2017). “Bilim Tarihinde Örneklerle Genç Bilim İnsanlarına Öneriler”, Üstün Zekâlılar Eğitim ve Yaratıcılık Dergisi, Nisan 4(1), 13-26.

PERSPECTIVES ON MODERN ECONOMY
This book aims to provide researchers from basic disciplines of the economics fields such as consumer behavior and public economy with a variety of distinctive perspectives in today’s world where the behavior and preferences of economic actors have changed completely, and the economic policies of countries have been redrafted.
PERS
PECT
IVES
ON
MODE
RN E
CONO
MY
Edited by
Aizhan Khoich
Ali Eren Alper
Ahme
t Arif Eren

PERS
PECT
IVES
ON
MODE
RN E
CONO
MY
Edited by
Aizhan Khoich
Ali Eren Alper
Ahme
t Arif Eren
Related Documents