Modern Artificial Recharge Plants Combining chemical flocculation with aquifer recharge Hägg, Kristofer 2020 Document Version: Early version, also known as pre-print Link to publication Citation for published version (APA): Hägg, K. (2020). Modern Artificial Recharge Plants: Combining chemical flocculation with aquifer recharge. Water Resources Engineering, Lund University. Total number of authors: 1 General rights Unless other specific re-use rights are stated the following general rights apply: Copyright and moral rights for the publications made accessible in the public portal are retained by the authors and/or other copyright owners and it is a condition of accessing publications that users recognise and abide by the legal requirements associated with these rights. • Users may download and print one copy of any publication from the public portal for the purpose of private study or research. • You may not further distribute the material or use it for any profit-making activity or commercial gain • You may freely distribute the URL identifying the publication in the public portal Read more about Creative commons licenses: https://creativecommons.org/licenses/ Take down policy If you believe that this document breaches copyright please contact us providing details, and we will remove access to the work immediately and investigate your claim.

Welcome message from author
This document is posted to help you gain knowledge. Please leave a comment to let me know what you think about it! Share it to your friends and learn new things together.
Transcript

LUND UNIVERSITY
PO Box 117221 00 Lund+46 46-222 00 00
Modern Artificial Recharge Plants
Combining chemical flocculation with aquifer rechargeHägg, Kristofer
2020
Document Version:Early version, also known as pre-print
Link to publication
Citation for published version (APA):Hägg, K. (2020). Modern Artificial Recharge Plants: Combining chemical flocculation with aquifer recharge.Water Resources Engineering, Lund University.
Total number of authors:1
General rightsUnless other specific re-use rights are stated the following general rights apply:Copyright and moral rights for the publications made accessible in the public portal are retained by the authorsand/or other copyright owners and it is a condition of accessing publications that users recognise and abide by thelegal requirements associated with these rights. • Users may download and print one copy of any publication from the public portal for the purpose of private studyor research. • You may not further distribute the material or use it for any profit-making activity or commercial gain • You may freely distribute the URL identifying the publication in the public portal
Read more about Creative commons licenses: https://creativecommons.org/licenses/Take down policyIf you believe that this document breaches copyright please contact us providing details, and we will removeaccess to the work immediately and investigate your claim.

Modern Artificial Recharge PlantsCombining chemical flocculation with aquifer rechargeKRISTOFER HÄGG | FACULTY OF ENGINEERING | LUND UNIVERSITY

Lund UniversityFaculty of Engineering
Department of Building and Environmental TechnologyWater Resources Engineering
ISBN 978-91-7895-672-2ISSN 1101-9824
CODEN: LUTVDG/TVVR-1085(2020) 9789178
956722

Modern Artificial Recharge Plants Combining chemical flocculation with aquifer recharge
Kristofer Hägg
DOCTORAL DISSERTATION
by due permission of the Faculty of Engineering, Lund University, Sweden. To be defended at the Faculty of Engineering, V-building, John Ericssons väg 1,
Lund, room V:C on December 18th, 2020 at 09:15 a.m.
Faculty opponent Professor Peter Jarvis

Organization LUND UNIVERSITY
Document name DOCTORAL THESIS, report TVVR 1085
Water Resources Engineering Box 118 SE-221 00 Lund Sweden
Date of issue 2020-11-23
Author(s) Kristofer Hägg
Sponsoring organization Sweden Water Research (SWR) Southern Sweden Water Supply (Sydvatten AB)
Title and subtitle Modern Artificial Recharge Plants – Combining chemical flocculation with aquifer recharge Abstract Water supply security is increasingly becoming a challenge worldwide. Surface waters, which are often used for drinking water production, have experienced an increase in natural organic matter (NOM) and frequency of algae blooms. Water quantity is also an issue due to increasing populations and potable water demand. As a result, unsustainable extraction of surface and groundwater has led to low water levels and low groundwater tables. Coupled with the uncertainties of climate change, these problems have presented a major challenge for water utilities to secure water supply today and in the future. Managed aquifer recharge (MAR) has the potential to mitigate water shortage, protect water supplies from contamination and remove NOM from surface waters. However, with increasing water demand and NOM content in waters, especially in boreal regions, additional treatment might be necessary. A common way of removing NOM and purifying surface waters is through coagulation and flocculation. This technique is often used in combination with gravity-assisted sedimentation or mechanical filtration, i.e. membrane filtration. Due to the deterioration of surface waters, water utilities have utilized different methods of chemical flocculation prior to artificial recharge. This thesis investigates ways of treating surface water through chemical flocculation combined with disc filters (micro sieves), contact filters and ultrafiltration (UF) membranes. This was achieved through laboratory scale jar tests, pilot-scale and full-scale investigations. Contact filtration, direct precipitation on UF membranes, conventional precipitation with UF membranes and conventional precipitation were the most viable options and could treat surface water to about the same extent (about 70-80 % UVA254nm and 50-60 % TOC removal). As a result, depending on the requirements, such as production capacity, economic and microbial barriers, different options are available for water utilities. Water quality changes during basin infiltration were also investigated. Basin management had a large impact on the bacterial community in the infiltrated water and significant NOM and bacterial community change (2-log removal) occurred after only 50 cm of infiltration. UVA254nm and TOC were removed to a similar extent (about 36 % UVA254nm and 37 % TOC removal), and protein-like components were reduced to a larger extent (33-35 %) than humic-like components (21 %). Depending on the NOM content and composition in the source water, water rich in humic acid would require pre-treatment prior to infiltration. An important part of secure water supply is sustainable source water extraction. The results from these studies could be used by water treatment plants (WTPs) in their investigations to improve managed aquifer recharge (MAR).
Key words natural organic matter, coagulation, flocculation, discfilter, ultrafiltration, managed aquifer recharge
Classification system and/or index terms (if any)
Supplementary bibliographical information Language English
ISSN and key title 1101-9824 ISBN 978-91-7895-672-2 (print) 978-91-7895-673-9 (e-version)
Recipient’s notes Number of pages 169 Price
Security classification
I, the undersigned, being the copyright owner of the abstract of the above-mentioned dissertation, hereby grant to all reference sources permission to publish and disseminate the abstract of the above-mentioned dissertation.
Signature Date 2019-11-09

Modern Artificial Recharge Plants Combining chemical flocculation with aquifer recharge
Kristofer Hägg

Cover photo by Clemens Klante
Copyright Kristofer Hägg
Paper 1 © MDPI: Water (Open access)
Paper 2 © MDPI: Water (Open access)
Paper 3 © IWA: Water Supply (Open access)
Paper 4 © by the Authors (Manuscript unpublished)
Paper 5 © by the Authors (Manuscript unpublished)
Faculty of Engineering, Department of Building & Environmental Technology Division of Water Resources Engineering
ISBN print: 978-91-7895-672-2 ISBN e-version: 978-91-7895-673-9 ISSN 1101-9824 Report TVVR 1085 Printed in Sweden by Media-Tryck, Lund University Lund 2020

Table of Contents
Acknowledgement .......................................................................................... i Popular science summary ............................................................................. iii Populärvetenskaplig sammanfattning ............................................................ v Abstract ....................................................................................................... vii Papers ........................................................................................................... ix
Appended Papers ................................................................................. ix Author´s contributions ......................................................................... ix
Other related publications ............................................................................ xi Conference abstracts ............................................................................ xi Reports ................................................................................................. xi Journals ................................................................................................ xi
Abbreviations ............................................................................................. xiii
1 Introduction .................................................................................................. 1 1.1 Background ........................................................................................... 1 1.2 Objectives ............................................................................................. 3
2 Theoretical Background .............................................................................. 5 2.1 NOM in freshwater ............................................................................... 5 2.2 Cyanobacteria and cyanotoxins ............................................................ 5 2.3 NOM removal methods ........................................................................ 6
2.3.1 Coagulation, flocculation and floc separation .......................... 6 2.3.2 Artificial groundwater recharge ................................................ 7
2.4 Microbial barrier analysis (MBA) ........................................................ 8
3 Methods and Materials .............................................................................. 11 3.1 Water treatment plants ........................................................................ 11 3.2 Jar tests (Paper I) ................................................................................ 12 3.3 Pilot scale ............................................................................................ 14
3.3.1 Continuous contact filtration in combination with artificial recharge (Paper II) ............................................................................... 14 3.3.2 Ultrafiltration membranes (Paper III) ..................................... 15
3.4 Field research ...................................................................................... 18

3.4.1 Artificial recharge field study at Vomb WW (Paper IV) ........ 18 3.4.2 Field sampling, column trial and survey of Swedish artificial recharge plants (Paper V) .................................................................... 19
3.5 Water quality measurements .............................................................. 20 3.5.1 Chemical analysis ................................................................... 20 3.5.2 Cyanobacteria and cyanotoxin ................................................ 20 3.5.3 Flow cytometry ....................................................................... 21
3.6 Water quality limits and classification ............................................... 24 3.7 Data and statistical analysis ................................................................ 24 3.8 Coagulants and additives .................................................................... 25
4 Source Waters ............................................................................................. 27 4.1 Lake Bolmen ...................................................................................... 27 4.2 Lake Vomb ......................................................................................... 28
5 Chemical Flocculation and Floc Separation ............................................ 31 5.1 Micro sieving (Paper I) ....................................................................... 31 5.2 Contact filtration (Paper II) ................................................................ 33
5.2.1 NOM and particle removal ..................................................... 33 5.2.2 Cyanobacteria, toxin and nutrient removal ............................. 34
5.3 Ultrafiltration (UF) (Paper III) ........................................................... 35 5.3.1 Direct precipitation on UF membrane .................................... 35 5.3.2 Conventional precipitation with UF membrane ..................... 39 5.3.3 Chemical consumption ........................................................... 40 5.3.4 Operational and investment costs ........................................... 40
5.4 Discussion on pre-treatment options and viability ............................. 42
6 Artificial Groundwater Recharge ............................................................. 45 6.1 Water quality changes during infiltration (Paper IV) ......................... 45
6.1.1 Infiltration basin treatment performance ................................ 47 6.2 Benefits of combining flocculation and MAR (Paper II and V) ......... 51
7 Conclusion ................................................................................................... 53
8 Limitations and Future Work ................................................................... 55 8.1 Limitations of the study ...................................................................... 55 8.2 Future research and development ....................................................... 57
References ............................................................................................................. 59

i
Acknowledgement I would like to take this opportunity to thank everyone who helped and supported me during these four years.
I would like to thank my main supervisor Prof. Kenneth M. Persson for opening the door and introducing me to the world of drinking water supply. I will always appreciate the freedom and encouragement you gave me throughout my PhD studies, and the push I sometimes needed to challenge myself.
I would also like to thank my co-supervisor Catherine Paul for introducing and guiding me through the world of microbes. The introduction you gave me to the researchers in applied microbiology helped me immensely in increasing my understanding of biologically stable drinking water. Lastly, I would like to thank you for helping me plan, organize and present the vast datasets that flow cytometry gave me.
I would like to express my sincere thanks to Britt-Marie Pott and Tobias Persson at Sydvatten AB for all the guidance over the years. I’m happy I got the chance to work with you and take part in the research and development of the drinking water treatment process. I can only hope to gather that much knowledge as you possess.
Thanks to all my co-authors for all your help. I would like to thank my friend and colleague Jing Li for our collaboration over the last few years. Your positivity is rarely matched by others and your ability to find the silver lining helped me focus on the solutions rather than the problems. Thanks to Michael Cimbritz who increased my interest in writing and for guiding me through my first publication. Thanks to Sandy Chan for all your help and lending me your microbial expertise. I would also like to thank Kathleen Murphy and Masoumeh Heibati for all your help and encouragement during our project together. Thanks to Olivia Söderman for all the support during our projects, and thanks to Marie Baehr for flow cytometric support.
Thanks to all my colleagues at TVRL and SWR. Your expertise in neighboring disciplines helped me see how my research fits in the bigger picture. I would also like to take this opportunity to thank Angelica Lidén for helping me in the early stages of my PhD and for showing me the ropes.
Lastly, thanks to my family for all your support. Thanks to my father Richard for improving my writing and to my mother Helena for sending all the positive thoughts over the years. Thanks to my loving wife Nina for all the warm hugs.


iii
Popular science summary By taking the route of least resistance, water unfortunately spreads unevenly throughout the world. By combining different techniques for water treatment together with regional collaborations, the supply of drinking water can be secured for the growing population. This thesis follows southern Sweden's work towards sustainable and safe drinking water.
The water that comes out of our taps is often produced locally. In larger cities, the water usually comes from water treatment plants (WTPs) owned by the municipality, which treats water from nearby surface waters. In smaller municipalities, it is common to collect water in wells. This water is called groundwater and rarely needs advanced treatment. In Sweden, regardless of the origin of the water, the expectation is always that the water is of high quality. The truth is that we are facing major challenges in producing drinking water due to growing populations. In addition, great uncertainties have arisen due to climate change and the future of our water supply. To meet these challenges, many solutions are required, including research, development and collaboration.
Globally, there is plenty of fresh water to supply the world's population with drinking water. However, the water supply is not evenly distributed and is not always accessible. A major problem is also that unsustainable extractions have resulted in low water tables, which are decreasing every year. Another problem for producers of drinking water is natural organic material (NOM) contaminants in surface waters. NOM in surface waters originates from soils and comes with runoff from precipitation. NOM in surface water has increased historically and there is concern that the increase will continue in the future due to climate change.
Among the most common methods of removing NOM from water are through chemical and biological processes. In chemical treatment, a metal salt is used which collects the organic material in larger groups (flocs). These flocs can later be removed through various methods, including filtration. Other organic material that is not captured in the flocs can be removed through biological processes. This is often done with sand filters, where grains of sand are covered with microorganisms. The organic material that is not be captured by the chemical flocculation becomes food for the microorganisms. Complementing each other, these two methods are often used together to create a biologically stable drinking water.
This dissertation follows the challenges facing two WTPs in southern Sweden. Vomb Water Works (WW) is an artificial groundwater recharge plant, which takes groundwater from an aquifer. This reservoir is constantly being recharged with water from Lake Vomb through basins excavated out of the ground. Ringsjö WW treats water from Lake Bolmen, Sweden's twelfth largest lake, through chemical flocculation. The major challenge facing the waterworks is the extraction limitation

iv
of water from Lake Vomb and the high NOM content in the water from Lake Bolmen. In order to meet the increasing water demand, water from Lake Bolmen will be used to recharge the groundwater at Vomb WW. This requires the water to undergo treatment before it is used for artificial groundwater recharge.
In this thesis, several different methods for purifying water from Lake Vomb and Bolmen have been investigated through laboratory experiments, pilot studies and field work. All methods have been based on chemical flocculation with different techniques to separate the flocs formed during the process. Based on the methods' ability to purify and produce drinking water, an evaluation of the different techniques was done. The second part of the work examined the water quality changes of surface water during artificial groundwater recharge. This was done by following the chemical and biological process when NOM and microorganisms were removed from the water.
This dissertation shows how different methods can be used to purify water through chemical flocculation and artificial groundwater recharge. The results will contribute to the ongoing investigation to secure the water supply in southern Sweden.

v
Populärvetenskaplig sammanfattning Vatten tar alltid den lättaste vägen, vilket innebär att det inte fördelar sig jämnt över världen. Genom att kombinera olika tekniker för vattenrening tillsammans med regionala samarbeten, kan försörjning av dricksvatten säkras för den ökande befolkningen. Den här avhandlingen följer södra Sveriges arbete mot ett hållbart och säkert dricksvatten.
Vattnet som kommer ur våra kranar produceras ofta lokalt. I större städer kommer vattnet oftast från kommunens vattenverk, som i sin tur tar vattnet från sjöar eller vattendrag. I mindre kommuner är det vanligt att hämta vatten från brunnar. Det här vattnet kallas för grundvatten och behöver sällan avancerad rening. Grundvattnet hämtas ibland till och med från egna brunnar. Oavsett var vattnet kommer ifrån, är förväntningen alltid att vattnet kommer och att vattnet är av god kvalitet. Sanningen är att vi står inför stora utmaningar på grund av växande befolkningar och ett ökat behov av rent vatten. Dessutom har klimatförändringar fört med sig stora osäkerheter som kan innebära mindre vattentillgångar och med försämrad kvalitet i framtiden. För att möta dessa utmaningar krävs många lösningar. Bland annat forskning och utveckling och inte minst ett brett samarbete.
Globalt så finns det gott om färskvatten för att förse världens befolkning med dricksvatten. Däremot är dessa tillgångar inte jämnt fördelade och inte alltid tillgängliga för uttag. Ett stort problem är också att låga vattennivåer uppmätts på grund av ohållbara uttag. Även i stora vattenmagasin är detta ett problem då vi bygger upp en allt större skuld för varje år. Ett annat problem för producenter av dricksvatten är föroreningar i sjöar och vattendrag i form av naturligt organiskt material (NOM). NOM kommer naturligt till ytvatten genom bland annat avrinning från skog och mark. Det organiska materialet i ytvatten har ökat historiskt sett och det finns en oro att ökningen kommer att fortsätta i framtiden i och med klimatförändringarna.
De vanligaste metoderna för att ta bort organiskt material i vatten är genom kemiska och biologiska processer. I de kemiska processerna används ett metallsalt som samlar det organiska materialet i klumpar (flockar) som sedan tas bort genom till exempel sedimentering eller filtrering. Annat organiskt material som inte fångas upp i flockarna kan tas bort genom biologiska processer. Detta görs ofta med sandfilter som är täckta av mikroorganismer. Det organiska materialet som inte kunde fångas upp av den kemiska fällningen blir till mat för mikroorganismerna. Det här två metoderna kompletterar varandra, varför båda ofta används tillsammans för att skapa ett dricksvatten av hög kvalitet.
Den här avhandlingen följer de utmaningar som två vattenverk i södra Sverige står inför. Ett av verken, Vombverket, är ett så kallat konstgjort grundvattenverk som tar grundvatten från ett vattenmagasin. Det här magasinet fylls ständigt på med vatten
vi
från Vombsjön genom bassänger som är grävda ur marken. Det andra vattenverket, Ringsjöverket, renar vatten från Bolmen, Sveriges tolfte största sjö. Den stora utmaningen som vattenverken står inför kommer sig av en begränsad tillgång på vatten från Vombsjön och det stora innehållet av organiskt material i vattnet från Bolmen. För att kunna möta det ökande behovet av dricksvatten, kommer vatten från sjön Bolmen användas för att stärka grundvattnet vid Vombverket. Det här kräver att vattnet genomgår en behandling innan det används för konstgjord grundvattenbildning.
I det här arbetet har flera olika metoder att rena vatten från Vombsjön och Bolmen undersökts. Det här har gjorts genom laborationsförsök, pilotförsök och fältstudier. Alla metoder har utgått från kemisk fällning med olika tekniker för att separera flockarna som bildats under processen. Genom att undersöka resultatet av reningen och jämföra metodernas förmåga att producera dricksvatten, kunde en utvärdering av de olika tekniker genomföras. Den andra delen av arbetet undersökte förändringarna i sjövattnets kvalitet när vattnet renades genom konstgjord grundvattenbildning. Detta gjordes genom att följa den kemiska och biologiska processen när NOM och mikroorganismer togs bort från vattnet.
Den här avhandlingen visar hur olika metoder kan användas för att rena vatten genom kemisk fällning och konstgjord grundvattenbildning. Resultaten kommer att bidra till det pågående arbetet att säkra produktionen av dricksvatten i södra Sverige.

vii
Abstract Water supply security is increasingly becoming a challenge worldwide. Surface waters, which are often used for drinking water production, have experienced an increase in natural organic matter (NOM) and frequency of algae blooms. Water quantity is also an issue due to increasing populations and potable water demand. As a result, unsustainable extraction of surface and groundwater has led to low water levels and low groundwater tables. Coupled with the uncertainties of climate change, these problems have presented a major challenge for water utilities to secure water supply today and in the future.
Managed aquifer recharge (MAR) has the potential to mitigate water shortage, protect water supplies from contamination and remove NOM from surface waters. However, with increasing water demand and NOM content in waters, especially in boreal regions, additional treatment might be necessary. A common way of removing NOM and purifying surface waters is through coagulation and flocculation. This technique is often used in combination with gravity-assisted sedimentation or mechanical filtration, i.e. membrane filtration. Due to the deterioration of surface waters, water utilities have utilized different methods of chemical flocculation prior to artificial recharge.
This thesis investigates ways of treating surface water through chemical flocculation combined with disc filters (micro sieves), contact filters and ultrafiltration (UF) membranes. This was achieved through laboratory scale jar tests, pilot-scale and full-scale investigations. Contact filtration, direct precipitation on UF membranes, conventional precipitation with UF membranes and conventional precipitation were the most viable options and could treat surface water to about the same extent (about 70-80 % UVA254nm and 50-60 % TOC removal). As a result, depending on the requirements, such as production capacity, economic and microbial barriers, different options are available for water utilities.
Water quality changes during basin infiltration were also investigated. Basin management had a large impact on the bacterial community in the infiltrated water and significant NOM and bacterial community change (2-log removal) occurred after only 50 cm of infiltration. UVA254nm and TOC were removed to a similar extent (about 36 % UVA254nm and 37 % TOC removal), and protein-like components were reduced to a larger extent (33-35 %) than humic-like components (21 %). Depending on the NOM content and composition in the source water, water rich in humic acid would require pre-treatment prior to infiltration.
An important part of secure water supply is sustainable source water extraction. The results from these studies could be used by water treatment plants (WTPs) in their investigations to improve MAR.


ix
Papers
Appended Papers I. Hägg K., Cimbritz M., Persson K. M., 2018. Combining chemical
flocculation and disc filtration with managed aquifer recharge. Water (Switzerland) (10 pages). https://doi.org/10.3390/w10121854.
II. Li J., Hägg K., Persson K. M., 2019. The Impact of Lake Water Quality on Mature Artificial Recharge Ponds’ Performance. Water (Switzerland) (16 pages). https://doi.org/10.3390/w11101991.
III. Hägg K., Persson T., Söderman O., Persson K. M., 2019. Ultrafiltration Membranes in Managed Aquifer Recharge Systems. Water Supply ws2020082. https://doi.org/10.2166/ws.2020.082.
IV. Hägg K., Li J., Heibati M, Murphy K. R., Paul C. J., 2020. Persson K. M., Water quality changes during the first meter of artificial groundwater recharge. Environ. Sci. Water Res. Technol (under review).
V. Hägg K., Chan S, Persson T., Persson K. M., 2020. Source water requirements for artificial groundwater recharge. Short research paper. (manuscript).
Author´s contributions I. The author conducted the experiments and prepared the original manuscript
together with the second author. Reviewing and editing was done by the second and third author.
II. The author contributed with writing the original manuscript (regarding NOM), reviewing and editing. The first author was the main contributor to the writing and statistical analysis. The pilot study was conducted by the staff at Southern Sweden Water Supply (Sydvatten AB). The third author was the main contributor to the project plan.
III. The author prepared the original manuscript and conducted the data analysis together with the second author. The third author conducted the pilot study at Ringsjö WW. All authors contributed with reviewing and editing.
IV. The author was the main contributor to planning the study, writing the original manuscript and data analysis. The first and second author were the main contributors to water sampling and analysis during the field study. The

x
third author contributed with writing parts of the original manuscript and conducted parts of the chemical and statistical analysis. All authors contributed to reviewing and editing. The fifth and last author contributed to planning and supervision of the project.
V. The author was the main contributor to writing the original manuscript, datacollection and groundwater sampling. The second author was the maincontributor to the pilot study conducted at Ringsjö WW. All authorscontributed with reviewing and editing. The third and fourth authorcontributed with planning and supervision of the project.

xi
Other related publications
Conference abstracts Hägg K., Duteil F., Kenneth M. P., 2015. Calcium chloride as a co-coagulant. Specialist Conference on Natural Organic Matter in Drinking Water. 6th IWA specialist conference on NOM. Malmö, Sweden.
Hägg K., Persson T., Söderman O., Persson K. M., Gonzalez-Perez A., 2019. Measures to improve in-line coagulation for NOM-removal with HFUF membranes – results from pilot-plant tests at Ringsjöverket, Sweden. Dead Sea Water Workshop, Nanomaterials at the water-energy nexus. Technion. Ein Gedi, Israel.
Hägg K., Cimbritz M., Kenneth M. P., 2019. Combining chemical flocculation and disc filtration with managed aquifer recharge (MAR). Treatment Technologies for Groundwater-based Water Supply. EWA Specialist Workshop. Copenhagen, Denmark.
Hägg. K., Heibati M., Paul C.J., Murphy K. R., Persson K. M., 2019. Compositional changes in dissolved organic matter (DOM) and bacterial communities during artificial groundwater recharge. 7th IWA specialist conference on NOM, Tokyo, Japan.
Reports Hägg K., Persson K. M., Persson T., Zhao Q., 2018. Artificial recharge plants for drinking water supply – Groundwork for a manual for operation. The Swedish Water & Wastewater Association (SWWA). (58 pages). Rapport number 2018-11.
Hägg K., Lidén A., Persson K. M., 2018. Effective artificial groundwater recharge for sustainable water supply in Kristianstad (EGRUND). A collaboration project with the municipality of Kristianstad and Bromölla, Lund University, Sweden Water Research (SWR), Skåne Blekinge Vattentjänst (SBVT) and Stora Enso.
Journals Hägg K., Randsalu, L., 2017. Början på Sveriges framtida dricksvattenförsörjning. (Popular science summary) Tidskriften Vatten, 2017-3.


xiii
Abbreviations COD Chemical oxygen demand
DOC Dissolved organic carbon
DOM Dissolved organic matter
FI Fluorescence index
HNA High nucleic acid
ICC Intact cell count
LNA Low nucleic acid
MAR Managed aquifer recharge
NF Nanofiltration
NOM Natural organic matter
RSF Rapid sand filtration
SSF Slow sand filtration
SUVA Specific ultraviolet absorbance [UVA254nm/ DOC]
TCC Total cell count
TOC Total organic carbon
UF Ultrafiltration
UVA254nm Absorbance at 254 nm wavelength
VISA436nm Absorbance at 436 nm wavelength
WTP Water treatment plant
WW Water works


1
1 Introduction
Water resource security is a challenge worldwide and water utilities often struggle with either water quality or quantity. Implications of water scarcity seep into many aspects of our lives, some more noticeable than others. Access to clean water and sanitation affects people’s health, livelihoods and education. Globally, there is enough fresh water to support the world’s population. However, water resources are not evenly distributed, leading to water scarcity and conflict. Even in Sweden where vast amounts of accessible fresh water exists, water supply is not accessible everywhere. This causes local water shortages in municipalities with insufficient water supply, especially during summer.
The question of water quality and treatment of deteriorating water resources has been and continues to be an important topic. The historic issues of industrialization and land use causing increases of natural organic matter (NOM) in Swedish surface waters, are now being joined by uncertainties caused by the future impact of climate change. With the predicted increase of precipitation and temperatures, NOM in Swedish surface waters is expected to increase. Because of increased water demand due to population increase, water utilities in Sweden are facing challenges of water quantity and quality.
1.1 Background Southern Sweden Water Supply (Sydvatten AB) produces drinking water for close to 1,000,000 inhabitants in southern Sweden. This is mainly done through two WTPs; Ringsjö and Vomb WW (Figure 1). On average, Ringsjö WW produces annually about 44 million m3 (1400 L/ s) and Vomb WW about 35 million m3 (1100 L/ s). In an effort to meet the demand of the growing population and thereby secure the water supply, Sydvatten AB has set out to nearly double the source water supply for Vomb WW by 2030. To achieve this goal, large investments have been allocated to construct new raw water pipelines that will allow for the increased drinking water production at Vomb WW.

2
Figure 1 Overview of the water distribution system in Southern Sweden and the planned raw water pipeline. The figure shows the three raw water sources, Lake Bolmen, Lake Ringsjö and Lake Vomb, and the to main WTPs, Ringsjö and Vomb WW (adapted from Sydvatten AB (2018)
These investments in research and development will set the stage for a larger regional collaboration in southern Sweden (Figure 2). In an effort to secure the regional drinking water supply, surface and groundwater resources were organized according to their capacity for sustainable extraction (Länsstyrelsen i Skåne Län et al., 2016). The water resources with high capacity could support municipalities that only rely on local water sources.

3
Figure 2 Overview of the possible regional water supply collaboration (adapted from Sydvatten AB (2018)). The figure shows the current water distribution system, the planned distribution system, and the water resources that could supply other municipalities with water.
1.2 Objectives This study follows the challenges facing Vomb WW, an artificial groundwater recharge plant, and Ringsjö WW, a surface WTP, in southern Sweden. From this perspective, one part of the study looks into the pre-treatment of source water, while the second part looks in detail into the chemical and biological dynamics of artificial recharge (Figure 3). The main objectives were to explore different treatment and operational methods and apply these results to a full-scale water treatment process. The details this study investigated were:
• Pre-treating water from Lake Vomb with chemical flocculation combined with disc filtration, or micro sieves (Paper 1).
• Comparing groundwater quality originating from pre-treated raw water from Lake Vomb using contact filtration (chemical flocculation and continuous sand filtration) and untreated lake water (Paper II).

4
• Evaluating the qualitative and economic viability of ultrafiltration (UF)membranes compared to conventional precipitation (Paper III).
• Studying the changes in NOM and bacterial communities during artificialrecharge, and the effect of basin management on water quality (Paper IV).
• Investigating the source water quality requirements for artificialgroundwater recharge (Paper V)
The goal of this thesis was to answer the following questions:
1. What are the viable treatment options for water from Lake Bolmen?2. How does the water quality change during artificial recharge?3. Can the management of the infiltration basins improve the capacity of
Vomb WW, and does this affect the groundwater quality?4. What is the required source water quality for artificial recharge to achieve
adequate drinking water quality?
Figure 3 Overview of the different aspects and treatment techniques explored in the thesis (adapted from Paper III).

5
2 Theoretical Background
2.1 NOM in freshwater NOM in freshwater, surface or groundwater, is one of the main contaminants, alongside iron (Weyhenmeyer et al., 2014), that contributes to its color and odour. Besides aesthetic issues, NOM can serve as precursors for potentially harmful by-products from chlorination (Morris et al., 1992; Singer, 1999), cause problems with regrowth of microorganisms in distribution systems (Camper, 2004) and reduce the effectiveness of UV-disinfection (Farrell et al., 2018). These are a few reasons why it is important for water utilities to remove NOM to produce high quality drinking water.
The observed increase of NOM in countries in Europe, United Kingdom and North America is a concern due to the issues of treatability of surface waters (Eikebrokk et al., 2004; Evans et al., 2005). Increasing NOM content in surfaces waters has been shown to be affected by temperature and precipitation (Freeman et al., 2001; Fröberg et al., 2006; Köhler et al., 2009; Lepistö et al., 2008; Rasilo et al., 2015; Tranvik and Jansson, 2002; Von Einem, 2007; Worrall and Burt, 2007) but is also dependent on other factors, such as geological and vegetation properties of the catchment area surrounding surface waters (Laudon et al., 2011).
The predicted increases of precipitation and temperatures in Sweden due to climate change (Eklund et al., 2015), are an issue facing water utilities: short term increase of NOM occurs in surface waters after precipitation events and also long-term NOM increases. Together with increased demand for potable water, increases in NOM content, force water utilities to plan ahead to secure future water production.
2.2 Cyanobacteria and cyanotoxins Cyanobacteria, or blue-green algae, in surface waters is another issue for water utilities. Cyanobacteria can cause taste and odour issues (Izaguirre et al., 1982; Qi et al., 2012) and clogging of filters (Li et al., 2017) but more importantly some can produce harmful toxins (Chorus and Bartram, 1999). Cyanobacteria exhibit rapid growth periods in surface water, when the environmental conditions are favourable.
6
These cyanobacterial blooms often occur during the summer months but may also occur in late autumn and winter (Li, 2020). To avoid harmful algal blooms, it is important to reduce nutrient (phosphorus and nitrogen) load in surface waters (Paerl and Huisman, 2008; Xu et al., 2015). The limiting nutrient is often considered to be phosphorus (O’neil et al., 2012), and the recommended maximum total phosphorus (TP) concentration is 20 µg/ L to ensure low probability of blooms (Carvalho et al., 2013; Li et al., 2017). The total nitrogen (TN) concentration is also an important factor, although certain species of cyanobacteria are able to fix atmospheric nitrogen (Issa et al., 2014). There are also studies showing that low TN:TP ratios may trigger algal blooms (Li et al., 2018; Orihel et al., 2012; Smith, 1983). The main issue that comes with cyanobacterial blooms is the production of cyanotoxins. The cyanotoxins are a diverse group and can remain dissolved in water for several weeks before they degrade. Due to severe health issues they cause (e.g. diarrhoea and liver damage) (Chorus and Bartram, 1999), it is important for water utilities to ensure that toxin levels in drinking water supply are below the guideline value. (1 microcystin-LR µg/ L) set by the World Health Organization (WHO).
2.3 NOM removal methods
2.3.1 Coagulation, flocculation and floc separation A common way of treating surface water is coagulation and flocculation (Crittenden et al., 2012). Fe3+ and Al3+ complexes are often used because of the relatively low cost and their efficiency at neutralizing surface charges of NOM (Bratby, 2016). Iron-based coagulants tend to have higher NOM removal rates but narrower pH ranges and lower optimum pH than aluminium-based coagulants (Edzwald and Tobiason, 1999; Gillberg et al., 2003; Jarvis, 2004). The efficiency of NOM removal depends largely on the composition of the organic matter, flocculation pH and the sufficient dosage of coagulant (Matilainen et al., 2010; Ødegaard et al., 2010; Sillanpää and Matilainen, 2014). NOM with higher molecular weight (HMW) are removed mostly by charge neutralization and low molecular weight (LMW) (non-humic substances) NOM are removed by adsorption to metal hydroxide surfaces, which requires higher coagulant dosages (Sillanpää et al., 2018). HMW NOM are more readily removed than LMW NOM (Collins et al., 1986; Sillanpää and Matilainen, 2014). Hydrophobic acids (VHA and SHA) and charged hydrophilic matter (CHA) are readily removed through coagulation while neutral hydrophilic matter (NEU) is inadequately removed (Eikebrokk et al., 2018; Guo and Ma, 2011).
The specific UV-absorbance (SUVA) correlates to hydrophobic NOM (Eikebrokk et al., 2018) and this measurement is often a good predictor of treatability through

7
coagulation and flocculation (Edzwald and Tobiason, 1999). This means that surface waters with higher SUVA-values (SUVA ≥ 4) tend to be easier to treat through coagulation than surface waters with lower SUVA-values (SUVA ≤ 2). In general, expected NOM removal, measured as dissolved organic carbon (DOC), using conventional treatment is around 40 to 80 % (Sillanpää et al., 2018). Similar removal rates from full-scale WTPs in Nordic countries were reported in Eikebrokk et al. (2018). Coagulation and flocculation have also been shown to be effective to remove phosphorus and microorganism (Eikebrokk et al., 2018; EPA, 1970) (EPA, 1970).
Once flocs have formed, different methods of separation are used. Sedimentation is one of the most common way of achieving separation (Crittenden et al., 2012). Other methods include microfiltration and ultrafiltration membranes where the coagulant is added in the feed water (raw water) prior to filtration (Keucken et al., 2017; Lidén and Persson, 2016; Meyn et al., 2008). One advantage with this technique, compared to floc separation techniques relying on sedimentation, is the potential savings in coagulant (Lidén and Persson, 2016). Other separation techniques have been explored in wastewater treatment through the use of micro sieves with the addition of polymer (Väänänen, 2017). Flocs tend to get weaker with increased size (Jarvis et al., 2005); however, the use of polymer allows for larger and stronger flocs (Bratby, 2016).
2.3.2 Artificial groundwater recharge A common way of treating surface waters and managing water resources is artificial groundwater recharge (Dillon et al., 2009; Lu et al., 2011; Sprenger et al., 2017; Stefan and Ansems, 2018; Tielemans, 2007). Water from lakes or rivers are used to recharge the groundwater through infiltration basins. Often, groundwater recharge plants are located in glaciofluvial deposits or eskers (Hansson, 2000; Pott et al., 2009) where soil layers allow for high storage and recharge potential. During artificial recharge and sand filtration, natural biological processes purify the water by removing NOM and microbes, including pathogens (Crittenden et al., 2012; Harrington et al., 2003; Kolehmainen et al., 2007; Sidhu et al., 2015; Yahya et al., 1993). The main mechanisms for NOM removal during sand filtration are adsorption and biodegradation (Collins et al., 1992; Huisman and Wood, 1974), where LMW NOM (carbohydrates, aldehydes and simple organic acids) are more biodegradable than humic material (Thurman, 1985). A majority of the removal occurs in the top unsaturated layers of the soil in the biologically active layer (Kleja et al., 2009; Lindroos et al., 2002; WHO, 2016a). The development of this biofilm on the top surface of infiltration basins reduces infiltration rates and thereby introduces oxygen under the basins (Sundlöf and Kronqvist, 1992). The importance of biofilm development for removal of organic matter and microorganism has been
8
shown in slow sand filters (Chan et al., 2018), which also applies to artificial recharge.
In Sweden, one quarter of all the drinking water produced incorporates artificial groundwater recharge (SWWA, 2016) and the most common way of achieving this is through basin infiltration. According to several studies from Finland and Sweden, artificial recharge removes over 50 % of the NOM (Hägg et al., 2018; Jokela et al., 2017; Kolehmainen et al., 2007; Tanttu and Jokela, 2018). The removal rates depend on many factors, such as retention times, biofilm development and temperature. Because of the cold climate in Nordic countries, the removal rates are seasonal, and have been recorded to be as low as 40 % during winter (Kleja et al., 2009). Another import aspect of infiltration is NOM composition. Much like chemical flocculation, artificial recharge removes different fractions of NOM to different extents, where there is no one process to treat NOM (Sillanpää, 2015). When combined, artificial groundwater recharge compliments flocculation and improves NOM removal rates (Eikebrokk et al., 2018). This is the reason why surface WTPs often utilizes slow sand filters to create a biologically stable water (Crittenden et al., 2012; Proctor and Hammes, 2015). However, artificial recharge is ineffective towards removing neutral hydrophilic matter (NEU) (Lindroos et al., 2002).
Besides treating surface waters, artificial groundwater recharge has many benefits such as limiting losses through evaporation, protecting against drought, and reducing risks of contamination (Asano, 2016). Examples can be found around the world where aquifers are recharged to secure water supply by well infiltration (Water corporation, 2017).
2.4 Microbial barrier analysis (MBA) The World Health Organisation´s (WHO) guidelines for drinking water recommends a risk-based approach to drinking water production (WHO, 2016b). One tool is quantitative microbial risk assessment (QMRA) (Schijven et al., 2011). QMRA is a useful tool for water utilities to identify risks and safeguard against microbial outbreaks. A similar tool derived from QMRA is microbial barrier analysis (MBA-guideline) which is used in Finland, Norway and Sweden (Ødegaard et al., 2014). This tool is designed to help utilities determine if their treatment processes are sufficient to minimize risks for microbial outbreaks and be easy to use. Several other reports from the Swedish Water Works Association (SWWA) have been published (Bondelind et al., 2013; Pott and Ødegaard, 2015) building upon Ødegaard et al. (2014).
In this thesis, a simplified MBA relevant for the water utility has been used to identify different treatment alternatives combined microbial barriers according to

9
Pott (2015). The method discards considerations regarding the source water, i.e. monitoring and safeguarding surface waters. Table 1 shows the general removal of different treatment steps as log-reductions for different microbial pathogens, where 1 log remove 90 %, 2 log remove 99 % and 3 log remove 99.9 % and so on. Table 1 Log-reduction for treatment methods for microbial pathogens. The barriers do not include the potential deductions from insufficient monitoring and security, e.g. a facility lacking online measurements would receive a 40 % deductions from the total accumulated microbial barrier (Pott, 2015).
Treatment process Maximum log-reduction Bacteria Viruses Parasites
Rapid sand filtration (RSF) 0.5 0.25 0.5 Slow sand filtration (SSF) 2.0 2.0 2.0 Artificial rechargea 2.0 1.5 2.0 Contact filtrationb 2.5 2.0 2.5 Chemical flocculation, sedimentation and RSFb
2.75 2.25 2.75
Microfiltration (MF) 2.0 1.0 2.0 Ultrafiltration (UF) 2.5 2.0 2.5 Nanofiltration (NF) 3.0 3.0 3.0 Direct precipitation on MF membraneb
3.0 2.5 3.0
Direct precipitation on UF membraneb
3.0 3.0 3.0
Recommended accumulated barrierc
6.0 6.0 4.0
a15-30 days residence time of the water in the saturated and unsaturated zones (Ødegaard et al., 2014b). bIf color reduction > 70 % and turbidity < 0.1 of permeate. cWith over 10,000 consumers.

11
3 Methods and Materials
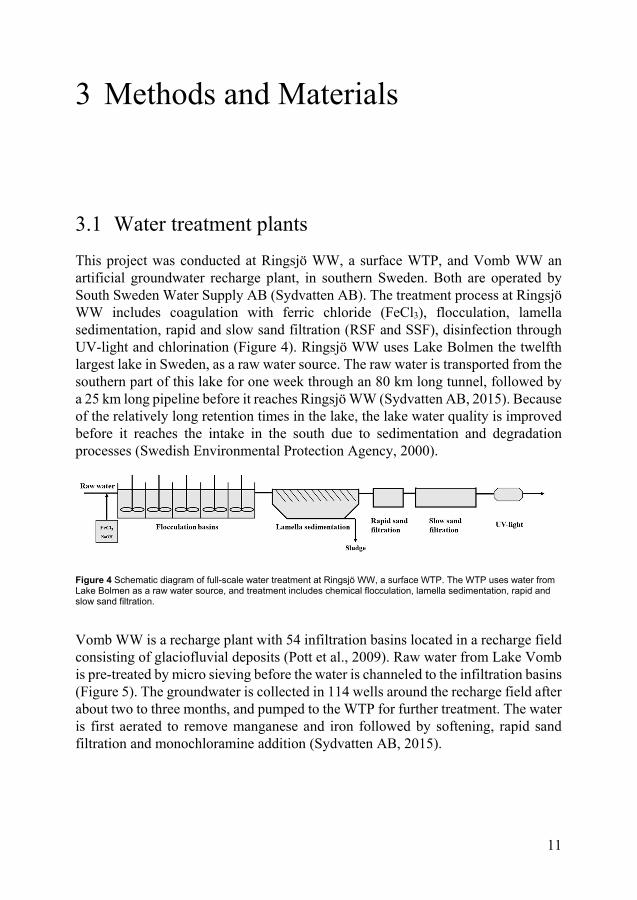
3.1 Water treatment plants This project was conducted at Ringsjö WW, a surface WTP, and Vomb WW an artificial groundwater recharge plant, in southern Sweden. Both are operated by South Sweden Water Supply AB (Sydvatten AB). The treatment process at Ringsjö WW includes coagulation with ferric chloride (FeCl3), flocculation, lamella sedimentation, rapid and slow sand filtration (RSF and SSF), disinfection through UV-light and chlorination (Figure 4). Ringsjö WW uses Lake Bolmen the twelfth largest lake in Sweden, as a raw water source. The raw water is transported from the southern part of this lake for one week through an 80 km long tunnel, followed by a 25 km long pipeline before it reaches Ringsjö WW (Sydvatten AB, 2015). Because of the relatively long retention times in the lake, the lake water quality is improved before it reaches the intake in the south due to sedimentation and degradation processes (Swedish Environmental Protection Agency, 2000).
Figure 4 Schematic diagram of full-scale water treatment at Ringsjö WW, a surface WTP. The WTP uses water from Lake Bolmen as a raw water source, and treatment includes chemical flocculation, lamella sedimentation, rapid and slow sand filtration.
Vomb WW is a recharge plant with 54 infiltration basins located in a recharge field consisting of glaciofluvial deposits (Pott et al., 2009). Raw water from Lake Vomb is pre-treated by micro sieving before the water is channeled to the infiltration basins (Figure 5). The groundwater is collected in 114 wells around the recharge field after about two to three months, and pumped to the WTP for further treatment. The water is first aerated to remove manganese and iron followed by softening, rapid sand filtration and monochloramine addition (Sydvatten AB, 2015).
12
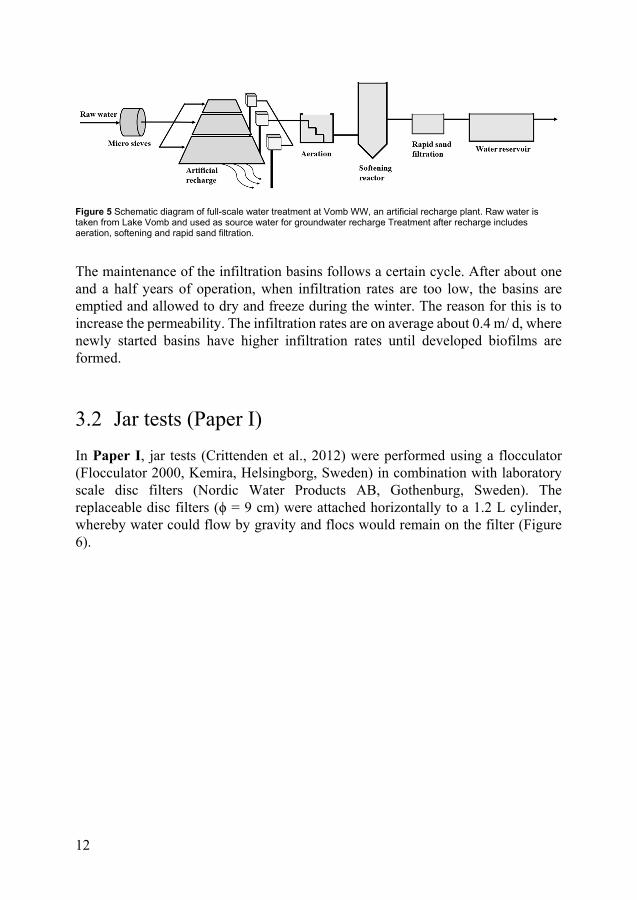
Figure 5 Schematic diagram of full-scale water treatment at Vomb WW, an artificial recharge plant. Raw water is taken from Lake Vomb and used as source water for groundwater recharge Treatment after recharge includes aeration, softening and rapid sand filtration.
The maintenance of the infiltration basins follows a certain cycle. After about one and a half years of operation, when infiltration rates are too low, the basins are emptied and allowed to dry and freeze during the winter. The reason for this is to increase the permeability. The infiltration rates are on average about 0.4 m/ d, where newly started basins have higher infiltration rates until developed biofilms are formed.
3.2 Jar tests (Paper I) In Paper I, jar tests (Crittenden et al., 2012) were performed using a flocculator (Flocculator 2000, Kemira, Helsingborg, Sweden) in combination with laboratory scale disc filters (Nordic Water Products AB, Gothenburg, Sweden). The replaceable disc filters (ϕ = 9 cm) were attached horizontally to a 1.2 L cylinder, whereby water could flow by gravity and flocs would remain on the filter (Figure 6).

13
Figure 6 Photo of the Kemira Flocculator 2000 (Helsingborg, Sweden) and disc filters used during this study (Paper I).
In preparation for the jar tests, coagulation pH was established by adding the targeted coagulant dosage to 1 liter of raw water and measuring the resulting pH. Depending on the desired coagulation pH, an acid or base solution was added until the targeted pH was reached. The prepared volume of H+/OH- needed was later added before the coagulant during each jar test. The test procedure was as follows:
1. 1 to 6 beakers were filled with 1 L raw water with the addition of the pre-determined amount of NaOH or HCl in each beaker.
2. The flocculation program started with 30 s of rapid mixing (400 rpm) and with 10 s remaining, the main coagulant (FeCl´3) was added.
3. After rapid mixing, the flocculation program proceeded with 20 min slow mixing (75 rpm). When polymer was used it was added at this stage.
4. Once the flocculation program had finished, either the program continued with a 30 min sedimentation step (0 rpm) or the raw water was transferred to the disc filter. The permeate was collected and measured after 60 s of filtration.
Once the flocculation program was finished, the water sample was carefully transferred into the disc filter to avoid floc breakage. The permeate was collected in a 1 L beaker, or if the program continued with a sedimentation step, samples were taken using a 50 ml plastic syringe approximately 3 cm below the surface.

14
3.3 Pilot scale
3.3.1 Continuous contact filtration in combination with artificial recharge (Paper II)
For 6 months (April to October 2014), a split-basin pilot study was conducted at Vomb WW (Paper II). One half of the basin received water from Lake Vomb pre-treated by micro sieving (500 µm) (control treatment) and one after coagulation, flocculation and contact filtration (contact filter treatment). Both sides were maintained the same way and received the same amount of raw water throughout the study period. Groundwater samples were taken every other week from 4 observation wells starting from June 10th to October 20th (Figure 7). Water samples were collected from the incoming raw water, pre-treated water from control treatment and after contact filter treatment. Samples from both basin halves were also collected starting in August when the basins had enough standing water. The water quality parameters that were measured were turbidity (FAU), UVA254nm, VISA436nm, chemical oxygen demand (COD), total organic carbon (TOC), total phosphorus (TP), pH, nitrate, orthophosphate, microcystin and presence of cyanobacteria.
Figure 7 Schematic diagram of the split-basin pilot study. Raw water from Lake Vomb is led either to the basin directly or treated through contact filtration before it is led to the basin.Water samples were collected in the four wells (Paper II).

15
3.3.2 Ultrafiltration membranes (Paper III) In Paper III, two possible ways of implementing ultrafiltration (UF) membranes in MAR were studied through a two-part membrane pilot trial conducted from April 2017 to August 2018 at Ringsjö WW. The results from the membrane pilot were compared with existing conventional precipitation and rapid sand filtration (RSF) at the WTP. The first part of the membrane pilot was direct precipitation before UF and the second part was conventional precipitation combined with UF (replacing the rapid sand filters). The three alternatives were compared based on NOM removal, scalability, cost, operational flexibility and security. The NOM-removal comparison was conducted by measuring UVA254nm through online sensors in the feed, filtrated and permeated water. The capacity of the membrane configurations was compared with conventional precipitation using the net-flux and the temperature compensated permeability. A schematic diagram for the three treatment methods can be seen in Figure 8.
Figure 8 Schematic diagram of the three different treatment methods investigated (Paper III).
The UF membrane used in this study was an X-flow XIGA64 hollow fiber membrane from Pentair (Pentair, 2018). The membrane area was 64 m2 with a molecular weight cut off (MWCO) of 150 kDa. The membrane was vertically mounted in a container together with strainer (AZUD Helix Automatic FT201 AA, Murcia Spain 300 µm), feed tank, permeate tank, feed pump, backwash pump, panel PC and compressor.

16
The membrane was cleaned in three different ways using permeate collected from the permeate tank. The hydraulic clean (backwash) and the two chemical cleaning procedures used during the study can be seen in Table 2. Table 2 Cleaning proceedings during the pilot (adapted from Paper III).
Cleaning proceeding
Chemical Interval Duration Procedure
Backwash (BW) None 32 mina 34-50 minb
30 sec
Chemical enhanced backwash (CEB)
CEB A: NaOH and NaClO CEB B: H2SO4
12-24 h 20 min 1. Soak for 10 min (CEB A) 2. Soak for 10 min (CEB B) 3. Rense
Cleaning in place (CIP)
CIP 1: Citric acid CIP 2 & 3: Oxalic acid and Ascorbic acid
3 occasions 24 h 1. Overnight circulation 2. Flushed
aSetting used during direct precipitation. bSetting used during conventional precipitation with UF. cUsed during the first CIP dMixture used the second and third CIP
The backwash was conducted using only permeate every 32 minutes, while the chemical enhanced backwash (CEB) was conducted once or twice a day using sodium hydroxide, sodium hypochlorite and sulphuric acid. During CEB, the membrane soaked for 10 minutes in a mixture of sodium hydroxide and sodium hypochlorite (200 ppm) (CEB A) at pH 12 followed by soaking in sulphuric acid (CEB B) for 10 minutes (pH 2). The cleaning in place (CIP) was conducted three times during the pilot study using two different CIP chemicals. The first CIP was performed using only citric acid (CIP 1) but was abandoned when permeability remained the same after the cleaning procedure. CIP 2 and 3 were successfully conducted using a mixture of oxalic acid and ascorbic acid (CIP 2). All three CIP were done by circulating the cleaning solutions through the membrane overnight (24 h).
The first part of the membrane pilot was direct precipitation before UF, where two different coagulation configurations were tested; (1) inline and (2) feed tank coagulation (Figure 9). In part one (inline coagulation), FeCl3 was added after the feed tank and before the feed pump. To ensure sufficient time for floc formation, a tube was used to create a 90 seconds contact time. In part two (feed tank coagulation), FeCl3 was added to the feed tank equipped with a stirrer, allowing for a 14 minutes flocculation time. The same NOM removal as conventional precipitation was achieved when the flux and coagulant dosage was 50-60 L/ (m2⋅h) and 5-6.5 ppm (mg Fe3+/ kg water). This corresponded to a recovery rate of about 88 % for both configurations.

17
Figure 9 Schematic diagram of the direct precipitation pilot plant with two configurations; (1) inline and (2) feed tank coagulant dosage. Water from Lake Bolmen was used as feed water (Paper III).
In the second part of the membrane study, treated water from full-scale conventional precipitation after lamella sedimentation was used as feed water in the pilot (Figure 10). The flux for this configuration was 60-90 L/(m2⋅h) with a recovery rate of about 95 %.
Figure 10 Schematic diagram of conventional precipitation combined with UF membrane pilot. Treated water after lamella sedimentation from the full-scale treatment was used as feed water for the membrane pilot (Paper III).
The performance of the membranes was compared with the results from full-scale conventional precipitation at Ringsjö WW using the UVA254nm of the treated water. Because coagulant and hydroxide dosages vary daily and seasonally based on the water quality from Lake Bolmen, yearly averages were used to determine consumption and costs. Once the membrane pilot achieved the same water quality as conventional precipitation, maintenance cost, chemical consumption,

18
performance and stability were estimated based on the production of 1 m3 of water. The investment cost was calculated for a membrane facility with a production capacity of 2 m3/ s and estimated based on experiences from other WTPs and information from retailers. The investment cost per membrane surface area ($/ m2) was also estimated to decrease with increasing production volume according to Huehmer (2016) and experiences from Swedish water utilities. The energy consumption was based on full-scale conventional precipitation at Ringsö WW (i.e. flocculation and sedimentation) and experiences from a full-scale membrane facility in Lackarebäck, Sweden (i.e. the UF stage). The energy cost was estimated at $ 0.11/kWh based on the Swedish market. An exchange rate of 1 $ (US) to 9 SEK was used for all costs.
3.4 Field research
3.4.1 Artificial recharge field study at Vomb WW (Paper IV) A field study at Vomb WW was conducted from July 4th to November 21st, 2018 (Paper IV). In this study, water quality changes during infiltration were studied using an infiltration basin split into two halves, Basin A and B (Figure 11). The effect of drying and freezing one side of the basin (Basin A) was studied by emptying this side and allowing it to dry and freeze during the winter. Basin B received water during the winter, preventing the basin from drying. Both halves received filtered water (40 µm micro sieves) from Lake Vomb, and were skimmed and taken into operation at the same time.
Figure 11 Overview of the split-basin study. Water samples for UVA254nm and TOC measurements were taken from all the soil water samplers, inlet and Basin A and B during the whole study period. CDOM samples (fluorescence spectroscopy measurements) were taken from the inlet, B3-50, B3-100, B4-50 and B4-100 for a three week period in November. Water samples for flow cytometry measurements were taken from the inlet, samplers A3-50, A3-100, A4-50, A4-100, B3-50, B3-100, B4-50 and B4-100 (Paper IV).

19
Water samples were collected once a week through 16 tension free solution collectors (Prenart soil solution collectors, Prenart Equipment APS, Denmark; (Buckingham et al., 2008)) installed under the surface of the basin. Each sampler was connected by a teflon tube to a 2 L collection bottle, and samples were collected by applying vacuum to the bottle (-0.6 bar). As seen in Figure 11, 8 samplers were installed in each basin at two different depths, 50 and 100 cm. Each sampler pair was installed with 5 m between each pair, starting 5 m away from the inlets. The day before sampling, a vacuum was applied to each collection bottle to ensure adequate volume. Water samples for NOM analysis (UVA254nm, TOC and fluorescence spectroscopy) were collected the following day. Fluorescence spectroscopy samples, or colored dissolved organic matter (CDOM) samples, were collected in ashed amber glass bottles. Vacuum was applied again to half of the samplers, A3-50, A3-100, A4-50, A4-100, B3-50, B3-100, B4-50 and B4-100, and 3 mL water samples were collected for flow cytometric analysis, in sterile falcon tubes for 30 min. All samples were cooled on ice and stored overnight at 4 oC.
3.4.2 Field sampling, column trial and survey of Swedish artificial recharge plants (Paper V)
Samples from 35 wells evenly distributed across the recharge field at Vomb WW were taken during two separate occasions. Each sample was collected, tested for pH and temperature and stored cool in three separate bottles. One bottle was used for samples analyzed at the WTP (UV254nm-VIS436nm absorbance) and the two other bottles were sent to an external laboratory (Eurofins) for TOC and COD measurements.
A column test was performed at Ringsjö WW from June 26th, 2019 to May 15th, 2020. The column was filled with soil material from the recharge field in Vomb and water from Lake Bolmen was used as feed water. The column was 3 meters tall and 0.5 meters in diameter. The flow into the column was regulated to give a 14 days retention time. Samples from the feed water and permeate were collected once a month, and measured for TOC, COD and UV254nm-absorbance.
A survey was conducted over 16 artificial recharge plants in Sweden (Hägg et al., 2018). The survey consisted of WTPs utilizing, among other techniques, pre-treatment through chemical flocculation, basin infiltration and induced infiltration. The interviews included technical questions about their treatment methods, raw water quality, drinking water quality, basin management and experiences of past trials and studies. In Paper V, experiences from 11 recharge plants utilizing basin infiltration from that study were used.

20
The results from the field sampling, column trial and survey were applied to the case for Southern Sweden Water Supply (Sydvatten AB) to predict the potential need for pre-treatment through chemical flocculation.
3.5 Water quality measurements
3.5.1 Chemical analysis For Papers I, II, IV and V, a spectrophotometer (DR 5000, Hach Lange) was used to measure the UV-VIS absorbance at λUV = 254 nm and λVIS = 436 nm with a 5-cm cuvette, and in Paper III, online UVA254nm sensors were used. In Paper I, IV and V, a TOC-analyzer (TOC-L, Shimadzu) was used, and in Paper II and V, TOC samples were sent to Eurofins, Sweden. The calculated specific UV-absorbance in Paper IV, was done with the UVA254nm:TOC ratio (SUVATOC). In Paper II, turbidity and chemical oxygen demand (COD) were measured using a Hach Ratio XR Turbidimeter (Hach Lange GmbH, Germany) and colorimetric titration with potassium permanganate, respectively. Hach Ratio XR Turbidimeter with test kits (Hach Lange) were used to measure orthophosphate and total phosphorus.
In Paper IV, the absorbance and fluorescence of dissolved organic matter (DOM) were measured in a 1 cm quartz cuvette at 20 oC using an Aqualog spectrofluorometer (Horiba Scientific). Each water sample was filtered before being measured through a pre-flushed 0.45 µm cellulose acetate filter. Excitation and emission matrices (EEMs) were obtained with 2 s integration time. Excitation wavelengths ranged from 240 to 650 nm at 3 nm increments, and emission wavelengths ranged from 249 to 700 nm at 2.33 nm increments. Fluorescence EEMs were decomposed to the underlying component and the relative intensity of each component by using parallel factor analysis (PARAFAC) (Bro, 1997). PARAFAC modelling was implemented using the N-way and drEEM toolboxes for MATLAB (Andersson and Bro, 2000; Murphy et al., 2013).The Fluorescence index (FI) for water samples (Paper IV) were also calculated using 470 nm/ 520 nm fluorescence emission intensity ratio at 370 nm excitation (Cory and McKnight, 2005)
3.5.2 Cyanobacteria and cyanotoxin The prevalence of cyanobacteria was quantified in Paper II by fixing algae samples with Lugol’s solution. Samples were stored overnight in an Utermöhl chamber (settling chamber) prior to analysis. The cell count was conducted manually with a microscope (400x) by estimating the biomass area in the chamber in increments of 10 % (1 = 10 %, 2 = 20 %, and so on). The taxonomic groups were identified by the

21
different morphological characteristics; (1) Woronichinia, Snowella, Microcystis, Radiocystis, (2) Chroococcus, (3) Beggiatoa, (4) Achroonema, Limnothrix, Planktolyngbya and (5) Anabaena, Nostoc. Antibody microcystin tests were also performed in Paper II according to Beacon Analytical Systems Inc. (2020). The toxin profile was validated through ultra-performance liquid chromatography - mass spectrometer (UPLC-MS/MS) (Pekar et al., 2016).
3.5.3 Flow cytometry During the field study (Paper IV), the bacterial concentration in water samples were measured weekly for total cell count (TCC) and intact cell count (ICC) using the dyes SYBR Green I (SG) and propidium iodine (PI) (Sigma-Aldrich, Germany) (Chan et al., 2018; Gillespie et al., 2014; Prest et al., 2013). A 5 µL 1:100 mixture of SYBR Green I (10,000 x) and dimethyl sulfoxide (DMSO), resulting in a 100 x SG concentration, was used to stain 495 µL water samples for the TCC measurements. For the ICC measurements, a 6 µL 1:6 (50 to 250 µL) mixture of PI and 100 x SG was used to stain 496 µL of water sample. The final dye concentrations were 3 µM PI and 1.x SG. All samples were vortexed and incubated for 15 min at 37 oC after the addition of the dyes. All samples were vortexed again after incubation and analysed using a BD ACCURI C6 plus flow cytometer (BD Bioscience) equipped with a 50 mW laser (488 nm). Each sampling rack could hold a set of 4-5 water samples including slots for Millipore water between each triplicate. From each water sample, 50 µL were analyzed.
The flow cytometric data were processed using FlowJo software from Tree Star Inc, USA. The gating strategy in Paper IV was based on Chan (2018) and Prest et al. (2013) and applied to all samples. The TCC, ICC, fluorescent fingerprint, and percentage of low (LNA) and high nucleic acid (HNA) bacteria were calculated based on this defined gate. Figure 12 shows (a) the defined gate and (b) the LNA and HNA definition.

22
Figure 12 Flow cytometric data from a raw water sample stained with SYBR Green I. Figure shows (a) scatter plot of green fluorescence and red fluorescence with the applied gate, and (b) histogram of green fluorescence of the gated events (or cells) with the applied definition of LNA and HNA.
The changes in the bacterial community were also investigated by applying additional gates on the raw water community. These gates were later applied to all samples. This identified specific changes in the populations in the raw water. Figure 13 shows the applied gates Low LNA (L-LNA), High LNA (H-LNA) and New HNA (N-HNA).

23
Figure 13 The additional gates Low LNA (L-LNA), High LNA (H-LNA) and New HNA (N-HNA) were defined and applied to the raw water (top left), and later applied to A-50 (center left), A-100 (bottom left), B-50 (center right) and B-100 (bottom right). Each line represents one of the triplicates from each water sample. (Appendix from Paper IV).

24
3.6 Water quality limits and classification The regulator limits and recommendations for potable water vary in different countries. Table 3 shows the regulatory limits regarding chemicals and NOM, relevant for this thesis, for drinking water in Sweden. The only regulatory limit regarding microbial communities in drinking water are pathogens. Table 3 Swedish regulatory limits for drinking water (Swedish Food Agency, 2018a, 2001).
Parameter Color [mg Pt/ L]
Turbidity [FNU]
CODMn [mg/ L]
TOCa
[mg/ L]
Acryl-amideb
[µg/ L]
Cyano-toxinsc [µg/ L]
Esherichia colid [in 100 mL]
Entero-coccus [in 100 mL]
Regulatory limit
15 0.5 4 4 0.10 1 Detected Detected
aCorrelated to the limit of 4 mg CODMn/ L over a two-year period. bBased on calculation of a 0.5 mg polyacrylamide/ L. cApplies to all toxins except saxitoxins (3 µg/ L). dColiform bacteria limit is 10 counts in 100 mL
In Sweden, artificially recharged surface water is considered to be unaffected groundwater after 14 days of infiltration including passage through at least 1 meter unsaturated zone and 40 meter between extraction point and recharge area (Engblom and Lundh, 2006; Swedish Food Agency, 2018b; SWWA, 2011).
3.7 Data and statistical analysis The data collected during this study, before and after each treatment step, were compared to evaluate each tested method. Because certain NOM content measurements were conducted at different sites, uncertainties when comparing measurements from different sources also apply. However, the evaluation of each treatment method was always done using the measurements from the same analytical source.
Data curation, visualization and statistical calculations were conducted in Matlab (The MathWorks, Inc., USA), R (R Development Core Team, 2013), FlowJo (Tree Star Inc., USA) and Microsoft Excel. Tests for the significant differences in microcystin-LR were conducted using the bootstrapping resampling method (Paper II), and significant differences in infiltration basin performance were conducted by Student t-tests (Paper IV). For correlation investigations, Pearson’s correlation coefficient calculations were used. In Paper IV, non-metric-multidimensional scaling (NMDS) with histogram image comparison (Koch et al., 2013) was used for visualization of differences between the performance of the different halves of the basin. NMDS is an ordination technique based on distance or dissimilarity (Kruskal, 1964). As seen in Chan et al. (2018), the data was taken from the gated populations of flow cytometric scatter plots. The R packages flowCORE and modified

25
flowCHIC were used through a script developed by Niklas Gador (Kristianstad University, Sweden). The script randomly selected the same number of events, equivalent to the sample with the lowest event count, from each sample. This was done due to the vast difference in events between samples from the raw water and infiltrated water.
3.8 Coagulants and additives In the flocculation studies (Paper 1, II and III), all primary coagulants used were of food grade quality. PIX-311, a 40 % by weight FeCl3 solution, and PAX-15, a polyaluminium chloride (PACl) solution, was used as primary coagulants. Both were produced by Kemira (Helsingborg, Sweden) and used without any preparation prior to the flocculation studies. In Paper II, a 195µL PACl solution/ L dosage was used. The 0.5 % anionic synthetic polymer (co-polymer of acrylamide and sodium acrylate), MLT 30 (BASF, Ludwigshafen, Germany), was diluted in distilled water prior to the jar tests resulting in a 0.05 % polymer solution. During the flocculation studies when water from Lake Vomb was used, a H2SO4 or HCl solution was used to lower the pH due to the high alkalinity of the lake water. When water from Lake Bolmen was used, a NaOH or H2SO4 solution was used depending on dose. In Paper III, additional chemicals were used for chemical enhanced backwash (CEB) and cleaning in place (CIP). For CEB, a 25. % NaOH, 12.5 % NaClO and 37 % H2SO4 solutions were used, and for CIP clean citric, oxalic and ascorbic acid were used.


27
4 Source Waters
The raw water source for any water utility has a large impact on the choices of treatment. All water sources have a unique composition of organic matter that is influenced by the catchment area, surrounding geology and retention times. However, there are a few commonalities among surface water that can give an indication on suitable treatments prior to investigations, such as pilot studies. This section describes the results from previous studies, experiences from the water utility, and results from this thesis, of Lake Bolmen and Lake Vomb. The description will set the stage for the choices of treatment investigated during this study.
4.1 Lake Bolmen Lake Bolmen is oligotrophic and the main water source for Ringsjö WW and the dependence on it will only increase when the source will be used at Vomb WW. The main reasons why this water source is suitable for treatment are the large possible sustainable extraction volume and the low nutrient load. The catchment area around the lake is dominated by forest, bogland and iron rich soils, which causes the lake to be rich in NOM and with high color content (Eikebrokk et al., 2018; Persson, 2011; SMHI, 2018). The origin of the organic matter was also reflected in the high UVA254nm (35-45), color (90 mg Pt/ L) and SUVA values (4 L, m-1, mg-1) (Eikebrokk et al. (2018) and Paper V). The composition of NOM makes the water suitable for chemical flocculation. This comes from years of operational experience and it is shown in the high SUVA-value (Paper III and V) of the lake. At the same time, the treatment processes that occur during infiltration was shown to be inadequate at removing organic matter from the water (Paper V). The results from this study are presented in Chapter 6. The water quality varies in Lake Bolmen and improves during the transport through the tunnel to Ringsjö WW (Table 4). Table 4 Average water quality in Lake Bolmen (before the tunnel) and after Bolmen tunnel, and median drinking water quality after treatment at Ringsjö WW, 2019 (Sydvatten AB, 2020).
Sampling point
Color [mg Pt/ L]
Turbidity [FNU]
CODMn [mg/ L]
TOC [mg/ L]
pH Alkalinity [mg HCO3-/ L]
Lake Bolmen 90 2.0 N/A 9.8 6.9 8.1 Bolmen tunnel 52.5 1.1 9.0 8.3 7 14.2 Treated water < 5 < 0.10 1.3 N/A 8.1 44

28
4.2 Lake Vomb The water quality of Lake Vomb differs from Lake Bolmen in several ways. Lake Vomb is hypertrophic and experiences strong seasonal algal blooms caused mostly by runoff from agricultural land in the catchment area around the lake (Länsstyrelsen i Skåne Län, 2012; Li, 2020). The seasonal blooms affect the maintenance of the infiltration basins at Vomb WW, where basins are taken into operation in late autumn-winter to ensure the development of the basin biofilms before algae blooms in late summer the following year (Li et al., 2017). This was reflected in the measured FI in Paper IV, suggesting slightly higher DOM origins from microbial sources compared to terrestrial sources. This causes the organic composition of Lake Vomb to differ from that of Lake Bolmen, where the UVA254nm and SUVA were significantly lower, around 20 m-1 and 2 (mg⋅m)/ L, respectively (Paper IV). The correlation between the organic matter and bacterial community was shown in Paper IV, where the composition changed depending on the water temperature (Figure 14).

29
Figure 14 Changes in NOM and microbial community in the Lake Vomb raw water depending on raw water temperature. The figure shows (a) the TOC and SUVA (UVA254nm:TOC ratio) changes, (b) the TCC, (c) % HNA, (d) %L-LNA, (e) H-LNA and (f) N-HNA (adapted from Paper IV).
TCC and all subgroups (L-LNA, H-LNA, N-HNA AND HNA) increased with temperature. Higher cell counts in raw waters have also been observed during summer, in Finland (Kolehmainen et al., 2007). However, the composition of the

30
microbial community changed, as the % L-LNA decreased; and, the % H-LNA, % N-HNA and % HNA increased (Figure 14). At the same time, the NOM compositionchanged: SUVATOC (UVA254nm:TOC ratio) increased during the summer months,and coincided with the seasonal algae blooms (Li et al., 2017). This is likely aninteraction between NOM composition and bacterial communities, where cells withmore DNA increase and a decrease in bioavailable organic carbon results from thisincreased biomass.
As previously mentioned, surface waters with low SUVA values tend to be more difficult to treat by chemical flocculation. This was also shown in Paper I where the coagulant dosages when treating water from Lake Vomb, compared to Lake Bolmen, where about 15 % higher for about the same UVA254nm reduction (around 70 %) (Hägg, 2015). The alkalinity of Lake Vomb also makes treating the water through chemical flocculation difficult. Because the coagulation pH needs to be around 5-6 depending on the coagulant, high amounts of acid (usually HCl or H2SO4) need to be added prior to the coagulant to reduce the alkalinity and lower pH. Table 5 shows the water quality parameters of Lake Vomb. Table 5 Average water quality in Lake Vomb and median drinking water quality after treatment at Vomb WW, 2019 (Sydvatten AB, 2020).
Sampling point
Color [mg Pt/ L]
Turbidity [FNU]
CODMn [mg/ L]
TOC [mg/ L]
pH Alkalinity [mg HCO3-/ L]
Lake Vomb 23.4 3.5 5.1 6.6 8.4 165.5 Treated water 5.95 0.12 1.5 N/A 8.4 140
31
5 Chemical Flocculation and Floc Separation
Three pre-treatment methods were tested during this thesis. The first method was combining chemical flocculation and disc filtration using 10 and 40 µm micro sieves (disc filters) (Paper I). This was done through a series of laboratory scale jar tests at Vomb WW using water from Lake Vomb as source water. In Paper II, the well-established method of contact filtration was tested in combination with artificial recharge. In this section, the results from contact filtration on the infiltration water is described. The impact of pre-treated water for infiltration is later described in Chapter 6. The last method tested was a full-scale implementation of UF membranes prior to infiltration (Paper III). In this study, the UF-membrane pilot using two different configurations was compared with conventional precipitation at Ringsjö WW. The aspects that were explored were water quality, flexibility and economic viability.
5.1 Micro sieving (Paper I) Prior to the disc filter investigation, a series of jar tests were conducted to establish viable Fe3+ dosages and flocculation times for Fe3+ and synthetic anionic polymer (Paper I). Based on the results, 173 mmol Fe3+/ m3 (70 mg FeCl3 solution/ L) coagulant dosage was chosen, and 720 s flocculation time for Fe3+ prior to polymer additions and 240 s flocculation time for the polymer prior filtration. The result from chemical flocculation and disc filtration using 10 and 40 µm disc filters can be seen in Figure 15.

32
Figure 15 Results from combining chemical flocculation with (a) 10 um and (b) 40 um micro sieves for water from Lake Vomb. The average raw water UVA254nm (n = 4) and TOC (n = 2) during 10 um were 17.3 ± 0.4 and 8.8 mg/L, respectively, and during 40 um 18.2 ± 0.15 and 9.3 mg/L, respectively (adapted from Paper 1).
The polymer dosage had the largest impact on the volume permeate but also on the UVA254nm at lower dosages (up to about 0.5 mg polymer/ L). This was especially apparent when using 40 µm disc filters where lower dosages (around 0.1 mg/ L) resulted in high variation in UVA254nm and permeate volume. However, there was minimal impact on water quality (UVA254nm) when increasing the polymer dosage above 0.5 mg/ L. This suggests adequate polymer dosages were used for binding flocs together and to resist breakage during filtration. At higher polymer dosages (above 0.6 mg/ L), negative effects appear which resulted in lower permeate volumes and higher TOC when using 10 µm disc filter (Figure 15a). This is likely
33
a result of excessive polymer dosage and clogging of the filter. Because the polymer did not significantly absorb UV-light (Paper I) and the UVA254nm remained constant, the increase in TOC was very likely caused by residual polymer in the permeate. When using 40 µm disc filters with higher polymer dosages (Figure 15b) the volume permeate continued to increase (within the studied polymer dosage range).
The Swedish regulatory limit for polyacrylamide in drinking water is 0.5 mg/ L raw water (Swedish Food Agency, 2001) which results in a UVA254nm and TOC removal by 74 and 49 % with 10 µm filters, and 70 and 50 % with 40 µm filters, respectively. At this polymer dosage, the permeate volume using 40 µm disc filters was about 30 % more than the 10 µm filters. Overall, the results showed an inadequate removal of organic matter, measured as TOC. This could be because the tests were done in laboratory scale which might not translate directly to full-scale, but it could be a combination with the inherent difficulty to treat water from Lake Vomb through chemical flocculation.
5.2 Contact filtration (Paper II) The results from the 4-month contact filtration pilot study at Vomb WW are described in this section. The study investigated the effect of pre-treating water from Lake Vomb and compared it to the existing treatment at Vomb WW (Figure 7, treatment train). The differences in treatment performance were examined between contact treatment (contact filtration) and control treatment (500 µm micro sieves) by following the treatment train in four steps: (1) raw water, (2) pre-treatment, (3) water in the basins and (4) water collected in the wells.
5.2.1 NOM and particle removal
The results from the NOM (TOC, COD, UV254nm-VIS436nm absorbance) and particle (turbidity) removal rates (Table 6) showed that about 55 % of TOC and 66% of COD, and about 68 % of the UVA254nm and 86 % of VISA436nm were removed by the contact filters. An additional 25 % of TOC and 23 % of COD were removed after infiltration. The total TOC and COD removal were 67 % and 74 %, respectively. The control treatment (500 µm) only removed contaminants associated with organic and inorganic particles, due to the size of the micro sieves. Overall, the TOC and COD were removed by about 52 % and 68 %, respectively. This was slightly less than what was observed from full-scale operations without pre-treatment (Table 5 Chapter 4), where retention times were around 2-3 months.

34
Table 6 NOM and turbidity measurements for each treatment step for water from Lake Vomb (adapted from Paper II).
Sampling point
TOC [mg/ L]
COD [mg/ L]
Turbidity [FAU]
UVA254nm [m-1]
VISA436nm [m-1]
Raw water Average 6.3 5.0 4.6 17.2 2.09 Min/Max 4.3-9.1 4.1-5.6 2.4-6.5 15.9-17.7 1.6-2.2
After contact filtration
Average 2.8 1.7 1.0 5.5 0.3 Min/Max 2-3.3 1.4-2.4 0.3-5.8 4.5-7.2 0.2-0.6
After control treatment
Average 6.7 4.8 3.8 16.4 1.5 Min/Max 5.5-8.5 4.0-5.5 2.7-4.5 15.1-17.1 1.0-1.9
Contact filter basin
Average 2.8 1.7 1.3 5.2 0.5 Min/Max 2.1-3.2 1.3-2.4 0.3-5.8 4.7-5.8 0.2-0.6
Control treatment basin
Average 6.7 5.3 4.6 16.3 1.6 Min/Max 5.1-7.4 4.3-6.4 3-14.2 15.1-16.4 1.1-1.7
Contact filter well
Average 2.1 1.3 N/A 4.4 0.9 Min/Max 1.9-2.5 1-1.6 N/A 1.1-6.9 0.2-1.3
Control filter well
Average 3.0 1.6 N/A 5.2 0.4 Min/Max 2.1-3.5 0.7-12.3 N/A 1.2-7.2 0.04-1.4
5.2.2 Cyanobacteria, toxin and nutrient removal The effect of removing nutrients prior to infiltration by contact filtration is summarized in Table 7. As expected, the control treatment had little to no effect on nutrient and cyanobacteria removal. Cyanobacterial biomass increased in the control basin likely due to the high nutrient load in the basin. On the other hand, pre-treated source water resulted in significantly less phosphorus and hence cyanobacterial biomass. However, no cyanobacteria were found in the wells (Paper II). The removal of cyanobacteria after contact filtration also led to a removal of microcystin. This was not the case in the control basin where microcystin concentrations were the same in the basin as in the raw water. Table 7 Nutrient, cyanobacteria and microcystin measurements for each treatment step for water from Lake Vomb (adapted from Paper II). The table shows the averages over the whole study period.
Samplingpoint Total-P [mg/ L]
NH4+ [mg/ L]
NO3- [mg/ L]
PO43- [mg/ L]
Cyano-bacteria*
Microcystin [µg/ L]
Raw water Average 0.10 0.069 0.37 0.17 Present 0.14 Min/Max 0.04-0.19 0.014-0.23 0.20-0.99 0.049-1.0 0-1
After contact filtration
Average <0.02 0.057 0.52 <0.02 None 0.053 Min/Max <0.02 0.024-0.19 0.04-1.6 <0.02 0.01-0.27
After control treatment
Average 0.07 0.052 0.56 0.070 Present 0.13 Min/Max 0.02-0.11 0.018-0.16 0.21-1.7 0.02-0.11 0.01-1.1
Contact filter basin
Average <0.02 0.044 0.39 <0.02 None 0.056 Min/Max 0-0.018 0.011-0.096 0.21-1.1 0-0.019 0.01-0.30
Control treatment basin
Average 0.10 0.049 0.32 0.10 Numerous 0.14 Min/Max 0.06-0.22 0.03-0.099 0.14-1.0 0.06-0.22 0.01-0.75
Contact filter well
Average <0.02 0.0082 0.55 0.049 0.026 Min/Max <0.02 0-0.021 0.15-1.6 <0.02 0-0.09
Control filter well
Average <0.02 0.0075 0.80 <0.02 0.029 Min/Max <0.02 0-0.02 0.28-1.6 <0.02 0-0.24
*Based on subjective observations in the settling chamber.
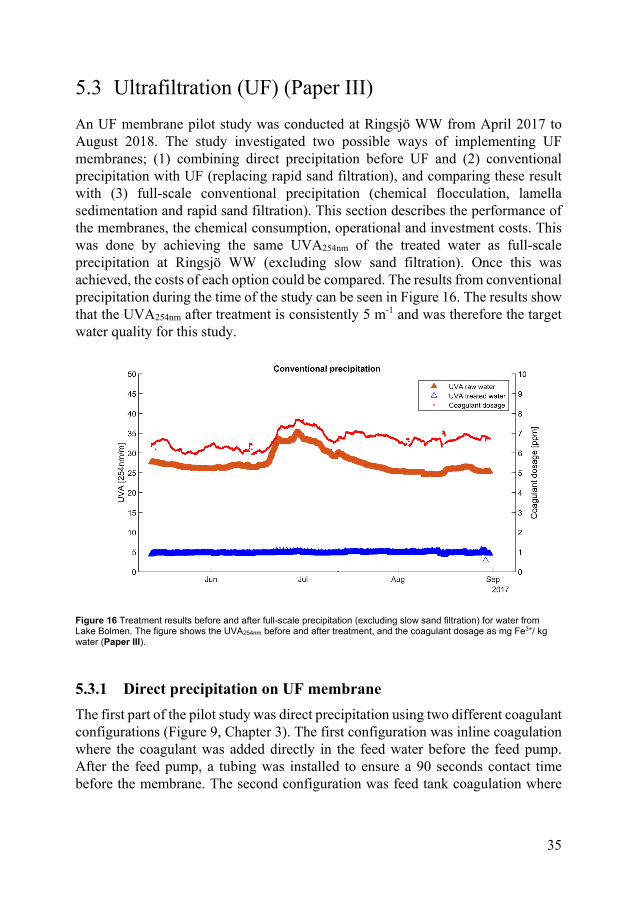
35
5.3 Ultrafiltration (UF) (Paper III) An UF membrane pilot study was conducted at Ringsjö WW from April 2017 to August 2018. The study investigated two possible ways of implementing UF membranes; (1) combining direct precipitation before UF and (2) conventional precipitation with UF (replacing rapid sand filtration), and comparing these result with (3) full-scale conventional precipitation (chemical flocculation, lamella sedimentation and rapid sand filtration). This section describes the performance of the membranes, the chemical consumption, operational and investment costs. This was done by achieving the same UVA254nm of the treated water as full-scale precipitation at Ringsjö WW (excluding slow sand filtration). Once this was achieved, the costs of each option could be compared. The results from conventional precipitation during the time of the study can be seen in Figure 16. The results show that the UVA254nm after treatment is consistently 5 m-1 and was therefore the target water quality for this study.
Figure 16 Treatment results before and after full-scale precipitation (excluding slow sand filtration) for water from Lake Bolmen. The figure shows the UVA254nm before and after treatment, and the coagulant dosage as mg Fe3+/ kg water (Paper III).
5.3.1 Direct precipitation on UF membrane The first part of the pilot study was direct precipitation using two different coagulant configurations (Figure 9, Chapter 3). The first configuration was inline coagulation where the coagulant was added directly in the feed water before the feed pump. After the feed pump, a tubing was installed to ensure a 90 seconds contact time before the membrane. The second configuration was feed tank coagulation where
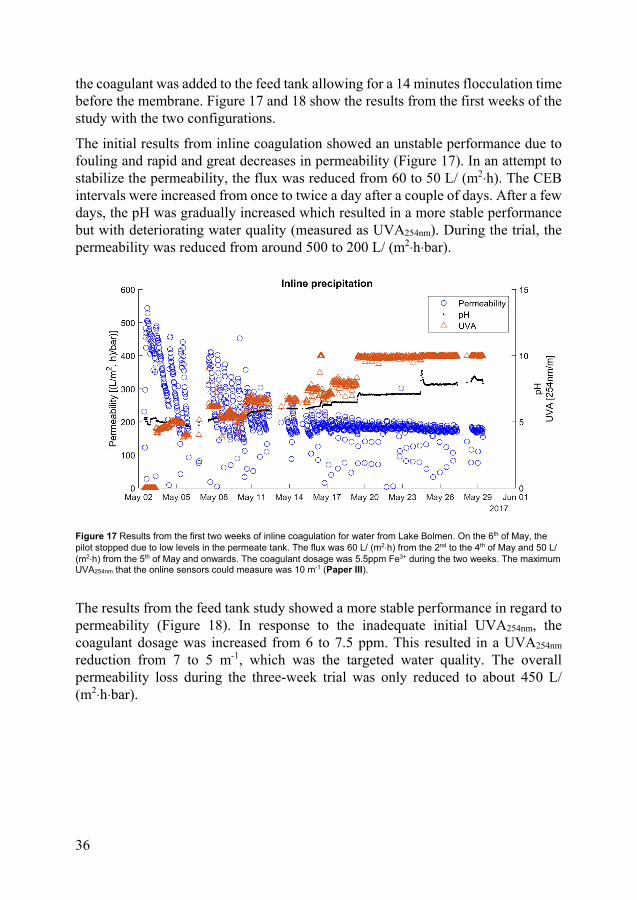
36
the coagulant was added to the feed tank allowing for a 14 minutes flocculation time before the membrane. Figure 17 and 18 show the results from the first weeks of the study with the two configurations.
The initial results from inline coagulation showed an unstable performance due to fouling and rapid and great decreases in permeability (Figure 17). In an attempt to stabilize the permeability, the flux was reduced from 60 to 50 L/ (m2⋅h). The CEB intervals were increased from once to twice a day after a couple of days. After a few days, the pH was gradually increased which resulted in a more stable performance but with deteriorating water quality (measured as UVA254nm). During the trial, the permeability was reduced from around 500 to 200 L/ (m2⋅h⋅bar).
Figure 17 Results from the first two weeks of inline coagulation for water from Lake Bolmen. On the 6th of May, the pilot stopped due to low levels in the permeate tank. The flux was 60 L/ (m2⋅h) from the 2nd to the 4th of May and 50 L/ (m2⋅h) from the 5th of May and onwards. The coagulant dosage was 5.5ppm Fe3+ during the two weeks. The maximum UVA254nm that the online sensors could measure was 10 m-1 (Paper III).
The results from the feed tank study showed a more stable performance in regard to permeability (Figure 18). In response to the inadequate initial UVA254nm, the coagulant dosage was increased from 6 to 7.5 ppm. This resulted in a UVA254nm reduction from 7 to 5 m-1, which was the targeted water quality. The overall permeability loss during the three-week trial was only reduced to about 450 L/ (m2⋅h⋅bar).

37
Figure 18 Results from the first three weeks of feed tank precipitation for water from Lake Bolmen. The figure shows the permeability, coagulant dosage and UVA254nm (Paper III).
After the initial trials, the capacity of the two membrane configurations was tested (Figure 19). The results from inline coagulation are shown in Figure 19(a). During this trial, the coagulant dosage was 6.25 ppm and later reduced to 5.25 ppm. The reduction in coagulant dosage still resulted in adequate water quality (UVA254nm ≤ 5 m-1). The pH was 5.1 and the flux remained 50 L/ (m2⋅h) during the whole study. During the feed tank study, the pH was also set to 5.1 and the permeability changed depending on the flux (Figure 19(b)). The flux was initially 50 L/ (m2⋅h) and gradually increased to 60 L/ (m2⋅h). The increase in flux resulted in a permeability decrease but was stabilized when the flux was reduced to 50 L/ (m2⋅h).

38
Figure 19 Results from the capacity trials for the two membrane configurations. The results from (a) inline coagulation shows the permeability, coagulant dosage and UVA254nm, and in (b) feed tank precipitation, the permeability and flux is shown (Paper III).
The results from the capacity trials showed that a stable performance with the targeted water quality was achieved at a flux of 50 L/ (m2⋅h). This required a CEB intervals of 12 hours for both configurations which resulted in a recovery rate of 88 % and a net-flux of 40 L/ (m2⋅h). The reduced amount of coagulant needed compared to conventional precipitation, the potential chemical savings could reach about 15 %. Overall, a membrane facility using the presented configurations with a capacity of 2 m3/ s would require 180,000 m2 membrane area. For direct precipitation, a secondary membrane treatment step would be required for BW waste treatment. The same flux was assumed for this treatment step. Based on the recovery rate (88 %), an additional 12 % membrane area would be required which results in a total membrane area of 201,600 m2.

39
5.3.2 Conventional precipitation with UF membrane The second part of the pilot study was combining the UF membrane with conventional precipitation, replacing the rapid sand filters. The benefit from this configuration was that most of the flocs formed settled out in the sedimentation basins prior to filtration. As a result, the flux was higher than direct precipitation. The results from the two-month study can be seen in Figure 20.
Figure 20 Results from conventional precipitation with UF membrane. The figure shows the water quality of the raw water, the flux and permeability. During the trial, the flux was increased from 50 to 90 L/ (m2⋅h) resulting in a permeability ranging from 600 to 400 L/ (m2⋅h⋅bar).
The initial flux was 50 L/ (m2⋅h) and was gradually increased to 80 L/ (m2⋅h) over the first week. The results showed that it was possible to have stable permeability around 500 L/ (m2⋅h⋅bar) with a flux of 80 L/ (m2⋅h), with one exception. On the 15th of October, the permeability decreased, which coincided with a strong increase in turbidity in the raw water (UVA254nm, Figure 20). At the end of the trial, the flux was increased to 90 L/ (m2⋅h) resulting in a permeability decrease to about 350 L/ (m2⋅h⋅bar). This showed that it is possible to increase to a higher flux for brief periods of time. However, the sustainable flux was considered to be 80 L/ (m2⋅h) which translates to a net-flux of 70 L/ (m2⋅h) with a recovery rate of 95 %. With this flux, a facility with 2 m3/ s production capacity would require 102,900 m2 membrane surface area. During the trial, the CEB intervals were 24 hours, resulting in nearly four times the savings in CEB-chemicals compared to direct precipitation.

40
5.3.3 Chemical consumption The chemical consumption for each treatment method is presented in Table 8, and was based on an annual production of 63,000,000 m3 (2 m3/ s). Table 8 Chemical consumption presented in tons/ year (adapted from Paper III). FeCl3 and NaOH consumption were based on annual averages from Ringsjö WW (2016). CEB chemical consumption was based on the results from the membrane pilot and calculated by the manufacturer.
Configuration FeCl3 (40 %) NaClO (12.5 %) NaOH (25 %) HCl (25 %) Conventional precipitation with RSF 4,023 0 1,159 0 Direct precipitation on UF 3,420a 277b 695c + 301b 263b Conventional precipitation with UF 4,023 71 1,159 + 77 67
aIncluding 15 % chemical saving. bCalculated value based on the increased membrane area and increased CEB frequency (201,600/102,900⋅2). cCalculated based on a 40 % savings.
The consumption of coagulant (FeCl3) and NaOH, which is used for pH control, was the highest for each treatment method. The benefit of direct precipitation was the saving in coagulant usage, and as a result, the need for NaOH was reduced by 40 %. However, the increased CEB frequency increased the need for NaOH to a total of 996 tons/ year. The total yearly CEB consumption for direct precipitation and conventional precipitation with UF was 841 and 215, respectively.
5.3.4 Operational and investment costs The operational and investment costs for the three alternatives are important aspects for the feasibility of implementation of each treatment method. The operational costs included in this study were chemicals, energy and membrane replacement costs. The latter only applies for the two membrane facilities and is based on the lifetime of the membrane modules. According to the manufacturer, the lifetime of the membrane is usually around 10 years if the CEB frequency is once per day, and about 5-7 years if the frequency is twice per day. In Table 9, the operational cost for each alternative is presented in $/ m3 treated water. The costs are based on data from the pilot study and operational experiences.

41
Table 9 Operational costs for the three treatment alternatives in $/ m3 (adapted from Paper III). The data taken from operational experiences from Ringsjö WW, Lackarebäck WW, retailers and the pilot trial. Other shared costs, e.g. heating, etc., were not included.
Operational cost Conventional precipitation with RSF
Direct precipitation on UF
Conventional precipitation with UF
FeCl3 0.011 0.009 0.011 NaClO 0 9.0∙10-4a 2.3∙10-4a NaOH 0.0031 0.0019 + 8.1∙10-4a 0.0031 + 2.1∙10-4a HCl 0 3.4∙10-4a 8.7∙10-5a Energy costb 3.1 ⋅ 10-4 0.0039 0.0040 Membrane replacementc 0 0.011d 0.004e Total cost 0.014 0.028 0.023
aCost for cleaning chemicals bCosts were based on the energy consumption for flocculation and sedimentation basins (290 kwh/ day), rapid sand filters (200 kwh/ day) and UF membranes (0.035 kwh/ m3, based on experiences from full-scale UF membrane facility in Lackarebäck in Sweden). Energy cost was estimated to $ 0.11/ kwh, based on the Swedish market. cEstimated at $ 25/ m2, based on costs taken from the retailer. dCalculated from a 7 year module and 201,600 m2 membrane area eCalculated from a 10 year module and 102,900 m2 membrane area
The investment cost for each alternative is based on a facility able to produce 2 m3/ s (63 M m3/ year). As discussed in Paper III, the installation cost per membrane surface area for a membrane facility was expected to decrease with an increase of membrane modules. Based on Huehmer (2016), the price for the membranes in a direct precipitation on UF membrane facility was estimated to 12.5 %. This corresponds to approximately 330 and 290 $ / m2 membrane area for 201,600 m2 and 102,900 m2 membrane surface area, respectively. As mentioned before, 201,600 m2 membrane area was required for a direct precipitation on UF membrane facility and 102,900 m2 membrane area was required for a facility combining conventional precipitation with UF. The investment cost for each treatment step can be seen in Table 10.
Table 10 Investment costs for the three alternatives in M $ (adapted from Paper III).
Treatment step Conventional precipitation with RSF
Direct precipitation on UF
Conventional precipitation with UF
Flocculation basins and lamella sedimentationa
16 0 16
Rapid sand filtersa 27 0 0 Membrane 0 58b 34c
Shared costsd 19 19 19 Total 62 77 69
aCosts based on experiences from studies conducted at Ringsjö WW. bCalculated based on data from retailers including 12.5 % discount. cTaken based on experiences from WTPs in Sweden and literature (Huehmer, 2016). dShared costs such as sludge management. Details can be seen in Paper III.
Based on these results, conventional precipitation was the cheapest option to build and operate, followed by conventional precipitation with UF and direct precipitation on UF membranes.

42
5.4 Discussion on pre-treatment options and viability The studied methods of pre-treating the source water could be viable to produce water of drinking water quality except for flocculation combined with disc filtration. In this case, the TOC content exceeded 4 mg/ L, but it is possible that this technique would yield better results in pilot-scale. However, because this would be a pre-treatment step prior to infiltration, the result could be suitable for this purpose. The indication of residual polymer in the permeate would be an issue and a strong argument for rejecting this method due to risks of clogging the infiltration basins. To combat this issue, it is possible to use rapid sand filters prior to infiltration. However, this would be an unnecessary investment (Paper III) and would defeat the purpose of the disc filters. The second aspect that speaks against this method is the potential limits to production capacity, especially without the use of polymers. The permeate volume ranged between 200-300 mL after one minute of filtration, and at this point the disc filters were clogged. When untreated water was filtered for one minute using 10 µm disc filters, the permeate volume was over 1100 mL without any signs of clogging the filter (Paper I). Based on this, combining chemical flocculation with 10 µm disc filters would reduce the capacity of the disc filter units to, at least, one sixth of their original capacity and probably much more than so. Based on experiences from pilot trials at Vomb WW, around ten full-scale units with 10 µm disc filters were needed to treat 2 m3 raw water/ s (personal communication with Sydvatten). As a result, 50-100 disc filter units would be required if combined with chemical flocculation. Furthermore, severe fouling and high frequency of chemical cleaning is expected due to the severe clogging experienced in the lab tests.
The utilization of contact filtration, which is known to be effective, showed good results when treating water from Lake Vomb (Paper II). This flocculation method is already used at several WTPs in Sweden in combination with artificial recharge with satisfactory results (Hägg et al., 2018). However, WTPs utilizing this method tended to have lower production (< 7.3 M m3/ year, Paper V) which indicates diminishing returns at higher production capacity demands. As mentioned before, the annual water production at Vomb WW is at the moment around 35 M m3 and with the possibility to double the production (based on the available raw water volume) within a few years. The high production need speaks against the use of this technique.
Direct precipitation on UF membranes has been shown to be a viable option for treating drinking water in Sweden (Keucken et al., 2017). However, in this case the source water had lower NOM content (TOC < 4 mg/ L) than water from Lake Bolmen (TOC ≈ 8 mg/ L (Sydvatten AB, 2019)). The effect of these differences was reflected in the pilot study, where the flux was low and cleaning frequencies high. This also resulted in a rather unstable performance of the membrane. Furthermore,

43
direct precipitation was also the most expensive technique, both to operate and install (Paper III).
When combining conventional precipitation with UF membranes, where a majority of the flocs were removed prior to filtration, the results were more promising. Because the pre-treated source water used as feed water had significantly lower NOM content, the membrane configuration had higher flux and lower cleaning frequencies. As a result, the investment and operational costs were much lower than direct precipitation. Conventional precipitation with UF membranes was not the cheapest option but it benefits from having a higher accumulated microbial barrier than the other options.
The last pre-treatment option considered in this thesis was conventional precipitation. This treatment process is the most common and known to be economically feasible for NOM removal (Jacangelo et al., 1995). As discussed in Paper III, the utility has many years of operational experience treating water from Lake Bolmen using this technique and with good results. This technique was also the cheapest to install and operate, which makes it a good option as a pre-treatment at Vomb WW.
To summarize, the two most viable options for the water utility were conventional precipitation and conventional precipitation with UF. However, these two techniques are not mutually exclusive, meaning that both of these methods could be used in combination. With the added benefit of using UF membranes in this configuration, it is possible to bypass the infiltration field if compromised. This comes from the increased protection from microbial pathogens provided by UF membranes (Table 11). Table 11 Log-reduction for treatment methods for microbial pathogens (Ødegaard et al., 2014a; Pott, 2015).
Treatment process Maximum log-reduction Bacteria Viruses Parasites
Slow sand filtration (SSF) 2.0 2.0 2.0 Contact filtration 2.5 2.0 2.5 Chemical flocculation, sedimentation and RSF
2.75 2.25 2.75
Chemical flocculation, sedimentation and UF
4.75 4.0 4,75
Direct precipitation on UF membrane
3.0 3.0 3.0
Recommended accumulated barrier
6.0 6.0 4.0
Conventional precipitation without SSF would yield a log-reduction of 2.75b: 2.25v: 2.75p (bacteria: viruses: parasites), and conventional precipitation with UF membranes (excluding RSF) would yield 4.75b: 4.0v: 4.75p. This does not include disinfection through UV-light, which would place the later method above the required microbial barrier (6.0b: 6.0v: 4p). However, without the infiltration field,

44
the treated water quality would be insufficient. The treated water would only be used for short periods of time in case of an emergency (e.g. oil leak from a motor vehicle accident). The best option could perhaps be a combination of the two methods, where the facility has the capacity to treat half (1 m3/ s) the surface water with UF membranes. That way the utility will get an effective technique to pre-treat the source water with conventional precipitation and at the same time the operational flexibility to bypass infiltration (with a reduced capacity).

45
6 Artificial Groundwater Recharge
This chapter describes the chemical and bacterial community changes during infiltration (Paper IV), the predictors of potential need for pre-treatment of surface waters (Paper V) and the benefits of pre-treatment for basin infiltrations (Paper II and V).
6.1 Water quality changes during infiltration (Paper IV) To examine the impact of drying and freezing an infiltration basin on treatment performance (Paper IV) a five-month split-basin experiment was conducted (Figure 21).
Figure 21 Summary of all results during the whole study. All chemical and bacterial measurements are presented as the average value over the study period (Paper IV).

46
Generally, most of the water quality changes occurred after only 50 cm of infiltration. The TOC and UVA254nm were removed by 37.1 and 35.5 %, respectively (pTOC and pUVA < 0.05). TOC was removed to a larger extent than UVA254nm (p < 0.1, Paper IV), which is an indication of a higher reduction of biodegradable organic matter (Goel et al., 1995). The fluorescence measurements showed that protein-like components were reduced by 33-35 % and humic-like components were removed by about 21 % (Paper IV). These results reflect the heterogenic removal of NOM during infiltration and percolation. Table 12 shows all the significant changes NOM between the raw water and infiltrated water samples. Table 12 Results from the Student’s t-test conducted on the TOC and UVA254nm by comparing two pairs of locations (L1 and L2). The table shows the sampling location, the parameter, the mean value and Pearson p-value two tailed test. Location “All samplers” refers to all soil water samples B-50 refers to all samplers at 50 cm under Basin B (adapted from Paper IV).
Location, L1 Location, L2 Parameter Average, L̅1 Average, L̅2 Ρ-value Raw water All samplers TOC (mg/ L) 11.8 7.4 3.3∙10-11 Raw water All samplers UVA254nm (m-1) 19.3 12.8 4.3∙10-19 Raw water B3 and B4-50 C1 0.73 0.58 2∙10-8 Raw water B3 and B4-50 C2 0.42 0.35 1.3∙10-6 Raw water B3 and B4-50 C3 0.45 0.29 1.9∙10-11 Raw water B3 and B4-50 C4 0.12 0.11 1.0∙10-4
The majority of changes to the bacterial community in the infiltrated water also occurred after 50 cm of infiltration. The % ICC increased after infiltration which has also been observed after slow sand filtration (SSF) (Chan et al., 2018; Lautenschlager et al., 2014). In contrast to in SSF studies, the % HNA increased after infiltration. This could be because the lake water is rich in biodegradable NOM, which could support growth of HNA bacteria. Because the TCC was reduced by about 99 % (2-log removal) overall, the perceived increase in HNA-bacteria could also come from a majority removal of LNA bacteria. Finished drinking water at Vomb WW (Chan et al., 2016), had decreased % HNA and a shift towards LNA-bacteria after the complete infiltration. The same study showed that the TCC was 4.6∙105 ± 4.0∙103 cells/ mL in the well water, about 10 times higher than what was measured 50 cm under the basin (Paper IV). Based on this, it is possible that a shift in the bacterial community towards LNA bacteria occurs when biodegradable NOM is depleted as the water passes more deeply into the ground. The TCC increase between the infiltrated water and the well water could be growth of LNA bacteria and biofilm detachment. Table 13 shows the significant bacterial changes between the raw water and infiltrated water samples. Table 13 Results from the Student’s t-test conducted on TCC, % ICC and %HNA measurements The table shows the sampling location, the parameter, the mean value and Pearson p-value two tailed test (adapted from Paper IV).
Parameter Raw water All samplers Ρ-value
TCC (cells/ mL) 6.4∙106 7.4∙104 3.6∙10-11
ICC (%) 41 78 5.5∙10-6
HNA (%) 20 46 5.2∙10-17

47
6.1.1 Infiltration basin treatment performance As the one half of the infiltration basin was dried and allowed to freeze during the winter (A) and the other was not (B), once the basins were restarted (emptied and skimmed), the differences in treatment performance was studied. The results showed few differences based on the TOC and UVA254nm measurements. Only significant differences were observed after 100 cm of infiltration, where the UVA254nm was lower under Basin A (Table 14). Because drying and freezing infiltration basins has been shown to increase permeability (Schuh, 1990), this result was unexpected. There were no significant differences in TOC and UVA254nm after 50 cm (Paper IV), which suggests that differences in retention times might account for more of the observed differences in treatment performance than basin management. The differences in retention times could come from the different infiltration rates in the unsaturated zone (Persson et al., 2005) or the natural variation of the geology in Vomb recharge field (Czarniecka, 2005).
There were no significant differences in TCC between the two basin halves. However, significant differences in the bacterial communities in the infiltrated water were found (Figure 22).

48
Figure 22 Microbial changes over time in the raw water and infiltrated water samples. The figure shows (a) TCC, (b) % ICC, (c) % HNA, (d) % L-LNA, (e) % H-LNA and (f) % N-HNA (Paper IV).

49
TCC in the raw water decreased over time due to the decreasing temperatures. This was previously shown in Figure 14 (Chapter 4). The percent ICC increased after infiltration where the percent ICC was significantly higher under Basin B (Table 14). The changes in the microbial communities can also be seen in the different gated communities (HNA, L-LNA, H-LNA and N-HNA, Figure 22 (c) to (f)), where water samples from under Basin A were closer to the raw water. However, there were some exceptions in samples from under Basin B. These possible breakthroughs can clearly be seen in the fingerprints (Figure 21), where the number of bacteria detected increased in the LNA-range similar to Basin A. Several water samples also had unusually high TCC. Table 13 shows all the significant differences between the two basin halves. Table 14 All significant results from the Student’s t-test (excluding insignificant results) conducted on the TOC, UVA254nm flow cytometric measurements by comparing two pairs of locations (L1 and L2). The table shows the sampling location, the parameter, the mean value and Pearson p-value two tailed test. Location “All samplers” refers to all soil water samples. A-50, B-50, A-100 and B-100 refers to all samplers at 50 and 100 cm under Basin A and B, respectively (adapted from Paper IV).
Location, L1 Location, L2 Parameter Average, L̅1 Average, L̅2 Ρ-value A-side (all) B-side (all) UVA254nm (m-1) 12.3 13.5 0.011 A-100 B-100 UVA254nm (m-1) 12.1 13.5 0.002 A-50 B-50 ICC (%) 72 79 0.04 All samplers A-side
All samplers B-side
ICC (%) 74 80 0.010
A-50 B-50 HNA (%) 35 53 8∙10-9 All samplers A-side
All samplers B-side
HNA (%) 36 56 3∙10-16
B-50 B-100 HNA (%) 53 58 0.05 A-50 B-50 L-LNA (%) 35 18 2∙10-8 All samplers A-side
All samplers B-side
L-LNA (%) 35 16 1∙10-12
A-50 B-50 H-LNA (%) 11 7 6∙10-6 All samplers A-side
All samplers B-side
H-LNA (%) 10 7 8∙10-8
A-50 B-50 N-HNA (%) 54 75 7∙10-11 All samplers A-side
All samplers B-side
N-HNA (%) 55 77 6∙10-13
The bacterial communities in the raw water and infiltrated water differed (Figure 23). The samples from the raw water, Basin A and B formed three overlapping clusters. The NMDS-plot shows that there was a greater overlap between infiltrated water samples from A-side and the raw water. Together with the increased percentage ICC following infiltration in Basin B, Basin B seems to be able to influence the bacterial community in the infiltrated water to a greater extent.

50
Figure 23 Non-metric multidimensional scaling (NMDS) plot. The plot shows samples from (∆) raw water, (+) A-side and (x) B-side. The tree overlapping groups are highlighted with circles including the two exceptions with high TCC from Basin B. These exceptions are from [1] B3-50 and [2] B4-100 (Paper IV).
Based on these results, an argument could be made for both basin management strategies. The two different methods did not seem to affect the NOM-removal performance to any significant extent. However, drying and freezing the basin had an impact on the bacterial communities in infiltrated water after the first meter of infiltration. How this would affect the water collected in wells is unknown. Basin management does however have a large impact on water production capacity. Restarting infiltration basins directly after they are cleaned, would free up surface area in the recharge field and would likely reduce high infiltration rates over small areas. The latter is common in the early stages of biofilm development in infiltration basins, which is why basins are often restarted well before the seasonal algae blooms. The increased permeability achieved through drying and freezing basins might be a viable option in certain cases, such as when permeability in recharge fields are inherently low, or when higher infiltration rates are desirable when basins are used as hydraulic barriers.

51
6.2 Benefits of combining flocculation and MAR (Paper II and V)
The benefits of pre-treating the source water prior to infiltration does not only improve the water quality in the wells, but organic and nutrient load in the basins is reduced (Table 6 and 7). This was clearly seen in Paper II, where the water quality in the basins were significantly improved (Figure 24).
Figure 24 Visual differences in water quality between the control basin (left) and contact filter basin (right) (photo taken by Marie Baehr and Petra Larsson, Paper II).
The improvement in water quality in the basins could have led to increased infiltration rates (Paper II). This was observed by the differences in water level in each basin, where the control basin was covered by water and the contact filter basin was covered two-thirds by water (personal communication with Sydvatten). This has a large impact on maintenance of the infiltration basins, where cleaning and scraping of the basins might be reduced due to decreased organic load (Hägg et al., 2018). Another benefit comes from the removal of cyanobacteria prior to infiltration, which reduces the risk for toxins finding its way into the basins by removing intracellular toxins (Swedish Food Agency, 2018a; Westrick et al., 2010).
The complementary effect of combining chemical flocculation with a biological treatment step, such as SSF or artificial recharge, is well established and was observed in this study (Table 6 and Paper II). In this case the NOM removal rate after infiltration was about 25 %. This effect was also seen in the study described by Paper V, where Swedish artificial recharge plants had similar removal rates before and after infiltration, regardless if the water was pre-treated or not. In this study, a column test was also performed to investigate the NOM removal from water of Lake Bolmen after infiltration and comparing it to well samples collected in Vomb recharge field (Figure 25).
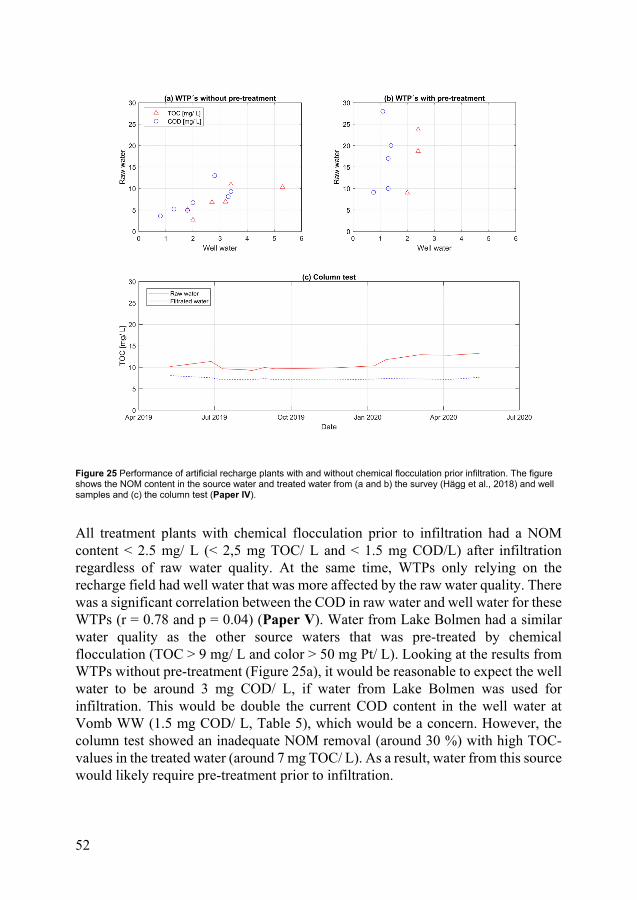
52
Figure 25 Performance of artificial recharge plants with and without chemical flocculation prior infiltration. The figure shows the NOM content in the source water and treated water from (a and b) the survey (Hägg et al., 2018) and well samples and (c) the column test (Paper IV).
All treatment plants with chemical flocculation prior to infiltration had a NOM content < 2.5 mg/ L (< 2,5 mg TOC/ L and < 1.5 mg COD/L) after infiltration regardless of raw water quality. At the same time, WTPs only relying on the recharge field had well water that was more affected by the raw water quality. There was a significant correlation between the COD in raw water and well water for these WTPs (r = 0.78 and p = 0.04) (Paper V). Water from Lake Bolmen had a similar water quality as the other source waters that was pre-treated by chemical flocculation (TOC > 9 mg/ L and color > 50 mg Pt/ L). Looking at the results from WTPs without pre-treatment (Figure 25a), it would be reasonable to expect the well water to be around 3 mg COD/ L, if water from Lake Bolmen was used for infiltration. This would be double the current COD content in the well water at Vomb WW (1.5 mg COD/ L, Table 5), which would be a concern. However, the column test showed an inadequate NOM removal (around 30 %) with high TOC-values in the treated water (around 7 mg TOC/ L). As a result, water from this source would likely require pre-treatment prior to infiltration.

53
7 Conclusion
This thesis followed the challenges facing a surface WTP and an artificial groundwater recharge plant, in southern Sweden. This work investigated: different pre-treatment methods of surface water prior to artificial recharge (Paper I, II and III); the source water quality requirements for infiltration (Paper V); and, the chemical and bacterial community changes during infiltration (Paper IV). The results have been applied in ongoing investigations conducted by the water utility, with the intention that the results also could benefit the water industry as a whole and be applied by other utilities in their investigations.
Coagulation and flocculation of water from Lake Vomb proved to be more difficult than water from Lake Bolmen. The NOM removal rates were about the same but required higher coagulant dosages (Paper I). All investigated chemical flocculation techniques could yield satisfactory NOM removal at different costs, production capacity, chemical consumption, and operational flexibility. This aspect was associated with the different ways the flocs were separated (Paper I, II and III). In general, the separation techniques with compact, low footprint designs (i.e. disc filters, contact filtration and direct precipitation on UF membranes) were suitable for WTPs with lower production capacity. On the other hand, conventional precipitation (chemical flocculation and sedimentation) and conventional precipitation with UF were more suitable for high production capacities.
This led to considerations of source water quality requirements for artificial groundwater recharge. The capacity of the infiltration field to remove NOM from Lakes Vomb and Bolmen was different due to the chemical composition of the two source waters. The water from Lake Vomb had a NOM composition more suitable for treatment through artificial recharge compared to water from Lake Bolmen (Paper IV and V). As a result, pre-treatment of water from Lake Bolmen would be necessary to allow for increased production and to sustain groundwater with high quality. Capacity improvements at Vomb WW could be possible by changing the management of the infiltration basins. The investigations of the recharge field showed that restarting the basins directly after they were emptied and cleaned could lead to a more efficient use of the recharge field at no cost to the treatment performance.
The use of soil water samplers in this study allowed for changes in the infiltrated water to be investigated, excluding interference from natural groundwater (Paper

54
IV). The results showed that the capacity of the infiltration field to remove NOM after the first meter of infiltration was significant (about 40 %), and the removal of bacterial cells was achieved to an even greater extent (2-log removal). The bacterial communities in the infiltrated water showed a shift towards cells with more DNA (HNA) as a result of either a majority removal of LNA cells from the source water or biofilm detachment from the soil, or both. Drying and freezing the infiltration basin changed the way the biofilm affected the bacterial community in the infiltrated water. This revealed that increasing the permeability of the soil layers by drying and freezing the basin likely impedes the efficiency of the biofilm’s capacity to affect the source water bacterial community: flow cytometry fingerprints describing infiltrated water from under the previously frozen basin were more similar to the bacterial community in the source water.
This thesis has been a part of a larger investigation conducted by Southern Sweden Water Supply (Sydvatten AB). The results from this work will be used and further developed to secure the water supply in southern Sweden. The most viable option for pre-treatment of water from Lake Bolmen is likely a combination of conventional precipitation and UF membranes. The future, modern, artificial recharge plant in Vomb will be better equipped to handle potential deterioration of the source waters due to land use and climate change, and to produce drinking water for the growing population.

55
8 Limitations and Future Work
During this thesis, investigations have been done alongside the water utility in an effort to meet the challenges facing a fast-growing region, in southern Sweden. Considerable work has also been done to increase the understanding of the dynamics of artificial recharge. However, there were limitations in this work, with some past questions remaining and new questions arising. In this last chapter, limitations of this work, interesting aspects of process development and future work will be discussed
8.1 Limitations of the study As with many research projects, this study had several limitations related to time and resources. Limitations which applied more specifically to this study, had to do with applications of certain results to other conditions. For example, the performance in regard to NOM removal rates during infiltration and chemical flocculation depend on many factors and would be different in other contexts. Also, it is difficult to remove external factors and isolate the studied parameters when working with natural systems.
Other NOM removal methods that were not investigated in this study includes, nanofiltration (NF) membranes and ion exchange (IEX). NF has already been shown to be effective to treat water from Lake Bolmen (Lidén and Persson, 2016). However, NF membranes would result in significantly lower flux than direct precipitation on UF membranes. Furthermore, the membrane area/module in the NF modules are typically lower. Therefore, many more modules would be required, resulting in a very high investment cost and a more complex facility to operate as well as higher operational costs. Ion exchange was another technique for NOM removal that was not investigated due to the inefficiency of removing certain NOM fractions (high MW NOM) (Aydin et al., 2015; Bolto et al., 2002; Croué et al., 1999; Mergen et al., 2008). These fractions of NOM are very prevalent in the water from Lake Bolmen. Futhermore, Vomb VV is situated a long distance from the sea as well as from large scale wastewater treatment plants which complicate the handling of the resin from the ion exchange system.

56
There are always going to be limitations with laboratory scale jar tests when trying to interpret the results for how they might translate to full-scale. The forces the flocs experience when transferring over samples to the disc filter likely differ from that of a full-scale disc filter. Also, it is difficult to translate the volume permeate to full-scale without conducting pilot studies and how frequent the backwash cycles would be. For these reasons, combining chemical flocculation with disc filtration was shown to be possible in bench scale, however, it was never shown if it would be viable in full-scale.
When studying treatment performance of artificial recharge, there are complications with sampling methods and how representative samples are. The obvious issue with well sampling is the interference of natural groundwater and the removal of contaminants. In Paper II, the sampling wells are very close to the basins but collect water about 13 meters below the surface. Because there was an observed difference, it is certain that the wells are collecting infiltrated water. However, it is unknown to what extent. The ratio of collected natural and infiltrated groundwater also fluctuates over time, mostly due to temperature changes. As a result, there are some uncertainties about the removal rates during infiltration. This would also apply to Paper V when looking at overall performances of artificial recharge plants. There were also limitations regarding the measurements of cyanobacterial biomass and the differentiation of the species. Therefore, only an overview of the changes in cyanobacterial composition could be seen.
In Paper III, calculations of operational costs were made based on assumptions related to membrane lifetime. The lifetime of the membrane was based on the CEB frequency which would be different if other source waters or coagulants were used. This would also mean that operational costs would vary. To get a more accurate result of membrane lifetime, tests would have to be conducted over longer periods of time.
Because of the natural variations in the infiltration fields, the treatment performance would vary due to differences in permeability. An implication of this could be that removal rates in other basins with higher permeability might not show as high removal rates of NOM after 50 cm of infiltration. A reason for the variability in the measurements could also be partly explained by differences in installation depths of the samplers. These aspects would need to be taken into consideration if the results would be applied to other WTPs. One limitation the in study arose from an early winter when the water in the sampling tubes froze, stopping the study earlier than planned. However, the study benefited from a dry summer and autumn.
There were also some limitations on what conclusions can be drawn from the survey over the Swedish artificial groundwater recharge plant. The same measurements are not always conducted at every WTP, where most measure COD and only a few measure TOC. Even fewer would measure DOC and UVA254nm for it to be possible

57
to calculate SUVA. The measurement was also often received as annual values. However, it was possible to get an indication on treatment performance based on NOM content in the source water.
8.2 Future research and development The development of Vomb WW has many aspects that would be interesting to investigate. Because the source water from Lake Vomb will still be used in the recharge field, several interesting investigations could be done. One being the need for softening reactors in the future. With water from Lake Vomb, reactors to reduce the hardness of the water have been necessary to limit leaching of copper pipes at the consumer end. With the mixing of the soft water from Lake Bolmen, the need for the softening reactors might be reduced. At the same time, the simultaneous use of water from Lake Vomb could remove the need for stabilizing the water (lime additions) post infiltration. Finding the right mixing ratios will be a point of interest. Another consideration is the mixing of water prior flocculation. Would it be beneficial to mix the two waters to achieve the right flocculation pH or is it more advantageous to coagulate the two waters separately for operational stability and security? Lastly, it might be possible to reduce coagulant dosages knowing it will reduce the water quality prior to infiltration. In this study, it would be interesting to investigate the removal of the different organic fractions when coagulant dosages are decreased. It would seem likely that certain fractions are more affected when coagulant dosages are reduced, and that the fractions that remain might be removed during infiltration. This could be an effect of the different mechanism of coagulation and flocculation at different dosages, i.e. charge neutralisation and sweep coagulation (Bratby, 2016). Another aspect of the treatment process not included in this work was sludge management.
An interesting aspect to consider is biofilm development when new water sources are used for artificial recharge. The results from the column test showed an inadequate removal of NOM from water from Lake Bolmen. It might be possible that the removal rates would increase over time due to changes in the bacterial community. This is also relevant to the infiltration study at Vomb WW (Paper IV). There were no changes observed during the 5-month study, and it would have been interesting to follow development of Basin A.
The field study (Paper IV) showed the early changes in the bacterial community in the infiltrated water during artificial recharge. From what has been shown in the finished well water at Vomb WW (Chan et al., 2016), the bacterial community shifts towards LNA-bacteria. An interesting study would be to investigate at which point surface water becomes groundwater, by studying the changes in fingerprint profiles.
58
An important aspect of securing water resources in the future are the possible effects of climate change. With the predicted increases in NOM in surface waters in the coming decades, there are definitely reasons to be concerned for future water quality (Köhler et al., 2009; Korth et al., 2004). In the case of Lake Bolmen, it would be useful to study the temporal increases in NOM after precipitation events and compare that to predicted changes in precipitation patterns due to climate change.

59
References
Andersson, C.A., Bro, R., 2000. The N-way Toolbox for MATLAB. Chemom. Intell. Lab. Syst. 52, 1–4. https://doi.org/10.1016/S0169-7439(00)00071-X
Asano, T., 2016. Artificial recharge of groundwater. Elsevier. Aydin, A., Whittaker, G., Raison, N., Challacombe, B., Khan, M., 2015. available at www.
sciencedirect. com journal homepage: www. europeanurology. com. Eur. Urol. Suppl. 14.
Beacon Analytical Systems Inc., 2020. Microcystin Tube Kit [WWW Document]. URL https://www.beaconkits.com/microcystin-tube-kit (accessed 8.12.20).
Bolto, B., Dixon, D., Eldridge, R., King, S., 2002. Removal of THM precursors by coagulation or ion exchange. Water Res. 36, 5066–5073.
Bondelind, M., Pettersson, T., Malm, A., Bergstedt, O., 2013. VASS Dricksvatten – uppgifter, nyckeltal och modell för säkert dricksvatten för vattenverk (Dricksvatten). SWWA.
Bratby, J., 2016. Coagulation and flocculation in water and wastewater treatment, Third edit. ed. IWA Publishing.
Bro, R., 1997. PARAFAC. Tutorial and applications. Chemom. Intell. Lab. Syst. 38, 149–171. https://doi.org/10.1016/S0169-7439(97)00032-4
Buckingham, S., Tipping, E., Hamilton-Taylor, J., 2008. Dissolved organic carbon in soil solutions: a comparison of collection methods. Soil Use Manag. 24, 29.
Camper, A.K., 2004. Involvement of humic substances in regrowth. Int. J. Food Microbiol. 92, 355–364.
Carvalho, L., McDonald, C., Hoyos, C. de, Mischke, U., Phillips, G., Borics, G., Poikane, S., Skjelbred, B., Solheim, A.L., Wichelen, J. Van, Cardoso, A.C., 2013. Sustaining recreational quality of European lakes: minimizing the health risks from algal blooms through phosphorus control. J. Appl. Ecol. 50, 315. https://doi.org/10.1111/1365-2664.12059
Chan, S., 2018. Processes governing the drinking water microbiome. Division of Applied Microbiology, Department of Chemistry, Lund University.
Chan, S., Pullerits, K., Riechelmann, J., Persson, K.M., Rådström, P., Paul, C.J., 2018. Monitoring biofilm function in new and matured full-scale slow sand filters using flow cytometric histogram image comparison (CHIC). Water Res. 138, 27–36. https://doi.org/https://doi.org/10.1016/j.watres.2018.03.032

60
Chan, S., Riechelmann, J., Buakhom, P., Pullerits, K., Persson, K.M., Rådström, P., Paul, C.J., 2016. Natural organic matter (NOM) and bacterial communities during artificial infiltration of drinking water., in: IWA Microbial Ecology in Water Engineering & Biofilms Joint Specialist Conferenc.
Chorus, I., Bartram, J., 1999. Toxic Cyanobacteria in Water: A guide to their public health consequences, monitoring and management. World Health Organization. https://doi.org/10.1046/j.1365-2427.2003.01107.x
Collins, M.R., Amy, G.L., Steelink, C., 1986. Molecular weight distribution, carboxylic acidity, and humic substances content of aquatic organic matter: implications for removal during water treatment. Environ. Sci. Technol. 20, 1028–1032.
Collins, M.R., Eighmy, T.T., Fenstermacher, J.M., Spanos, S.K., 1992. Removing Natural Organic Matter by Conventional Slow Sand Filtration. J. Am. Water Works Assoc. 84, 80–90.
Cory, R.M., McKnight, D.M., 2005. Fluorescence Spectroscopy Reveals Ubiquitous Presence of Oxidized and Reduced Quinones in Dissolved Organic Matter. Environ. Sci. Technol. 39, 8142–8149. https://doi.org/10.1021/es0506962
Crittenden, J.C., Trussell, R.R., Hand, D.W., Howe, K.J., Tchobanoglous, G., 2012. MWH’s Water Treatment Principles and Design, 3rd Editio. ed. John Wiley & Sons Inc, Hoboken, NJ, USA.
Croué, J.-P., Violleau, D., Bodaire, C., Legube, B., 1999. Removal of hydrophobic and hydrophilic constituents by anion exchange resin. Water Sci. Technol. 40, 207–214.
Czarniecka, U., 2005. Investigations of infiltration basins at the Vomb Water Plant: a study of possible causes of reduced infiltration capacity. Diss. Geol. Lund Univ.
Dillon, P.J., Gale, I., Contreras, S., Pavelic, P., Evans, R., Ward, J., 2009. Managing aquifer recharge and discharge to sustain irrigation livelihoods under water scarcity and climate change. IAHS-AISH Publ. https://doi.org/Cited By (since 1996) 2\nExport Date 9 July 2012\nSource Scopus
Edzwald, J.K., Tobiason, J.E., 1999. Enhanced Coagulation: US Requirements and a Broader View. Water Sci. Technol. 40, 63–70. https://doi.org/10.2166/wst.1999.0444
Eikebrokk, B., Haaland, S., Jarvis, P., Riise, G., Vogt, R.D., Zahlsen, K., 2018. NOMiNOR: Natural Organic Matter in drinking waters within the Nordic Region, Norwegian Water BA.
Eikebrokk, B., Vogt, R.D., Liltved, H., 2004. NOM increase in Northern European source waters: discussion of possible causes and impacts on coagulation/contact filtration processes. Water Supply 4, 47–54. https://doi.org/10.2166/ws.2004.0060
Eklund, A., Mårtensson, J.A., Bergström, S., Björck, E., , Joel Dahné, L., Lindström, Nordborg, D., Olsson, J., Och, L.S., Sjökvis, E., 2015. Sveriges framtida klimat - Underlag till Dricksvattenutredningen. Swedish Meteorol. Hydrol. Inst.
Engblom, K., Lundh, M., 2006. Microbiological barrier in artificial recharge of ground water – a review. Swedish Water Wastewater Assoc. SWWA.
EPA, 1970. Phosphorus Removal Using Chemical Coagulation and a Continuous Countercurrent Filtration Process. United States Environ. Prot. Agency.

61
Evans, C.D., Monteith, D.T., Cooper, D.M., 2005. Long-term increases in surface water dissolved organic carbon: Observations, possible causes and environmental impacts. Environ. Pollut. 137, 55–71. https://doi.org/https://doi.org/10.1016/j.envpol.2004.12.031
Farrell, C., Hassard, F., Jefferson, B., Leziart, T., Nocker, A., Jarvis, P., 2018. Turbidity composition and the relationship with microbial attachment and UV inactivation efficacy. Sci. Total Environ. 624, 638–647. https://doi.org/https://doi.org/10.1016/j.scitotenv.2017.12.173
Freeman, C., Evans, C.D., Monteith, D.T., Reynolds, B., Fenner, N., 2001. Export of organic carbon from peat soils. Nature 412, 785.
Fröberg, M., Berggren, D., Bergkvist, B., Bryant, C., Mulder, J., 2006. Concentration and fluxes of dissolved organic carbon (DOC) in three Norway spruce stands along a climatic gradient in Sweden. Biogeochemistry 77, 1–23.
Gillberg, L., Lindquist, A., Hansen, B., Karlsson, I., Nordström Enkel, A., Pålsson, A., 2003. About water treatment. Kemira Kemwater, Helsingborg.
Gillespie, S., Lipphaus, P., Green, J., Parsons, S., Weir, P., Juskowiak, K., Jefferson, B., Jarvis, P., Nocker, A., 2014. Assessing microbiological water quality in drinking water distribution systems with disinfectant residual using flow cytometry. Water Res. 65, 224–234. https://doi.org/https://doi.org/10.1016/j.watres.2014.07.029
Goel, S., Hozalski, R.M., Bouwer, E.J., 1995. Biodegradation of NOM: effect of NOM source and ozone dose. J. Am. Water Works Assoc. 87, 90.
Guo, J., Ma, J., 2011. Characterization the NOM and its fractions with respect to their treatability, in: 2011 International Conference on Business Management and Electronic Information. pp. 827–831. https://doi.org/10.1109/ICBMEI.2011.5921093
Hägg, K., 2015. Calcium Chloride as a Co-Coagulant. Hägg, K., Persson, K.M., Persson, T., Zhao, Q., 2018. Artificial recharge plants for
drinking water supply – Groundwork for a manual for operation. Swedish Water Wastewater Assoc. SWWA.
Hansson, G., 2000. Artificial groundwater recharge - A method used in Swedish drinking water supply. Swedish Water Wastewater Assoc. SWWA.
Harrington, G.W., Xagoraraki, I., Assavasilavasukul, P., Standridge, J.H., 2003. Effect of Filtration Conditions on Removal of Emerging waterborne pathogens. J. AWWA 95, 95–104. https://doi.org/10.1002/j.1551-8833.2003.tb10514.x
Huehmer, R., 2016. M53 Microfiltration and Ultrafiltration Membranes for Drinking Water, Second edition, Second edi. ed. American Water Works Association, ISBN: 978-1-58321-971-3.
Huisman, L., Wood, W.E., 1974. Slow sand filtration. World Heal. Organ. Issa, A.A., Abd-Alla, M.H., Ohyama, T., 2014. Nitrogen fixing cyanobacteria: future
prospect. Adv. Biol. Ecol. nitrogen Fixat. 2, 24–48. Izaguirre, G., Hwang, C.J., Krasner, S.W., McGuire, M.J., 1982. Geosmin and 2-
methylisoborneol from cyanobacteria in three water supply systems. Appl. Environ. Microbiol. 43, 708–714. https://doi.org/10.1128/aem.43.3.708-714.1982

62
Jacangelo, J.G., DeMarco, J., Owen, D.M., Randtke, S.J., 1995. Selected processes for removing NOM: An overview. J. / Am. Water Work. Assoc. 87, 64–77. https://doi.org/10.1002/j.1551-8833.1995.tb06302.x
Jarvis, P., 2004. The impact of natural organic matter on floc structure. Jarvis, P., Jefferson, B., Gregory, J., Parsons, S.A., 2005. A review of floc strength and
breakage. Water Res. 39, 3121–3137. https://doi.org/https://doi.org/10.1016/j.watres.2005.05.022
Jokela, P., Eskola, T., Heinonen, T., Tanttu, U., Tyrväinen, J., Artimo, A., 2017. Raw Water Quality and Pretreatment in Managed Aquifer Recharge for Drinking Water Production in Finland. Water, Vol 9, Iss 2, p 138 VO - 9 138. https://doi.org/10.3390/w9020138
Keucken, A., Heinicke, G., Persson, M.K., Köhler, J.S., 2017. Combined Coagulation and Ultrafiltration Process to Counteract Increasing NOM in Brown Surface Water. Water. https://doi.org/10.3390/w9090697
Kleja, D.B., Johansson, P.-O., Skarbinski, J., Gustafsson, J.P., 2009. Reduction of natural organic matter and microorganisms in artificial groundwater recharge – Part 2: Experiments in column and pilot scales with filter sand and iron oxide coated olivine sand. Swedish Water Wastewater Assoc. SWWA.
Koch, C., Fetzer, I., Harms, H., Müller, S., 2013. CHIC—an automated approach for the detection of dynamic variations in complex microbial communities. Cytom. Part A 83A, 561–567. https://doi.org/10.1002/cyto.a.22286
Köhler, S.J., Buffam, I., Seibert, J., Bishop, K.H., Laudon, H., 2009. Dynamics of stream water TOC concentrations in a boreal headwater catchment: Controlling factors and implications for climate scenarios. J. Hydrol. 373, 44–56. https://doi.org/https://doi.org/10.1016/j.jhydrol.2009.04.012
Kolehmainen, R.E., Langwaldt, J.H., Puhakka, J.A., 2007. Natural organic matter (NOM) removal and structural changes in the bacterial community during artificial groundwater recharge with humic lake water. Water Res. 41, 2715–2725.
Korth, A., Fiebiger, C., Bornmann, K., Schmidt, W., 2004. NOM increase in drinking water reservoirs - relevance for drinking water production. Water Supply 4, 55–60. https://doi.org/10.2166/ws.2004.0061
Kruskal, J., 1964. Multidimensional scaling by optimizing goodness of fit to a nonmetric hypothesis. Psychometrika 29, 1–27.
Länsstyrelsen i Skåne Län, 2012. Vombsjön [WWW Document]. Redovis. från Sjödatabasen. URL https://www.lansstyrelsen.se/download/ 18.6ae610001636c9c68e55840/1527064814580/Vombsjön.pdf (accessed 9.25.18).
Länsstyrelsen i Skåne Län, Kristianstads kommun, Nordvästra Skånes vatten och avlopp, Sydvatten AB, VASYD, 2016. Dricksvattenstrategi Skåne - Vattenresurser av regional betydelse för dricksvattenförsörjningen [WWW Document]. URL http://www.lansstyrelsen.se/skane/Sv/miljo-och-klimat/vatten-och-vattenanvandning/dricksvatten/Pages/_index.aspx
Laudon, H., Berggren, M., Ågren, A., Buffam, I., Bishop, K., Grabs, T., Jansson, M., Köhler, S., 2011. Patterns and dynamics of dissolved organic carbon (DOC) in boreal streams: the role of processes, connectivity, and scaling. Ecosystems 14, 880–893.

63
Lautenschlager, K., Hwang, C., Ling, F., Liu, W.-T., Boon, N., Köster, O., Egli, T., Hammes, F., 2014. Abundance and composition of indigenous bacterial communities in a multi-step biofiltration-based drinking water treatment plant. Water Res. 62, 40–52. https://doi.org/https://doi.org/10.1016/j.watres.2014.05.035
Lepistö, A., Kortelainen, P., Mattsson, T., 2008. Increased organic C and N leaching in a northern boreal river basin in Finland. Global Biogeochem. Cycles 22. https://doi.org/10.1029/2007GB003175
Li, J., 2020. Managing Eutrophic Waters in Artificial Recharge Plants: Cyanotoxin risk in Swedish freshwaters. Department of Water Resources Engineering, Lund Institute of Technology, Lund University.
Li, J., Hansson, L.-A., Persson, K.M., 2018. Nutrient control to prevent the occurrence of cyanobacterial blooms in a eutrophic lake in Southern Sweden, used for drinking water supply. Water (Switzerland) 10. https://doi.org/10.3390/w10070919
Li, J., Parkefelt, L., Persson, K.M., Pekar, H., 2017. Improving cyanobacteria and cyanotoxin monitoring in surface waters for drinking water supply. J. Water Secur. 3, 2345–363005. https://doi.org/10.15544/jws.2017.005
Lidén, A., Persson, M.K., 2016. Feasibility Study of Advanced NOM-Reduction by Hollow Fiber Ultrafiltration and Nanofiltration at a Swedish Surface Water Treatment Plant. Water. https://doi.org/10.3390/w8040150
Lindroos, A.-J., Kitunen, V., Derome, J., Helmisaari, H.-S., 2002. Changes in dissolved organic carbon during artificial recharge of groundwater in a forested esker in Southern Finland. Water Res. 36, 4951–4958. https://doi.org/https://doi.org/10.1016/S0043-1354(02)00226-9
Lu, X., Jin, M., Van Genuchten, M.T., Wang, B., 2011. Groundwater Recharge at Five Representative Sites in the Hebei Plain, China. Ground Water. https://doi.org/10.1111/j.1745-6584.2009.00667.x
Matilainen, A., Vepsäläinen, M., Sillanpää, M., 2010. Natural organic matter removal by coagulation during drinking water treatment: A review. Adv. Colloid Interface Sci. 159, 189–197. https://doi.org/https://doi.org/10.1016/j.cis.2010.06.007
Mergen, M.R.D., Jefferson, B., Parsons, S.A., Jarvis, P., 2008. Magnetic ion-exchange resin treatment: Impact of water type and resin use. Water Res. 42, 1977–1988.
Meyn, T., Bahn, A., Leiknes, T.O., 2008. Significance of flocculation for NOM removal by coagulation–ceramic membrane microfiltration. Water Sci. Technol. Water Supply 8, 691–700.
Morris, R.D., Audet, A.-M., Angelillo, I.F., Chalmers, T.C., Mosteller, F., 1992. Chlorination, chlorination by-products, and cancer: a meta-analysis. Am. J. Public Health 82, 955–963.
Murphy, K.R., Stedmon, C.A., Graeber, D., Bro, R., 2013. Fluorescence spectroscopy and multi-way techniques. PARAFAC. Anal. Methods 5, 6557–6566.
O’neil, J.M., Davis, T.W., Burford, M.A., Gobler, C.J., 2012. The rise of harmful cyanobacteria blooms: the potential roles of eutrophication and climate change. Harmful Algae 14, 313–334.
Ødegaard, H., Østerhus, S.W., Pott, B.-M., 2014. Microbial barrier analysis (MBA) -a guideline, Norwegian Water BA.

64
Ødegaard, H., Østerhus, S. W., Melin, E., Eikebrokk, B., 2010. NOM removal technologies – Norwegian experiences. Drink. Water Eng. Sci. 3, 1–9. https://doi.org/10.5194/dwes-3-1-2010
Orihel, D.M., Bird, D.F., Brylinsky, M., Chen, H., Donald, D.B., Huang, D.Y., Giani, A., Kinniburgh, D., Kling, H., Kotak, B.G., 2012. High microcystin concentrations occur only at low nitrogen-to-phosphorus ratios in nutrient-rich Canadian lakes. Can. J. Fish. Aquat. Sci. 69, 1457–1462.
Paerl, H.W., Huisman, J., 2008. Blooms like It Hot. Science (80-. ). 320, 57. https://doi.org/10.1126/science.1155398
Pekar, H., Westerberg, E., Bruno, O., Lääne, A., Persson, K.M., Sundström, L.F., Thim, A.-M., 2016. Fast, rugged and sensitive ultra high pressure liquid chromatography tandem mass spectrometry method for analysis of cyanotoxins in raw water and drinking water—First findings of anatoxins, cylindrospermopsins and microcystin variants in Swedish source wa. J. Chromatogr. A 1429, 265–276.
Pentair, 2018. Pentair X-flow [WWW Document]. URL https://xflow.pentair.com (accessed 11.27.18).
Persson, K.M., 2011. On natural organic matter and lake hydrology in Lake Bolmen, in: Lars Bengtsson – a Water Resource. pp. 127–140.
Persson, M., Haridy, S., Olsson, J., Wendt, J., 2005. Solute transport dynamics by high-resolution dye tracer experiments—image analysis and time moments. Vadose Zo. J. 4, 856–865.
Pott, B.-M., 2015. Förenklad MBA, Mikrobiologisk Barriär Analys. SWWA. Pott, B.-M., Cronberg, N., Annadotter, H., Johnsson, S., Cronberg, G., 2009. Effect of
nitrate addition on algae bloom. Swedish Water Wastewater Assoc. SWWA. Pott, B.-M., Ødegaard, H., 2015. Introduction to microbial risk assessment, MRA. Swedish
Water Wastewater Assoc. SWWA. Prest, E.I., Hammes, F., Kötzsch, S., van Loosdrecht, M.C.M., Vrouwenvelder, J.S., 2013.
Monitoring microbiological changes in drinking water systems using a fast and reproducible flow cytometric method. Water Res. 47, 7131–7142.
Proctor, C.R., Hammes, F., 2015. Drinking water microbiology—from measurement to management. Curr. Opin. Biotechnol. 33, 87–94. https://doi.org/https://doi.org/10.1016/j.copbio.2014.12.014
Qi, M., Chen, J., Sun, X., Deng, X., Niu, Y., Xie, P., 2012. Development of models for predicting the predominant taste and odor compounds in Taihu Lake, China. PLoS One 7, e51976.
R Development Core Team, 2013. R: A language and environment for statistical computing.
Rasilo, T., Ojala, A., Huotari, J., Starr, M., Pumpanen, J., 2015. Concentrations and quality of DOC along the terrestrial–aquatic continuum in a boreal forested catchment. Freshw. Sci. 34, 440–455.

65
Schijven, J.F., Teunis, P.F.M., Rutjes, S.A., Bouwknegt, M., de Roda Husman, A.M., 2011. QMRAspot: A tool for Quantitative Microbial Risk Assessment from surface water to potable water. Water Res. 45, 5564–5576. https://doi.org/https://doi.org/10.1016/j.watres.2011.08.024
Schuh, W.M., 1990. Seasonal variation of clogging of an artificial recharge basin in a northern climate. J. Hydrol. 121, 193–215. https://doi.org/https://doi.org/10.1016/0022-1694(90)90232-M
Sidhu, J.P.S., Toze, S., Hodgers, L., Barry, K., Page, D., Li, Y., Dillon, P., 2015. Pathogen Decay during Managed Aquifer Recharge at Four Sites with Different Geochemical Characteristics and Recharge Water Sources. J. Environ. Qual. 44, 1402–1412. https://doi.org/10.2134/jeq2015.03.0118
Sillanpää, M., 2015. Natural Organic Matter in Water. [Elektronisk resurs] Characterization and Treatment Methods. Butterworth-Heinemann.
Sillanpää, M., Matilainen, A., 2014. NOM removal by coagulation. Nat. Org. matter water Charact. Treat. methods 55.
Sillanpää, M., Ncibi, M.C., Matilainen, A., Vepsäläinen, M., 2018. Removal of natural organic matter in drinking water treatment by coagulation: A comprehensive review. Chemosphere. https://doi.org/10.1016/j.chemosphere.2017.09.113
Singer, P.C., 1999. Humic substances as precursors for potentially harmful disinfection by- products. Water Sci. Technol. 40, 25–30. https://doi.org/10.1016/S0273-1223(99)00636-8
SMHI, 2018. Vattenwebb [WWW Document]. URL https://vattenwebb.smhi.se/modelarea/ (accessed 2.1.18).
Smith, V.H., 1983. Low nitrogen to phosphorus ratios favor dominance by blue-green algae in lake phytoplankton. Science (80-. ). 221, 669–671.
Sprenger, C., Hartog, N., Hernández, M., Vilanova, E., Grützmacher, G., Scheibler, F., Hannappel, S., 2017. Inventory of managed aquifer recharge sites in Europe: historical development, current situation and perspectives. Hydrogeol. J. 25, 1909–1922.
Stefan, C., Ansems, N., 2018. Web-based global inventory of managed aquifer recharge applications. Sustain. Water Resour. Manag. 4, 153–162. https://doi.org/10.1007/s40899-017-0212-6
Sundlöf, B., Kronqvist, L., 1992. Artificial Groundwater Recharge - State of the Art - Evaluation of twenty Swedish Plants. Swedish Water Wastewater Assoc. SWWA.
Swedish Environmental Protection Agency, 2000. Bolmen 2000, vattenkvalitet - En sammanställning av fysikaliska, kemiska och biologiska parametrar i sjön Bolmen 1966-1999. Länsstyrelsen i Jönköpings län.
Swedish Food Agency, 2018a. Cyanotoxins in drinking water [WWW Document]. URL https://www.livsmedelsverket.se/globalassets/publikationsdatabas/rapporter/2018/2018-handbok-dricksvattenrisker-cyanotoxiner-i-dricksvatten.pdf
Swedish Food Agency, 2018b. Important concepts in the field of drinking water [WWW Document]. URL www.slv.se (accessed 8.27.19).

66
Swedish Food Agency, 2001. Statens livsmedelsverks författningssamling - Statens livsmedelsverks föreskrifter om dricksvatten.
SWWA, 2016. The Swedish Water & Wastewater Association, SWWA [WWW Document]. URL http://www.svensktvatten.se/Vattentjanster/Dricksvatten/Ravatten/ (accessed 7.12.17).
SWWA, 2011. Dricksvattenteknik 4 - Efterbehandling och distribution. Swedish Water Wastewater Assoc. SWWA.
Sydvatten AB, 2020. Productionsrapport 2019 [WWW Document]. URL https://sydvatten.se/wp-content/uploads/2020/04/Produktionsrapport-2019.pdf (accessed 8.26.20).
Sydvatten AB, 2019. Annual Report [WWW Document]. URL https://sydvatten.se/wp-content/uploads/2020/04/Sydvatten_Arsredovisning_2019_spread.pdf
Sydvatten AB, 2018. Strategic plan 2018-2022 [WWW Document]. URL https://sydvatten.se/wp-content/uploads/2019/02/ Sydvatten_strategiskplan_2018_.pdf
Sydvatten AB, 2015. Sydvatten - collaborating for public welfare [WWW Document]. URL https://sydvatten.se/wp-content/uploads/2016/02/Sydvatten-in-English.pdf
Tanttu, U., Jokela, P., 2018. Sustainable drinking water quality improvement by managed aquifer recharge in Tuusula region, Finland. Sustain. Water Resour. Manag. 4, 225–235. https://doi.org/10.1007/s40899-017-0198-0
Thurman, E.M., 1985. Organic geochemistry of natural waters., Developments in biogeochemistry: 2. M. Nijhoff.
Tielemans, M.W.M., 2007. Artificial recharge of groundwater in The Netherlands. Water Pract. Technol. 2. https://doi.org/10.2166/wpt.2007.064
Tranvik, L., Jansson, M., 2002. Terrestrial export of organic carbon. Nat. VO - 415 861. Väänänen, J., 2017. Microsieving in municipal wastewater treatment: Chemically
enhanced primary and tertiary treatment. Department of Chemical Engineering, Lund University, ISBN: 91-7422-500-6.
Von Einem, J., 2007. The brownification of lakes. Introductory paper, Department of Ecology. Limnol. Lund Univ.
Water corporation, 2017. Groundwater replenishment [WWW Document]. URL https://www.watercorporation.com.a (accessed 8.24.20).
Westrick, J.A., Szlag, D.C., Southwell, B.J., Sinclair, J., 2010. A review of cyanobacteria and cyanotoxins removal/inactivation in drinking water treatment. Anal. Bioanal. Chem. 397, 1705–1714. https://doi.org/10.1007/s00216-010-3709-5
Weyhenmeyer, G.A., Prairie, Y.T., Tranvik, L.J., 2014. Browning of boreal freshwaters coupled to carbon-iron interactions along the aquatic continuum. PLoS One 9, e88104.
WHO, 2016a. Assessing microbial safety of drinking water: Improving approaches and methods. WHO.
WHO, 2016b. Quantitative microbial risk assessment - Application for water safety management Updated November 2016.

67
Worrall, F., Burt, T.P., 2007. Trends in DOC concentration in Great Britain. J. Hydrol. 346, 81–92.
Xu, H., Paerl, H.W., Qin, B., Zhu, G., Hall, N.S., Wu, Y., 2015. Determining critical nutrient thresholds needed to control harmful cyanobacterial blooms in eutrophic Lake Taihu, China. Environ. Sci. Technol. 49, 1051–1059.
Yahya, M.T., Cluff, C.B., Gerba, C.P., 1993. Virus Removal by Slow Sand Filtration and Nanofiltration. Water Sci. Technol. 27, 445–448. https://doi.org/10.2166/wst.1993.0389
Related Documents


![Artificial Recharge-1 [Compatibility Mode]](https://static.cupdf.com/doc/110x72/577c83f71a28abe054b70306/artificial-recharge-1-compatibility-mode.jpg)

