Modelling urban pollution within the UK scale integrated assessment model, UKIAM Helen ApSimon, Tim Oxley and Marios Valiantis UK Centre for Integrated Assessment Modelling Imperial College London

Modelling urban pollution within the UK scale integrated assessment model, UKIAM Helen ApSimon, Tim Oxley and Marios Valiantis UK Centre for Integrated.
Dec 19, 2015
Welcome message from author
This document is posted to help you gain knowledge. Please leave a comment to let me know what you think about it! Share it to your friends and learn new things together.
Transcript

Modelling urban pollution within the UK scale integrated assessment
model, UKIAM
Helen ApSimon, Tim Oxley and Marios Valiantis
UK Centre for Integrated Assessment Modelling
Imperial College London

UKIAM- a national scale model including urban areas
Modelling urban background concentrations-PPM model
Illustrations for particulate matter PM10
Modelling NO2, and urban ozone deficit
Current developments including roadside concentrations in relation to AQ limit values

ATMOSPHERIC MODELLING:
Imported: EMEP
+ ASAM tool
FRAME(CEH)
PPM(Imperial)
BRUTAL (Imperial)
UK Integrated Assessment Model: UKIAM
UK SOURCES
Projected UK emissions:
NETCEN
ENTEC,CEH
Abatement options and costs
ENTEC
NARSES
SHIPPING
ENTEC
ENVIRONMENTAL CRITERIA:
Ecosystems: CEH
Human health &
Urban air quality
UKIAM->Integrated analysis of either specified scenarios, or optimised selection of abatement options converging to achieve environmental criteria at least cost (Imperial)

PPM receptor oriented model : urban back-ground->UK scale
5 x 5 km grid
Elevated source
Volume source to 100 m
10 m high
Gaussian plume
Uniform over mixing layer
< deposition /depletion >
SUPERIMPOSED BACKGROUND- other sources/imported
ROADSIDE INCREMENT-
BRUTAL model
MODELLING COMPONENTS IN UKIAM for UAQ
Chemical conversion for NO2

k
Stedman (UK NOx data for 1996) 33
Carslaw NOx data for LAQN for 1998 “ “ “ “ 1997 “ “ “ “ 1996
25
26 24
IIASA – PM in London for 2001(background sites only; R2= .9116)
24
PPM model: contribution from home square 5x5 km
29-33
Comparison empirical modelling C= k.E +X
E= emission kT in 5x5km gridsquare, C g/m3

PM10 Modelling
Superimposes:
primary contribution due to UK sources using PPM (PWC 2.2)
+ imported primary PM cont. from EMEP modelling (PWC 0.8 ug.m3)
PLUS secondary PM, SIA
( NB no SOA)
PLUS additional background of 5 to 9 ug/m3 for rural and city populations respectively
(natural, sea salt, road resusp. Intermittent sources)
NB No TEOM correction applied

Urban background PM10 concentrations- London
2000 2020
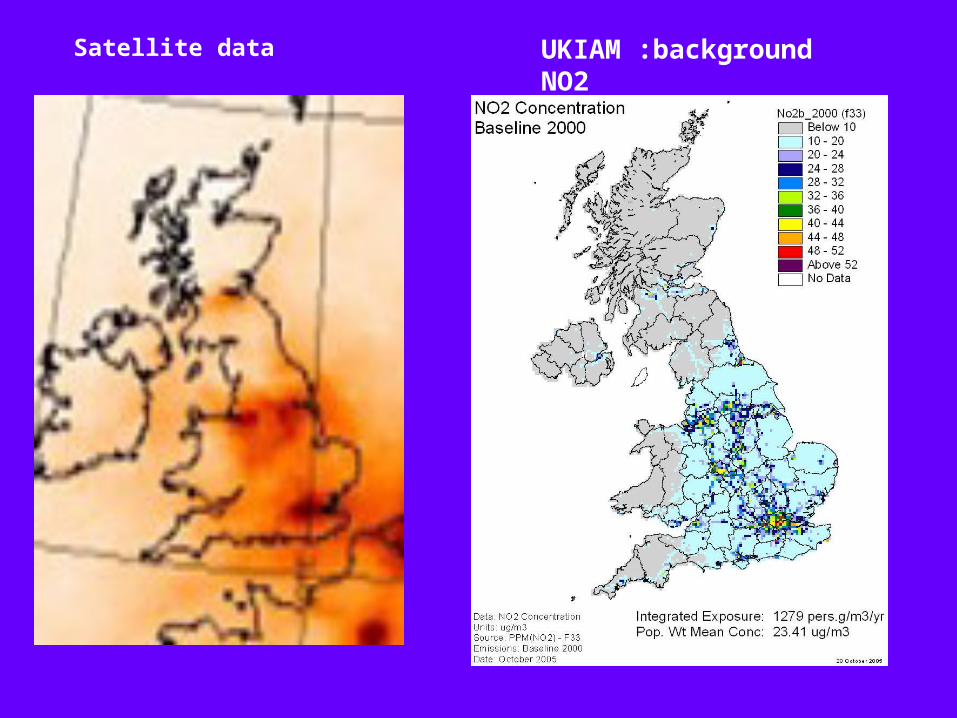
UKIAM :background NO2 Satellite data

Simple treatment chemistry NO, O3, NO2
i) model total NOx = NO + NO2
ii) total oxidant O3b + NOx = O3 + NO2
111) mean rate dissociation ~J[NO2]
____________________________ = F
oxidation NO->NO2 ~ k,[NO], [O3]
If F=1 same as photo-stationary state.
Generates quadratic equation for NO2

Comparison of predicted NO2 by PPM and Jenkin
NNPM with Fit 1 NNPM with Fit 2
Fit 1 & Fit 2 @ 9.48% Pry NO2 & 35.7ppb O3
PPM @ 10% Pry NO2 & 35ppb O3
0
10
20
30
40
0 20 40 60 80 100
NOX ppb
NO2 p
pb
0
10
20
30
40
50
60
0 50 100 150 200 250
NOX ppb
NO2 p
pb
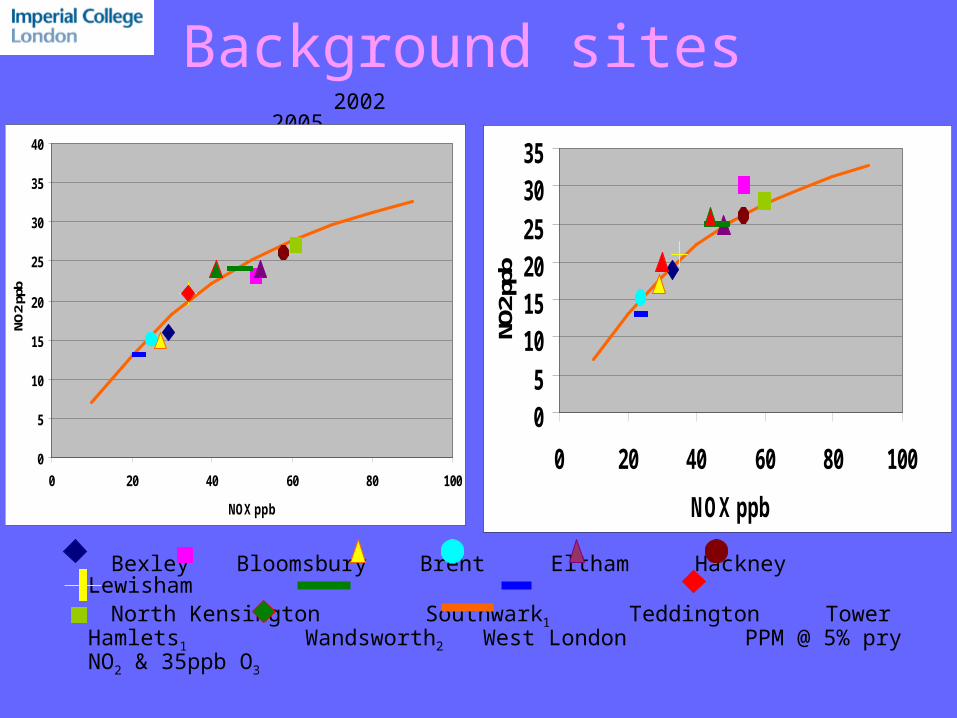
Background sites 2002 2005
Bexley Bloomsbury Brent Eltham Hackney Lewisham North Kensington Southwark1 Teddington Tower Hamlets1
Wandsworth2 West London PPM @ 5% pry NO2 & 35ppb O3
0
5
10
15
20
25
30
35
40
0 20 40 60 80 100
NOX ppb
NO2
ppb
05
101520253035
0 20 40 60 80 100
NOX ppbNO
2 ppb

Reducing urban NOx emissions -> local increase in urban ozone concentrations.
Estimate from change in secondary NO2 and corresponding ozone deficit

Urban ozone decrement over London: 2000 and 2020
2000 2020
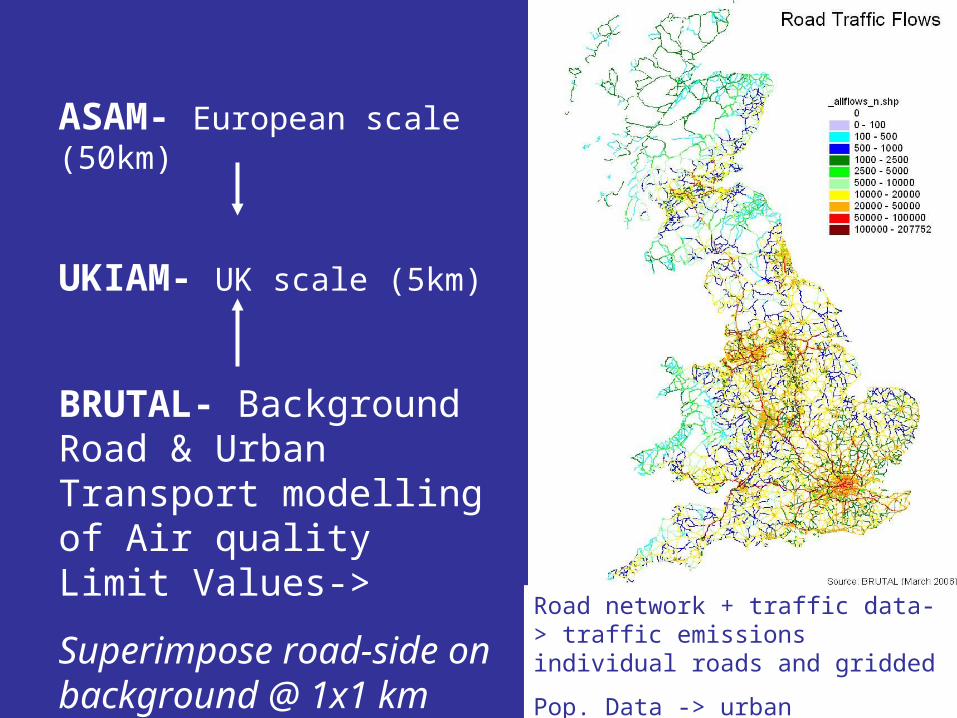
ASAM- European scale (50km)
UKIAM- UK scale (5km)
BRUTAL- Background Road & Urban Transport modelling of Air quality Limit Values->
Superimpose road-side on background @ 1x1 km
Road network + traffic data-> traffic emissions individual roads and gridded
Pop. Data -> urban areas/roads (canyons etc)
Related Documents