Modelling the partially unknown distribution of wall lizards (Podarcis) in North Africa: ecological affinities, potential areas of occurrence, and methodological constraints A. Kaliontzopoulou, J.C. Brito, M.A. Carretero, S. Larbes, and D.J. Harris Abstract: Species distribution modelling (SDM) is a powerful tool to investigate various biological questions with a spa- tial component, but is also sensitive to presence-data characteristics, particularly data precision and clustering. Here, we in- vestigate the effect of these two factors on SDM using Maxent as the modelling technique and wall lizards (genus Podarcis Wagler, 1830) from North Africa as a model system. Podarcis are not ubiquitous in Africa as they are in Europe, but their ecological and distributional characteristics in this area are poorly known. Our results show that the most impor- tant environmental factors related to the distribution of this genus in North Africa are humidity, habitat type, and tempera- ture. The areas of potential distribution predicted by models based on data sets with different precision and clustering characteristics show high relatedness to coastal areas and mountain ranges and extend to areas were presence records for these lizards are lacking. Our comparison of models based on different data sets indicates that finer scale models, even if based on fewer presence locations, outperform coarser scale ones. Data clustering does not have a negative effect on model performance, but is rather overcome by sample-size effects. Similar approaches may be of general application to other stenoic species for which available locations are scarce in comparison with the extension of the study area. Re ´sume ´: La mode ´lisation de la re ´partition des espe `ces (SDM) est un outil puissant pour e ´tudier diverses questions biolo- giques a ` composante spatiale, mais elle est sensible aux caracte ´ristiques des donne ´es, particulie `rement leur pre ´cision et leur regroupement. Nous examinons ici les effets de ces deux facteurs sur la SDM en utilisant Maxent comme me ´thode de mode ´lisation et des le ´zards des murailles (le genre Podarcis Wagler, 1830) d’Afrique du Nord comme syste `me mode `le. Les Podarcis ne sont pas ubiquistes en Afrique comme ils le sont en Europe, mais les caracte ´ristiques de leur re ´partition et de leur e ´cologie dans cette re ´gion restent mal connues. Nos re ´sultats montrent que les facteurs du milieu les plus impor- tants pour expliquer la re ´partition de ce genre en Afrique du Nord sont l’humidite ´, le type d’habitat et la tempe ´rature. Les zones de re ´partition potentielle pre ´dites par les mode `les d’apre `s des bases de donne ´es pre ´sentant des pre ´cisions et des car- acte ´ristiques de regroupement diverses montrent une forte affinite ´ avec les re ´gions co ˆtie `res et les chaı ˆnes montagneuses et comprennent des zones ou ` il n’existe pas actuellement de confirmation de la pre ´sence de ces le ´zards. Nos comparaisons des mode `les e ´labore ´s a ` partir de diffe ´rentes bases de donne ´es indiquent que les mode `les a `e ´chelle plus fine, me ˆme s’ils se basent sur moins de localite ´s de pre ´sence, sont plus performants que les mode `les a `e ´chelle plus grossie `re. Le regroupement des donne ´es n’a pas d’effet ne ´gatif sur la performance du mode `le, car cet effet est oblite ´re ´ par les effets de la taille de l’e ´chantillon. Des approches semblables pourraient e ˆtre d’application ge ´ne ´rale pour l’e ´tude d’autres espe `ces ste ´noı ¨ques pour lesquelles il existe peu de donne ´es de re ´partition, compte tenu de l’e ´tendue de la zone d’e ´tude. [Traduit par la Re ´daction] Introduction Species distribution modelling (SDM) is rapidly being in- corporated to an increasing number of biological applica- tions (Arau ´jo and Guisan 2006) as an innovative tool to investigate ecological and evolutionary questions and to en- hance conservation (Elith et al. 2006). SDM tries to evaluate how a set of environmental factors influence a species’ dis- tribution. Therefore, it provides an estimate of the species’ fundamental niche (Hutchinson 1957), which can be used to predict its potential geographical distribution. In practice, in- formation on a number of environmental parameters is com- bined to known locations of presence and a model is fitted Received 9 December 2007. Accepted 28 May 2008. Published on the NRC Research Press Web site at cjz.nrc.ca on 22 August 2008. A. Kaliontzopoulou. 1 Centro de Investigac ¸a ˜o em Biodiversidade e Recursos Gene ´ticos (CIBIO), Campus Agra ´rio de Vaira ˜o, 4485- 661 Vaira ˜o, Portugal; Departament de Biologia Animal (Vertebrats), Facultat de Biologia, Universitat de Barcelona, Avinguda Diagonal, 645, 08028 Barcelona, Spain. J.C. Brito, M.A. Carretero, and D.J. Harris. Centro de Investigac ¸a ˜o em Biodiversidade e Recursos Gene ´ticos (CIBIO), Campus Agra ´rio de Vaira ˜o, 4485-661 Vaira ˜o, Portugal. S. Larbes. Centro de Investigac ¸a ˜o em Biodiversidade e Recursos Gene ´ticos (CIBIO), Campus Agra ´rio de Vaira ˜o, 4485-661 Vaira ˜o, Portugal; De ´partement de Biologie, Faculte des Sciences Biologiques et Agronomiques, Universite ´ M. Mammeri, Tizi-Ouzou, Algeria. 1 Corresponding author (e-mail: [email protected]). 992 Can. J. Zool. 86: 992–1001 (2008) doi:10.1139/Z08-078 # 2008 NRC Canada

Welcome message from author
This document is posted to help you gain knowledge. Please leave a comment to let me know what you think about it! Share it to your friends and learn new things together.
Transcript
Modelling the partially unknown distribution ofwall lizards (Podarcis) in North Africa: ecologicalaffinities, potential areas of occurrence, andmethodological constraints
A. Kaliontzopoulou, J.C. Brito, M.A. Carretero, S. Larbes, and D.J. Harris
Abstract: Species distribution modelling (SDM) is a powerful tool to investigate various biological questions with a spa-tial component, but is also sensitive to presence-data characteristics, particularly data precision and clustering. Here, we in-vestigate the effect of these two factors on SDM using Maxent as the modelling technique and wall lizards (genusPodarcis Wagler, 1830) from North Africa as a model system. Podarcis are not ubiquitous in Africa as they are in Europe,but their ecological and distributional characteristics in this area are poorly known. Our results show that the most impor-tant environmental factors related to the distribution of this genus in North Africa are humidity, habitat type, and tempera-ture. The areas of potential distribution predicted by models based on data sets with different precision and clusteringcharacteristics show high relatedness to coastal areas and mountain ranges and extend to areas were presence records forthese lizards are lacking. Our comparison of models based on different data sets indicates that finer scale models, even ifbased on fewer presence locations, outperform coarser scale ones. Data clustering does not have a negative effect onmodel performance, but is rather overcome by sample-size effects. Similar approaches may be of general application toother stenoic species for which available locations are scarce in comparison with the extension of the study area.
Resume : La modelisation de la repartition des especes (SDM) est un outil puissant pour etudier diverses questions biolo-giques a composante spatiale, mais elle est sensible aux caracteristiques des donnees, particulierement leur precision etleur regroupement. Nous examinons ici les effets de ces deux facteurs sur la SDM en utilisant Maxent comme methode demodelisation et des lezards des murailles (le genre Podarcis Wagler, 1830) d’Afrique du Nord comme systeme modele.Les Podarcis ne sont pas ubiquistes en Afrique comme ils le sont en Europe, mais les caracteristiques de leur repartitionet de leur ecologie dans cette region restent mal connues. Nos resultats montrent que les facteurs du milieu les plus impor-tants pour expliquer la repartition de ce genre en Afrique du Nord sont l’humidite, le type d’habitat et la temperature. Leszones de repartition potentielle predites par les modeles d’apres des bases de donnees presentant des precisions et des car-acteristiques de regroupement diverses montrent une forte affinite avec les regions cotieres et les chaınes montagneuses etcomprennent des zones ou il n’existe pas actuellement de confirmation de la presence de ces lezards. Nos comparaisonsdes modeles elabores a partir de differentes bases de donnees indiquent que les modeles a echelle plus fine, meme s’ils sebasent sur moins de localites de presence, sont plus performants que les modeles a echelle plus grossiere. Le regroupementdes donnees n’a pas d’effet negatif sur la performance du modele, car cet effet est oblitere par les effets de la taille del’echantillon. Des approches semblables pourraient etre d’application generale pour l’etude d’autres especes stenoıquespour lesquelles il existe peu de donnees de repartition, compte tenu de l’etendue de la zone d’etude.
[Traduit par la Redaction]
Introduction
Species distribution modelling (SDM) is rapidly being in-corporated to an increasing number of biological applica-tions (Araujo and Guisan 2006) as an innovative tool toinvestigate ecological and evolutionary questions and to en-hance conservation (Elith et al. 2006). SDM tries to evaluate
how a set of environmental factors influence a species’ dis-tribution. Therefore, it provides an estimate of the species’fundamental niche (Hutchinson 1957), which can be used topredict its potential geographical distribution. In practice, in-formation on a number of environmental parameters is com-bined to known locations of presence and a model is fitted
Received 9 December 2007. Accepted 28 May 2008. Published on the NRC Research Press Web site at cjz.nrc.ca on 22 August 2008.
A. Kaliontzopoulou.1 Centro de Investigacao em Biodiversidade e Recursos Geneticos (CIBIO), Campus Agrario de Vairao, 4485-661 Vairao, Portugal; Departament de Biologia Animal (Vertebrats), Facultat de Biologia, Universitat de Barcelona, Avinguda Diagonal,645, 08028 Barcelona, Spain.J.C. Brito, M.A. Carretero, and D.J. Harris. Centro de Investigacao em Biodiversidade e Recursos Geneticos (CIBIO), CampusAgrario de Vairao, 4485-661 Vairao, Portugal.S. Larbes. Centro de Investigacao em Biodiversidade e Recursos Geneticos (CIBIO), Campus Agrario de Vairao, 4485-661 Vairao,Portugal; Departement de Biologie, Faculte des Sciences Biologiques et Agronomiques, Universite M. Mammeri, Tizi-Ouzou, Algeria.
1Corresponding author (e-mail: [email protected]).
992
Can. J. Zool. 86: 992–1001 (2008) doi:10.1139/Z08-078 # 2008 NRC Canada
to describe the requirements of the target species (Andersonet al. 2003). Recently, numerous statistical approaches havebeen developed for this purpose, including envelope models,regression analysis, factor analysis, genetic algorithms, andmaximum entropy (reviewed by Elith et al. 2006).
However, all these techniques present inherent problems.Sample size (Stockwell and Peterson 2002; Elith et al.2006; Hernandez et al. 2006), bias in data distribution(Guisan et al. 2006; Segurado et al. 2006), and geographicaccuracy of the records (Hernandez et al. 2006) may affectmodelling performance. Also, the question of scale is inher-ent to all modelling techniques (Huettmann and Diamond2006; Guisan et al. 2007). In practical terms, all the abovefactors are inter-related and involve decision-making by theinvestigator. For example, obvious trade-offs exist betweensample size and clustering of records (Segurado et al. 2006)and one has to choose between a complete but clustered or arandom but reduced data set, since clustered field observa-tions will usually result in spatially autocorrelated data. An-other dilemma concerns the use of published data andspecies records from collections. Although field observa-tions can now be precisely referenced using Global Position-ing Systems (GPS), species records published in atlases,scientific and naturalistic journals, or obtained from museumcollections often fail to have the desired geographic preci-sion (Graham et al. 2004; Rowe 2005). This constrains thegeographic scale of the analysis and a decision has to bemade between many records of low precision or fewer re-cords of high precision. Obviously, these questions are espe-cially relevant for species with fragmented or partiallyunknown distributions, as well as for species occurring inconflictive areas of difficult access.
Because of the geographically asymmetrical knowledgeon distribution and their complex evolutionary history, Po-darcis from North Africa constitute an interesting modelsystem to investigate both methodological and biologicalquestions related to SDM. Wall lizards of the genus Podar-cis Wagler, 1830 are members of the family Lacertidae, dis-tributed around the Mediterranean basin. They are known tobe ecological generalists, occupying a wide variety of habi-tats (Arnold 1987). Although detailed distributional andcomprehensive ecological data exist for most European spe-cies of the genus, this is not the case for North Africa. Inthis region the genus attains the southern limit of its distri-bution, ranging from Morocco through northern Algeria,and reaching west to northwestern Tunisia (Fig. 1A).Although detailed distribution data are available for Mo-rocco (Bons and Geniez 1996), Algeria is practically unex-plored (but see Chirio and Blanc 1997) and few recordsexist for Tunisia (Blanc 1979).
This situation is further obscured by the taxonomic com-plexity that characterizes Iberian and North African Podar-cis lizards (i.e., the species complex of Podarcis hispanicaSteindachner, 1870), owing to the lack of concordance be-tween current taxonomy and phylogenetic relationships(Harris and Sa-Sousa 2002; Harris et al. 2002; Pinho et al.2007). Members of the genus from Morocco and southernSpain were recently re-elevated to specific status, as Podar-cis vaucheri (Boulenger, 1905) (Busack et al. 2005). How-ever, since no populations from Algeria and Tunisia wereanalysed, the remaining North African Podarcis are still
maintained under P. hispanica sensu lato. Another studyhas indicated a more complex situation and suggested thattaxonomic re-evaluation is needed, since at least two line-ages are present in the area (Pinho et al. 2007). Togetherwith the difficulties related to fieldwork in Algeria, this hashindered a clear definition of the southern limits of the dis-tribution of this group. SDM is an indirect approach to re-solving such questions and can be efficiently applied toinfer the ecological affinities and distribution limits of thisgroup in North Africa. The potential existence of more thanone phylogenetic entity in the area does not invalidate theuse of SDM. When, as in the case of North African Podar-cis, the physiology of such entities is phylogenetically con-served (Amaral and Carretero 2005; Carretero et al. 2006)and their ranges are parapatric (Pinho et al. 2007), their jointdistributions can be efficiently modelled.
In this study, we use maximum entropy modelling to in-vestigate the distribution of Podarcis lizards in North Africabased on geographic distributional data and environmentalpredictor variables, with the following objectives: (i) to de-termine which environmental factors are correlated with thedistribution of these lizards in the southern limit of the dis-tribution of the genus, (ii) to identify potential areas of oc-currence in the study area by applying models based onthose factors, and (iii) to evaluate the effect of commonmethodological restrictions, namely data precision and clus-tering of presence records, on the quality of such models.
Materials and methods
Study area and presence recordsThe study area encompasses the overall range of Podarcis
in North Africa (Fig. 1A). Records for the species were col-lected during fieldwork and exact coordinates were markedwith GPS. Moreover, published localities of occurrence ofPodarcis in the study area (Blanc 1979; Bons and Geniez1996; Chirio and Blanc 1997) were located at a 10 km �10 km scale. Because of the uncertainty of precision of pub-lished data, these localities could not be considered at a fi-ner geographic scale. We used zone 31N of the Worlduniversal transverse mercator (UTM) grid, which is the cen-tral zone of the study area, and projected data from all pub-lished localities onto this grid. Data sets were reduced to onerecord per cell for each geographic scale.
Data sets examinedTo examine the effect of data precision and data cluster-
ing on the performance of Maxent modelling, we used fouralternative data sets (Figs. 1B–1D). As mentioned above, weconsidered two initial data sets: one with exact records at anapproximately 1 km2 (30 s � 30 s) geographic scale (1ALL)and another including all available records at a 10 km2 scale(10ALL). Both data sets were examined for clustering usingthe nearest neighbour index (NNI; spatial statistics toolboxin ArcMap version 9.2; Environmental Systems Research In-stitute, Inc. 2006). NNI assesses the degree of clustering ofthe data and is the ratio of the observed distance betweenpoints divided by the expected distance for a random distri-bution. For NNI = 1, the distribution is random; for NNI >1, the distribution is dispersed; for NNI < 1, the distributionis clustered (Cliff and Ord 1973). Since the initial data sets
Kaliontzopoulou et al. 993
# 2008 NRC Canada
showed clustering, we eliminated clustered points using arandom interactive process until the distribution did not sig-nificantly differ from random, i.e., the NNI was not statisti-cally different from 1. This procedure resulted in tworeduced data sets (1RED and 10RED, respectively, withoutautocorrelated points; Table 1).
Modelling techniquesWe used maximum entropy modeling of species geo-
graphic distributions (Maxent version 3.0; available fromhttp://www.cs.princeton.edu/~schapire/maxent [accessed 20July 2007]) with default parameters and partitioned the datato training and test samples (80% and 20% of presencepoints, respectively, i.e., Anderson et al. 2003). We choseMaxent because it has been shown to perform better than
other established methods, among both presence-only (Bio-clim, Domain) and presence–absence (GAM, GLM, GARP)techniques, particularly with small sample sizes (Elith et al.2006; Hernandez et al. 2006; Phillips et al. 2006). Moreover,Maxent presents several advantages (see Phillips et al. 2006;Phillips and Dudık 2008), the most important of which (atleast in terms of experimental design and data availability)is that it admits both continuous and categorical predictorvariables and it can be very effective with a relatively smallnumber of presence records (Pearson et al. 2007).
Maxent modelling estimates the potential distribution of aspecies by finding the distribution of maximum entropy (i.e.,closest to uniform), with the constraint that the expectedvalue of each predictor variable under this estimated distri-bution has to match its empirical average, i.e., the mean
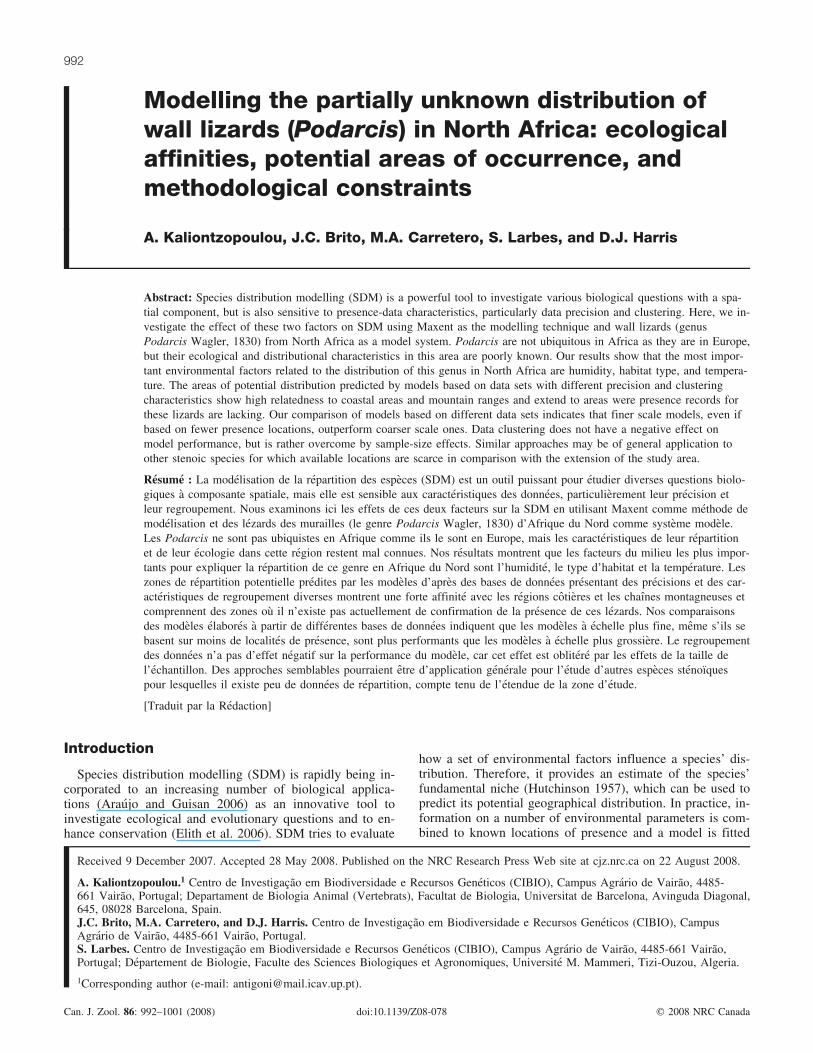
Fig. 1. (A) Location of the study area and (B–E) presence data sets used. (B) 1 km2 scale, all data; (C) 1 km2 scale, non-autocorrelated data;(D) 10 km2 scale, all data; (E) 10 km2 scale, non-autocorrelated data. The shaded area represents the mask used to model the potentialdistribution of wall lizards (genus Podarcis).
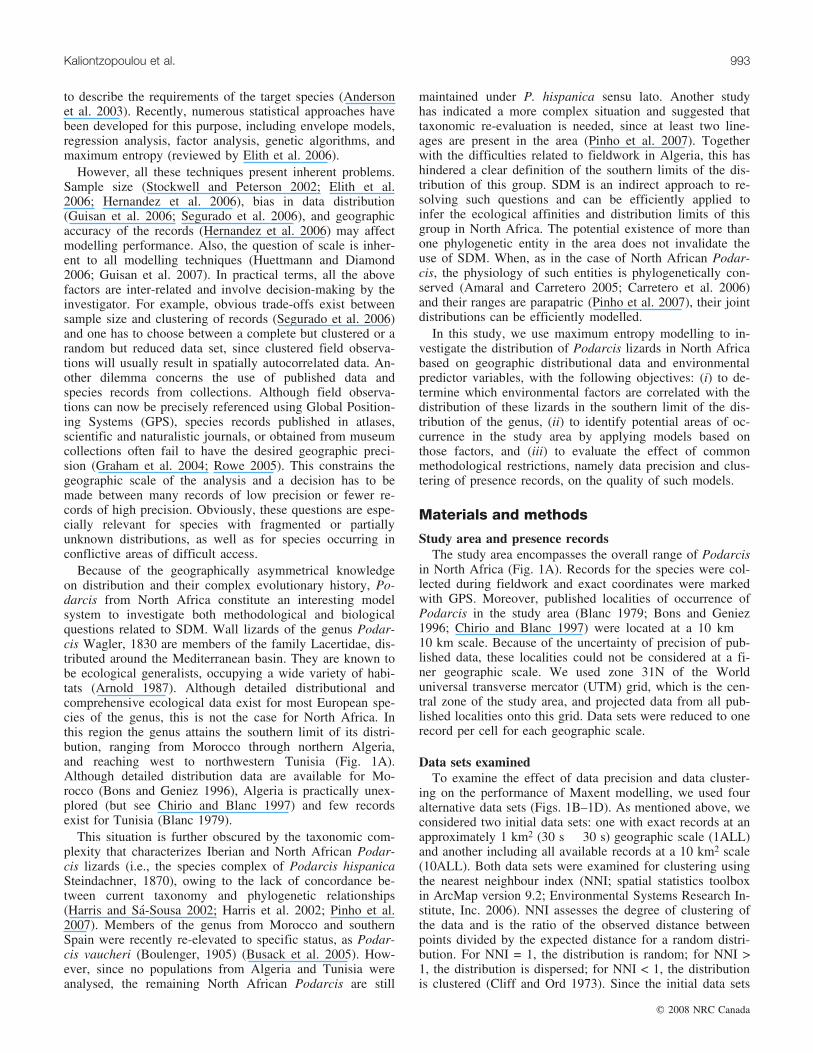
Table 1. Results of the nearest neighbour index (NNI) analysis.
Data set nObserved meandistance
Expected meandistance NNI Z score
1ALL 185 0.061 0.239 0.255 –19.39 � SD10ALL 243 14.478 30.154 0.480 –15.50 � SD1RED 34 0.473 0.548 0.863 –1.53 � SD10RED 64 51.100 58.559 0.873 –1.95 � SD
Note: n is the number of sampling points and the Z score is the statistic value for testing thenull hypothesis of a random distribution of points, expressed as a multiple of standard devia-tions (SD). The Z-score critical values for significance of a = 0.05 are Z = ±1.96 SD. See Ma-terial and methods for data set codes. Distances are in decimal-degrees for data sets at the1 km scale, while in kilometres for data sets at the 10 km scale.
994 Can. J. Zool. Vol. 86, 2008
# 2008 NRC Canada
value of a random set of points sampled from the distribu-tion in question (Phillips et al. 2004, 2006; Phillips and Du-dık 2008). This is achieved through an iterative algorithm,which begins with a uniform probability distribution withzero gain. The gain is a measure of likelihood of the sam-ples and it expresses how much higher is the average samplelikelihood compared with that of a random backgroundpixel. The algorithm sequentially updates the weights of pre-dictor variables until it converges to the optimum potentialdistribution and the gain of the final model can be inter-preted as a measure of how much better the predicted distri-bution fits the sample points compared with a theoreticaluniform distribution (Phillips et al. 2004, 2006; Phillips andDudık 2008).
Different models were tested with receiver operating char-acteristics (ROC) plots. ROC curves plot true-positive rateagainst false-positive rate (Phillips et al. 2004) and the areaunder the curve (AUC) was used as a measure of the overallfit of the model.
Environmental predictor variablesWe considered a set of 10 uncorrelated (r < 0.8) environ-
mental factors (i.e., ecogeographical variables, EGVs) thatwere selected to describe habitat variability. Three types ofEGVs were considered (Table 2): (1) topographical, i.e., al-titude and slope derived from a digital elevation model(USGS 2004); (2) ecological, i.e., a land-cover EGV derivedfrom satellite data (GLC 2003); (3) climatic, i.e., seven cli-mate grids at approximately 1 km2 precision (30 s � 30 s)describing precipitation and temperature means, extremes,and variability (Worldclim version 1.4; Hijmans et al.2005). EGVs were all continuous, except for land cover,which was categorical (Table 2). For 10 km2 models, theresolution of all EGVs was decreased to a grid cell size of10 km2 to match the precision of published species records.
The importance of each EGV in explaining the observeddistribution was evaluated by jacknife analysis of the AUCwith training and test data. For this purpose, Maxent sequen-tially excludes one EGV and creates a model with the re-maining. This way it determines the AUC that is lost byexclusion of that particular EGV and estimates how muchinformation that EGV has which is not contained in others.Additionally, to evaluate how much information that EGVcontains on its own, Maxent creates models consideringeach EGV individually by fixing the rest to their meanvalue. To simultaneously assess both measures of variableimportance and incorporate information from different mod-els, we examined the scatter plot of ‘‘mean individual AUC’’(the mean AUC of models with a single EGV along alterna-tive data sets) vs. ‘‘mean AUC loss’’ (the mean AUC lostwhen that EGV was excluded from the model, along alterna-tive data sets).
Response to predictor variablesTo investigate the precise dependence of the distribution
observed on individual environmental factors, we producedunivariate models. This is necessary because the correlationbetween predictor variables might produce spurious resultswhen examining all the variables together (Phillips et al.2006). Consequently, we produced Maxent models witheach of the five most important variables (individualAUC > 0.75) separately, using the four alternative data sets.This allowed us to obtain response curves that describe therelation between the probability of occurrence of Podarcisin the study area and the most important environmental fac-tors.
Predicting potential areas of occurrenceTo integrate information provided by both models at each
geographic scale, we combined predictions to generate an
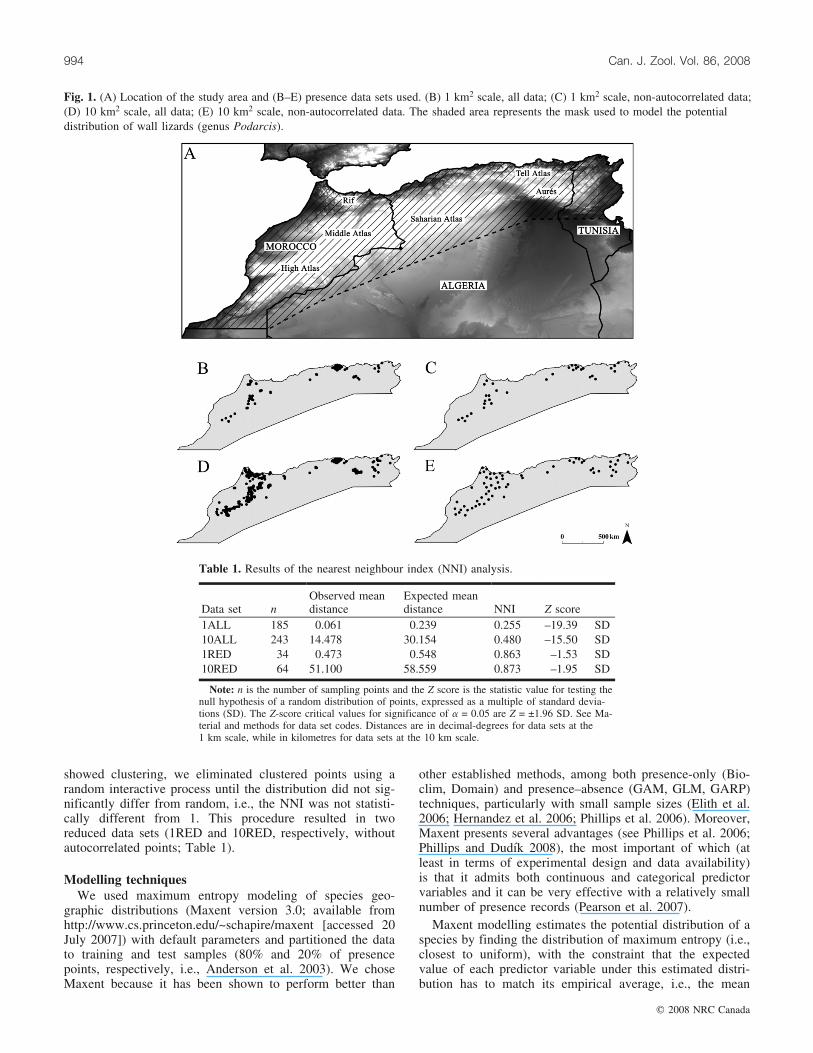
Table 2. Environmental variables used to model the distribution of Podarcis lizards in North Africa.
Variable (unit) Ranges and classes Code SourceAltitude (m above sea level) 0–4016 ALT USGS 2004Slope (%) 0–36.22 SLOPE USGS 2004Land cover 1. Lowland evergreen forest LANDCOV GLC 2003
2. Submontane and montane forest3. Humid areas4. Closed deciduous forest5. Open deciduous shrubland6. Sparse grassland7. Croplans8. Sandy desert and dunes9. Stony desert10. Bare rock11. Salines12. Water bodies13. Cities
Annual precipitation (mm) 27–1432 ANN_PR Hijmans et al. 2005Precipitation in the driest month (mm) 0–29 PR_DRY Hijmans et al. 2005Precipitation seasonality (mm) 19–110 PR_SEAS Hijmans et al. 2005Annual mean temperature (8C) 1.5–24.3 ANN_X_T Hijmans et al. 2005Temperature annual range (8C) 10.9–42.3 T_ANN_RNG Hijmans et al. 2005Minimum temperature of coldest month (8C) –15 to 13.3 TMN_COLD Hijmans et al. 2005Maximum temperature of warmest month (8C) 22.2–46.7 TMX_WARM Hijmans et al. 2005
Kaliontzopoulou et al. 995
# 2008 NRC Canada
ensemble prediction (Araujo and New 2007). For this pur-pose, we attributed to each cell of the study area the meanvalue of the probability calculated for this cell by both mod-els. Predictions are given in the logistic format of Maxent,the value of each cell representing the exponential of the en-tropy of its raw distribution. This logistic probability can beinterpreted as predicted probability of presence, rangingfrom 0 to 1.
Results
Model performanceAll models performed very well and closely fitted the
presence points of Podarcis in the study area, as suggestedby both training and test AUC values (Table 3), which wereabove 0.9 for all the training data sets except for 10REDwith a training AUC of 0.8656. An examination of bothtraining and test AUCs for the four models built (Table 3)revealed the existence of three sets of models: with bothtraining and test AUCs below 0.9 (10RED), with trainingAUC above 0.9 but test AUC below 0.9 (1RED, 10ALL),and with both training and test AUCs above 0.9 (1ALL).Although differences between the models in terms of AUCare minor, the model that best predicts occurrence of thespecies in presence areas is 1ALL.
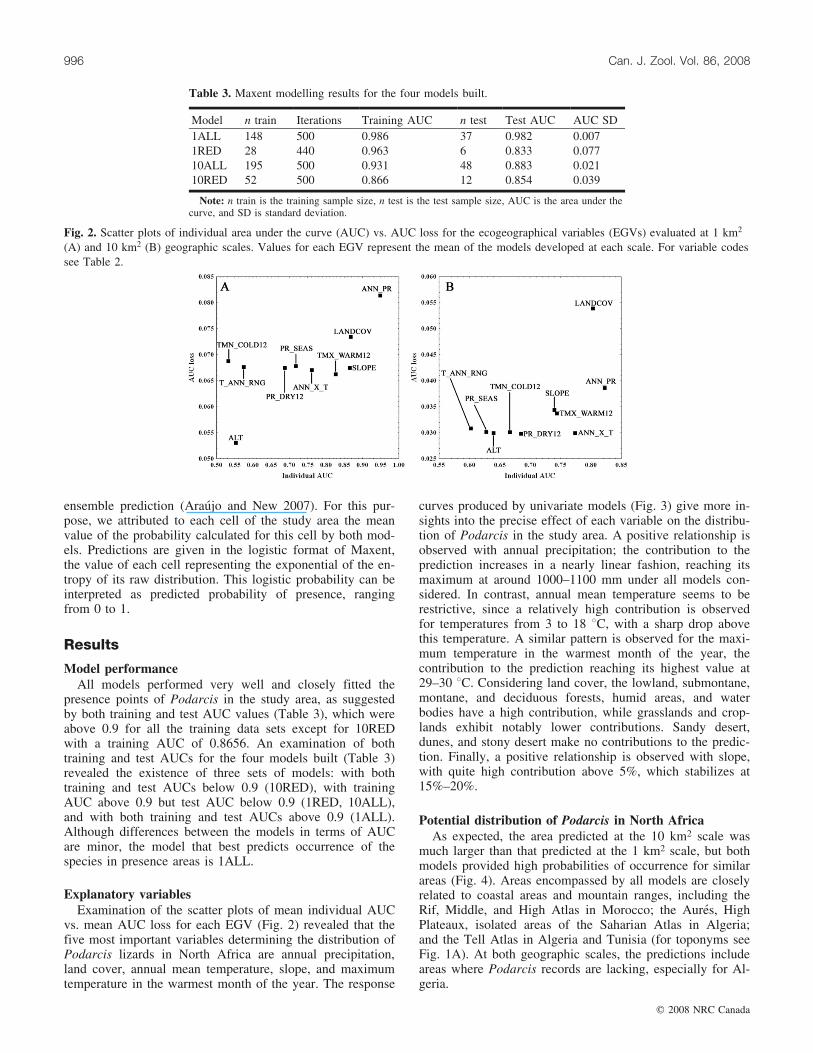
Explanatory variablesExamination of the scatter plots of mean individual AUC
vs. mean AUC loss for each EGV (Fig. 2) revealed that thefive most important variables determining the distribution ofPodarcis lizards in North Africa are annual precipitation,land cover, annual mean temperature, slope, and maximumtemperature in the warmest month of the year. The response
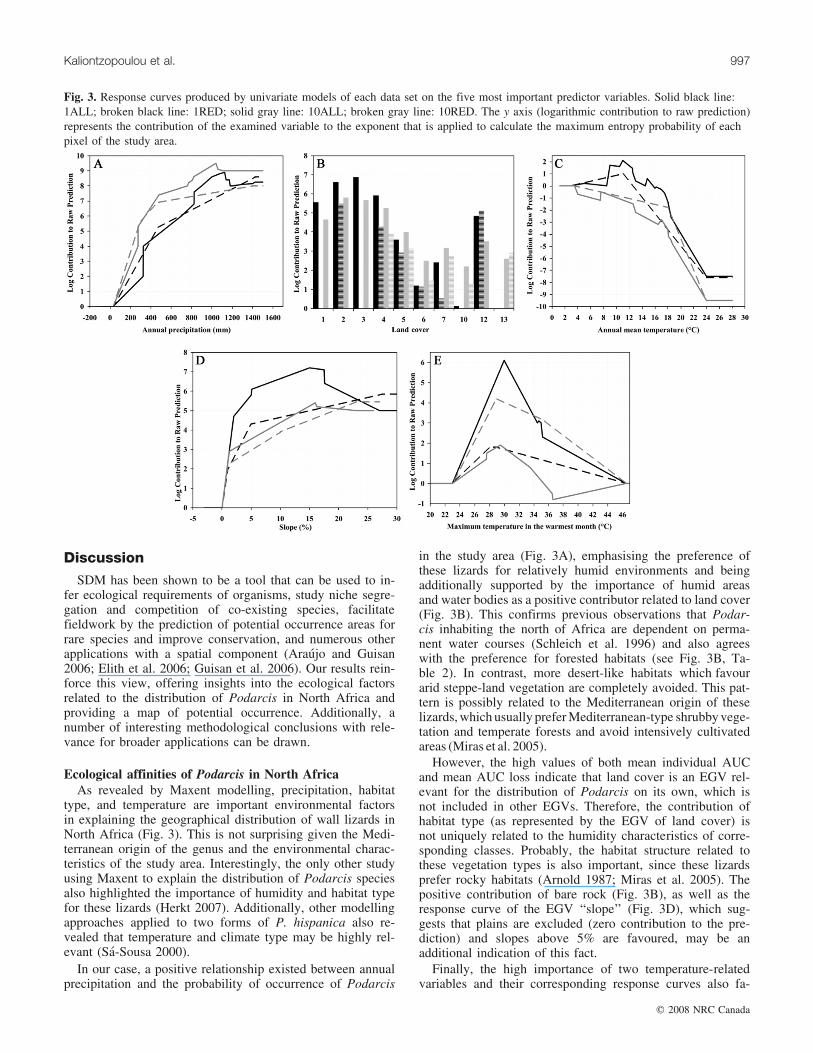
curves produced by univariate models (Fig. 3) give more in-sights into the precise effect of each variable on the distribu-tion of Podarcis in the study area. A positive relationship isobserved with annual precipitation; the contribution to theprediction increases in a nearly linear fashion, reaching itsmaximum at around 1000–1100 mm under all models con-sidered. In contrast, annual mean temperature seems to berestrictive, since a relatively high contribution is observedfor temperatures from 3 to 18 8C, with a sharp drop abovethis temperature. A similar pattern is observed for the maxi-mum temperature in the warmest month of the year, thecontribution to the prediction reaching its highest value at29–30 8C. Considering land cover, the lowland, submontane,montane, and deciduous forests, humid areas, and waterbodies have a high contribution, while grasslands and crop-lands exhibit notably lower contributions. Sandy desert,dunes, and stony desert make no contributions to the predic-tion. Finally, a positive relationship is observed with slope,with quite high contribution above 5%, which stabilizes at15%–20%.
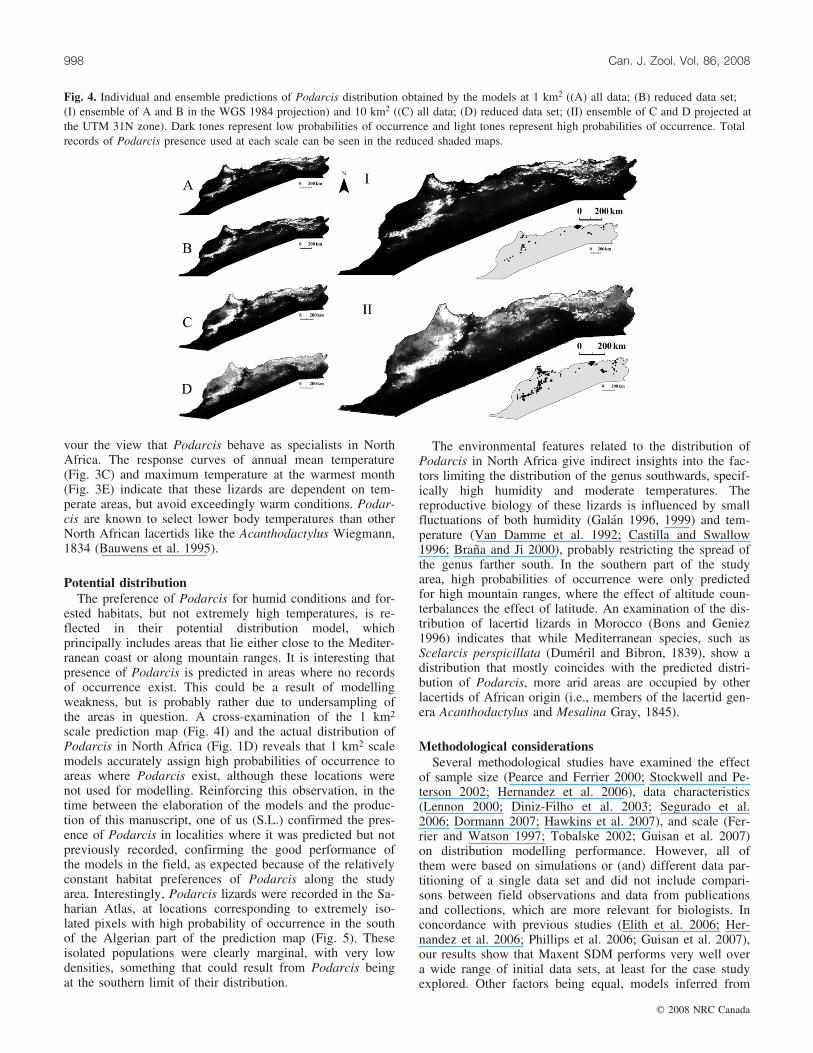
Potential distribution of Podarcis in North AfricaAs expected, the area predicted at the 10 km2 scale was
much larger than that predicted at the 1 km2 scale, but bothmodels provided high probabilities of occurrence for similarareas (Fig. 4). Areas encompassed by all models are closelyrelated to coastal areas and mountain ranges, including theRif, Middle, and High Atlas in Morocco; the Aures, HighPlateaux, isolated areas of the Saharian Atlas in Algeria;and the Tell Atlas in Algeria and Tunisia (for toponyms seeFig. 1A). At both geographic scales, the predictions includeareas where Podarcis records are lacking, especially for Al-geria.
Table 3. Maxent modelling results for the four models built.
Model n train Iterations Training AUC n test Test AUC AUC SD1ALL 148 500 0.986 37 0.982 0.0071RED 28 440 0.963 6 0.833 0.07710ALL 195 500 0.931 48 0.883 0.02110RED 52 500 0.866 12 0.854 0.039
Note: n train is the training sample size, n test is the test sample size, AUC is the area under thecurve, and SD is standard deviation.
Fig. 2. Scatter plots of individual area under the curve (AUC) vs. AUC loss for the ecogeographical variables (EGVs) evaluated at 1 km2
(A) and 10 km2 (B) geographic scales. Values for each EGV represent the mean of the models developed at each scale. For variable codessee Table 2.
996 Can. J. Zool. Vol. 86, 2008
# 2008 NRC Canada
Discussion
SDM has been shown to be a tool that can be used to in-fer ecological requirements of organisms, study niche segre-gation and competition of co-existing species, facilitatefieldwork by the prediction of potential occurrence areas forrare species and improve conservation, and numerous otherapplications with a spatial component (Araujo and Guisan2006; Elith et al. 2006; Guisan et al. 2006). Our results rein-force this view, offering insights into the ecological factorsrelated to the distribution of Podarcis in North Africa andproviding a map of potential occurrence. Additionally, anumber of interesting methodological conclusions with rele-vance for broader applications can be drawn.
Ecological affinities of Podarcis in North AfricaAs revealed by Maxent modelling, precipitation, habitat
type, and temperature are important environmental factorsin explaining the geographical distribution of wall lizards inNorth Africa (Fig. 3). This is not surprising given the Medi-terranean origin of the genus and the environmental charac-teristics of the study area. Interestingly, the only other studyusing Maxent to explain the distribution of Podarcis speciesalso highlighted the importance of humidity and habitat typefor these lizards (Herkt 2007). Additionally, other modellingapproaches applied to two forms of P. hispanica also re-vealed that temperature and climate type may be highly rel-evant (Sa-Sousa 2000).
In our case, a positive relationship existed between annualprecipitation and the probability of occurrence of Podarcis
in the study area (Fig. 3A), emphasising the preference ofthese lizards for relatively humid environments and beingadditionally supported by the importance of humid areasand water bodies as a positive contributor related to land cover(Fig. 3B). This confirms previous observations that Podar-cis inhabiting the north of Africa are dependent on perma-nent water courses (Schleich et al. 1996) and also agreeswith the preference for forested habitats (see Fig. 3B, Ta-ble 2). In contrast, more desert-like habitats which favourarid steppe-land vegetation are completely avoided. This pat-tern is possibly related to the Mediterranean origin of theselizards, which usually prefer Mediterranean-type shrubby vege-tation and temperate forests and avoid intensively cultivatedareas (Miras et al. 2005).
However, the high values of both mean individual AUCand mean AUC loss indicate that land cover is an EGV rel-evant for the distribution of Podarcis on its own, which isnot included in other EGVs. Therefore, the contribution ofhabitat type (as represented by the EGV of land cover) isnot uniquely related to the humidity characteristics of corre-sponding classes. Probably, the habitat structure related tothese vegetation types is also important, since these lizardsprefer rocky habitats (Arnold 1987; Miras et al. 2005). Thepositive contribution of bare rock (Fig. 3B), as well as theresponse curve of the EGV ‘‘slope’’ (Fig. 3D), which sug-gests that plains are excluded (zero contribution to the pre-diction) and slopes above 5% are favoured, may be anadditional indication of this fact.
Finally, the high importance of two temperature-relatedvariables and their corresponding response curves also fa-
Fig. 3. Response curves produced by univariate models of each data set on the five most important predictor variables. Solid black line:1ALL; broken black line: 1RED; solid gray line: 10ALL; broken gray line: 10RED. The y axis (logarithmic contribution to raw prediction)represents the contribution of the examined variable to the exponent that is applied to calculate the maximum entropy probability of eachpixel of the study area.
Kaliontzopoulou et al. 997
# 2008 NRC Canada
vour the view that Podarcis behave as specialists in NorthAfrica. The response curves of annual mean temperature(Fig. 3C) and maximum temperature at the warmest month(Fig. 3E) indicate that these lizards are dependent on tem-perate areas, but avoid exceedingly warm conditions. Podar-cis are known to select lower body temperatures than otherNorth African lacertids like the Acanthodactylus Wiegmann,1834 (Bauwens et al. 1995).
Potential distributionThe preference of Podarcis for humid conditions and for-
ested habitats, but not extremely high temperatures, is re-flected in their potential distribution model, whichprincipally includes areas that lie either close to the Mediter-ranean coast or along mountain ranges. It is interesting thatpresence of Podarcis is predicted in areas where no recordsof occurrence exist. This could be a result of modellingweakness, but is probably rather due to undersampling ofthe areas in question. A cross-examination of the 1 km2
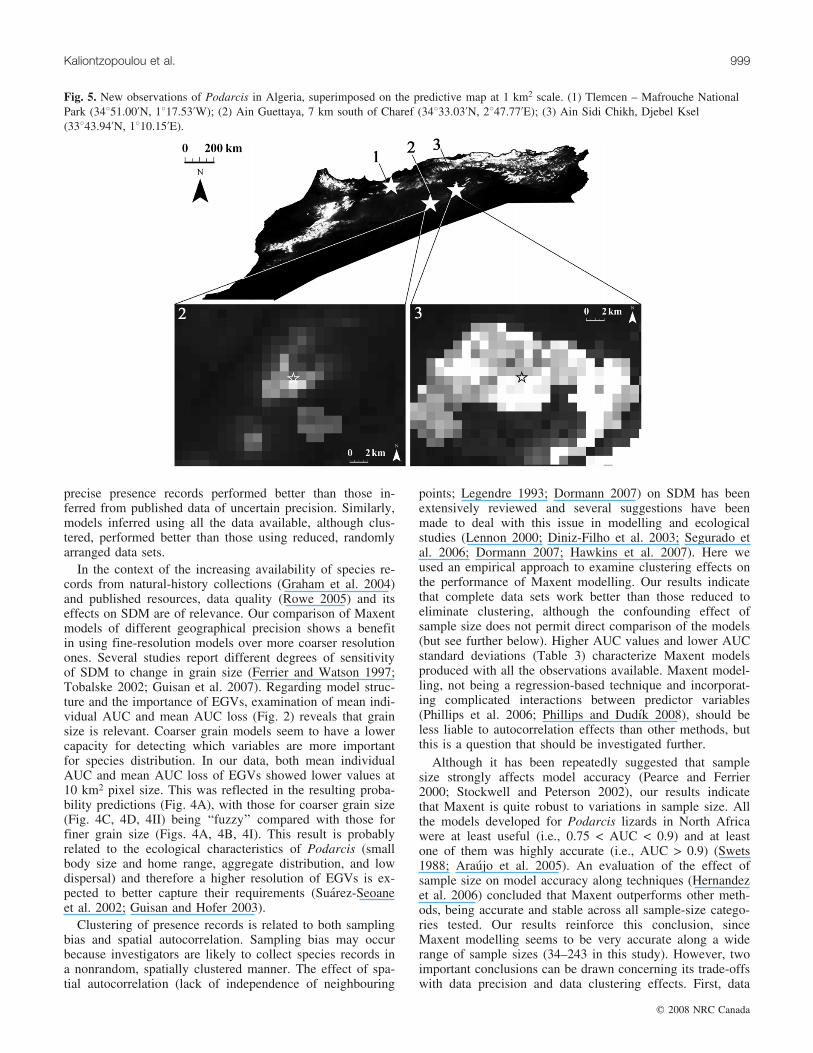
scale prediction map (Fig. 4I) and the actual distribution ofPodarcis in North Africa (Fig. 1D) reveals that 1 km2 scalemodels accurately assign high probabilities of occurrence toareas where Podarcis exist, although these locations werenot used for modelling. Reinforcing this observation, in thetime between the elaboration of the models and the produc-tion of this manuscript, one of us (S.L.) confirmed the pres-ence of Podarcis in localities where it was predicted but notpreviously recorded, confirming the good performance ofthe models in the field, as expected because of the relativelyconstant habitat preferences of Podarcis along the studyarea. Interestingly, Podarcis lizards were recorded in the Sa-harian Atlas, at locations corresponding to extremely iso-lated pixels with high probability of occurrence in the southof the Algerian part of the prediction map (Fig. 5). Theseisolated populations were clearly marginal, with very lowdensities, something that could result from Podarcis beingat the southern limit of their distribution.
The environmental features related to the distribution ofPodarcis in North Africa give indirect insights into the fac-tors limiting the distribution of the genus southwards, specif-ically high humidity and moderate temperatures. Thereproductive biology of these lizards is influenced by smallfluctuations of both humidity (Galan 1996, 1999) and tem-perature (Van Damme et al. 1992; Castilla and Swallow1996; Brana and Ji 2000), probably restricting the spread ofthe genus farther south. In the southern part of the studyarea, high probabilities of occurrence were only predictedfor high mountain ranges, where the effect of altitude coun-terbalances the effect of latitude. An examination of the dis-tribution of lacertid lizards in Morocco (Bons and Geniez1996) indicates that while Mediterranean species, such asScelarcis perspicillata (Dumeril and Bibron, 1839), show adistribution that mostly coincides with the predicted distri-bution of Podarcis, more arid areas are occupied by otherlacertids of African origin (i.e., members of the lacertid gen-era Acanthodactylus and Mesalina Gray, 1845).
Methodological considerationsSeveral methodological studies have examined the effect
of sample size (Pearce and Ferrier 2000; Stockwell and Pe-terson 2002; Hernandez et al. 2006), data characteristics(Lennon 2000; Diniz-Filho et al. 2003; Segurado et al.2006; Dormann 2007; Hawkins et al. 2007), and scale (Fer-rier and Watson 1997; Tobalske 2002; Guisan et al. 2007)on distribution modelling performance. However, all ofthem were based on simulations or (and) different data par-titioning of a single data set and did not include compari-sons between field observations and data from publicationsand collections, which are more relevant for biologists. Inconcordance with previous studies (Elith et al. 2006; Her-nandez et al. 2006; Phillips et al. 2006; Guisan et al. 2007),our results show that Maxent SDM performs very well overa wide range of initial data sets, at least for the case studyexplored. Other factors being equal, models inferred from
Fig. 4. Individual and ensemble predictions of Podarcis distribution obtained by the models at 1 km2 ((A) all data; (B) reduced data set;(I) ensemble of A and B in the WGS 1984 projection) and 10 km2 ((C) all data; (D) reduced data set; (II) ensemble of C and D projected atthe UTM 31N zone). Dark tones represent low probabilities of occurrence and light tones represent high probabilities of occurrence. Totalrecords of Podarcis presence used at each scale can be seen in the reduced shaded maps.
998 Can. J. Zool. Vol. 86, 2008
# 2008 NRC Canada
precise presence records performed better than those in-ferred from published data of uncertain precision. Similarly,models inferred using all the data available, although clus-tered, performed better than those using reduced, randomlyarranged data sets.
In the context of the increasing availability of species re-cords from natural-history collections (Graham et al. 2004)and published resources, data quality (Rowe 2005) and itseffects on SDM are of relevance. Our comparison of Maxentmodels of different geographical precision shows a benefitin using fine-resolution models over more coarser resolutionones. Several studies report different degrees of sensitivityof SDM to change in grain size (Ferrier and Watson 1997;Tobalske 2002; Guisan et al. 2007). Regarding model struc-ture and the importance of EGVs, examination of mean indi-vidual AUC and mean AUC loss (Fig. 2) reveals that grainsize is relevant. Coarser grain models seem to have a lowercapacity for detecting which variables are more importantfor species distribution. In our data, both mean individualAUC and mean AUC loss of EGVs showed lower values at10 km2 pixel size. This was reflected in the resulting proba-bility predictions (Fig. 4A), with those for coarser grain size(Fig. 4C, 4D, 4II) being ‘‘fuzzy’’ compared with those forfiner grain size (Figs. 4A, 4B, 4I). This result is probablyrelated to the ecological characteristics of Podarcis (smallbody size and home range, aggregate distribution, and lowdispersal) and therefore a higher resolution of EGVs is ex-pected to better capture their requirements (Suarez-Seoaneet al. 2002; Guisan and Hofer 2003).
Clustering of presence records is related to both samplingbias and spatial autocorrelation. Sampling bias may occurbecause investigators are likely to collect species records ina nonrandom, spatially clustered manner. The effect of spa-tial autocorrelation (lack of independence of neighbouring
points; Legendre 1993; Dormann 2007) on SDM has beenextensively reviewed and several suggestions have beenmade to deal with this issue in modelling and ecologicalstudies (Lennon 2000; Diniz-Filho et al. 2003; Segurado etal. 2006; Dormann 2007; Hawkins et al. 2007). Here weused an empirical approach to examine clustering effects onthe performance of Maxent modelling. Our results indicatethat complete data sets work better than those reduced toeliminate clustering, although the confounding effect ofsample size does not permit direct comparison of the models(but see further below). Higher AUC values and lower AUCstandard deviations (Table 3) characterize Maxent modelsproduced with all the observations available. Maxent model-ling, not being a regression-based technique and incorporat-ing complicated interactions between predictor variables(Phillips et al. 2006; Phillips and Dudık 2008), should beless liable to autocorrelation effects than other methods, butthis is a question that should be investigated further.
Although it has been repeatedly suggested that samplesize strongly affects model accuracy (Pearce and Ferrier2000; Stockwell and Peterson 2002), our results indicatethat Maxent is quite robust to variations in sample size. Allthe models developed for Podarcis lizards in North Africawere at least useful (i.e., 0.75 < AUC < 0.9) and at leastone of them was highly accurate (i.e., AUC > 0.9) (Swets1988; Araujo et al. 2005). An evaluation of the effect ofsample size on model accuracy along techniques (Hernandezet al. 2006) concluded that Maxent outperforms other meth-ods, being accurate and stable across all sample-size catego-ries tested. Our results reinforce this conclusion, sinceMaxent modelling seems to be very accurate along a widerange of sample sizes (34–243 in this study). However, twoimportant conclusions can be drawn concerning its trade-offswith data precision and data clustering effects. First, data
Fig. 5. New observations of Podarcis in Algeria, superimposed on the predictive map at 1 km2 scale. (1) Tlemcen – Mafrouche NationalPark (34851.00’N, 1817.53’W); (2) Ain Guettaya, 7 km south of Charef (34833.03’N, 2847.77’E); (3) Ain Sidi Chikh, Djebel Ksel(33843.94’N, 1810.15’E).
Kaliontzopoulou et al. 999
# 2008 NRC Canada
precision seems to prevail over sample size, something thathas also been indicated by other authors (i.e., Engler et al.2004); models based on precise data performed better thanthose based on lower precision data, although sample sizeswere higher for the latter. In contrast, sample size over-comes the importance of data clustering, both at 1 and10 km2 scales. Models based on complete data sets aremore effective than those based on reduced data sets.
The narrow ecological requirements and restricted distri-bution of wall lizards in North Africa, examined with Max-ent modelling, allowed us to determine putativeenvironmental constraints and successfully predict speciespresence in unsampled areas orienting future samplings.Our analysis of methodological constraints on Maxent mod-elling shows that precise presence records are to be pre-ferred over less accurate records, even if this reducessample size. In contrast, clustering does not have a negativeeffect on Maxent performance, as sample size is more im-portant. Similar approaches may be of general applicationto other stenoic species for which available locations arescarce in comparison with the study area.
AcknowledgementsWe thank N. Sillero and P. Tarroso for technical assis-
tance with GIS. N. Sillero, X. Santos, and two anonymousreviewers provided helpful comments that improved earlierversions of the manuscript. A.K. was supported by a predoc-toral grant (SFRH/BD/28565/2006) and J.C.B., M.A.C., andD.J.H. were supported by postdoctoral grants (SFRH/BPD/26699/2006, SFRH/BPD/27025/2006 and SFRH/BPD/26738/2006), all by Fundacao para a Ciencia e a Tecnologia.
ReferencesAmaral, M.J., and Carretero, M.A. 2005. Preferred body tempera-
tures of Podarcis lizards in Portugal: inter- and intraspecific var-iation. In Programme and Abstracts of the 13th OrdinaryGeneral Meeting of Societas Europaea Herpetologica, Bonn,Germany, 27 September – 2 October 1995. Edited by Zoolo-gisches Forschungsmuseum Alexander Koenig, Bonn, Germany.p. 24.
Anderson, R.P., Lew, D., and Peterson, A.T. 2003. Evaluating pre-dictive models of species’ distributions: criteria for selecting op-timal models. Ecol. Model. 162: 211–232. doi:10.1016/S0304-3800(02)00349-6.
Araujo, M.B., and Guisan, A. 2006. Five (or so) challenges for spe-cies distribution modelling. J. Biogeogr. 33: 1677–1688. doi:10.1111/j.1365-2699.2006.01584.x.
Araujo, M.B., and New, M. 2007. Ensemble forecasting of speciesdistributions. Trends Ecol. Evol. 22: 42–47. doi:10.1016/j.tree.2006.09.010. PMID:17011070.
Araujo, M.B., Pearson, R.G., Thuiller, W., and Erhard, M. 2005.Validation of species–climate impact models under climatechange. Glob. Change Biol. 11: 1504–1513. doi:10.1111/j.1365-2486.2005.01000.x.
Arnold, E.N. 1987. Resource partition among lacertid lizards insouthern Europe. J. Zool. Ser. B, 1: 739–782.
Bauwens, D., Garland, T., Castilla, A.M., and Van Damme, R.1995. Evolution of sprint speed in lacertid lizards: morphologi-cal, physiological and behavioral covariation. Evolution, 49:848–863. doi:10.2307/2410408.
Blanc, C.P. 1979. Observations sur Lacerta hispanica et L. lepidaen Tunisie. Bull. Soc. Herpetol. Fr. 103: 504–506.
Bons, J., and Geniez, P. 1996. Amphibians and reptiles of Mor-occo. Asociacion Herpetologica Espanola, Barcelona.
Brana, F., and Ji, X. 2000. Influence of incubation temperature onmorphology, locomotor performance, and early growth ofhatchling wall lizards (Podarcis muralis). J. Exp. Zool. 286:422–433. doi:10.1002/(SICI)1097-010X(20000301)286:4<422::AID-JEZ10>3.0.CO;2-D. PMID:10684565.
Busack, S.D., Lawson, R., and Arjo, W.M. 2005. MitochondrialDNA, allozymes, morphology and historical biogeography inthe Podarcis vaucheri (Lacertidae) species complex. Amphib.-Reptilia, 26: 239–256. doi:10.1163/1568538054253438.
Carretero, M.A., Marcos, E., and de Prado, P. 2006. Intraspecificvariation of preferred temperatures in the NE form of Podarcishispanica. In Mainland and insular lacertid lizards: a Mediterra-nean perspective. Edited by C. Corti, P. Lo Cascio, and M.Biaggini. Firenze University Press, Florence, Italy. pp. 55–64.
Castilla, A.M., and Swallow, J.G. 1996. Thermal dependence of in-cubation duration under a cycling temperature regime in the li-zard, Podarcis hispanica atrata. J. Herpetol. 30: 247–253.doi:10.2307/1565516.
Chirio, L., and Blanc, C.P. 1997. Statut et distribution des reptilesdans le massif de l’Aures (Algerie). J. Afr. Zool. 111: 205–232.
Cliff, A.D., and Ord, J.K. 1973. Spatial autocorrelation. Pion Lim-ited, London.
Diniz-Filho, J.A.F., Bini, L.M., and Hawkins, B.A. 2003. Spatialautocorrelation and red herrings in geographical ecology. Glob.Ecol. Biogeogr. 12: 53–64. doi:10.1046/j.1466-822X.2003.00322.x.
Dormann, C.F. 2007. Effects of incorporating spatial autocorrela-tion into the analysis of species distribution data. Glob. Ecol.Biogeogr. 16: 129–138. doi:10.1111/j.1466-8238.2006.00279.x.
Elith, J., Graham, C.H., Anderson, R.P., Dudık, M., Ferrier, S.,Guisan, A., Hijmans, R.J., Huettmann, F., Leathwick, J.R., Leh-mann, A., Li, J., Lohmann, L.G., Loiselle, B.A., Manion, G.,Moritz, C., Nakamura, M., Nakazawa, Y., Overton, J.M.C.C.,Peterson, A.T., Phillips, S.J., Richardson, K., Scachetti-Pereira,R., Schapire, R.E., Soberon, J., Williams, S., Wisz, M.S., andZimmermann, N.E. 2006. Novel methods improve prediction ofspecies’ distributions from occurrence data. Ecography, 29: 129–151. doi:10.1111/j.2006.0906-7590.04596.x.
Engler, R., Guisan, A., and Rechsteiner, L. 2004. An improved ap-proach for predicting the distribution of rare and endangeredspecies from occurrence and pseudo-absence data. J. Appl.Ecol. 41: 263–274. doi:10.1111/j.0021-8901.2004.00881.x.
Environmental Systems Research Institute, Inc. 2006. ArcMap.Version 9.2 [computer program]. Environmental Systems Re-search Institute, Inc., Redlands, Calif.
Ferrier, S., and Watson, G. 1997. An evaluation of the effective-ness of environmental surrogates and modelling techniques inpredicting the distribution of biological diversity. EnvironmentAustralia, Canberra, A.C.T.
Galan, P. 1996. Seleccion de lugares de puesta en una poblaciondel lacertido Podarcis bocagei. Rev. Esp. Herpetol. 10: 97–108.
Galan, P. 1999. Demography and population dynamics of the lacer-tid lizard Podarcis bocagei in northwest Spain. J. Zool. Ser. B,249: 203–218.
GLC. 2003. The Global Land Cover for the Year 2000. Availablefrom http://www-gem.jrc.it/glc2000/defaultGLC2000.htm [ac-cessed 10 June 2007].
Graham, C.H., Ferrier, S., Huettmann, F., Moritz, C., and Peterson,A.T. 2004. New developments in museum-based informatics andapplications in biodiversity analysis. Trends Ecol. Evol. 19:497–503. doi:10.1016/j.tree.2004.07.006. PMID:16701313.
Guisan, A., and Hofer, U. 2003. Predicting reptile distributions at
1000 Can. J. Zool. Vol. 86, 2008
# 2008 NRC Canada
the mesoscale: relation to climate and topography. J. Biogeogr.30: 1233–1243. doi:10.1046/j.1365-2699.2003.00914.x.
Guisan, A., Lehmann, A., Ferrier, S., Austin, M., Overton,J.M.C.C., and Aspinall, R. 2006. Making better biogeographicalpredictions of species’ distributions. J. Appl. Ecol. 43: 386–392.doi:10.1111/j.1365-2664.2006.01164.x.
Guisan, A., Graham, C.H., Elith, J., and Huettmann, F., and theNCEAS Species Distribution Modelling Group. 2007. Sensitivityof predictive species distribution models to change in grain size.Divers. Distrib. 13: 332–340.
Harris, D.J., and Sa-Sousa, P. 2002. Molecular phylogenetics ofIberian wall lizards (Podarcis): is Podarcis hispanica a speciescomplex? Mol. Phylogenet. Evol. 23: 75–81. doi:10.1006/mpev.2001.1079. PMID:12182404.
Harris, D.J., Carranza, S., Arnold, E.N., Pinho, C., and Ferrand, N.2002. Complex biogeographical distribution of genetic variationwithin Podarcis wall lizards across the Strait of Gibraltar. J.Biogeogr. 29: 1257–1262. doi:10.1046/j.1365-2699.2002.00744.x.
Hawkins, B.A., Diniz-Filho, J.A.F., Bini, L.M., De Marco, P., andBlackburn, T.M. 2007. Red herrings revisted: spatial autocorre-lation and parameter estimation in geographical ecology. Eco-graphy, 30: 375–384.
Herkt, M. 2007. Modelling habitat suitability to predict the poten-tial distribution of Erhard’s wall lizard Podarcis erhardii onCrete. M.Sc. thesis, International Institute for Geo-InformationScience and Earth Observation, Enschede, the Netherlands.
Hernandez, P.A., Graham, C.H., Master, L.L., and Albert, D.L.2006. The effect of sample size and species characteristics onperformance of different species distribution modeling methods.Ecography, 29: 773–785. doi:10.1111/j.0906-7590.2006.04700.x.
Hijmans, R.J., Cameron, S.E., Parra, J.L., Jones, P.G., and Jarvis,A. 2005. Very high resolution interpolated climate surfaces forglobal land areas. Int. J. Climatol. 25: 1965–1978. doi:10.1002/joc.1276.
Huettmann, E., and Diamond, A.W. 2006. Large-scale effects onthe spatial distribution of seabird in the Northwest Atlantic.Landsc. Ecol. 21: 1089–1108. doi:10.1007/s10980-006-7246-8.
Hutchinson, G.E. 1957. Concluding remarks. Cold Spring Harb.Symp. Quant. Biol. 22: 415–427.
Legendre, P. 1993. Spatial autocorrelation: trouble or new para-digm? Ecology, 74: 1659–1673. doi:10.2307/1939924.
Lennon, J.L. 2000. Red-shifts and red herrings in geographicalecology. Ecography, 23: 101–113. doi:10.1034/j.1600-0587.2000.230111.x.
Miras, J.A.M., Cheylan, M., Nouira, M.S., Joger, U., Sa-Sousa, P.,and Perez-Mellado, V. 2005. Podarcis vaucheri. In 2006 IUCNred list of threatened species. International Union for Conserva-tion of Nature and Natural Resources (IUCN), Gland, Switzer-land. Available from http://www.iucnredlist.org [accessed 13August 2007].
Pearce, J., and Ferrier, S. 2000. An evaluation of alternative algo-rithms for fitting species distribution models using logistic re-gression. Ecol. Model. 128: 127–147. doi:10.1016/S0304-3800(99)00227-6.
Pearson, R.G., Raxworthy, C.J., Nakamura, M., and Peterson, A.T.2007. Predicting species distributions from small numbers of oc-
currence records: a test case using cryptic geckos in Madagas-car. J. Biogeogr. 34: 102–117. doi:10.1111/j.1365-2699.2006.01594.x.
Phillips, S.J., and Dudık, M. 2008. Modeling of species distribu-tions with Maxent: new extensions and a comprehensive evalua-tion. Ecography, 31: 161–175. doi:10.1111/j.0906-7590.2008.5203.x.
Phillips, S.J., Dudık, M., and Schapire, R.E. 2004. A maximum en-tropy approach to species distribution modeling. In Proceedingsof the Twenty-first International Conference on Machine Learn-ing, Banff, Alta., July 2004. Edited by R. Greiner and D.Schuurmans. ACM Press, New York. pp. 655–662.
Phillips, S.J., Anderson, R.P., and Schapire, R.E. 2006. Maximumentropy modeling of species geographic distributions. Ecol.Model. 190: 231–259. doi:10.1016/j.ecolmodel.2005.03.026.
Pinho, C., Harris, D.J., and Ferrand, N. 2007. Comparing patternsof nuclear and mitochondrial divergence in a cryptic speciescomplex: the case of Iberian and North African wall lizards (Po-darcis, Lacertidae). Biol. J. Linn. Soc. 91: 121–133. doi:10.1111/j.1095-8312.2007.00774.x.
Rowe, R.J. 2005. Elevational gradient analyses and the use of his-torical museum specimens: a cautionary tale. J. Biogeogr. 32:1883–1897. doi:10.1111/j.1365-2699.2005.01346.x.
Sa-Sousa, P. 2000. A predictive distribution model for the Iberianwall lizard (Podarcis hispanica) in Portugal. Herpetol. J. 10: 1–11.
Schleich, H.H., Kastle, W., and Kabisch, K. 1996. Amphibians andreptiles of North Africa. Koeltz Scientific Books, Koenigstein,Germany.
Segurado, P., Araujo, M.B., and Kunin, W.E. 2006. Consequencesof spatial autocorrelation for niche-based models. J. Appl. Ecol.43: 433–444. doi:10.1111/j.1365-2664.2006.01162.x.
Stockwell, D.R.B., and Peterson, A.T. 2002. Effects of sample sizeon accuracy of species distribution models. Ecol. Model. 148:1–13. doi:10.1016/S0304-3800(01)00388-X.
Suarez-Seoane, S., Osborne, P.E., and Alonso, J.C. 2002. Large-scale habitat selection by agricultural steppe birds in Spain:identifying species–habitat responses using generalized additivemodels. J. Appl. Ecol. 39: 755–771. doi:10.1046/j.1365-2664.2002.00751.x.
Swets, J.A. 1988. Measuring the accuracy of diagnostic systems.Science (Washington, D.C.), 240: 1285–1293. doi:10.1126/science.3287615. PMID:3287615.
Tobalske, C. 2002. Effects of spatial scale on the predictive abilityof habitat models for the green woodpecker in Switzerland. InPredicting species occurrences: issues of accuracy and scale.Edited by J.M. Scott, P.J. Heglund, F. Samson, J. Haufler, M.Morrison, M. Raphael, and B. Wall. Island Press, Covelo, Calif.pp. 197–204.
USGS. 2004. Shuttle radar topography mission (SRTM): mappingthe world in 3 dimensions. United States Geological Survey Na-tional Center, Reston, Va. Available from http://srtm.usgs.gov/[accessed 8 June 2007].
Van Damme, R., Bauwens, D., Brana, F., and Verheyen, R.F. 1992.Incubation temperature differentially affects hatching time, eggsurvival, and hatching performance in the lizard Podarcis mura-lis. Herpetologica, 48: 220–228.
Kaliontzopoulou et al. 1001
# 2008 NRC Canada
Related Documents