1 MODELLING THE ALUMINIUM SMELTING CELL MASS AND ENERGY BALANCE – A TOOL BASED ON THE 1 ST LAW OF THERMODYNAMICS Vanderlei Gusberti (1) , Dagoberto S. Severo (1) , Barry J. Welch (2) , Maria Skyllas-Kazacos (2) . 1) CAETE Engenharia, Rua Caeté 162, Porto Alegre RS– Brazil [email protected] 2) School of Chemical Engineering, University of New South Wales, Sydney, NSW, 2052, Australia Abstract The understanding and prediction of the electrolysis cell heat balance is a key factor for efficient cell operation and extended cell life. In the past, many cell heat balance models have been developed in order to calculate the cell operation window. These models relied on curve fitted data obtained decades ago and also disregarded many cell mass inputs and outputs. The thermal balance model presented in this work is entirely based on the first law of thermodynamics. This is a more robust and general approach, valid for any type of cell, any size, steady state or transient calculations. Unlike the traditional models, the extended cell control volume suggested by Welch and Keniry (2000) [1] is adopted. This allows to include the under hood reactions, such as anode carbon, CO and COS oxidations. The influence of the cell duct flow rate on the heat losses can also be studied. A user-friendly software tool for predicting the cell energy balance was developed. For a given cell design, the user can modify cell operation parameters quickly obtaining the new resulting situation. The new modelling tool is applied to an operating cell and the results are compared with “classical” methodology. Keywords: aluminium cell modelling, mass balance, energy balance. Introduction The behaviour of modern cells is the result of a wide range of parameters. Some parameters are defined by the cell design (cell thermal insulation, maximum electrical current capacity, magnetohydrodynamic condition), while other parameters are controlled automatically by a computerized system (cell voltage drop, alumina feeding) and there are also parameters dependent on human interaction (anode changing, anode covering, bath corrections, aluminium tapping). Optimum values have to be pursued by plant operation. In the large scale production, any small process improvement can lead to relevant energy saving. Nowadays, thermal equilibrium of aluminium reduction cells is becoming more and more constrained with the increase of the cell size, squeezing of ACD and energy saving needs. Therefore, fine tuning of cell heat balance is very important and requires more accurate cell mass and energy balance understanding, control and prediction.

Welcome message from author
This document is posted to help you gain knowledge. Please leave a comment to let me know what you think about it! Share it to your friends and learn new things together.
Transcript
1
MODELLING THE ALUMINIUM SMELTING CELL MASS AND
ENERGY BALANCE – A TOOL BASED ON THE 1ST
LAW OF
THERMODYNAMICS
Vanderlei Gusberti(1)
, Dagoberto S. Severo(1)
, Barry J. Welch(2)
, Maria Skyllas-Kazacos(2)
.
1) CAETE Engenharia, Rua Caeté 162, Porto Alegre RS– Brazil
2) School of Chemical Engineering, University of New South Wales, Sydney, NSW, 2052, Australia
Abstract
The understanding and prediction of the electrolysis cell heat balance is a key factor for
efficient cell operation and extended cell life. In the past, many cell heat balance models have
been developed in order to calculate the cell operation window. These models relied on curve
fitted data obtained decades ago and also disregarded many cell mass inputs and outputs.
The thermal balance model presented in this work is entirely based on the first law of
thermodynamics. This is a more robust and general approach, valid for any type of cell, any
size, steady state or transient calculations. Unlike the traditional models, the extended cell
control volume suggested by Welch and Keniry (2000) [1] is adopted. This allows to include
the under hood reactions, such as anode carbon, CO and COS oxidations. The influence of
the cell duct flow rate on the heat losses can also be studied.
A user-friendly software tool for predicting the cell energy balance was developed. For a
given cell design, the user can modify cell operation parameters quickly obtaining the new
resulting situation. The new modelling tool is applied to an operating cell and the results are
compared with “classical” methodology.
Keywords: aluminium cell modelling, mass balance, energy balance.
Introduction
The behaviour of modern cells is the result of a wide range of parameters. Some parameters are defined by the cell design (cell thermal insulation, maximum electrical current capacity,
magnetohydrodynamic condition), while other parameters are controlled automatically by a computerized system (cell voltage drop, alumina feeding) and there are also parameters
dependent on human interaction (anode changing, anode covering, bath corrections, aluminium tapping). Optimum values have to be pursued by plant operation. In the large
scale production, any small process improvement can lead to relevant energy saving.
Nowadays, thermal equilibrium of aluminium reduction cells is becoming more and more
constrained with the increase of the cell size, squeezing of ACD and energy saving needs.
Therefore, fine tuning of cell heat balance is very important and requires more accurate cell
mass and energy balance understanding, control and prediction.
Maria
Line

2
In the past, many heat balance models considered only carbon, alumina, aluminium, CO and
CO2 in the material balance. In the voltage equations published in [2], even the excess of
carbon consumption is neglected. Nevertheless this approach is popular among analysts [3,
4], probably due to its simplicity.
Haupin´s [2] assumptions for CO/CO2 output rates were proposed in the 1950s [5], when it
was believed that the only source of current efficiency loss was the reoxidation reaction. At
that time, anode dressing was different, usually using pure alumina instead of mixing recycled bath. Nowadays, ACD is squeezed as much as possible causing important current
efficiency losses through anode spikes. This fact changes the prediction of CO/CO2 formation inside the cell, as well as the resulting energy balance.
This paper presents the following features implemented in a new cell energy balance modelling approach:
- Extension of the cell control volume to include the cell hooding as suggested by Welch and Keniry [1]. All previous models do not include the cell under hood space in the
control volume, but important exothermic reactions occur at that place, influencing heat
balance.
- Better cell mass balance representing a more complete set of materials flow. This is an
important step to achieve more accurate cell energy balance entirely based on the 1st
law of thermodynamics, independent of the curve fitted data of the voltage equations.
This includes unused carbon and anode changing materials flow, bath corrections and
heat losses associated with the cavity cleaning procedure.
- The convective heat transfer between ledge and the cell internal liquids is a source of
uncertainty in the cell heat balance. In recent years, bath flow is being more studied in
physical scale models [6] and numerical models [7]. In this work, 3D fluid flow
modelling developed at CAETE will be used [7] in order to account for the MHD flow
and the bubble-induced flow inside the bath.
- An auxiliary CFD model dedicated to predicting the cell gas duct temperature was developed. Results are dependent on cell thermal state, average cover thickness and gas
duct flow rate.
Mathematical modelling of a complete cell mass and energy flow provides a tool for
forecasting the cell response to state perturbations and for optimising the necessary actions to bring the cell state inside the desired targets. It can also be used for predictions of bath
correction and fluoride evolution levels. Operating the cell in an optimal state envelope saves energy and raw materials and, as well, decreases the harmful emission levels to the
environment.
The main objective of this research is to provide a tool for engineers to study cell operation
parameters, quickly performing many virtual tests, with immediate response. The program
can help process engineers to find the cell's optimum operation window (combination of bath
chemistry, ACD, bath superheat, voltage drop, cell current), increasing the process efficiency.
It is necessary to build up a modelling system capable of using all the power of 3D sub-
models in order to supply detailed information to a global cell energy balance model. The
global balance model can then quickly re-run many operational setups in order to obtain and
plot an operational window chart for a given cell technology. The Figure 1 shows a generic

3
representation of the cell’s operating window. The thermal limits are found approximately at
constant energy input lines (red). The ACD limit (blue line) is the lowest interpolar distance
where current efficiency can be maintained at appropriate levels, governed by a complex
combination of factors such as: CO2 bubbles flow, MHD instability and bath volume to
dissolve alumina.
Figure 1: Voltage operational window diagram
Cell Mass Balance
The basis for the proposed aluminium reduction process model is the first law of
thermodynamics. Consequently, mass balance for a given control volume must be established
on an elemental basis. In general, the mass conservation law is applied in the steady state
form for each species.
_ _ 0in i generated out i consumedw w w w+ − − =& & & & (1)
Where w& is the massflow rate in [kg/day] of a substance “i”. Many material flows are usually
monitored by the smelters, for example: aluminium, alumina, carbon, AlF3, alumina
impurities, fluorides. However some mass flow inputs or outputs must be obtained by
additional measurements or analytical techniques, such as gaseous emissions: H2O, SO2,
CO2, etc.
Control Volume Definition: New Approach
The choice of the control volume boundaries is determinant for a successful mass and energy
balance model. In general, earlier models [4, 8, 9, 10, 11, 12, 13] usually worked with a control volume involving the cell interior and cover as shown in Figure 2. This approach was
useful to study chemical-physical processes occurring only inside the bath layer, disregarding many reactions that take place under the cell hood, but above the cell crust. These reactions
are responsible for an important amount of cell heat source, since most of them are combustion reactions.

4
A more extended control volume was proposed by Welch and Keniry [1] as a future option
for improving aluminium cells thermal modelling. To the best of the authors’ knowledge, it
was not implemented up to now. It comprises the entire hooded cell, allowing the cell gases
to cross the control volume at the cell hood gaps and gas collection duct entrance. The
advantage of this extended cell control volume is the elimination of many uncertainties of the
proportions and contributions of various intermediary reactions occurring under the cell
hooding.
Figure 2: Control volume adopted by earlier heat balance models
In the present work, this new approach for control volume is implemented as the basis for the cell mass and energy balance. The main difficulty is that it implies the knowledge of cell duct
flow rate, temperature and composition. However many species’ flow rates can be deduced by analytical methods and the duct temperature and flow rate are easy to measure and are
even monitored regularly by some smelters. Additionally, CFD auxiliary models can be implemented in order to determine duct flow rate and temperature. The Figure 3 presents the
aluminium cell control volume, including all relevant species’ flows considered in the present modelling approach.
Figure 3: Relevant materials flow through the cell control volume
5
The best option to represent the massflow quantities is in units of kg of species per ton of
produced metallic aluminium [kg /ton Al], since the aluminium production rate is very well
measured. It also enables the comparison of performance between different cell technologies
and size.
Material Inputs
Material inputs comprise all mass crossing the control volume from the outside to the cell
interior. The major species are alumina and carbon (anodes), necessary for the alumina
reduction reaction. However, for a sufficiently good mass and energy balance, considering
only these species is too simplistic.
Alumina Feeding, Dry Scrubbing and Alumina Impurities
The pure Al2O3 required to make aluminium can easily be calculated by stoichiometry,
resulting in 1889 kg/ton Al. However, alumina provided to the cell is in fact ~98% Al2O3, the
rest being composed of impurities. Another important aspect associated with alumina is the
phase content of alumina fed into the cell. Nowadays, it is common to use aluminas rich in
gamma phase (more than 90%) and low alpha phase content (less than 10%). Different
alumina phases present different enthalpy and thus influence the energy balance of the cell.
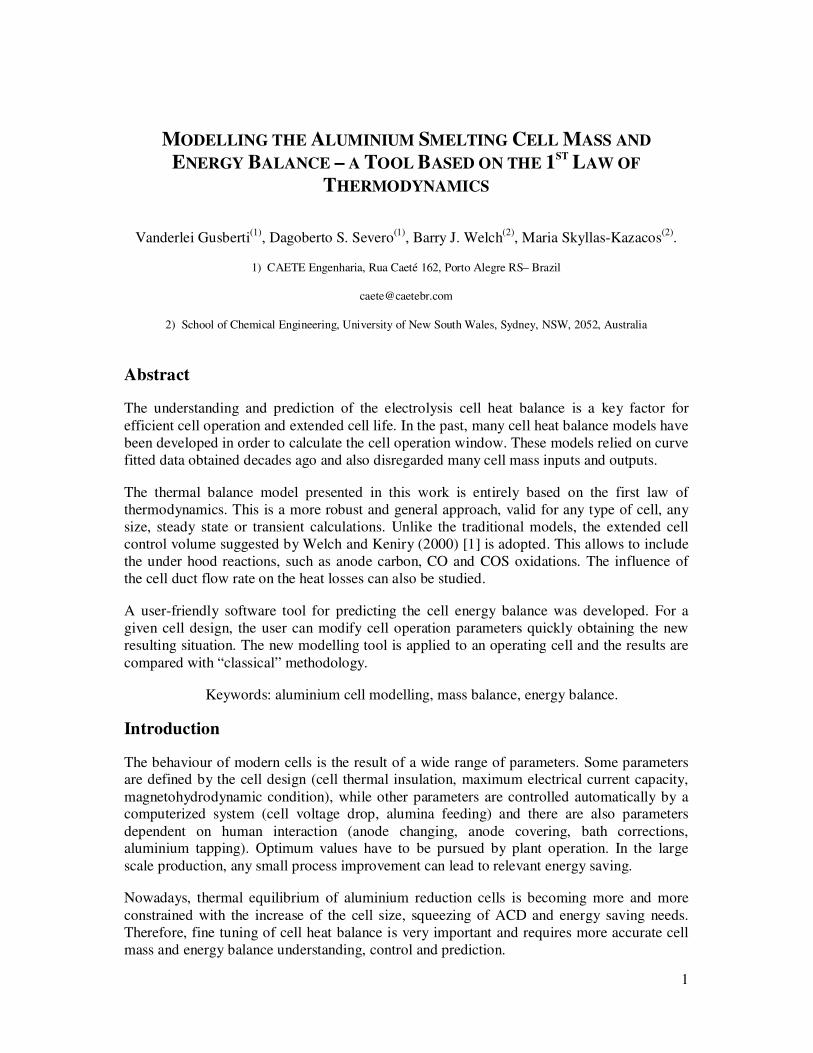
In the smelters, dry scrubbing is applied to the cell exhaust gases in order to collect the cell
emissions harmful to the environment. “Primary” alumina (also called “fresh” alumina) is
injected into the cell exhaust gases stream. Some impurities are already present in primary
alumina (Na2O, CaO, H2O). This mix travels to the bag houses where the clean gases are
separated from the, now called, “secondary” alumina (or “enriched” alumina, or “reacted”
alumina). The secondary alumina is then directed to the aluminium reduction cell feeders,
recycling almost all cell emissions (typically, more than 99.9%). The Figure 4 shows,
schematically, the alumina and gases streams allowing the recycling of cell emissions.
Figure 4: Alumina and cell duct gases streams in dry scrubbing process

6
The most important species of interest for this process are the recycled fluorides (mainly HF
and NaAlF4), but other impurities also are recycled, such as Fe. For the mass and energy
balance purposes, the relevant impurities to be considered in this work are those influencing
the bath chemistry (Na2O, CaO, AlF3), H2O and adsorbed OH- that is correlated to the L.O.I.
They need to be measured in primary and secondary alumina. The total alumina demand of
the reduction cell is typically around 1940 kg/ton Al, including impurities. Not all alumina
demand is provided by the alumina feeders. Eventually part of the added cover falls into the bath, providing up to 10% of alumina consumed. All the secondary alumina impurities must
be heated to reach the bath temperature.
Bath Corrections: AlF3 and Na2CO3 Additions
One of the key factors in order to obtain optimal aluminium production efficiency is to maintain the bath composition as stable as possible around specified target values. Usually,
the maintenance of the %AlF3 between 10-13% is desired because it lowers the melting point of bath to ~950°C, improving current efficiency. There are two basic oxides entering the cell
together with alumina: Na2O and CaO. In the bath, they will form cryolite and CaF2,
according to equations (2) and (3) , and consuming AlF3 continuously.
2 3 3 6 2 3
3 4 2Na O AlF Na AlF Al O+ → + (2)
3 2 2 33 2 3CaO AlF CaF Al O+ → + (3)
Aluminium fluoride must be regularly added into the cell to readjust bath chemistry back to
the targets. The AlF3 addition rate is well predictable [14], according to alumina composition
and scrubber efficiency. The deficit in AlF3 is originated by the primary alumina
composition, since the AlF3 and Na2O gained in the scrubbers are produced by the bath and
come back in a closed loop.
Another factor influencing the AlF3 demand is the sodium uptake by the cathodes. Depending
on the cathode type, AlF3 demand is below the presented prediction because part of the
sodium provided to the cell by the alumina is absorbed into the cathode in the early months of
cathode life. Occasionally, the bath AlF3 concentration is found to be higher than the target,
caused by a number of reasons:
- Excess of addition by wrong AlF3 demand prediction;
- Change in AlF3 concentration target;
- Sodium uptake higher than expected by cathodes;
In this case, sodium carbonate (Na2CO3) is added in order to neutralize the aluminium
fluoride, see equation (4). Sodium carbonate additions occur much less often than aluminium fluoride additions.
3 2 3 3 6 2 3 24 3 2 3AlF Na CO Na AlF Al O CO+ → + + (4)
Carbon and Anode Assembly Material Inputs
Electrolytic oxidation of the carbon anode reduces the energy requirement of the Hall-Heroult
process compared to an inert anode and makes the aluminium reduction feasible and efficient
at temperatures around 960°C. Carbon anodes enter the control volume accompanied by

7
anode stubs, yokes and guide rods. These materials do not react inside the control volume,
but they consume energy to be heated up. Anodes are gradually consumed at a predictable
rate, and replaced when necessary. In prebake technologies, not all carbon is consumed and
~20% of original carbon is retrieved from the cell in the form of hot anode butt (at ~800°C).
The theoretical minimum carbon requirement, calculated by stoichiometry, is 333.4 kg/ton
Al. In real cell operation, however, a number of factors are responsible for increasing this
consumption rate up to ~550 kg/ton Al considering the total carbon provided to the cell (gross carbon):
- Part of carbon is not used (anode butt) and is recycled. This makes the net carbon consumption in the range of 400-450 kg/ton Al;
- Part of carbon is consumed by Boudouard reaction;
- Part of carbon is lost by oxidation when hot carbon is in contact with air;
- Part of carbon is lost in the form of carbon dust.
- Part of anode mass is formed by impurities, typically Sulphur 1.5-3%. It forms two
gases during the anode consumption, COS and SO2, influencing cell emissions
composition;
The amount of carbon wasted by the above processes is dependent on cell working practices
and anode quality. As a consequence, a reliable prediction is very difficult, although
aluminium smelters usually keep track of gross and net carbon consumption.
Anode Cover Addition
During the anode change procedure, there is addition of dressing cover over the anodes. The
careful covering of the anodes is a key aspect for successful cell operation. In modern cells,
the cover is a mix of crushed bath and alumina, the proportions being determined by smelter
operations. A certain amount of cover has to be replaced at each anode change because:
- Part of the cover is carried out of the cell with the anode butt;
- Part of the old cover falls into the bath during the break of the consolidated crust;
- Part of the cover is spilt into the bath during the dressing of new anodes;
With the cover, a certain amount of alumina falls into the bath reducing the alumina demand
from the alumina feeders (up to 10%). For the same reason, bath level tends to increase because crushed bath is melted when part of the cover falls into the cavity. Sometimes fallen
cover does not dissolve and generates the so called “bottom sludge” or “muck” on the cathode surface. Cathode cleaning procedure will be discussed in the materials output
subsection. All these contributions must be estimated for the cell materials balance.
Potroom Air Drawn into the Cell
More than 95% of the gases collected by the cell exhaust system are originally potroom air
drawn into the cell by the negative pressure present under the cell hood. The remaining ~5%
is produced inside the cell, mainly in the bath. The potroom air provides also oxygen and
water for some chemical reactions. With the information of exhaust flow mix and the
knowledge of cell internal processes, it is possible to quantify the amount of air sucked into
the cell. In this work the composition of air entering in the cell is considered as atmospheric

8
standard composed of the species: N2, O2, CO2, Ar, H2O. Other minor inert gas contributions
present in atmospheric air are not considered relevant for the mass and energy balance.
Material Outputs
Material output is considered as any amount of mass crossing the control volume from the
inside to the outside.
Aluminium Tapping
Aluminium metal is produced by electrolysis and its rate is governed by Faraday’ law at a
certain current efficiency. Typically the metal is tapped out once a day and it leaves the
control volume at ~960°C.
Spent Anode Assembly Removal
Due to practical reasons, a fraction of the carbon anode (anode “butt”) must leave the cell
attached to the rest of the anode assembly to protect the steel parts from the bath attack. Part
of the sulphur content associated with the new anode also leaves the cell untouched inside the
anode butt. Other assembly parts leave the cell (yoke, cast iron collars, guide rod) at high
temperatures as shown in Figure 5. In addition, part of anode cover is also removed with the
butt.
Cathode Surface Cleaning
Modern cell operation practices recommend cleaning of the cell cavity during the anode
change procedure (Figure 6). If the cathode block’s surface is not in good contact with the
metal, the electrical current path is disturbed, as well the entire cell behaviour in many
aspects (electrical, thermal, magnetics, fluid flow). Cavity cleaning material can be of
different origins and nature:
- “Sludge” or “muck” is formed by undissolved alumina that settles below the metal
layer. This alumina can be of feeder origin or part of cover material fallen into the bath.
- During the anode removal procedure, part of consolidate cover (crust) is broken in solid
pieces and they are very likely to deposit over the cathode blocks.
- Pieces of broken carbon anode.
Figure 5: Spent anode butt being retrieved from the
cell, source: Iffert Thesis (2007) [15]
Figure 6: Cathode cleaning material being removed
from cell

9
In the mass and energy balance, it is observed that the cleaning device crosses the control
volume boundary, entering the cell in a cold state and leaving at higher temperature, thus
removing a certain amount of energy from the cell, associated with the enthalpy difference of
the equipment. Sometimes the heat stored in the cleaning device is in the order of 0.1 [kg/ton
Al] and it should be taken into account in order to achieve precise heat balance calculations.
Bath Tapping
There are two sources of bath formation in the cell:
a) The neutralization of Na2O and CaO entering the cell control volume by AlF3.
Formation of Na3AlF6 and CaF2 occurs according to equations (2) and (3).
b) Cover spillage into the bath. The alumina part of the cover spillage may be consumed
to make aluminium metal. However, the crushed bath will likely melt and increase the bath volume.
The rate of bath production by mechanism a) is very well predictable by knowing the alumina impurities composition. The amount formed by process b) is more complex to analyse and is
dependent on cell working practices and strategies.
Cell Emissions
The cell duct emissions are composed, in a general manner, of the air drawn into the cell,
including humidity, plus the gases generated inside the control volume minus the gases
consumed by the cell inside the control volume. There are many transformations inside the
aluminium cell involving gases as reactants and/or products. The chemical reactions
involving gaseous species that are considered in this work as of importance for the heat and
mass balance are listed below:
- Alumina reduction to produce metal:
2 3 22 3 3 ( ) 4Al O C CO g Al+ → + (5)
- Aluminium reoxidation reaction, causing loss of current efficiency:
2 2 3
3 ( ) 2 3 ( )CO g Al Al O CO g+ → + (6)
- Anode sulphur content is responsible for the appearance of SO2 in the cell emissions.
First COS is formed in the anode at higher temperatures. Subsequently, COS is burnt
under the cell hood.
2 3 3 3 2 3 ( )Al O C S Al COS g+ + → + (7)
2 2 2
2 ( ) 3 ( ) 2 ( ) 2 ( )COS g O g CO g SO g+ → + (8)
- Anode carbon air burn: Part of anode surface is exposed to air and it is hot enough to
combust.
2 2( ) ( )C O g CO g+ → (9)
10
- Boudouard reaction: Part of carbon dioxide produced by electrolysis passes through the
anode pores, an environment rich in carbon at high temperatures.
2( ) 2 ( )CO g C CO g+ → (10)
- As an assumption, all the carbon monoxide produced by the reoxidation reaction and
Boudouard reaction is burnt under the cell hood where the temperatures are usually
around 150°C.
2 22 ( ) ( ) 2 ( )CO g O g CO g+ → (11)
- Hydrogen fluoride evolution from bath, alumina water content is responsible to provide
hydrogen.
3 2 2 32 3 6 ( )AlF H O Al O HF g+ → + (12)
- Sodium tetrafluoraluminate evolution from bath. The water involved here comes from
air humidity.
3 6 3 42 3 ( )Na AlF AlF NaAlF g+ → (13)
4 2 2 3 3 6
3 ( ) 3 ( ) 6 ( )NaAlF g H O g Al O Na AlF HF g+ → + + (14)
The determination of each individual species mass balance can be predicted by adopting
reasonable assumptions. If duct gas flow composition measurements are available, all the
analytical part of composition prediction is not compulsory, but it is recommended to be
performed in order to check the consistency of modelling assumptions.
Cell Energy Balance
The cell heat balance obeys the 1st law of thermodynamics. The difference between heat
inputs and outputs is the heat accumulation. The energy inputs are expressed by the enthalpy
associated with the materials entering the cell plus the cell voltage heat production. The heat
outputs are expressed by the enthalpy associated with the materials leaving the cell control volume plus the heat dissipation to ambient. The equation (16) presents the heat balance
function of materials flow, Joule heat and dissipation to the ambient:
ac in outQ Q Q= − (15)
( )_ _ _ _
( - )( ) ( ) B A
ac Cell Al i in i i in i out i i out
EqAp
T TQ V I w m H T m H T
R= + − −∑ ∑& & & (16)
Where Q is heat flow in [W], Vcell is cell voltage in [V], I is the line current in [A], Alw& is the
aluminium production rate in [kg/s], i
m& is the massflow rate per kg of aluminium of
substance “i” [kg/kg Al], Hi is the enthalpy in [J/kg] at Temperature Ti, TA is the ambient
temperature in [°C], TB is the bath temperature in [°C] and REqAp is the equivalent thermal
resistance of the cell from the bath to the exterior in [°C/W]. Some authors [2, 11] prefer to
express the cell energy balance as a cell voltage balance, dividing all equations by “I”.
However, such an approach should be carefully applied because the first law of

11
thermodynamics states the conservation of only mass and energy. Voltage equations are not
valid for transient calculations or if the cell presents current path disturbances.
Energy Source: Cell Voltage and Line Current
In the smelters, the electrical energy input into the cell is very well monitored and controlled
in real time by measuring the total voltage and line current. In the past, many efforts have
been made [16, 17] to study in detail the parts of the total cell voltage. However, for the cell
energy balance purposes presented in this paper, it is irrelevant to know the exact values of
the “voltage breakdown” because all voltage parcels will end up in the form of energy
generation inside the cell control volume.
Energy Sink Associated with Mass Balance
After the implementation of the mass balance, the enthalpy balance associated with all
materials can be established. The enthalpy associated with a certain mass of a substance at temperature T is:
0
298298
( ) ( )T
i f pH T H C T dT= ∆ + ∫ (17)
The first part of the right hand side of equation is the enthalpy of formation for the
substance. The specific heat Cp(T) is usually represented by a polynomial function of temperature found in thermodynamic tables. The total heat sink of the cell is represented by
sum of all substances enthalpy entering and leaving the cell control volume:
( )_ _ _ _( ) ( )Tot i in i i in i out i i outH m H T m H T∆ = −∑ ∑& & (18)
If good modern cell operation is considered, the heat sink calculated by equations above is expected to be in the order of ~ 8 - 9 [kWh/kg Al]. It includes the amount of energy
transferred from the cell interior to the gases leaving the cell duct. It is possible to define the
minimum heat sink for alumina reduction that is obtained calculating the enthalpy difference
between products (Al, CO2) at reaction temperature TB and reactants (C, Al2O3) at ambient
temperature TA:
2 32
2 2 3
3 3( ) ( ) ( ) ( )
4 2 4
Al OCO CMin Al B CO B Al O A C A
Al Al Al
MM MH H T H T H T H T
M M M
∆ = + − +
(19)
Where “Mi” is the molar mass of substance “i”. If we start from pure gamma alumina, the result for the ideal minimum required energy for aluminium production is 6.25 [kWh/kg Al]
at TA=25°C and TB=960°C. The cell energy efficiency “Eeff” can be defined as the ratio between the minimum energy required for the reduction reaction and the total energy
provided to the cell.
100 Min AlEff
Cell
H wE
V I
∆=
& (20)
The best aluminium smelters in the world present energy efficiency in the order of 50%.
Some older technologies produce at energy efficiencies as low as 40%.

12
Heat Losses to Environment: Analogue Thermal Resistances Model
If steady state condition is assumed (no accumulation Qac=0), the heat losses are usually
described using the so called 2-zones approach [11, 18, 19]. It can be represented by 2 parallel series of thermal resistances, connecting the bath temperature (heat input location) to
the environment temperature (heat output location).
We propose a 3-zone description, where the heat flowing through the cell top insulation
leaves the cell at duct temperature and not at environment temperature. Figure 7 shows the
analogue thermal circuit representing the cell heat losses of the 3-zones approach and Figure
8 shows a schematic representation of resistances inside the cell. There are three parallel
groups of thermal resistances: one for the heat passing through the ledge and cell walls, one
for the bottom heat flow without ledge and another for the top heat losses to the duct air
collection.
Figure 7: Thermal resistances representing cell heat losses

13
Figure 8: Schematic representation of thermal resistances inside the cell (sidewall cut view, for endwall
cut view, subscript “W” is substituted by “E”)
Nomenclature: “R” is thermal resistance, subscripts define the resistance position: “W”
stands for wall, “M” is metal level, “B” is bath level, “h” is convective resistance at fluid-
solid interfaces, “C” is cathode panel, “A” is anode panel, “S” is sidewall and “E” endwall.
Note: for simplicity, we represented wall resistances “RW” as the sum of solid conductive
resistance and external natural convection resistance around the shell.
One series of resistances conducts a certain heat flow “Q1” through the regions covered by
frozen bath. In this region, the superheat plays the major role as "driving force", determining
the heat flow and ledge thickness. The other two series of thermal resistances conducts the
“Q2” and “Q3” heat through the regions not covered by frozen bath, generally, anode panel
and the cathode blocks. The heat flow is proportional to delta temperature between liquid bath and environment (for cell bottom) and between liquid bath and duct temperature (for cell
top). Thermal resistances at anode panel may not be constant, due to cover variation, or due to the "apparent" thermal resistance increase by heat generation inside the electrodes, pins,
yoke, guide rods. Liquidus temperature is a function of bath chemistry and bath temperature is calculated iteratively considering heat generation and losses, cell voltage and ACD.
Cell Lining and Shell Thermal Resistances
In this approach, the thermal resistances are obtained by a 3D finite element model (Figure
9). If cell geometry or electrode properties or insulation properties are modified, then the 3D
model has to be recalculated to obtain new resistance values. The shielding effect of heat
generation inside the electrical conductors due to Joule effect is also obtained by the 3D
auxiliary model.

14
Figure 9: 3D electrolytic cell thermal electric submodel, external view of calculated temperatures.
Cell Top Heat Losses
The cell top heat transfer resistance is a combination of bath convective heat transfer
coefficient, conduction through the anode carbon and cover/crust plus convection and
radiation under the cell hood. In order to study the effect of duct flow rate on the top heat
losses, another CFD model is applied. The boundary conditions and calculated gas
temperature field are shown in Figure 10 and Figure 11, respectively. The output cell duct
temperature is found by the model for a given duct flow rate, bath temperature and potroom
temperature. In addition, hot gases evolved from bath are included in the sub model, and as
well, the carbon airburn heat sources.
Figure 10: Boundary conditions of the gas collection
submodel
Figure 11: Temperature distribution of the cell gas
calculated by the gas collection submodel
Changes in the duct flow rate have a limited effect on the energy flow of the cell top.
Typically, estimations show that around one third of cell top thermal resistance is convective (gas-cover). The other two thirds are anode panel and crust/cover material. The exact shares
of each thermal resistance depend on cell technology and cover practices.
Convective Internal Thermal Resistances
The heat transfer coefficients between bath and ledge and metal and ledge are key factors in the prediction of ledge size and heat flux through the cell walls. In the present work, these

15
coefficients are calculated using the same published models [7] developed at CAETE. The
modelling results are in accordance with the magnitudes found in the compilation of
experimental and analytical results published by Solheim [20], more details concerning the
boundary conditions and results are found in an earlier paper [7].
Cell Mass and Energy Balance Model
The Figure 12 presents a flowchart of the complete heat and mass balance modelling. The 3D
electromagnetic model provides MHD forces for fluid flow calculation at metal. In parallel,
the gas induced flow is evaluated at the bath. Once the fluid flow is obtained, wall heat
transfer coefficients at the ledge, anode and cathode surfaces as well as the top cover heat
transfer coefficients are calculated. These coefficients are supplied to the thermal 3D sub-
model and also to the global cell balance model. The 3D sub-models supply the balance
model with the wall thermal resistances for a given cell design. Finally, the global cell
balance model processes all the inputs and determines the resultant cell state: bath
composition, mass balance for each substance, associated heat balance and ledge thickness
prediction.
The global balance model is implemented in Visual Basic computational code named “Cell
Mass & Energy Balance”. The program solves mass and energy balances for a cell in
averaged steady state condition. The user must provide a set of data regarding: raw materials
(gross and net carbon consumption, alumina impurities), measured cell parameters (voltage,
current, CE). The thermal resistances obtained by 3D models are inserted in the advanced
user area.
When all inputs are properly defined, the user can easily calculate and modify operation
parameters, such as: line current, bath composition, cathode resistance, bath temperature,
metal and bath depth, alumina composition and other material input quantities for a new cell
state recalculation. The Figure 13 shows an example of the input data filled screen in the Cell
Mass & Energy Balance computational code.
Figure 12: Models flowchart
Global Cell Mass and Energy Balance Model • Species concentrations; • Calculation of bath temperature;
• Ledge movement;
3D MHD Flow and Gas Induced Flow Models • Calculation of heat transfer
coefficients: f(MHD forces, anode shape, channels size, anode current density, ACD, bath height, anode slots)
3D Electrical - Thermal Model
• Determination of thermal resistances of heat pathways
• Quantification of "apparent" thermal resistance due to Joule effect, f(cell current).
Electromagnetic Model Cell Top CFD Model

16
Figure 13: Input Data Screen of the “Cell Mass & Energy Balance V.1.01” program.
The next sections present results of mass and energy balance calculation using the Cell Mass
& Energy Balance program.
Case Study: 180kA cell
Let us consider the cell data as shown in the Figure 13 and the additional information
regarding the anode assembly: - Mass of 1 Guide Rod (aluminium): 117 [kg];
- Mass of 1 Yoke +Cast Iron (iron): 317 [kg]; - Extracted anode butt average temperature: 870[°C];
- Cover (extracted with anode butt), average temperature:590 [°C]; - Guide Rod (extracted with anode butt), average temperature:135 [°C];
- Yoke +Cast Iron (iron) (extracted with anode butt), average temperature: 386 [°C]; - Cell thermal resistances were obtained by 3D Finite Element models (Figure 9), heat
transfer coefficients at ledge were obtained by 3D CFD models and inserted and
inserted in the Cell Mass & Energy Balance Code.
Mass Balance Results
The information above was inserted in the Cell Mass & Energy Balance code and the mass
balance of each species was obtained. The Figure 14 shows the resulting mass flow rates screen of input and output materials.

17
Figure 14: Cell mass balance results sheet obtained by the “Cell Mass & Energy Balance” code.
The total inputs and total outputs must be equal considering averaged steady state. One
interesting application of the presented program is the determination of the cell duct gas
chemical composition. Improvements on the process operation can be virtually tested.
Examples: AlF3 correction needs can be predicted. Actions to reduce emission rates can be studied. It is possible to assess the impact of changing alumina impurities composition on cell
emissions. The role played by cathode cleaning material in the mass and energy balance can be quantified.
A special and more detailed screen of the Cell Mass & Energy Balance code was developed to show the contribution of many processes in each gaseous species generation or
consumption, see Figure 15. Afterwards the remaining balance of each component leaves the cell by the collection duct.

18
Figure 15: Detailed duct emissions result screen obtained by the “Cell Mass & Energy Balance” code.
Energy Balance Results:
The cell energy consumption can be divided in three types:
1. Thermodynamic unavoidable energy consumption in order to satisfy the alumina reduction reaction enthalpy ( H∆ ) and to heat the reactants (C, Al2O3) from the ambient
temperature up to the reaction temperature (~960°C).
2. Energy consumption of parallel reactions (reactions involving fluorides, sulphur, Al
reoxidation, etc.) and to heat up other materials not producing aluminium (alumina
impurities, AlF3, excess of carbon, anode butt materials, cathode cleaning materials,
duct gases, etc.).
3. Energy dissipated by the cell walls in the convection + radiation processes, responsible
to maintain the cell ledge and superheat at stable values.
The cell energy consumption breakdown is presented in Figure 16 using the mass balance
method for the case above. It is impossible to reduce the energy consumption Type 1. The
energy losses Type 3 are highly dependent on the cell thermal design and can be modified
only by changing the ledge thickness (and superheat) or by changing the cell lining. The
energy consumption Type 2 can be reduced by smelter operation with careful control of cell
mass balance streams.

19
Cell Energy Consumption Assessement, Mass Balance Method,
Line Current=180.7 kA
19.20%
2.42%
8.72%
20.84%
4.60%
44.23%
Alumina Reduction Enthalpy (Unavoidable)
Energy Absorbed by Duct Gases
Parallel Reactions and Heat Up Other Materials
External Dissipation
Shell Dissipation
Hood and Superstructure Dissipation
Figure 16: Cell energy consumption breakdown calculated by the mass balance method, Type 1: green,
Type 2: blue, Type 3: orange.
The Table 1 shows the cell consumption results using the energy balance methodology
proposed in this paper for 3 different cell currents compared with an example of “classic”
approach [2]. Cell Voltage of 4.354 [V] was set for all cases, resulting in cell consumption of
14.090 [kWh/kg Al]. Energy consumption types are differentiated.
Table 1: Thermal balance results for different line currents using mass balance method. Last column
presents a result using the classical method
Mass and Energy Balance Method Classic Method [2]
I [kA] 185.7 180.7 175.7 180.7
Cell Thermal Efficiency [%] 44.23 44.23 44.23 44.23
Total Cell Consumption [kWh/kg Al] 14.090 14.090 14.090 14.090
Enthalpy Balance (New Control Volume) 9.171 9.277 9.390 NA
Enthalpy Balance (Classic Control Volume) 6.571 6.573 6.575 6.377
Type 1: Alumina Reduction Enthalpy (Unavoidable) 6.232 6.232 6.232 6.232
Reaction Enthalpy at Bath Temperature 5.655 5.655 5.655 5.655
Al2O3, C Heat Up to the Reaction Temperature 0.577 0.577 0.577 0.577
Type 2: Heat up Materials and Parallel Reactions 2.939 3.045 3.158 NA
Energy Absorbed by Duct Gases 2.600 2.704 2.815 NA
Other Reactions and Heat Up 0.339 0.341 0.343 0.144
Type 3: Energy Dissipation to the Potroom 4.919 4.813 4.701 5.009
External Dissipation (Busbar) 1.262 1.228 1.194 1.228
Shell Dissipation 3.026 2.937 2.84 3.133
Hood and Superstructure Dissipation 0.631 0.648 0.667 0.648
The most important observed difference is that the classic methods often underestimate the
energy spent in minor chemical reactions and to heat up many materials such as: alumina
impurities, anode carbon and other parts, fluoride additions, cathode cleaning materials. In
20
the classic method [2], only the reoxidation reaction is taken into account besides the
electrolysis reaction. This also overestimates the predicted cell losses to the potroom, leading
to lower expected ledge thickness.
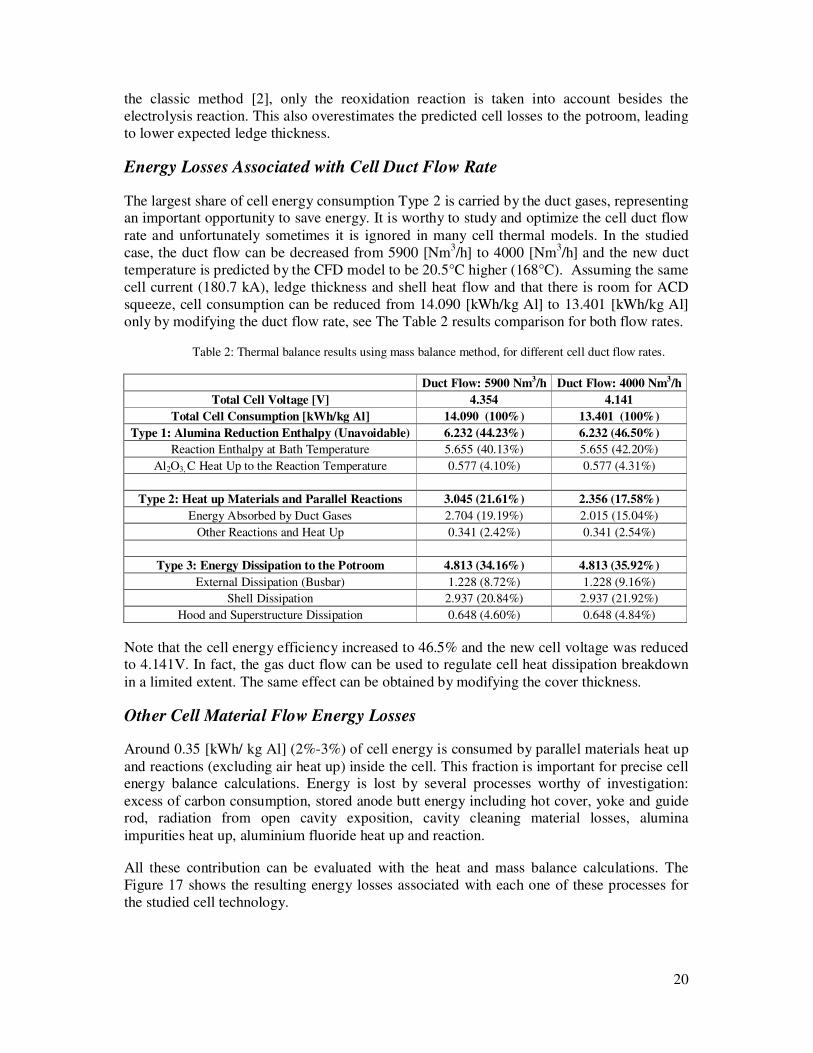
Energy Losses Associated with Cell Duct Flow Rate
The largest share of cell energy consumption Type 2 is carried by the duct gases, representing an important opportunity to save energy. It is worthy to study and optimize the cell duct flow
rate and unfortunately sometimes it is ignored in many cell thermal models. In the studied
case, the duct flow can be decreased from 5900 [Nm3/h] to 4000 [Nm
3/h] and the new duct
temperature is predicted by the CFD model to be 20.5°C higher (168°C). Assuming the same
cell current (180.7 kA), ledge thickness and shell heat flow and that there is room for ACD
squeeze, cell consumption can be reduced from 14.090 [kWh/kg Al] to 13.401 [kWh/kg Al]
only by modifying the duct flow rate, see The Table 2 results comparison for both flow rates.
Table 2: Thermal balance results using mass balance method, for different cell duct flow rates.
Duct Flow: 5900 Nm3/h Duct Flow: 4000 Nm
3/h
Total Cell Voltage [V] 4.354 4.141
Total Cell Consumption [kWh/kg Al] 14.090 (100%) 13.401 (100%)
Type 1: Alumina Reduction Enthalpy (Unavoidable) 6.232 (44.23%) 6.232 (46.50%)
Reaction Enthalpy at Bath Temperature 5.655 (40.13%) 5.655 (42.20%)
Al2O3, C Heat Up to the Reaction Temperature 0.577 (4.10%) 0.577 (4.31%)
Type 2: Heat up Materials and Parallel Reactions 3.045 (21.61%) 2.356 (17.58%)
Energy Absorbed by Duct Gases 2.704 (19.19%) 2.015 (15.04%)
Other Reactions and Heat Up 0.341 (2.42%) 0.341 (2.54%)
Type 3: Energy Dissipation to the Potroom 4.813 (34.16%) 4.813 (35.92%)
External Dissipation (Busbar) 1.228 (8.72%) 1.228 (9.16%)
Shell Dissipation 2.937 (20.84%) 2.937 (21.92%)
Hood and Superstructure Dissipation 0.648 (4.60%) 0.648 (4.84%)
Note that the cell energy efficiency increased to 46.5% and the new cell voltage was reduced to 4.141V. In fact, the gas duct flow can be used to regulate cell heat dissipation breakdown
in a limited extent. The same effect can be obtained by modifying the cover thickness.
Other Cell Material Flow Energy Losses
Around 0.35 [kWh/ kg Al] (2%-3%) of cell energy is consumed by parallel materials heat up
and reactions (excluding air heat up) inside the cell. This fraction is important for precise cell energy balance calculations. Energy is lost by several processes worthy of investigation:
excess of carbon consumption, stored anode butt energy including hot cover, yoke and guide rod, radiation from open cavity exposition, cavity cleaning material losses, alumina
impurities heat up, aluminium fluoride heat up and reaction.
All these contribution can be evaluated with the heat and mass balance calculations. The
Figure 17 shows the resulting energy losses associated with each one of these processes for
the studied cell technology.

21
0.061
0.065
0.060
0.027
0.076
0.046
0.007
0.013
0.00
0.05
0.10
0.15
0.20
0.25
0.30
0.35
0.40
Complete Mass Balance
(Total)
En
erg
y C
on
su
mp
tio
n [
kW
h/ k
gA
l]
Bath Radiation (During Anode Change)
Bath Produced and Tapped
Cathode Top Cleaning Materials
Alumina Impurities + AlF3 additions
Anode Assembly Heat Up
Gross Carbon Excess Heat Up
Net Carbon Excess Heat Up and Reactions
Back Reaction Carbon Consumption
Figure 17: Energy consumption associated with the minor cell material flow and parallel reactions
Actions to minimize these energy losses are possible, for example: reduce time spent per anode change, improve the cover practices to generate less sludge, reduce gross and net
carbon consumptions, etc.
Energy Losses Associated with Cover Practices
In the studied case, 436 kg of cover material is added to the cell at each anode change. The
cover leaves the cell control volume in a variety of forms: part remains on the anode butt top
leaving the cell at anode change, part falls over the cathode and leaves the cell during cathode
cleaning, part dissolves into the bath 50% alumina is consumed and the other 50% forms
more bath and, occasionally, it is tapped out. Assuming that the cathode cleaning material
composition (200 kg) is the same as original cover, the share of each destination of the cover
material is shown in Figure 18.
Fate of the 436 kg Cover Addition and Associated Energy Consumption
Spent Anode (50%
Alumina + 50% Bath):
158.3 kg
Alumina Dissolved
and Consumed (100%
Alumina): 38.85 kg
Bath Volume Increase
(100% Bath): 38.85 kg
Cathode Cleaning
(50% Alumina + 50%
Bath): 200 kg
16 kWh/ ton Al
7 kWh/ ton Al
33 kWh/ ton Al
0 kWh/ ton
Figure 18: Estimation of cover material fate in studied case and the energy lost with material flow in each
material flow (orange bars and values)

22
The energy loss associated with cathode cleaning material is the most relevant because it
comes out of the cell at almost the bath temperature (~960°C), while the anode butt cover is
at ~600°C. Eventually, bath production must be tapped out also at bath temperature. The
alumina content of cover dissolved into the bath contributes to make aluminium and thus, by
definition, no cell energy inefficiency comes from this process.
Conclusions
In general, traditional cell energy balance models underestimate the heat losses due to
material balance because the contributions of many materials are ignored. This fact can lead
to wrong cell operating window and ledge thickness predictions. Another advantage of a
detailed material balance calculation is the possibility to study cell emission rates and AlF3
needs in the entire context of the cell heat and mass flow balance, evaluating all influences
and consequences simultaneously.
The cell heat lost to the duct gases represents a very important share of the cell energy
consumption. Using the modelling methodology presented in this paper, the prediction of the
duct flow rate versus heat balance impact was made. A lower duct flow rate reduces heat
losses opening the possibility for energy saving, but reduces the cell emissions capture
efficiency. A compromise solution has to be found for the optimal cell duct flow. In some
cases, when cell current is increased and more heat has to be extracted from the cell, the
increase of cell duct flow rate can be applied to re-equilibrate the heat losses and ledge
thickness of the cell.
The cell energy balance is influenced by operational practices, and this fact has to be
explored when fine tunning electrolytic cell efficiency. The anode change duration and
dressing cover addition affect the cell heat losses and should be minimized, as well the
carbon excesses. Cathode surface or cavity cleaning can be responsible for 0.05-0.1 [kWh/kg
Al] of energy losses. Lower cover consumption reduces the cell heat losses. Alumina
impurities are responsible for another 0.05-0.1 [kWh/kg Al] additional energy consumption.
References
1. B. J. Welch, J. T. Keniry: Advancing the Hall-Heroult Electrolytic Process, TMS
Light Metals 2000, pp 17-26.
2. W. E. Haupin, Interpreting the Components of Cell Voltage, TMS Light Metals 1998,
pp 531-537.
3. M. Dupuis: Computation of Aluminum Reduction Cell Energy Balance using ANSYS ® Finite Element Models, TMS Light Metals 1998, pp 409-417.
4. P. Biedler: Modeling of an Aluminum Reduction Cell for the Development of a State
Estimator, College of Engineering and Mineral Resources at West Virginia University
PHD Thesis, Morgantown, West Virginia, USA, 2003.
5. T. R. Beck: The Relation of Gas Composition to Current Efficiency in an Aluminum
Reduction Cell, Journal of Electrochemical Society, Volume 106, pp 710-713.
6. Cooksey M. A., Yang W., "PIV Measurements on Physical Models of Aluminium
Reduction Cells", TMS Light Metals 2006, pp 359-365.
7. D. S. Severo, V. Gusberti: A Modelling Approach to Estimate Bath and Metal Heat Transfer Coefficients, TMS Light Metals 2009, pp 557-562.
23
8. L. Tikasz, R. T. Bui, V. Potocnik: Aluminium Electrolytic Cells: A Computer
Simulator for Training and Supervision, Engineering with Computers (1994) 10:12-
21, Springer-Verlag London Limited, 1994.
9. I.Tabsh, M. Dupuis, A. Gomes: Process Simulation of Aluminum Reduction Cells,
TMS Light Metals 1996, pp 451-457.
10. T. Drengstig: On Process Model Representation and AlF3 Dynamics of Aluminum
Electrolysis Cells” Dr. Ing. Thesis, Department of Engineering Cybernetics -
Norwegian University of Science and Technology, Trondheim-Norway, August 1997.
11. J. N. Bruggeman: Pot Heat Balance Fundamentals, 6th Australasian Aluminum
Smelting Workshop Proceedings, Queenstown, New Zealand, 22-27th November
1998, pp 167-189.
12. O. O. Rodnov, P.V. Poliakov, A. I. Berezin, P. D. Stont, I. V. Mezhubovsky:
Estimation of a Technological Condition of the Aluminium Reduction Cells on the Basis of its Daily Energy Balance, TMS Light Metals 2003, pp 457-462.
13. T. V. Piskazhova and V. C. Mann: The Use of a Dynamic Aluminum Cell Model,
JOM—Journal of the Minerals, Metals and Materials Society, 58(2), 2006, pp 58-62.
14. S. Kolas, T. Stoere: Bath Temperature and AlF3 Control of an Aluminium Electrolysis
Cell”, Control Engineering Practice 17 (2009), pp 1035–1043.
15. M. Iffert: Aluminium Smelting Cell Control and Optimization. Chemical Sciences &
Engineering, Faculty of Engineering, UNSW. PhD Thesis, 2007.
16. J. Thonstad, E. Hove: On the Anodic Overvoltage in Aluminum Electrolysis,
Canadian Journal of Chemistry, Volume 42, 1964. Pp 1542-1550.
17. J. Thonstad, S. Rolseth: On the Cathodic Overvoltage on Aluminium in Cryolite-Alumina Melts-I, Electrochemica Acta, Volume 23, 1978, pp 223-231.
18. F. Stevens: Reduction Cell Energy Balance Dynamics and Performance, 5th
Australasian Aluminium Smelting Technology Workshop Proceedings, Sydney,
Australia, 22-27th October 1995, pp 171-191.
19. L. I. Kiss, V. Dassylva-Raymond: Freeze Thickness in the Aluminum Electrolysis
Cells, TMS Light Metals 2008, pp 431-436.
20. A. Solheim: Some Aspects of Heat Transfer between Bath and Sideledge in
Aluminium Reduction Cells, TMS Light Metals 2011, 381-386.
Related Documents