Modelling the environmental impact of an aluminium pressure die casting plant and options for control Belmira Neto a, * , Carolien Kroeze b , Leen Hordijk c , Carlos Costa d a GMM/IMAT e Department of Metallurgical and Materials Engineering, Faculty of Engineering, University of Porto, Rua Dr. Roberto Frias, 4200-465 Porto, Portugal b Environmental Systems Analysis Group, Wageningen University, P.O. Box 8080, 6700 DD Wageningen, The Netherlands c International Institute for Applied Systems Analysis (IIASA), A-2361 Laxenburg, Austria d Laboratory of Processes, Environment and Energy Engineering, Faculty of Engineering, University of Porto, Rua Dr. Roberto Frias, 4200-465 Porto, Portugal Received 28 April 2006; received in revised form 1 February 2007; accepted 11 May 2007 Available online 20 July 2007 Abstract This study describes a model (MIKADO) to analyse options to reduce the environmental impact of aluminium die casting. This model will take a company perspective, so that it can be used as a decision-support tool for the environmental management of a plant. MIKADO can be used to perform scenario analyses to analyse the impact on the environment of different strategies, while taking into account both economical and ecological consequences of decision-making. The MIKADO approach is based on relevant parts of Life Cycle Assessment, environmental sys- tems management and Multi-criteria Analysis. One of the strengths of MIKADO is the integrated approach that it takes in analysing, simulta- neously, a set of eight environmental problems, including: human toxicity, abiotic depletion, global warming, solid waste production, acidification, terrestrial ecotoxicity, photochemical ozone formation and aquatic toxicity, caused by the aluminium die casting plant. The model is developed for and applied to a specific aluminium die casting plant supplying car manufacturers with aluminium die casting products. We present model results for a reference case, indicating that most of the environmental impact of the plant is associated with releases of compounds during the melting and casting of alloy, as well as with the use of natural gas. Finally, we present results of a partial sensitivity analysis, indicating the sensitivity of the model to changes in parameter values. Ó 2007 Elsevier Ltd. All rights reserved. Keywords: Modelling; Environmental impact assessment; Aluminium die casting plant; Environmental decision-support tool; Integrated Assessment Model 1. Introduction Many industrial sectors have to meet environmental targets, aiming to reduce the environmental impact of the industrial activities (Finkbeiner et al., 1998; Silvo et al., 2002). In many countries environmental laws exist that, for instance, regulate the emissions of a number of pollutants, or include re- strictions of the use of toxic compounds or waste handling. The aluminium die casting industry follows the worldwide trend of implementing environmental management systems to quantify the environmental performance (Neto et al., 2003; Zobel and Burman, 2004; Hillary, 2004). Aluminium is a widely used metal, in particular in the au- tomotive industry. The need to reduce vehicle fuel consump- tion by reducing the weight of the cars has increased the interest in aluminium. For instance, the total mass of alumin- ium in an European car roughly doubled between 1990 and 2000 (EIPPCB, 2005). The expected growth of the use of alu- minium to achieve lighter cars has an effect on the aluminium die casting industry. Aluminium pressure die casting is a manufacturing process in the non-ferrous industries producing engineered aluminium alloy products, such as car components. * Corresponding author. Fax: þ351 22 5081447. E-mail address: [email protected] (B. Neto). 1364-8152/$ - see front matter Ó 2007 Elsevier Ltd. All rights reserved. doi:10.1016/j.envsoft.2007.05.005 Environmental Modelling & Software 23 (2008) 147e168 www.elsevier.com/locate/envsoft

Welcome message from author
This document is posted to help you gain knowledge. Please leave a comment to let me know what you think about it! Share it to your friends and learn new things together.
Transcript

Environmental Modelling & Software 23 (2008) 147e168www.elsevier.com/locate/envsoft
Modelling the environmental impact of an aluminium pressuredie casting plant and options for control
Belmira Neto a,*, Carolien Kroeze b, Leen Hordijk c, Carlos Costa d
a GMM/IMAT e Department of Metallurgical and Materials Engineering, Faculty of Engineering, University of Porto,Rua Dr. Roberto Frias, 4200-465 Porto, Portugal
b Environmental Systems Analysis Group, Wageningen University, P.O. Box 8080, 6700 DD Wageningen, The Netherlandsc International Institute for Applied Systems Analysis (IIASA), A-2361 Laxenburg, Austria
d Laboratory of Processes, Environment and Energy Engineering, Faculty of Engineering, University of Porto,Rua Dr. Roberto Frias, 4200-465 Porto, Portugal
Received 28 April 2006; received in revised form 1 February 2007; accepted 11 May 2007
Available online 20 July 2007
Abstract
This study describes a model (MIKADO) to analyse options to reduce the environmental impact of aluminium die casting. This model willtake a company perspective, so that it can be used as a decision-support tool for the environmental management of a plant. MIKADO can be usedto perform scenario analyses to analyse the impact on the environment of different strategies, while taking into account both economical andecological consequences of decision-making. The MIKADO approach is based on relevant parts of Life Cycle Assessment, environmental sys-tems management and Multi-criteria Analysis. One of the strengths of MIKADO is the integrated approach that it takes in analysing, simulta-neously, a set of eight environmental problems, including: human toxicity, abiotic depletion, global warming, solid waste production,acidification, terrestrial ecotoxicity, photochemical ozone formation and aquatic toxicity, caused by the aluminium die casting plant. The modelis developed for and applied to a specific aluminium die casting plant supplying car manufacturers with aluminium die casting products. Wepresent model results for a reference case, indicating that most of the environmental impact of the plant is associated with releases of compoundsduring the melting and casting of alloy, as well as with the use of natural gas. Finally, we present results of a partial sensitivity analysis,indicating the sensitivity of the model to changes in parameter values.� 2007 Elsevier Ltd. All rights reserved.
Keywords: Modelling; Environmental impact assessment; Aluminium die casting plant; Environmental decision-support tool; Integrated Assessment Model
1. Introduction
Many industrial sectors have to meet environmental targets,aiming to reduce the environmental impact of the industrialactivities (Finkbeiner et al., 1998; Silvo et al., 2002). Inmany countries environmental laws exist that, for instance,regulate the emissions of a number of pollutants, or include re-strictions of the use of toxic compounds or waste handling.The aluminium die casting industry follows the worldwide
* Corresponding author. Fax: þ351 22 5081447.
E-mail address: [email protected] (B. Neto).
1364-8152/$ - see front matter � 2007 Elsevier Ltd. All rights reserved.
doi:10.1016/j.envsoft.2007.05.005
trend of implementing environmental management systemsto quantify the environmental performance (Neto et al.,2003; Zobel and Burman, 2004; Hillary, 2004).
Aluminium is a widely used metal, in particular in the au-tomotive industry. The need to reduce vehicle fuel consump-tion by reducing the weight of the cars has increased theinterest in aluminium. For instance, the total mass of alumin-ium in an European car roughly doubled between 1990 and2000 (EIPPCB, 2005). The expected growth of the use of alu-minium to achieve lighter cars has an effect on the aluminiumdie casting industry. Aluminium pressure die casting isa manufacturing process in the non-ferrous industries producingengineered aluminium alloy products, such as car components.

148 B. Neto et al. / Environmental Modelling & Software 23 (2008) 147e168
Aluminium castings dominate the non-ferrous sector, com-prising roughly 80% of the light alloy castings on the Euro-pean aluminium market (CAEF, 2003). Pressure die castingis a widely used casting process for aluminium alloys andabout two-thirds of all aluminium castings are used in auto-motive industry (Brown, 1999).
The aluminium pressure die casting industry contributes toa number of environmental problems (Kim et al., 2003). Forinstance, it is a source of metal emissions to the environmentthat may be toxic to humans and other organisms. Moreover,this industry contributes to air pollution problems throughemissions of gases that contribute to tropospheric ozone for-mation, acidification, human toxicity and global warming.And finally, there are waste-related problems, potentially lead-ing to soil pollution.
Despite existing regulations, it is not easy to answer thequestion of how the environmental impact of an individualcompany can be reduced most effectively. There are toomany pollutants involved, and too many reduction optionsavailable, to easily get a good overview of the situation. Acomplicating factor is that many industrial processes resultin more than one pollutant. In addition, reduction options typ-ically not only reduce the pollutant that they are aiming to re-duce but may also have positive and negative side effects onother pollutants. And finally, industrial companies are notonly interested in the most effective way to reduce emissionsbut also in the most efficient way, in order to limit the costs ofenvironmental control (Geldermann and Rentz, 2004).
2. The need for tools to assess the environmental impact ofindustrial plants
Existing environmental systems analysis tools may assist ingetting insight into the complexity of the environmentalimpact caused by industrial systems. For instance, Life CycleAssessment (LCA) is a tool aiming to specify the environmen-tal consequences of products or services over its entire lifetime(Guinee, 2002; Rebitzer et al., 2004). Substance Flow Analy-sis (SFA) focuses on specific substances, either within a regionor through its entire life cycle; typical examples include stud-ies of nitrogen flows or flows of a specific metal (Kytzia andNathani, 2004; Finnveden and Moberg, 2005). Multi-criteriaAnalysis (MCA) is a tool to support the selection of the bestcombination of outcomes that have different dimensions, andit can assist in identifying trade-offs between different criteriaand finding the best solutions (Wrisberg et al., 2002). Environ-mental performance indicators (EPIs) are used to transformthe vast quantity of information of a firm in a comprehensiveand concise manner (Kolk and Mauser, 2002; Barbirolli andRaggi, 2003; Olsthoorn et al., 2001). At a firm level EPIsare mostly used to relate material and energy flows to othervariables (ISO, 1999; Jasch, 2000). Scenario analysis typicallyresults in a set of answers to ‘‘What . if’’ questions illustrat-ing the consequences of a range of alternative decisions(Schwarz, 1997; Pluimers, 2001). Technology assessmentsare used to analyse technological options to reduce the envi-ronmental impact. Some authors defend that many
possibilities to reduce the environmental burden of industrialproduction are present, such as optimisation of the environ-mental performance through good housekeeping, end-of pipetechniques, substitution of unfriendly products or by technol-ogy innovation (Moors et al., 2005). Cost effectiveness analy-sis (CEA) reveals the costs per unit of avoided emission(Rabah, 1999; Pluimers, 2001; Klimont et al., 2002). Totalcost accounting (TCA) describes the analysis of the full rangeof internal costs and savings resulting from pollution preven-tion projects and other environmental projects undertaken bya firm (Wrisberg et al., 2002).
Because of the complexity of most environmental issues,the above briefly described analytical tools are seldom appro-priate as a stand-alone tool for analysing environmental issues.In environmental analyses, therefore, often a combination oftools is used to analyse a particular problem. IntegratedAssessment (IA) Models typically combine a number of tools.However, these IA Models seldom take a company perspectivebut are rather developed to assist policy makers (Alcamo et al.,1990; Carmichael et al., 2004; Ball et al., 2005).
Industrial companies may use the systems analysis tools toanalyse how to keep the environmental impact of their pro-cesses within the limits, set by environmental legislation orhow to minimise the impacts in an economically feasibleway. This is not a simple task, the tools mentioned aboveare not, by themselves, appropriate to analyse an environmen-tal problem at the company scale. For instance, LCA is typi-cally developed for the analysis of a product, but not ofa company. Industrial companies use EPIs, but the result isa long list of emission estimates that do not give an answerto the question of what the overall environmental performanceis, or what is the best way to reduce these emissions. MCA isa useful tool to assess the overall environmental performance,but in itself not easily applied at the company level when theset of emission estimates is not consistent with the structure ofthe MCA. Scenario analysis is usually applied to investigatetrends at the sector or national level, but not often at the com-pany level, due to the site-specific information that would beneeded for that.
From the above it may be clear that there is a need fordecision-support systems, to help industrial management todecide on environmental control options for their particularcompany. The purpose of this study is therefore to developa model to analyse options to reduce the environmental impactof aluminium die casting. This model will take a company per-spective, so that it can be used as a decision-support tool forthe environmental management of a company. It will allowthe management of a company to decide on the environmentalstrategy to follow.
We refer to our model as MIKADO: model of the environ-mental impact of an aluminium die casting plant and optionsto reduce this impact. In the next sections, we will firstdescribe the MIKADO approach, the model parameters andactivities of an aluminium die casting plant. The latter sectionpresents the result of a sensitivity analysis, showing the sensi-tivity of the model results to uncertainties in selected parts ofthe model.
149B. Neto et al. / Environmental Modelling & Software 23 (2008) 147e168
3. Model description
3.1. Model design and structure
The MIKADO structure and the modelling approach arebased on the work of Van Langen who has developed ob-ject-oriented software for designing processes (DESIRE)(Van Langen, 2002). This software, and the language used init, provides a structure and a grammar to define objects, ob-jects’ properties and methods at multiple layers. The languagehas been developed to model design processes. Van Langenshows that his approach can be used in designing models forestimating the emissions from industrial processes. One ofVan Langen’s case studies deals with an emissions inventorymodel developed as a prototype system for an environmentalinventory of brick and tile fabrication in the Netherlands(Van Langen, 2002). The model described in this paper is anapplication of this approach and uses a software tool called Es-timatER developed by the European Topic Centre on Air andClimate Change to analyse and assess alternative pollutionreduction options (ETC/ACC, 2001). The software EstimatERis an interface tool. It has been used as a basis for assessmentsof emissions from the agriculture sector (ETC/ACC, 2001).
The basic ‘‘object’’ in MIKADO is a process. The objectcovers the full process and has information and material ex-change with the environment. The material exchanges of theprocess with its environment consist of: (a) the raw material,energy and any other subsidiary materials needed for the pro-cess and, (b) the output in terms of the products and any envi-ronmental pressures that might be caused by the process. Theinformation exchange of the process with its environmentconcerns the activity rate. Whether this information aboutthe activity rate is an input or an output is a matter of perspec-tive: if we are interested in managing the process, the activityrate could be seen as an input to the object. If, on the otherhand, the object is to describe a process with an endogenousmechanism to run it, it can be regarded as an output. The latterwill mainly occur in dynamic models of processes that containpositive or negative feedback loops. In our approach we aimfor a model that is to be used by the company’s management.Therefore, we subdivide the object process into several sub-processes or even, sub-sub-processes. Typically, a process ina plant can be decomposed into a series of consecutive andpossibly parallel sub-processes or even sub-sub-processesthat form the production line. This nested approach is usefulin further specifying the process and process characteristics.
In this study we are aiming for a static model that describesthe environmental pressures caused by a process. We thereforewill regard the information about the process activity rate asan input to the object. This rate can be expressed in differentways: it could be related to one of the inputs in the system orthe required outputs. The choice will depend on the type ofprocess modelled. In this study, the process is the productionof die cast aluminium car parts. To this end an existingsmall/medium size plant located in the northern part of Portu-gal served as a case study. Since we are building this model tobe used from a company’s management’s perspective, the
model considers a production rate of approximately3000 tons of aluminium die casting products as the modeldriver. The industrial plant studied provided most of the dataon inputs and outputs, such as material flows, energy use,emissions and waste production. The plant managers helpedto collect data for the inventory and answered process relatedquestions. The raw data collected were used to specify the rel-evant material flows at the level of sub-sub-processes by relat-ing them to the annual production rate of the plant. Theemission data found to be missing were estimated from the lit-erature, based on expert judgement or based on information onthe characteristics of materials used, provided by the plantsuppliers. In the model, the production rate is used to calculateall outputs and environmental pressures. The functions de-scribing the relation of the inputs, outputs and pressures toproduction are derived from the characteristics of the process.The model allows for manipulation of such process character-istics to implement possible reduction options influencing theenvironmental problems. By manipulating the process charac-teristics all functions might change. The modelling approach,as designed in DESIRE (Van Langen, 2002), provides thefunctionality for these manipulations.
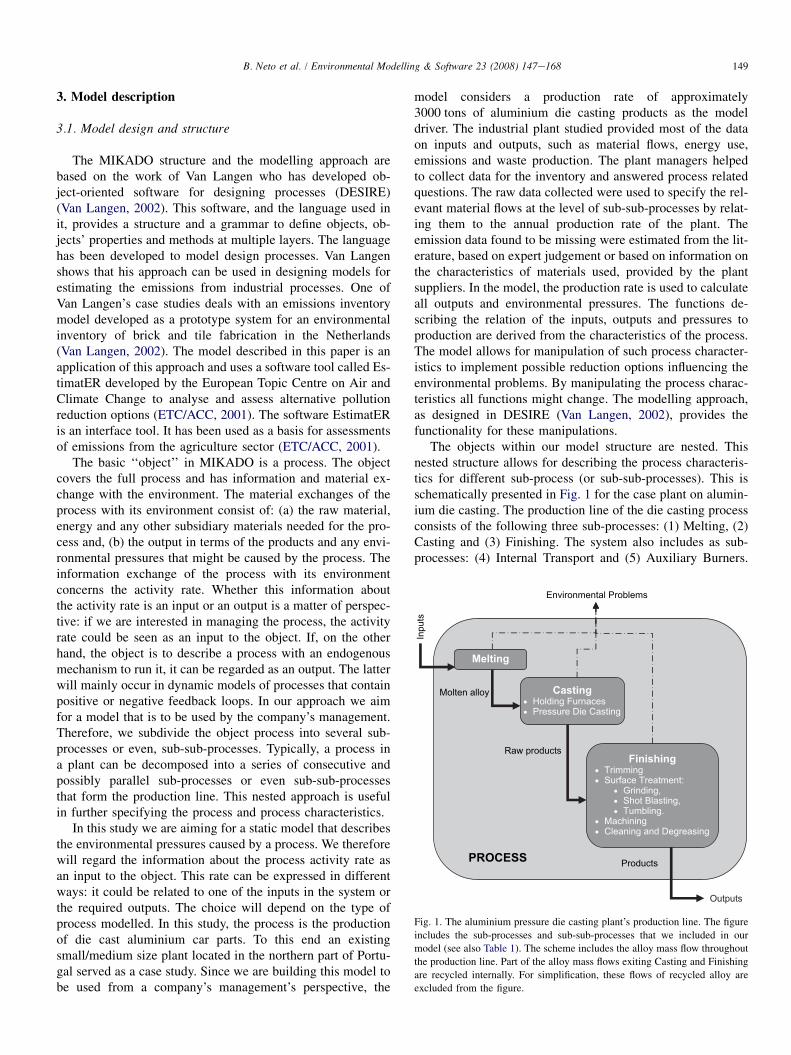
The objects within our model structure are nested. Thisnested structure allows for describing the process characteris-tics for different sub-process (or sub-sub-processes). This isschematically presented in Fig. 1 for the case plant on alumin-ium die casting. The production line of the die casting processconsists of the following three sub-processes: (1) Melting, (2)Casting and (3) Finishing. The system also includes as sub-processes: (4) Internal Transport and (5) Auxiliary Burners.
Inpu
ts
Casting
Holding Furnaces Pressure Die Casting
Finishing
TrimmingSurface Treatment:
Grinding,Shot Blasting,Tumbling.
MachiningCleaning and Degreasing
Molten alloy
Raw products
ProductsPROCESS
Environmental Problems
Melting
Outputs
Fig. 1. The aluminium pressure die casting plant’s production line. The figure
includes the sub-processes and sub-sub-processes that we included in our
model (see also Table 1). The scheme includes the alloy mass flow throughout
the production line. Part of the alloy mass flows exiting Casting and Finishing
are recycled internally. For simplification, these flows of recycled alloy are
excluded from the figure.

150 B. Neto et al. / Environmental Modelling & Software 23 (2008) 147e168
These are considered sub-processes that are independent of theannual production rate. In addition, the plant owns two waste-water treatment plants that are part of the die casting produc-tion line. These plants treat liquid effluents from Casting andFinishing.
The sub-processes of the production line (Melting, Castingand Finishing) are connected in series, since the output fromone sub-process is used as an input for the next one. The alloyentering the process includes ingots and alloy recycled inter-nally. The molten alloy, output from the Melting, feeds theCasting sub-process, yielding the raw products. The raw prod-ucts, in turn, are finished and leave the system as final prod-ucts. A small part of the aluminium leaves the system asemissions, either to air, water or as solid waste.
Obviously aluminium is not the only resource flowingthrough the system. Energy is needed to melt the alloy; a rangeof subsidiary materials is needed for many different purposesand investments, and operation costs need to be paid. In themodel, all these are derived from the production rate.
MIKADO has been structured so that each sub-process re-ceives all inputs from the earlier sub-processes it needs to deliverthe (semi)products. Wherever needed, a further detail in themodel is defined by decomposition of a sub-process into sub-sub-processes. The overall structure in terms of sub-sub-processof the die casting plant is described in detail in the next sections.
In summary, the model structure is based on the mass flowsthrough the successive steps in the production line giving riseto environmental problems. The inputs to MIKADO at thelevel of the aluminium die casting production line include, be-sides the subsidiary materials and energy, the alloy mass flowsas raw products use (ingots) and/or alloy mass recycled withinthe production line.
In addition, some of the costs of process operation and invest-ments are considered. The outputs of MIKADO include prod-ucts, semi-products, emissions of pollutants, waste and liquideffluents, alloy mass to be recycled within the process and thecosts of emission control. Moreover, the environmental perfor-mance of the plant is assessed in terms of one overall indicator.
3.2. Model formulation
The MIKADO’s core is formed by conservation of alumin-ium alloy mass throughout the production line. The alloy massflow presented in the model is determined by the productionrate. The production rate and the mass of alloy leaving the sys-tem at each sub-process level are readily available from theplant managers. But, within the MIKADO structure, the activ-ity data used refer essentially to the alloy mass flow enteringeach sub-process, so the raw data supplied were converted inorder to refer to the tonnage of aluminium alloy mass inputsper year into each sub-process. So, the model calculates thealloy input needs at each sub-sub-process level, for the produc-tion rate, by using the values of alloy mass emissions leavingthe sub-sub-process and also the amount of alloy mass re-cycled internally. In the manufacturing process the losses ofaluminium alloy during the process are emitted to the air orleave the system as solid wastes or liquid effluents. These
average values are plant specific and were made available bythe plant managers. The alloy losses occur in all the sub-pro-cesses from the production line. The losses in the sub-processMelting are due to air emissions (0.04% of the mass of alloyinputs) and aluminium dross (0.72% of the mass of alloy in-puts). In the sub-process Casting a small amount is lost asair emissions (0.0005% of the alloy entering the Castingsub-process). In addition, in the Casting process the runnersand biscuits (40% of the alloy entering Casting) and scrapthat are internally recycled (6% of the alloy entering Casting)are produced. Finally, the sub-process Finishing produces alu-minium burrs (4% of the alloy entering Finishing) and scrap tobe internally recycled (7.5% of the alloy entering Finishing).All these losses are obviously compensated by approximately6% higher input of ingots as compared with finished products.The alloy mass losses in the liquid effluents are neglected inthis study because aluminium losses value less than 0.001%of the mass of input alloy.
The aluminium mass flow diagram is presented in Fig. 2 forthe annual production rate (approximately 3000 tons of alu-minium die casting products). The figure, moreover, includesthe alloy mass leaving the system for the sub-processes:(1) Melting, (2) Casting and (3) Finishing. From the figure,it is also clear that the molten alloy entering sub-processMelting is at least twice the production rate; this is due tothe fact that the alloy mass includes the alloy recycled inter-nally and the ingots of aluminium alloy. Thus, the shot weight(the shot is the semi-product from Casting that includes the fi-nal products plus the excess of materials (runners and biscuits)needed to allow the molten metal to fulfil the die castingmoulds) consists, for the specific plant, of a mixture of approx-imately 50% ingot and 50% internal recycled aluminium alloy.
Table 1 shows the alloy mass input in each sub-sub-processand the related activities (materials or energy usage) at thesub-sub-process level for the industrial plant. The materialsand energy inputs are identified for each sub-sub-process leveland refer to the alloy mass flow entering each sub-process. Forinstance, the amount of natural gas used in the sub-processMelting is directly dependent of the amount of alloy input to
alloy losses =
1%
alloy losses <
0.1%
alloy losses =
2%
Products (47%)Ingots (50%)
Recycled (50%)
Mel
ting
(p1)
Cas
ting
(p2)
Fini
shin
g (p
3)
Fig. 2. Alloy mass flow on the existing aluminium pressure die casting plant.

151B. Neto et al. / Environmental Modelling & Software 23 (2008) 147e168
Table 1
Alloy mass inflow (AL) and type of activities (a) by sub-sub-process ( pij)
Process ( p) Sub-process ( pi) Sub-sub-process ( pij) Activities
AL a
Die casting plant Melting (i¼ 1) Melting Annual mass of alloy input to Melting Desoxidation agent
Degassing flux
Natural gas
Casting (i¼ 2) Holding furnaces Annual mass of alloy input to
Holding Furnaces
Ceramic lining
Pressure die castinga Annual mass of alloy input to
Pressure Die Casting
Mould release agent
Water
Hydraulic oil
Tip lubricant
Other oils
Antifoam
Sodium hydroxide
Polyelectrolyte
Flocculation agent
Finishing (i¼ 3) Trimming Annual mass of alloy input
to Trimming
e
Surface treatment Grinding Annual mass of alloy input
to Grinding
e
Shot blasting Annual mass of alloy input
to Shot Blasting
Steel shot
Tumblingb Annual mass of alloy input
to Tumbling
Ceramic abrasives
Water
Splitting agent
Machining Annual mass of alloy input
to Machining
e
Cleaning and degreasinga Annual mass of alloy input to
Cleaning and Degreasing
Water
Detergent
Antifoam
Sodium hydroxide
Polyelectrolyte
Flocculation agent
Internal Transport (i¼ 4)c Fork lift trucks on
diesel (I and II)
e Diesel
Fork lift truck on LPG Propane use
Auxiliary Burners (i¼ 5)c Oxyacetylene burners e Acetylene and oxygen
Butane burners Butane
Based on an existing aluminium pressure die casting plant and assuming no reduction options implemented on the plant.a Both liquid effluents leaving the sub-sub-processes Pressure Die Casting and Cleaning and Degreasing are treated in the same wastewater treatment plant. Thus,
some of the agents (activities, such as: antifoam, polyelectrolyte, etc.) used in the treatment plant are allocated to these sub-sub-processes.b The liquid effluent leaving this process is treated in a specific wastewater treatment plant. The agent needed (splitting agent) is allocated to this sub-sub-
process.c The activities from sub-processes Internal Transports and Auxiliary Burners are considered to be independent of the annual production rate.
the same sub-process. These activities are summed up at thefirm level.
Emissions and waste production are calculated by themodel as a function of the activity rate (Act), within sub-sub-process ( pij). The activity rate measures the use of mate-rials or energy in each sub-sub-process. The emissions arecalculated assuming a linear relation between the activityrate and a specific emission of a pollutant (x). The proportion-ality constant is called the emission factor (EF). The totalemission (Ex) is calculated by summing all emissions of pol-lutant (x) resulting from the use of all activities (a) in allsub-sub-processes ( pij).
Eqs. (1)e(14) are used to calculate the emissions, the activ-ity rates, the environmental impact and the costs. Box 1 pres-ents all the equations and describes all the parameters andvariables.
Eq. (1) is generic and calculates the emission of a pollutant ateach sub-process level ( pi). The equation is used for all the dif-ferent types of emissions (air, liquid effluent and solid waste).
Emissions of the pollutants may result directly from the useof an activity (a) (such as natural gas), the alloy mass, or con-sidered to be independent of the alloy mass flows (in the caseof fuel use in internal transports).
Thus, the activity rate in each case is determined by: (a) theuse of an activity that is directly dependent of alloy mass (Eq.(2a)); (b) the annual alloy mass consumption (Eq. (2b)) or (c)the annual use of a certain activity considered independent ofalloy mass (Eq. (2c)).
In Eq. (2a) the activity rate is the use of a certain activityfunction of the alloy mass flow. This equation allows for thecalculations of emissions to air, nonrelated alloy solid wastesand liquid effluents with exception to: (a) air emissions of

152 B. Neto et al. / Environmental Modelling & Software 23 (2008) 147e168
metals and alloy related solid wastes (such as aluminiumdross) and, (b) emissions resulting from Internal Transportsand Auxiliary burners.
Eq. (2b) calculates the amount of metal pollutants or metalrelated solid wastes (x) emitted from sub-process ( pi). Themetal emissions are originated on alloy inputs in each sub-sub-process. Therefore, the emissions of, for instance, alumin-ium, in sub-process Melting, refers to the amount of alloyentering this sub-process.
In Eq. (2c) the activity rate refers to the use of an activity(fuel use) that is used in the sub-processes Internal Transportand Auxiliary Burners. These are, as described above, inde-pendent of the production rate. The equation allows for thecalculation of emissions of combustion.
In this case the same pollutant is released in different sub-processes and the total amount is summed up within differentsub-processes. The overall emission from the process p iscalculated by Eq. (3), where the emission of pollutant (x) iscalculated as a result of the sum of all emissions in all sub-processes.
The impact assessment methodology used follows threesteps, in line with current approaches in Life Cycle Assess-ment and Multi-criteria Analysis (Pennington et al., 2004):(1) characterisation (Guinee, 2002), (2) normalisation (Huij-bregts et al., 2003) and (3) weighting (or valuation) (Kortmanet al., 1994; Goedkoop, 1995; van de Kamp, 2005).
The potential environmental impacts are assessed for thedepletion of natural resources, emissions, solid waste and liq-uid effluents resulting from the industrial plant. The potentialenvironmental impact categories (z) are: the human toxicity,terrestrial ecotoxicity, global warming, acidification, photo-chemical ozone formation, abiotic depletion, aquatic toxicityand solid waste production.
Eq. (4) calculates the overall potential environmental im-pact of sub-process ( pi) using characterisation factors (CF),normalisation factors (NF) and weighting factors (WF).
Eq. (5) presents the calculation of the overall potentialenvironmental impact (M ). It results in the sum of potentialenvironmental impacts for each sub-process ( pi).
The calculation of the impact (Mz) related with the environ-mental impact category (z) for the sub-process ( pi) is derivedfrom Eq. (4).
The model formulated in Eqs. (1)e(5) reflects the zerocase, describing the current industrial process operation, as-suming that no pollution reduction options are implemented.Nevertheless, MIKADO is designed in such a way that pollu-tion reduction options can be added to analyse the reduction inthe amount of pollutants released. The model interface allowsfor selecting or de-selecting options. In Table 2, an overviewof the reduction options by sub-sub-processes is given. Reduc-tion options can either be an abatement technique added to theprocess, a different technique or a change in process operation.Within the types the individual reduction options are consid-ered mutually exclusive. The pollution reduction options aimfor pollution reduction at the specific sub-sub-process ( pij)where they are located, but it may have an effect on the emis-sions reduction at another sub-process level.
Eq. (6) presents how the emissions of pollutants are calcu-lated for each sub-process when an individual reduction option(t) is implemented. Again Eqs. (2a)e(2c) are used to calculatethe specific emissions in terms of their dependency of the pro-duction rate or the alloy mass. The equation is also valid whentwo or more reduction options are implemented. Within thesame sub-process the emission of pollutant (x) may changedue to changes in the reduction factor, or activity rate, or emis-sions factor, or a combination of these three.
In some cases a reduction option introduces an extra activity(Xa). For instance, the option Impeller station (Melting_IS)induces the use of the gas N2 as an extra activity rate (Actxa).Eq. (7) is generally used to calculate the pollutants emittedbut the extra activity may be calculated differently. On theone hand, the extra activity may be induced by the use ofa new activity that depends on the production rate (then Eq.(8a) is used) or for the case when the extra activity is mainlydue to the alloy mass flow, as in the case where an add-ontechnique is implemented (this leads to the production of anextra activity like, for instance, the dust collected from baghouses or the sludge formed when wet scrubbers areimplemented). In this last case, emission factors for the abate-ment situation are used. Eq. (8b) calculates the extra activityrate for that case.
The implementation of each individual reduction has anassociated cost. The costs are calculated including the fixedcosts (equipment investments and the fixed operational costs)and the variable costs as well (the costs of equipment opera-tion). The costs are calculated in Eqs. (9)e(14).
The costs are regarded as additional costs for emissionabatement options (in line with Geldermann and Rentz,2004). The fixed costs of individual reduction options arecalculated using Eqs. (9) and (10). Eq. (9) calculates the totalannual investment cost, taking into account the interest rate (r)and equipment lifetime (lt). Eq. (10) calculates the fixed oper-ational costs as a fraction (ot) of investment. The parametersin these equations are provided for all reduction options.
Operational costs for the die casting production line are di-rectly dependent on the aluminium alloy mass inputs, with theexception of the internal transports and auxiliary burners, forwhich the operational costs depend on the activityefuel use.Nevertheless, in both situations the operational costs are calcu-lated using the activity level (a), a potential use of an extraactivity (Xa) and the activity’s unit price (P), that makes thecost calculation analogous to the materials and energy usesand also similar to emission calculations.
A distinction is made for the zero case and the situation forwhich one or more reduction options are used. Eq. (11) pres-ents how the operational costs are calculated for the zero case.The quantification of total operational costs, as stated before,is not aimed at only the costs of aluminium ingot, materialsand energy uses that may change by a reduction option are cal-culated. For sub-processes Internal Transports and AuxiliaryBurners, the operational costs for the zero case are a functionof the activity rate (fuels used) and the fuel unit price.
Eq. (12) is used when one or more reduction options areimplemented. Simultaneously, the operational costs for

Table 2
Overview of pollution reduction options for an aluminium pressure die casting plant
educed
such as Cd, Ni, Pb, Cr
such as Cd, Ni, Pb, Cr
such as Cd, Ni, Pb, Cr
(Cd, Ni, Pb, Cr), Cu and HF
(Cd, Ni, Pb, Cr), Cu and HF and NMVOC
m dross
dross
x, and NMVOC
ombustion related emissions)
x, and NMVOC
ombustion related emissions)
x, and NMVOC
ombustion related emissions)
issions
(Pb, Cr), Cu, Zn, NMVOC
(Pb, Cr), Cu, Zn, NMVOC
id effluent and oils and grease
id effluent and oils and grease
(Cd, Ni, Pb, Cr), Cu, Zn, HF, CO2, CO, NOx,
solid wastes, liquid
ils and grease
(Cd, Ni, Pb, Cr), Cu, Zn, HF, CO2, CO, NOx,
solid wastes, liquid
ils and grease
(Cd, Ni, Pb, Cr), Cu, Zn, HF, CO2, CO, NOx,
solid wastes, liquid
ils and grease
x, and NMVOC, SO2 and Particulates
tion related emissions)
nd scrap rates were modified leading to values 15
3B
.N
etoet
al./
Environm
entalM
odelling&
Software
23(2008)
147e168
Sub-process ( pi) Sub-sub-process ( pij) Types of options Reduction options (t) Abbreviation Compounds r
Melting (i¼ 1) Melting Abatement techniques Fabric filter. Reverse-air typea Melting_FF_RA Heavy metals
Fabric filter. Pulse-jet typeb Melting_FF_PJ Heavy metals
Fabric filter. Mechanical
shaker typecMelting_FF_MS Heavy metals
Wet scrubber.
Impingement-plate typedMelting_WS_IP Heavy metals
Wet scrubber.
Spray-chamber typeeMelting_WS_SC Heavy metals
Desoxidation agent Granular desoxidation agentf Melting_GA HF, Aluminiu
Degassing technique Impeller station using N2f,k Melting_IS HF, aluminium
Metal loading on
furnaces
Compact metal loadg Melting_CM CO2, CO, NO
(natural gas c
Combustion process Air enrichment (30% O2)g Melting_AE CO2, CO, NO
(natural gas c
Oxyfuel firingg Melting_OF CO2, CO, NO
(natural gas c
Casting (i¼ 2) Holding furnaces Holding temperature Reduce holding temperatureg Casting_rHT All metals em
Pressure die casting Abatement techniques Wet Scrubber. Packed-bed typeh Casting_WS_PB Heavy metals
Wet scrubber. Spray-chamber typee Casting_WS_SC Heavy metals
Mould release agent
application technique
New mould release agentg Casting_nMA NMVOC, liqu
Powder agenti,k Casting_PA NMVOC, liqu
New die casting moulds Reduce runner ratej,l Casting_rRR Heavy metals
and NMVOC,
effluent and o
Reduce scrap rate Reduce scrap ratek,l Casting_rSR Heavy metals
and NMVOC,
effluent and o
Finishing (i¼ 3) Trimming Reduce scrap rate Reduce scrap ratek,l Finishing_rSR Heavy metals
and NMVOC,
effluent and o
Internal Transport (i¼ 4) Forklift truck on
diesel and LPG
Electric equipment Use electric fork lift trucksg IT_eFL CO2, CO, NO
(Fuel combus
Auxiliary Burners (i¼ 5) Oxyacetylene burners Mechanical equipment Use mechanical equipmentg AB_ME CO2
(a)e(e) and (h) are USEPA Air pollution control technology fact sheet. EPA-CICA Fact Sheet. USEPA (2002).
See Neto et al. (submitted for publication-b) for a detailed description of the reduction options.a EPA-452/F-03-026.b EPA-452/F-03-025.c EPA-452/F-03-024.d EPA-452/F-03-012.e EPA-452/F-03-016.f Brown (1999).g Pedro (2005, personal communication).h EPA-452/F-03-015.i Kluber (2005).j INETI (2000).k EIPPCB (2005).l These reduction options may change the value of the metal yield. For some reduction strategies, where these three reduction options were used, the runners’ mass a
of metal yield equal to 57% (EIPPCB, 2005).
154 B. Neto et al. / Environmental Modelling & Software 23 (2008) 147e168
combined options result from the sum of activities and extraactivities multiplied by the respective unit price. Eq. (13)shows how the total costs are calculated for the implementa-tion of one or more reduction options at the firm level. Eq.(14) calculates the net additional costs (Cna) resulting fromthe implementation of one or more reduction options. Totalcosts for the situation zero case equal the operational costsin the zero case ðCzerocase ¼ CVzerocaseÞ.
4. Model parameters and activities of aluminium diecasting plant
The model described above contains a number of parame-ters that need to be quantified. The Portuguese industrial plantprovided information about the production process andspecific annual data of process inputs and outputs, such as ma-terials, energy, emissions, liquid effluents, and waste produc-tion. Also other information used in the model, such as alloymass flows and recycling was readily available from this plant.Missing data were either estimated from the literature basedon expert judgement, or based on information provided byindustrial suppliers.
This section presents the values used in the description ofthe die casting process, as used in the model. These values in-clude the activity rates, emission factors, reduction factors andextra activity rates, investments and variable costs and the fac-tors (classification, normalisation and weighting factors) usedon the environmental impact assessment. During MIKADOruns, the user might change these parameters to values thatbetter describe the processes in another plant.
4.1. Activity data
Since the model is driven by the production rate, the core ofthe model is formed by the aluminium alloy mass flowthroughout the production line. A closer look into the connec-tions of the sub-sub-processes within the die casting produc-tion line (Fig. 1) reveals a number of additional aluminiumflows between the different sub-processes. The Casting sub-process leads to raw products that are still connected to thebiscuits and runners. These are the channels through whichthe molten aluminium is transported into the die castingmoulds. After casting, the raw products are separated fromthe biscuits and runners, and the alloy in these biscuit and run-ners is recycled back into the Melting sub-process. The massin the biscuits and runners is of the same order of magnitudeas the mass in the raw products. In addition, a small part of theproducts resulting from the sub-process Finishing is discardedbecause of non-compliance with client or internal specifica-tions. These are also fed back into the Melting sub-process.The activity data related with the alloy mass flow are previ-ously referred above in Section 3.2.
The remaining activity data concerning the use of subsidiarymaterials and energy are derived from the plant’s raw data. Theactivity rates (Acta) are presented by sub-sub-process level( pij). For the aluminium production line, the activities arecalculated in terms of alloy mass inflow for each sub-process
on an annual basis (Table 3 and Box 1). In the other cases wherethe activity rates (Acta) are considered to be independent fromthe production rate, such as in the sub-processes Internal Trans-ports and Auxiliary Burners (Table 3 and Box 1), they refer tothe annual fuel consumption.
Table 3 summarises the annual activity characteristics ofeach sub-process for MIKADO. The activity factors are easilyconverted from the plant raw data after knowing the alumin-ium alloy losses at the sub-process level. These activity factors(AFa) are expressed in terms of the tonnage of aluminiumalloy mass inputs per year into each sub-process. The activityrates (Acta) are reported by the facility or derived by the activ-ity factors, by knowing the alloy entering each sub-process.
4.2. Emission factors
The emission factor describes the relation between the ac-tivity rate and the emission for a specific pollutant. Emissionfactors are calculated from annual activity rates for each sub-process. There are different ways to quantify emissions.These include direct measurements, mass balance calcula-tions, process based modelling, inverse inference and theemission factor approach (Frey and Small, 2003). The emis-sion factor approach is the simplest one and typically usedin environmental studies of economic sectors (e.g. Pluimers,2001; Winiwarter and Schimak, 2005) or by country (e.g.IPCC guidelines, 1997; Zarate et al., 2000). The emissionfactor calculation performed here differs in scope in termsof process and location from the literature investigated. Theemission factors presented in this paper are process specificand are mainly derived from average emission measurementscarried out at the facility in combination with the known alloyflows, energy consumption and the use of subsidiary mate-rials. When no measures were available, emission factorswere then estimated based on mass balance calculations, spe-cific literature data or provided by equipment suppliers. Theplant’s suppliers made materials’ characteristics available.The emission factors for each sub-sub-process are presentedin Table 4.
4.3. Reduction factors and extra activities
The implementation of reduction options leads to a decreasein the pollution. Several reduction options were defined for thedie casting plant; they are process specific and were proposedby industrial facility managers or found in specialised litera-ture. Table 2 (Section 3.2) gives an overview of the 20pollution prevention options included in our model. These re-duction options are either add-on technologies, the replace-ment of an existing technique or a change in processoperation. These reduction options reduce the original emis-sion factors, change the activity rates (such as: energy con-sumption) or in the case of add-on technologies, might adda reduction factor responsible for the pollution abatement.When add-on technologies are used, the reduction factors ofone or more pollutants are well known and available in litera-ture. Values of reduction factors (RF) per reduction option

155B. Neto et al. / Environmental Modelling & Software 23 (2008) 147e168
Table 3
Activity factors (AF) and activity rates (Act) for each type of activity (a) by sub-sub-process ( pij) for the calculation of emissions from an aluminium die
casting plant
Sub-process ( pi) Sub-sub-process ( pij) a AFaij Actaij Unit
Melting Melting Desoxidation agent 1.033 e kg/ton alloy
Degassing flux 0.138 e kg/ton alloy
Natural gas 5.170a e GJ/ton alloy
Casting Holding furnaces Ceramic lining 0.249 e kg/ton alloy
Pressure die casting Mould release agent 10.50 e liters/ton alloy
Water 1.03b e m3/ton alloy
Hydraulic oil 8.56 e liters/ton alloy
Tip lubricant 1.20 e liters/ton alloy
Other oils 2.77 e liters/ton alloy
Antifoam 0.037c e liters/ton alloy
Sodium hydroxide 0.025c e liters/ton alloy
Polyelectrolyte 0.020c e liters/ton alloy
Flocculation agent 0.25c e liters/ton alloy
Finishing Surface treatment Shot blasting Steel shot 4.95 e kg/ton alloy
Tumbling Ceramic abrasives 7.68 e kg/ton alloy
Water 0.000322b e m3/ton alloy
Splitting agent 0.38c e kg/ton alloy
Cleaning and degreasing Water 0.0075 e m3/ton alloy
Detergent 0.053d e liters/ton alloy
Antifoam 0.000342c e liters/ton alloy
Sodium hydroxide 0.000243c e liters/ton alloy
Polyelectrolyte 0.000197c e liters/ton alloy
Flocculation agent 0.003c e liters/ton alloy
Internal Transport Fork lift trucks on diesel
(I and II)
Diesel I e 18304 kg/year
Diesel II e 10610 kg/year
Fork lift trucks on LPG Propane e 17680 liters/year
Auxiliary Burners Oxyacetylene burners Acetylene e 119 kg/year
Oxygen e 366 kg/year
Butane burners Butane e 968 kg/year
The activity factors refer to the tonnage of molten alloy used in each sub-sub-process.a Implied activity factor; in the model the gas consumption is calculated based on heat needed to melt the alloy and the furnace thermal efficiency (heat of
combustion¼ 39.96 MJ/m3, from Transgas (2005, personal communication).b Implied activity factor; the model includes a mass balance for water.c Implied activity factor; in the model the emissions are calculated as a fraction of liquid effluent, which in turn is a fraction of ton alloy.d Implied activity factor; in the model the detergent consumption is calculated as a fraction of water use, which in turn is a fraction of ton alloy.
using an add-on technology are available in Neto et al. (sub-mitted for publication-b). In addition, the reduction optionsmay also influence the activity rate itself either by alteringthe amount of materials or energy used, or by introducing anextra activity in the industrial process or through a combinationof both situations. Neto et al. (submitted for publication-b)also includes the changes in the activity rates (Acta) andextra activity rates (Actxa) relative to the zero case when anindividual reduction option (t) is implemented.
4.4. Investments and variable costs
The total annual costs (C ) (Eq. (13) of Box 1) are calcu-lated based on fixed and variable costs. When a reduction op-tion is used, investments are needed. The total annual fixedcosts are calculated by two components: the investment costsand the fixed operational costs. Variable costs are related tomaterials and energy uses and to the production rate. Table 5shows an overview of cost-related parameters per reductionoption. Table 6 summarises the unit prices for the activity data.
4.5. Environmental impact assessment
Potential environmental impacts are assessed for depletionof natural resources, air emissions, solid wastes and liquideffluents resulting from the industrial plant. The potentialenvironmental impact categories or environmental problems(z) resulting from the operation of the industrial processinclude
� human toxicity,� terrestrial ecotoxicity,� global warming,� acidification,� photochemical ozone formation,� abiotic depletion,� aquatic toxicity,� solid waste production.
The environmental impact is calculated based on the energyuse or emissions of compounds from the industrial plant thatare either reported by the plant or estimated based on the

156 B. Neto et al. / Environmental Modelling & Software 23 (2008) 147e168
Table 4
Emission factors (EF) by sub-process ( pij) referred to the tonnage of molten alloy used in each sub-sub-process
Sub-process ( pi) Sub-sub-process ( pij) Pollutant (x) EFij;aij;x Emission factor units
Melting Melting Aluminium 0.3945a kg/ton molten alloy
Cadmium 0.000196a kg/ton molten alloy
Nickel 0.000151a kg/ton molten alloy
Lead 0.000947a kg/ton molten alloy
Chromium 0.000124a kg/ton molten alloy
Copper 0.00168a kg/ton molten alloy
Hydrogen fluoride 0.0534b kg/kg degassing flux
Hydrogen Fluoride 0.224b kg/kg desoxidation agent
Dross 0.949c kg/kg degassing flux
Dross 0.788c kg/kg desoxidation agent
CO 30.03d g/GJ
CO2 65.11d kg/GJ
NOx 186d g/GJ
NMVOC 2.1d g/GJ
Casting Holding furnaces Aluminium 0.00489a kg/ton casted alloy
Zinc 0.00763a kg/ton casted alloy
Lead 0.000611a kg/ton casted alloy
Chromium 0.000458a kg/ton casted alloy
Copper 0.00366a kg/ton casted alloy
Iron 0.0370a kg/ton casted alloy
Ceramic lining wasted 0.237e kg/ton casted alloy
Pressure die casting NMVOC 0.00892a kg/l mould release agent
Liquid effluent 0.76f m3/ton alloy
Finishing Surface treatment Shot blasting Steel shot 0.27c kg/kg steel shot
Tumbling Ceramic abrasives 0.43c kg/kg ceramic abrasives
Liquid effluent 0.000064f m3/ton alloy
Machining Burrs 0.0389c kg/ton finished alloy
Cleaning and degreasing Liquid effluent 0.0074f m3/ton alloy
Internal Transport Fork lift
trucks on diesel (I)
CO2 76.92g kg/GJ
NOx 0.54g kg/GJ
CO 0.08g kg/GJ
Particulates 0.01g kg/GJ
SO2 0.11g kg/GJ
NMVOC 0.03g kg/GJ
Fork lift
trucks on diesel (II)
CO2 95.69g kg/GJ
NOx 0.64g kg/GJ
CO 0.15g kg/GJ
Particulates 0.02g kg/GJ
SO2 0.13g kg/GJ
NMVOC 0.07g kg/GJ
Fork lift
trucks on LPG
CO2 67.48g kg/GJ
NOx 1.67g kg/GJ
CO 0.02g kg/GJ
NMVOC 0.02g kg/GJ
Auxiliary Burners Oxyacetylene burners CO2 67.80h kg/GJ
Butane burners CO2 65.41i kg/GJ
NOx 0.0688i kg/GJ
CO 0.0096i kg/GJ
NMVOC 0.0027i kg/GJ
Particulates 0.0027i kg/GJ
For sub-processes Internal Transport and Auxiliary Burners, EF is referred to the annual fuel use. Based on an existing aluminium pressure die casting plant and
assuming no reduction options implemented in the plant.a Emissions to air. Emission factor derived from annual average pollutant concentrations (mg/m3) measured at the industrial plant. Pedro (2005, personal
communication).b Emission to air. Emission factor derived from fluorine contents of desoxidation agent and degassing flux. Pedro (2005, personal communication).c Solid waste. Emission factor derived from the composition of desoxidation agent and degassing flux used. Pedro (2005, personal communication).d Emission to air. Average value for emission factor related with natural gas use, derived from range present. EMEP/CORINAIR (2004).e Solid waste. Emission factor from EIPPCB (2005).f Liquid effluent. Implied emission factor; the model includes a mass balance for water. The emission factor is derived from annual water consumption and losses
at the industrial plant. Pedro (2005, personal communication).g Emissions to air. Emission factor made available from Salvador Caetano, S.A and the annual forklift working hours. Monteiro (2004, personal communication).h Emission to air. Emission factor derived from annual acetylene consumption. Pedro (2005, personal communication).i Emission to air. Emission factor related with butane use. Pedro (2005, personal communication).

157B. Neto et al. / Environmental Modelling & Software 23 (2008) 147e168
Table 5
Cost parameters (I, lt, oj) used for the calculation of the overall annual fixed costs (CIþCO)
Types Reduction options (t) Investment
(I) in (kV)
Lifetime
(lt) in
(years)
Annualised capital
cost (CI) in
(kV/year)m
Fraction of
investments
(ot) in
(fraction/year)n
Fixed cost
(CO) in
(kV/year)o
Variable cost
(CV) in
(kV/year)p
Abatement techniques Fabric filters: reverse-air type 675a 20a 64 0.03 20 5315
Fabric filters: pulse-jet type 206b 20b 19 0.03 6 5315
Fabric filters: mechanical
shaker type
574c 20c 54 0.03 17 5315
Wet scrubber: impingement-
plate type
86d 15d 9 0.03 3 5316
Wet scrubber: spray-chamber
type
49e 15e 5 0.03 1 5316
Desoxidation agent Granular desoxidation agent 0 0 0 0 0 5315
Degassing technique Impeller station using N2 55f 10l 8 0.03 2 5364
Metal loading
on furnaces
Compact metal load 140g 10l 20 0.04 6 5162
Combustion process Air enrichment (30% O2) 0 0 0 0 0 5374
Oxyfuel firing 170h 10l 24 0.03 5 5510
Holding temperature Reduce holding temperature 0 0 0 0 0 5315
Abatement techniques Wet scrubber: packed-bed
type
1396i 15i 153 0.03 42 5315
Wet scrubber.
Spray-chamber type
155e 15e 17 0.03 5 5315
Mould release
agent application technique
New mould
release agent
0 0 0 0 0 5257
Powder agent 220j 10l 31 0.04 9 5421
New die casting moulds Reduce runner rate 1140k 10l 162 0.04 46 5226
Reduce scrap rate Reduce scrap rate 0 0 0 0 0 5285
Reduce scrap rate Reduce scrap rate 0 0 0 0 0 5279
Electric equipment Use electric fork lift trucks 57g 10l 8 0.02 1 5267
Mechanical equipment Use mechanical equipment 1g 10l 0.11 0.02 0 5314
(a)e(e) and (i) are USEPA Air pollution control technology fact sheet - EPA-CICA Fact Sheet.
Model results for the variable costs (CV). These fixed and varuable costs of reduction options are applicable to the die casting facility. The variable cost for zero
case (CVzerocase) is 5315 kV/year. See Neto et al. (submitted for publication-b) for a detailed description of the reduction options.a EPA-452/F-03-026.b EPA-452/F-03-025.c EPA-452/F-03-024.d EPA-452/F-03-012.e EPA-452/F-03-016.f EIPPCB (2005).g Pedro (2005, personal communication).h Praxair (2005, personal communication).i EPA-452/F-03-015.j Kluber (2005).k INETI (2000).l Assumed to be 10 years.
m The annualised capital costs (CI) is calculated by Eq. (9) (see Box 1).n USEPA (2002) and Klimont et al. (2002).o The fixed cost (CO) is calculated by Eq. (10) (see Box 1).p The variable costs (CV) is calculated by Eq. (12) (see Box 1).
industry-specific relevant literature. This energy use and emis-sions contribute to a range of environmental pollution prob-lems. We have selected the impact categories based on thepotential contribution to each environmental problem. Webased our choices on the environmental impact categorieslisted in typical LCA literature (e.g. CML, 2002). For the en-vironmental problem abiotic depletion the consumption of nat-ural gas is used as an indicator for the use of non-renewableresources. The impact category aquatic toxicity indicates theamount of liquid effluent produced by the plant and solidwaste is an indicator of the amount produced.
Following the current practice in Life Cycle Assessment andMulti-criteria Analysis, the environmental impact assessmentin MIKADO includes three steps (Pennington et al., 2004):(1) characterisation, (2) normalisation and (3) weighting. Inthis last step, also referred to as valuation, we use four differentmulti-criteria methods. The different methods used include theuse of factors expressing alternative views on valuation, the dif-ferent environmental problems that the plant contributes for. Byusing multi-criteria methods the impact is presented in terms ofone single indicator expressing the overall environmental im-pact caused by the industrial plant.

158 B. Neto et al. / Environmental Modelling & Software 23 (2008) 147e168
Table 6
Price of aluminium ingot, activities (Pa) and extra-activites (Pxa)
Parameter Price Unit References
Acetylene 9.21 V/kg Praxair (2005, personal
communication)
Aluminium dross
transfer
37 V/ton Pedro (2005, personal
communication)
Aluminium ingot 1.54 V/kg Pedro (2005, personal
communication)
Antifoam 2.1 V/liter Pedro (2005, personal
communication)
Butane 1.04 V/kg GALP (2004, personal
communication)
Ceramic abrasives 1.02 V/kg Pedro (2005, personal
communication)
Degassing flux 2.8 V/kg Pedro (2005, personal
communication)
Desoxidation agent 1.32 V/kg Pedro (2005, personal
communication)
Detergent 1.86 V/liter Pedro (2005, personal
communication)
Diesel 0.91 V/liter GALP (2004, personal
communication)
Flocculation agent 0.25 V/liter Pedro (2005, personal
communication)
Gas N2 3.26 V/m3 Praxair (2005, personal
communication)
Granular agent 1.3 V/kg Foseco (2005, personal
communication
Hydraulic oil 1.05 V/liter Pedro (2005, personal
communication.
Mould release agent 1.53 V/liter Pedro (2005, personal
communication.
Natural gas 0.33 V/m3 Pedro (2005, personal
communication.
New mould release agent 1.7 V/liter Pedro (2005, personal
communication.
Oils and grease transfer 51 V/ton Pedro (2005, personal
communication.
Other oils 0.74 V/liter Pedro (2005, personal
communication. Average
of three different oils used
on the die casting machines.
Oxygen 0.13 V/m3 Praxair (2005, personal
communication.
Polyelectrolyte 2.84 V/liter Pedro (2005, personal
communication.
Powder agent 55 V/kg Kluber (2005), personal
communication
Propane 1.23 V/kg GALP (2004, personal
communication
Sludge to disposal 220 V/ton Pedro (2005, personal
communication)
Sodium hydroxide 0.17 V/liter Pedro (2005, personal
communication)
Splitting agent 3.37 V/kg Pedro (2005. personal
communication)
Steel shot 0.59 V/kg Pedro (2005, personal
communication)
Tip lubricant 1.37 V/liter Pedro (2005, personal
communication)
Waste to disposal 200 V/ton Pedro (2005, personal
communication)
Water 1.5 V/m3 Pedro (2005, personal
communication)
The aluminium die casting plant provided the prices presented for the zero
case. The prices for material use on the reduction options were in some cases
provided by the case plant but mostly provided by the die casting industry
suppliers.
All emissions contributing to a specific environmental prob-lem were aggregated in one single value by multiplying witha characterisation factor (CF). For the characterisation stepthe methodology of Guinee (Guinee, 2002) was used. OurCFs are largely default values from the literature (as in thecase of CF for abiotic depletion, global warming, acidificationand photochemical ozone formation). In case several valuesfor CFs were available, we used the highest values reported (in-finite time horizon persistency) making our analysis in a waya worst case assessment (as for the cases of toxicity humanand terrestrial). CF expresses the relative contribution of eachpollutant to a specific environmental problem. Table 7 showsthe CF used in the characterisation step. The emissions arequantified in kilograms of 1.4 dichlorobenzene (DCB) for
Table 7
Characterisation factors (CF) per pollutant (x) for each environmental impact
category (z)
Environmental impact
category (z)
Pollutant (x) CFa CF units
Human Toxicity
Potential (HTP inf)bNOx 1.20Eþ 00 kg 1.4-DCB eq./kg
Particulates 8.20E�01
Cd 1.50Eþ 05
Ni 3.50Eþ 04
Pb 4.70Eþ 02
Cr 3.40Eþ 06
Cu 4.30Eþ 03
Zn 1.00Eþ 02
HF 2.90Eþ 03
NMVOC 1.40Eþ 04
SO2 9.60E�02
HCl 5.0E�01
Abiotic Depletion
Potential (ADP) ultimate
reserves and extraction
rates
Natural gas 1.87E�02 kg antimony eq./m3
Global Warming
Potential (GWP 100)cCO2 1.00Eþ 00 kg CO2 eq./kg
Acidification Potential
Average Europe
(AP Huijbregts, 1999;
average Europe total,
A&B)
NOx 5.00E�01 kg SO2 eq./kg
SO2 1.20Eþ 00
HF 1.60Eþ 00
Ecotoxicity Potential
terrestrial (ECP inf)dCd 8.10Eþ 01 kg 1.4-DCB eq./kg
Ni 1.20Eþ 02
Pb 1.60Eþ 01
Cr 3.00Eþ 03
Cu 7.00Eþ 00
Zn 1.20Eþ 01
HF 2.90E�03
NMVOC 2.50E�03
Photo Oxidant
Creation Potential
(POCP Jenkin and
Hayman, 1999 and
Derwent et al., 1998; high
NOx)
CO 2.70E�02 kg ethylene eq./kg
NOx 2.80E�02
NMVOC 3.73E�01
SO2 4.80E�02
Aquatic toxicity (ATP) Not available
Solid waste (SW) Not available
a CML (2002).b HTP inf. (time horizon infinite).c GWP100 (time horizon¼ 100 years).d ECP inf. (time horizon infinite).

159B. Neto et al. / Environmental Modelling & Software 23 (2008) 147e168
human toxicity and ecotoxicity, in kilograms of antimony fornatural resources depletion, in kilograms of CO2 for globalwarming, in kilograms of SO2 for acidification, in kilogramsof ethylene for ozone precursors.
In the normalisation step we divide the potential impact foreach environmental problem (value from Characterisation) bythe impact score for a reference situation. This way, the rela-tive contribution of the process is related to a reference situa-tion (region, country or the whole world). The normalisationfactors (NF) applied here (see Eq. (4) on Box 1) use the West-ern Europe 1995 as a reference situation (Huijbregts et al.,2003) (Table 8). Exceptions are the NF for ATP and SW; thesevalues are developed from emissions from Western Europeanterritory in the period 1990e1994 (Blonk, 1997). For the NFof solid waste we choose the maximum value of the rangeby Blonk (1997). We used Western Europe as a reference, be-cause it was possible to derive a consistent set of normalisationfactors at this level. One could, however, argue that normalisa-tion factors for Portugal would have been more appropriate forour analysis. Such factors are, however, currently notavailable.
Four different methods for the weighting were used: (a)considering all environmental problems equally important,(b) Panel method I (van de Kamp, 2005), (c) Panel methodII (Kortman et al., 1994) and (d) distance to target method(Goedkoop, 1995). In the weighting step we use multiplesets of valuation factors reflecting different views on the rela-tive importance of environmental problems. In addition, themodel user may define the set of valuation factors for eachenvironmental problem (in line with Bengtsson and Steen,2000). This illustrates the possibility of MIKADO to takeinto account the weighting factors set by plant managers. Itmay therefore reveal the consequences of management objec-tives on pollution reduction. Table 9 lists the weighting factorsused.
Table 8
Normalisation factors (NF) for Western Europe per environmental impact
category (z)
Environmental impact
category (z)
NFz Unit
Human Toxicity
Potential (HTP)
7.6Eþ 12 1.4-DCB eq./yr
Abiotic Depletion
Potential (ADP)
1.5Eþ 10 kg antimony eq./yr
Global Warming
Potential (GWP)
4.8Eþ 12 kg CO2 eq./yr
Solid waste (SW)a,b 54Eþ 10 kg/yr
Acidification Potential (AP) 2.0Eþ 10 kg SO2 eq./yr
Ecotoxicity Potential (ECP) 4.7Eþ 10 1.4-DCB eq./yr
Photo Oxidant Formation
Potential (POCP)
8.2Eþ 09 kg ethylene eq./yr
Aquatic toxicity (ATP)a 4.4Eþ 14 m3 aquatic ecotoxicity/yr
The reference situation is assumed to be Western Europe in 1995 (Huijbregts
et al., 2003).a These values are developed for the reference situation: Western European
territory in the period 1990e1994 (Blonk, 1997).b The NF for solid waste was assumed to be the maximum value in the range
(9.7e54� 1010) (Blonk, 1997).
5. Model results and sensitivity analysis
In this paper, we will present some model results to explorethe model system. In a related paper (Neto et al., submittedfor publication-a) we present more detailed analyses of strate-gies to reduce the environmental impact of aluminium diecasting.
First, we analysed MIKADO results using the values of pa-rameters as described in the previous sections. Figs. 3 and 4
Table 9
Weighting factors (WF) used in Impact Assessment
Valuation method used in Impact Assessment
Environmental impact category (z) WFz
All problems equally important
Human Toxicity Potential (HTP) 0.125
Ecotoxicity Potential (ECP) 0.125
Global Warming Potential (GWP) 0.125
Acidification Potential (AP) 0.125
Photochemical Ozone Creation
Potential (POCP)
0.125
Abiotic Depletion Potential (ADP) 0.125
Aquatic toxicity (ATP) 0.125
Solid waste to be dumped (SW) 0.125
Panel method: ESA, M. Sc. Students, 2005 (van de Kamp, 2005)
Human Toxicity Potential (HTP) 0.119a
Ecotoxicity Potential (ECP) 0.119
Global Warming Potential (GWP) 0.154
Acidification Potential (AP) 0.130
Photochemical Ozone Creation Potential
(POCP)
0.097
Abiotic Depletion Potential (ADP) 0.143
Aquatic toxicity (ATP) 0.121
Solid waste to be dumped (SW) 0.119a
Panel method: Kortman et al., 1994 (Kortman et al., 1994)
Human Toxicity Potential (HTP) 0.117
Ecotoxicity Potential (ECP) 0.135
Global Warming Potential (GWP) 0.164
Acidification Potential (AP) 0.120
Photochemical Ozone Creation
Potential (POCP)
0.042b
Abiotic Depletion Potential (ADP) 0.152c
Aquatic toxicity (ATP) 0.135d
Solid waste to be dumped (SW) 0.135d
Distance to target (Goedkoop, 1995)
Human Toxicity Potential (HTP) 0.118
Ecotoxicity Potential (ECP) 0.118
Global Warming Potential (GWP) 0.059
Acidification Potential (AP) 0.235
Photochemical Ozone Creation
Potential (POCP)
0.118
Abiotic Depletion Potential (ADP) 0.118e
Aquatic toxicity (ATP) 0.118f
Solid waste to be dumped (SW) 0.118f
a Assumed to be equal to ECP.b Derived from Seppala et al. (2002). Express the relation between the values
of POCP and GWP in both valuation methods.c Derived from Panel method I (van de Kamp, 2005). Express the relation
between the values of ADP and GWP in both valuation methods.d Assumed to be equal to ECP.e Assumed equal to most environmental problems.f Assumed to be equal to ECP.
160 B. Neto et al. / Environmental Modelling & Software 23 (2008) 147e168
present results for this zero case, assuming not only the use ofpreviously defined values for parameters but also that no re-duction options are implemented. Fig. 3 shows the calculatedenvironmental impacts for four different MCA approachesused, those differing in the valuation of the different environ-mental problems, while Fig. 4 only shows results for the val-uation method that assumed all environmental problemsequally important.
0%
10%
20%
30%
40%
50%
60%
70%
80%
90%
100%
all problemsequally
important
Panelmethod I
Panelmethod II
Distance totarget
M (%
)
AuxilliaryBurners
Internaltransports
Finishing Casting Melting
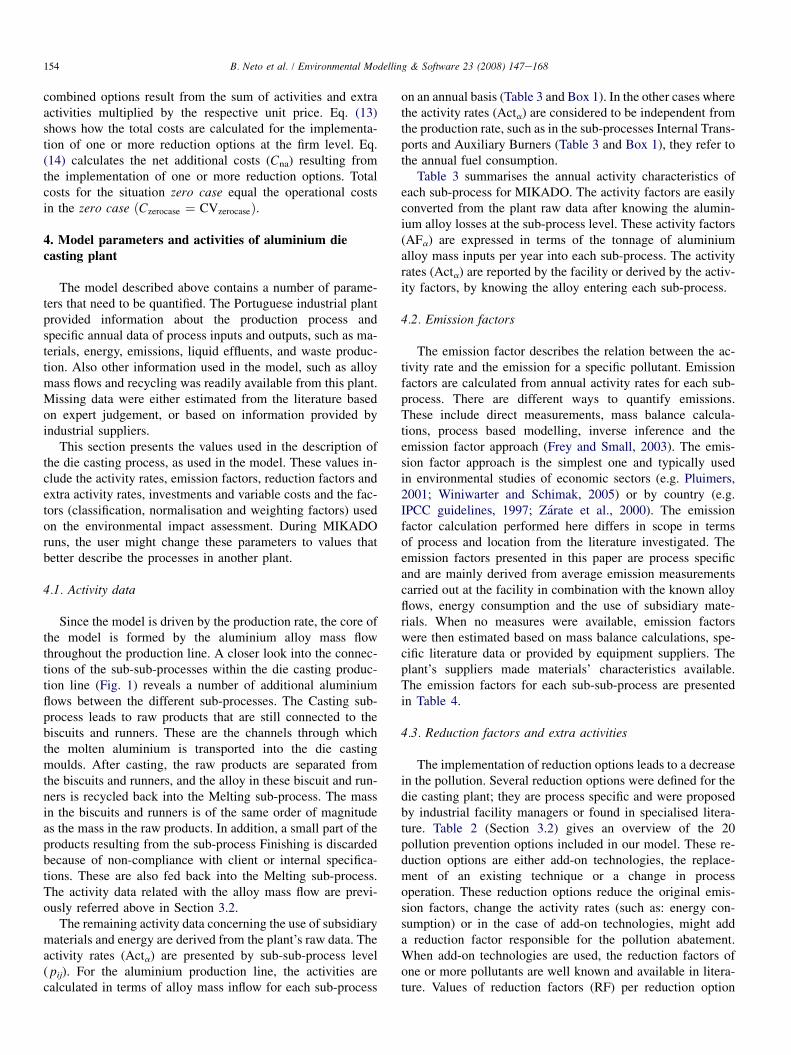
Fig. 3. The contribution (%) of each sub-process of an aluminium die casting
plant to the overall environmental impact (M ) by sub-process for four Multi-
criteria Analysis (MCA) approaches taking different valuation methods: All
problems equally important, Panel method I (van de Kamp, 2005), Panel
method II (Kortman et al., 1994), Distance to target (Goedkoop, 1995)
(unit: %relative to the M ).
0%
10%
20%
30%
40%
50%
60%
70%
80%
90%
100%
Melting Casting Finishing InternalTransports
AuxiliaryBurners
Subprocess (pi)
(M
%
)
Aquatic toxicityPhotochemicalozone formation
TerrestrialecotoxicityAcidification
Solid wasteproductionGlobal warming
Abiotic depletionHuman toxicity
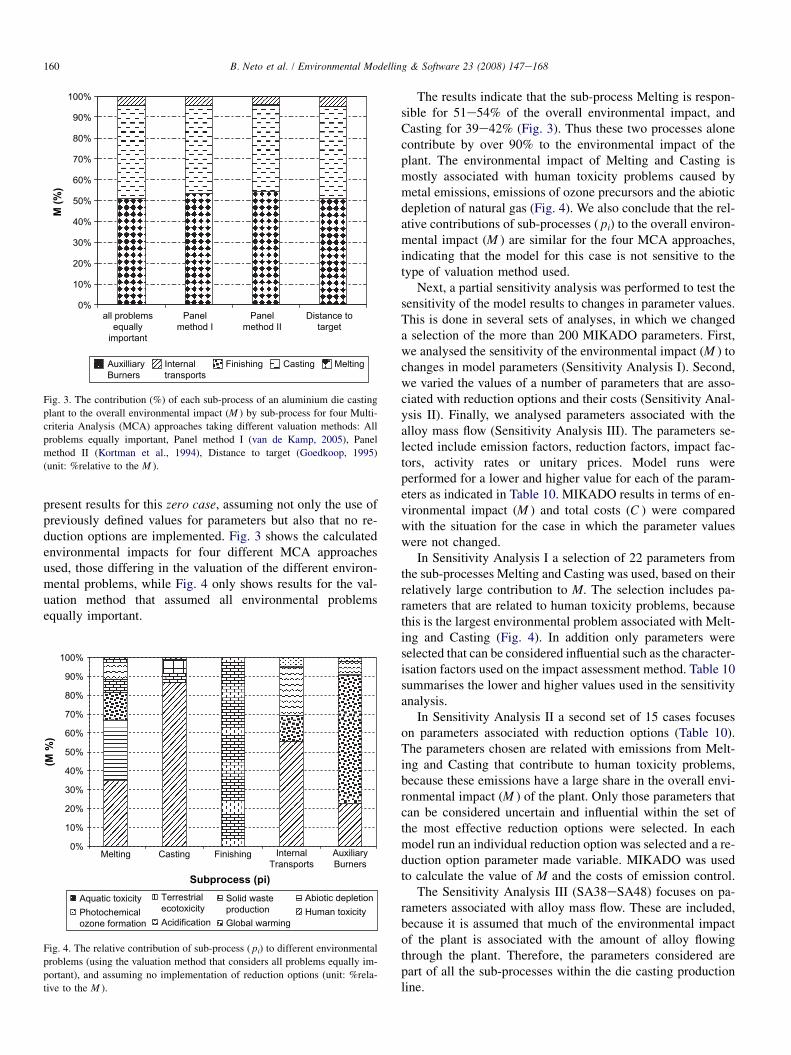
Fig. 4. The relative contribution of sub-process ( pi) to different environmental
problems (using the valuation method that considers all problems equally im-
portant), and assuming no implementation of reduction options (unit: %rela-
tive to the M ).
The results indicate that the sub-process Melting is respon-sible for 51e54% of the overall environmental impact, andCasting for 39e42% (Fig. 3). Thus these two processes alonecontribute by over 90% to the environmental impact of theplant. The environmental impact of Melting and Casting ismostly associated with human toxicity problems caused bymetal emissions, emissions of ozone precursors and the abioticdepletion of natural gas (Fig. 4). We also conclude that the rel-ative contributions of sub-processes ( pi) to the overall environ-mental impact (M ) are similar for the four MCA approaches,indicating that the model for this case is not sensitive to thetype of valuation method used.
Next, a partial sensitivity analysis was performed to test thesensitivity of the model results to changes in parameter values.This is done in several sets of analyses, in which we changeda selection of the more than 200 MIKADO parameters. First,we analysed the sensitivity of the environmental impact (M ) tochanges in model parameters (Sensitivity Analysis I). Second,we varied the values of a number of parameters that are asso-ciated with reduction options and their costs (Sensitivity Anal-ysis II). Finally, we analysed parameters associated with thealloy mass flow (Sensitivity Analysis III). The parameters se-lected include emission factors, reduction factors, impact fac-tors, activity rates or unitary prices. Model runs wereperformed for a lower and higher value for each of the param-eters as indicated in Table 10. MIKADO results in terms of en-vironmental impact (M ) and total costs (C ) were comparedwith the situation for the case in which the parameter valueswere not changed.
In Sensitivity Analysis I a selection of 22 parameters fromthe sub-processes Melting and Casting was used, based on theirrelatively large contribution to M. The selection includes pa-rameters that are related to human toxicity problems, becausethis is the largest environmental problem associated with Melt-ing and Casting (Fig. 4). In addition only parameters wereselected that can be considered influential such as the character-isation factors used on the impact assessment method. Table 10summarises the lower and higher values used in the sensitivityanalysis.
In Sensitivity Analysis II a second set of 15 cases focuseson parameters associated with reduction options (Table 10).The parameters chosen are related with emissions from Melt-ing and Casting that contribute to human toxicity problems,because these emissions have a large share in the overall envi-ronmental impact (M ) of the plant. Only those parameters thatcan be considered uncertain and influential within the set ofthe most effective reduction options were selected. In eachmodel run an individual reduction option was selected and a re-duction option parameter made variable. MIKADO was usedto calculate the value of M and the costs of emission control.
The Sensitivity Analysis III (SA38eSA48) focuses on pa-rameters associated with alloy mass flow. These are included,because it is assumed that much of the environmental impactof the plant is associated with the amount of alloy flowingthrough the plant. Therefore, the parameters considered arepart of all the sub-processes within the die casting productionline.

161B. Neto et al. / Environmental Modelling & Software 23 (2008) 147e168
Table 10
Parameters from Sensitivity Analysis cases
Associated reduction options Range
Sensitivity Analysis I: parameters associated with emission factors and characterisation factors
SA1 Emission factor for cadmium
on sub-process Melting
e Based on several concentrations measured
for each the lower and higher values are 0
and 0.49 mg/m3.
SA2 Emission factor for nickel
on sub-process Melting
e Based on several concentrations measured for each the
lower and higher values are 0.02 and 0.08 mg/m3.
SA3 Emission factor for lead
on sub-process Melting
e Based on several concentrations measured for each the
lower and higher values are 0.07 and 1.21 mg/m3.
SA4 Emission factor for chromium
on sub-process Melting
e Based on several concentrations measured for each the
lower and higher values are 0 and 0.08 mg/m3.
SA5 Emission factor for copper
on sub-process Melting
e Based on several concentrations measured for each the
lower and higher values are 0 and 0.94 mg/m3.
SA6 Emission factor for hydrogen fluoride on
sub-process Melting (related with desoxidation agent used)
e Based on range of chemical composition of fluorine in
desoxidation agent (20e50% Na2SIF6) Foseco (2002).
SA7 Emission factor for hydrogen fluoride on
sub-process Melting (related with degassing agent used)
e Based on range of chemical composition of fluorine in
desoxidation agent (5e10% AlF3). Foseco (2002).
SA8 Emission factor for non-methane volatile
organic compounds on sub-process Melting
e Literature for natural gas the NMVOC emissions range
(0.2e4) kg/GJ. EMEP/CORINAIR (2004)
SA9 Emission factor for NOx on sub-process Melting e Literature for natural gas the NOx emissions range
(22e350) kg/GJ. EMEP/CORINAIR (2004)
SA10 Emission factor for lead on sub-process Casting e By �20%
SA11 Emission factor for chromium on sub-process Casting e By �20%
SA12 Emission factor for copper on sub-process Casting e By �20%
SA13 Emission factor for non-methane volatile
organic compounds on sub-process Casting
e Based on several concentrations measured for each the
lower and higher values are 2.7 and 3.4 mg/m3.
SA14 Characterisation factor for cadmium e By �20%
SA15 Characterisation factor for nickel e By �20%
SA16 Characterisation factor for chromium e By �20%
SA17 Characterisation factor for non-methane
volatile organic compounds
e By �20%
SA18 Characterisation factor for NOx e By �20%
SA19 Characterisation factor for lead e By �20%
SA20 Characterisation factor for copper e By �20%
SA21 Characterisation factor for zinc e By �20%
SA22 Characterisation factor for hydrogen fluoride e By �20%
Sensitivity Analysis II: parameters associated with reduction options and their costs
SA23 Reduction factor for hydrogen fluoride Melting_WS_SC By �10% (maximum value¼ 100%)
SA24 Reduction factor for heavy metals By �10% (maximum value¼ 100%)
SA25 Reduction factor for copper By �10% (maximum value¼ 100%)
SA26 Reduction factor for non-methane volatile
organic compounds
By �10% (maximum value¼ 100%)
SA27 Change price of cost disposal (sludge) By �50%
SA28 Thermal efficiency Melting_CM Range from literature 35% and 60%. EIPPCB (2005)
SA29 Natural gas price By �20%
SA30 Reduction factor for non-methane volatile
organic compounds
Casting_WS_SC By �10% (maximum value¼ 100%)
SA31 Reduction factor for zinc By �10% (maximum value¼ 100%)
SA32 Reduction factor for heavy metals By �10% (maximum value¼ 100%)
SA33 Price of cost disposal (Sludge) By �50%
SA34 Concentration of new mould release agent Casting_nMA Based on several concentrations measured for each the
lower and higher values are 0.8 and 1.5%
SA35 Mould release agent price By �10%
SA36 Powder agent used Casting_PA By �10%
SA37 Price of powder agent Data given by the product supplier for each the lower
and higher values are 50 and 60V/kg. Kluber (2005).
Personal communication.
Sensitivity Analysis III: parameters associated with alloy mass flow
SA38 Runners rate e By �20%
SA39 Scrap rate in Casting e By �20%
SA40 Scrap rate in Finishing e By �20%
SA41 Emission factor for aluminium on sub-process Melting e Based on several concentrations measured for each
the lower and higher values are 2.9 and 180.9 mg/m3.
(continued on next page)

162 B. Neto et al. / Environmental Modelling & Software 23 (2008) 147e168
Table 10 (continued )
Associated reduction options Range
SA42 Amount of alloy in aluminium dross e By �20%
SA43 Fraction of alloy drossed e By �20%
SA44 Emission factor for aluminium
on sub-process Casting
e By �20%
SA45 Fraction of material grinded e By �20%
SA46 Fraction of material shot blasted e By �20%
SA47 Fraction of material tumbled e By �20%
SA48 Burrs fraction e By �20%
In Sensitivity Analysis II a reference is made to the associated reduction options.
The sensitivity analysis described so far focuses on the ef-fects of changes in individual model parameters. To investigatethe sensitivity of MIKADO to multiple changes, three caseswere analysed in which the values of a selection of parameterswere changed simultaneously. In other words, some of the casesof the three sensitivity analyses were combined. In each combi-nation we included the most influential parameters. These pa-rameters (Combined Cases 1, 2 and 3) are presented in Table 11.
For Sensitivity Analysis I the results, presented in Table 11,indicate that the MIKADO is most sensitive to variations in theemission factors used to calculate Melting-related emissions ofHF (case SA6, �5% change in M relative to the zero case) and
Casting-related emissions of chromium (SA11, �5%). Themodel is also relatively sensitive to the characterisation factor(CF) for chromium (SA16, �5% change in M relative to zerocase). The other emission factors and CF have a relatively smalleffect (<5%) on M.
In Sensitivity Analysis II, it was observed that theMIKADO is sensitive to some, but not all parameters. Forinstance, the calculated value of M appears to be relativelysensitive to the variations of the parameter thermal efficiency(case SA28: �3 to þ5% change in M relative to the default runwith the reduction option at stake is implemented). Model re-sults show that the calculated costs of emission control appear
Table 11
Results of the sensitivity analyses: changes in the modelled overall environmental impact (M ) and total costs (C ) for a selection of cases
Sensitivity Analysis cases Parameters in Sensitivity
Analysis cases (see Table 10)
Change in M related with zero case (%) Change in M related with
reduction option(s) (%)
Change in the Total
Costs (C ) (%)
Sensitivity Analysis I SA4 �1 e 0
SA6 �5 e 0
SA8 �2 e 0
SA9 �2 e 0
SA11 �5 e 0
SA13 �2 e 0
SA16 �5 e 0
SA17 �4 e 0
SA22 �2 e 0
Sensitivity Analysis II SA23 e þ1 0d
SA24 e þ1 0d
SA28 e �3; þ5 þ1d
SA30 e �2; þ3 0d
SA32 e þ4 0d
SA34 e �3 0d
Sensitivity Analysis III SA38 �12; þ17 e �1; þ2
SA39 �2 e 0
SA40 �2 e 0
SA48 �1 e �1
Combined Case 1
(cases from SAI)
SA6þ SA11þ SA16a �14; þ16 e 0
Combined Case 2
(cases from SAII)
SA28þ SA30þ SA32þ SA34b e �9; þ20 �1e
Combined Case 3
(cases from SAIII)
SA38þ SA39þ SA40þ SA48c �16; þ23 e �3
The table presents the cases with an impact on M of at least 1%. Only the sensitivity analysis results for changes in M related with the zero case are shown and the
situation when reduction option(s) are implemented. The values presented in a range, are the results obtained for model runs, respectively, from the lower and
higher case. In the table, the results for combinations of sensitivity analysis cases are also present (Combined cases).a Combined Case 1, includes cases from SAI for which the calculated change in M is larger than 5%.b Combined Case 2, includes cases from SAII for which the calculated change in M is larger than 3%.c Combined Case 3, includes all cases from SAIII resulting in any change in the calculated value of M.d The changes in total costs refer to the total costs for the situation when each associated individual reduction are used.e The changes in total costs refer to the total costs for the situation when all influential associated reduction options, shown in Table 10, are used.

163B. Neto et al. / Environmental Modelling & Software 23 (2008) 147e168
Box 1
Mathematical formulation of the model (Eqs (1)e(14))
Ex;pi¼X
j
Xa
�Actaij
EFij;aij ;x
�ð1Þ
Actaij¼ ALijAFaij
ð2aÞ
Actaij¼ ALij ð2bÞ
Actaij¼ Actaij
ð2cÞ
Ex ¼X
pi
�Ex;pi
�ð3Þ
Mpi ¼X
z
0@P
x
�Ex;pi
CFz;x
�NFz
WFz
1A ð4Þ
M ¼X
pi
�Mpi
�ð5Þ
Ex;pi¼X
j
Xa
Xt
�Actaij ;tEFij;aij ;x;t
�100�RFx;t
100
��ð6Þ
Ex;pi ¼X
j
XXa
Xt
�ActXaij ;tEFij;Xaij ;x;t
�ð7Þ
ActXaij ;t ¼ ALijAFXaij ð8aÞ
ActXaij ;t ¼ ALij ð8bÞ
CIt ¼ Itrð1þ rÞltt�ð1þ rÞltt�1
� ð9Þ
COt ¼ Itot ð10Þ
CVzerocase ¼ ALp;zerocasePing þX
i
Xj
�Actaij ;zerocasePaij
�ð11Þ
CV¼ ALpPing þX
i
" Xj
Xa
�Actaij
Paij
�!þ X
j
XXa
�ActXaij
PXaij
�!#ð12Þ
C¼X
t
ðCIt þCOtÞ þCV ð13Þ
Cna ¼ C�Czerocase ð14Þ
(continued on next page)
164 B. Neto et al. / Environmental Modelling & Software 23 (2008) 147e168
Box 1 (continued)
Description of parameters and variables present on Eqs. (1) e (14).
Ex;pi¼ Emission of pollutant x within the sub-process pi in kg of pollutant x/year or m3 of pollutant x/year.
x¼ Index for type of pollutant emitted such as: metals (Al, Cd, Ni, Pb, Cr, Cu, Zn,.), CO2, NOx, CO, NMVOC, etc.
p¼ Index for process p (Table 1).
i¼ Index for sub-process from process p (Table 1).
j¼ Index for sub-sub-process within sub-process i from process p (Table 1).
a¼ Index for type of activity, referring to energy or materials such as: use of natural gas, mould release agent, water, desoxidation agent, etc. (Table 1).
Acta ¼Activity rate (Act) expressing the use of a certain material or energy (a) in unit activity/year (Table 3).
AL¼Aluminium alloy mass inflow in ton alloy/year.
AFa ¼Activity factor (AF) expressing the unit of activity (a) used by the amount of aluminium alloy mass flow in unit activity/ton alloy (Table 3).
EFa;x ¼ Emission factor (EF) for pollutant x, related to a certain type of activity (a) in kg/unit activity or m3/unit activity (Table 4).
Ex ¼ Total emission of pollutant x in kg of pollutant x/year or m3 of pollutant x/year.
Mpi¼ Environmental impact from sub-process pi (unitless).
z¼ Index for type of environmental impact category: Human toxicity, terrestrial ecotoxicity, global warming, acidification, photochemical ozone formation, abiotic
depletion, aquatic toxicity and solid waste production.
CFz;x ¼Characterisation factor (CF) for environmental impact category z due to emission of pollutant x (Table 7).
NFz ¼Normalisation factor (NF) for environmental impact category z (Table 8).
WFz ¼Weighting factor (WF) for environmental impact category z (unitless) (Table 9).
M¼Overall environmental impact (unitless).
Mz;pi¼ Environmental impact for a specific environmental impact category (z) resulting from sub-process pi (unitless).
RFx;t ¼Reduction factor for pollutant x due to the reduction option t in %.
t¼ Index for reduction option (Table 2).
Acta;t ¼Activity rate (Act) related with a certain type of activity (a) that may change by the reduction option t in unit activity/year.
EFa;x;t ¼ Emission factor (EF) for pollutant x, related to a certain type of activity (a), that may change by the reduction option t in kg/unit activity or m3/unit
activity.
Xa¼ Index for type of extra activity (Xa), induced by the reduction option t and referring to energy or materials such as: use of gas N2, oxygen, powder agent or
waste to be disposed.
ActXa;t ¼Activity rate (Act) expressing the use of an extra material or energy (Xa), induced by the reduction option t in unit activity/year.
EFXa;x;t ¼ Emission factor (EF) for pollutant x, related to a certain type of an extra activity (Xa) induced by the reduction option t in kg/unit activity or m3/unit
activity.
AFXa ¼Activity factor (AF) expressing the unit of an extra activity (Xa) used by the amount of aluminium alloy mass flow in unit activity/ton alloy.
CIt ¼Annualised capital cost due to the option t in kV/year (Table 5).
It ¼ Investment due to option t in kV (Table 5).
r¼ Interest rate in fraction/year (r¼ 0.07) USEPA (2002).
ltt ¼ Lifetime of reduction option t in years (Table 5).
COt ¼ Fixed costs for reduction option t in kV/year (Table 5).
ot ¼ Fraction of investment indicating the fixed costs for reduction option t in fraction/year (Table 5).
CVzerocase ¼Variable costs for the situation zero case (i.e. no application of pollution reduction options) in kV/year.
ALp;zerocase ¼Aluminium ingot mass entering process ( p), for zero case (i.e. no application of pollution reduction options) in ton/year.
Ping ¼ Price of aluminium ingot in kV/kg (Table 6).
Acta;zerocase ¼Activity rate (Act) expressing the use of an activity (a) for zero case in unit activity/year (Table 3).
Paij¼ Price of activity a in V/unit activity (Table 6).
CV¼Variable costs of all implemented pollution reduction options t in kV/year (in Table 5 the variable costs for each individual reduction option are present).
PXaij ¼ Price of extra activity Xa in V/unit activity (Table 6).
C¼ Total annual costs in kV/year.
Cna ¼Net additional costs, expressing the difference in the costs for the implementation of one or more reduction options when subtracted the costs for zero case in
kV/year.
to be most sensitive to variations in the thermal efficiencyparameter (case SA28) presenting a þ1% cost variation. Noeffects on costs calculations are seen for the other parameters.
Sensitivity Analysis III indicates that the calculated overallenvironmental impact (M ) is relatively highly sensitive tochanges in the runner rate (SA38, changing the value of Mby �12% to þ17% relative to the zero case). A relativelysmall effect is observed for the scrap rates from Casting(SA39), Finishing (SA40) and burrs fractions (SA48) (asseen in Table 11).
In the Combined cases, first the changes in the calculatedvalues of M related to the zero case were investigated forCombined Cases 1 and 3 (Fig. 5). Combined Case 1 showsa �14 to þ16% change in M relative to the zero case. ForCombined Case 3 this range is �16% to þ23%.
Combined Case 2 provides an indication of the potential toimprove the environmental performance of the industrial plant.In Combined Case 2 (Fig. 6), the results of the sensitivity anal-ysis are compared to a default case, in which the most influen-tial options considered in Sensitivity Analysis II are assumedto be implemented simultaneously (Fig. 6). These options in-clude the change in the metal loading in furnaces (Mel-ting_CM), a scrubber from Casting (Casting_WS_SC) anda new mould release agent (Casting_nMA). It is interestingto compare the default Combined Case 2 results (Fig. 6) tothe zero case (Fig. 5) in which no options are assumed to beimplemented. Implementation of these options is calculatedto reduce the overall environmental impact by 60%(M¼ 0.75 in the zero case (Fig. 5) and 0.30 in the defaultCombined Case 2 (Fig. 6)). This reveals the relatively large
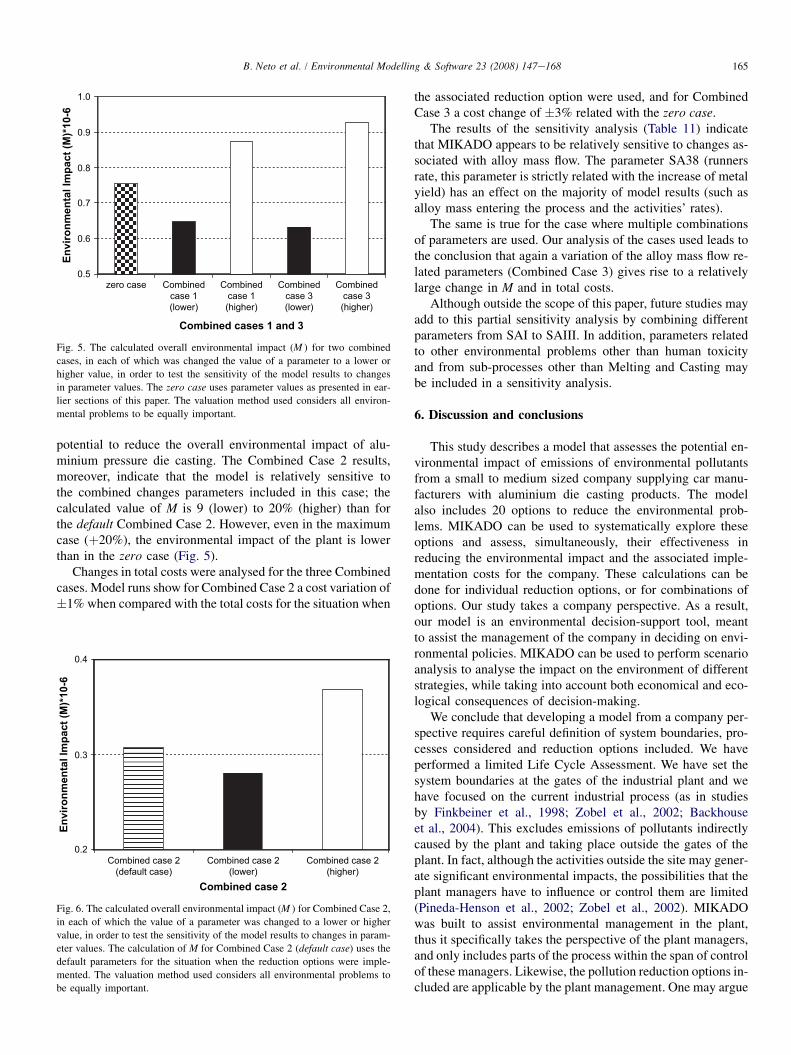
165B. Neto et al. / Environmental Modelling & Software 23 (2008) 147e168
potential to reduce the overall environmental impact of alu-minium pressure die casting. The Combined Case 2 results,moreover, indicate that the model is relatively sensitive tothe combined changes parameters included in this case; thecalculated value of M is 9 (lower) to 20% (higher) than forthe default Combined Case 2. However, even in the maximumcase (þ20%), the environmental impact of the plant is lowerthan in the zero case (Fig. 5).
Changes in total costs were analysed for the three Combinedcases. Model runs show for Combined Case 2 a cost variation of�1% when compared with the total costs for the situation when
0.5
0.6
0.7
0.8
0.9
1.0
zero case Combinedcase 1(lower)
Combinedcase 1(higher)
Combinedcase 3(lower)
Combinedcase 3(higher)
Combined cases 1 and 3
En
viro
nm
en
tal Im
pact (M
)*10-6
Fig. 5. The calculated overall environmental impact (M ) for two combined
cases, in each of which was changed the value of a parameter to a lower or
higher value, in order to test the sensitivity of the model results to changes
in parameter values. The zero case uses parameter values as presented in ear-
lier sections of this paper. The valuation method used considers all environ-
mental problems to be equally important.
0.2
0.3
0.4
Combined case 2(default case)
Combined case 2(lower)
Combined case 2(higher)
Combined case 2
En
viro
nm
en
tal Im
pact (M
)*10-6
Fig. 6. The calculated overall environmental impact (M ) for Combined Case 2,
in each of which the value of a parameter was changed to a lower or higher
value, in order to test the sensitivity of the model results to changes in param-
eter values. The calculation of M for Combined Case 2 (default case) uses the
default parameters for the situation when the reduction options were imple-
mented. The valuation method used considers all environmental problems to
be equally important.
the associated reduction option were used, and for CombinedCase 3 a cost change of �3% related with the zero case.
The results of the sensitivity analysis (Table 11) indicatethat MIKADO appears to be relatively sensitive to changes as-sociated with alloy mass flow. The parameter SA38 (runnersrate, this parameter is strictly related with the increase of metalyield) has an effect on the majority of model results (such asalloy mass entering the process and the activities’ rates).
The same is true for the case where multiple combinationsof parameters are used. Our analysis of the cases used leads tothe conclusion that again a variation of the alloy mass flow re-lated parameters (Combined Case 3) gives rise to a relativelylarge change in M and in total costs.
Although outside the scope of this paper, future studies mayadd to this partial sensitivity analysis by combining differentparameters from SAI to SAIII. In addition, parameters relatedto other environmental problems other than human toxicityand from sub-processes other than Melting and Casting maybe included in a sensitivity analysis.
6. Discussion and conclusions
This study describes a model that assesses the potential en-vironmental impact of emissions of environmental pollutantsfrom a small to medium sized company supplying car manu-facturers with aluminium die casting products. The modelalso includes 20 options to reduce the environmental prob-lems. MIKADO can be used to systematically explore theseoptions and assess, simultaneously, their effectiveness inreducing the environmental impact and the associated imple-mentation costs for the company. These calculations can bedone for individual reduction options, or for combinations ofoptions. Our study takes a company perspective. As a result,our model is an environmental decision-support tool, meantto assist the management of the company in deciding on envi-ronmental policies. MIKADO can be used to perform scenarioanalysis to analyse the impact on the environment of differentstrategies, while taking into account both economical and eco-logical consequences of decision-making.
We conclude that developing a model from a company per-spective requires careful definition of system boundaries, pro-cesses considered and reduction options included. We haveperformed a limited Life Cycle Assessment. We have set thesystem boundaries at the gates of the industrial plant and wehave focused on the current industrial process (as in studiesby Finkbeiner et al., 1998; Zobel et al., 2002; Backhouseet al., 2004). This excludes emissions of pollutants indirectlycaused by the plant and taking place outside the gates of theplant. In fact, although the activities outside the site may gener-ate significant environmental impacts, the possibilities that theplant managers have to influence or control them are limited(Pineda-Henson et al., 2002; Zobel et al., 2002). MIKADOwas built to assist environmental management in the plant,thus it specifically takes the perspective of the plant managers,and only includes parts of the process within the span of controlof these managers. Likewise, the pollution reduction options in-cluded are applicable by the plant management. One may argue

166 B. Neto et al. / Environmental Modelling & Software 23 (2008) 147e168
that some changes, as for instance, in the energy systems mayresult in changes in emissions outside our system that are nownot accounted for. We argue, however, that even though the en-ergy market is more open now than before the choice for thetype of the energy use at the plant (as an upstream flow) is outof the span of control of the plant managers.
MIKADO needs several inputs. Use of materials andenergy are based on the production rate. The model inputs in-clude raw materials (aluminium alloy ingots), fuel use (naturalgas and other fuels used in internal transports and in auxiliaryburners) and subsidiary materials such as desoxidation anddegassing agents, mould release agents, lubricants, water, steelshot, ceramic abrasives, detergent and other agents used in thewastewater treatment plants. These inputs, or activities’ rates,are used to calculate emissions of pollutants. In MIKADO,most emissions are quantified using a simple emission factorapproach (following IPCC guidelines, 1997; Sakamoto andTonooka, 2000; Winiwarter and Schimak, 2005).
In MIKADO emissions are calculated at the sub-sub-processlevel, and include air emissions (aluminium (Al), zinc (Zn),cadmium (Cd), nickel (Ni), lead (Pb), chromium (Cr), copper(Cu) and iron (Fe)); emissions due to natural gas combustion(CO2, CO, NOx and NMVOC); hydrogen fluoride (HF) releasedduring desoxidation and degassing; non-methane volatile or-ganic compounds (NMVOCs) emitted during mould releaseagent spraying; solid waste (aluminium dross, furnace linings,steel shot, ceramic abrasives and burrs), liquid effluents andemissions from Internal Transport and Auxiliary Burners.
From a company perspective, it is important that the modeloutput is transparent and relevant. Important MIKADO out-puts include emissions of pollutants, the potential environmen-tal impact for a number of environmental impact categoriesand the overall potential environmental impact of the indus-trial plant. The environmental impact assessment methodologyused follows current approaches in Life Cycle Assessment andMulti-criteria Analysis. In addition, MIKADO can be used tocalculate emission reduction and costs associated with the im-plementation of pollution reduction options. These costs areregarded as additional costs for the company. For industrialusers of the model it is essential that the implementationcost of pollution reduction for the company is quantified.
For model users it is important to have insight into the ro-bustness of the model results. Therefore, a partial sensitivityanalysis was carried out for MIKADO. We conclude that var-iations in individual model parameters change the calculatedoverall environmental impact only to a limited extent. Param-eters to which the model is most sensitive include those relatedwith alloy mass flow, and in particular, those related to theincrease of metal yield (as the runners mass).
We conclude from the model results that more than 90% ofthe environmental impact of the plant comes from Meltingand Casting. Moreover, the results indicate that the environmen-tal impact is mostly associated with human toxicity problems(caused by metal emissions, hydrogen fluoride and emissionsof ozone precursors), and the abiotic depletion of natural gas.These two environmental problems account for about 75% ofthe overall environmental impact. The main compounds
released by the industry are metals, including heavy metals,and some volatile organic compounds both contributing to hu-man toxicity problems. Another conclusion is that there arefour relatively large sources of environmental pollution in thealuminium die casting plant: emissions of chromium andNMVOCs from Casting, the use of natural gas in Melting andemissions of hydrogen fluoride from Melting. These emissionscontribute to about two-thirds of the overall environmental im-pact caused by the plant. This conclusion is relatively insensi-tive to the environmental impact assessment method used.The results of the sensitivity analysis indicate the relativelylarge potential to improve the environmental performance ofthis industrial plant.
Any model approach has its limitations. For instance, plantspecific emission estimates were not available for all com-pounds included in MIKADO. However, we consider our emis-sion inventory to be of the best possible quality and the mostcomplete data set currently available. Another weakness isrelated to the impact assessment methodology. Characterisationfactors were not available for all impact categories. Therefore,we used the amount of liquid effluent and the solid waste pro-duced as indicators for aquatic toxicity and solid waste produc-tion. Also, the normalisation factors used are, because of lack ofconsistent data, not based on the local situation, but on WesternEurope. This, however, is a common practice in Multi-criteriaand Life Cycle Assessments (e.g. Hertwich and Hammitt,2000; Huijbregts et al., 2003; Geldermann and Rentz, 2005). Fi-nally, it should be noted that although the model includes all rel-evant pollution problems caused by the plant, we ignore someenvironmental issues cited in current LCA literature (CML,2002) such as noise, vibration, waste heat, desiccation andodour. When using MIKADO it should be realised that itfocuses primarily on pollution problems caused by the plant.
The MIKADO approach is simple, transparent, and complete.It is based on environmental systems analysis tools including rel-evant parts of Life Cycle Impact Assessment and Multi-criteriaAnalysis, which are well-developed approaches to assess envi-ronmental aspects of decision-making (Finnveden and Moberg,2005). The MIKADO approach differs from other tools to assessthe environmental performance of industrial processes, in that itcan effectively evaluate the impacts of decision-making at theplant level, supporting pro-active environmental management.We consider our model an important step towards fulfilling theneed for a tool that assesses both environmental and economicimpacts of organisations. The model can be used for analysingscenarios reflecting future trends in environmental management(e.g. Neto et al., submitted for publication-a).
Acknowledgements
We would like to acknowledge the Fundac~ao para a Cienciae a Tecnologia (Portugal) for their support through a post-graduation research scholarship (SFRH/BD/2836/2000) forBelmira Neto. We are also grateful to TNO Built Environmentand Geosciences (The Netherlands) for the possibility to usethe EstimatER software tool, and for the assistance in using
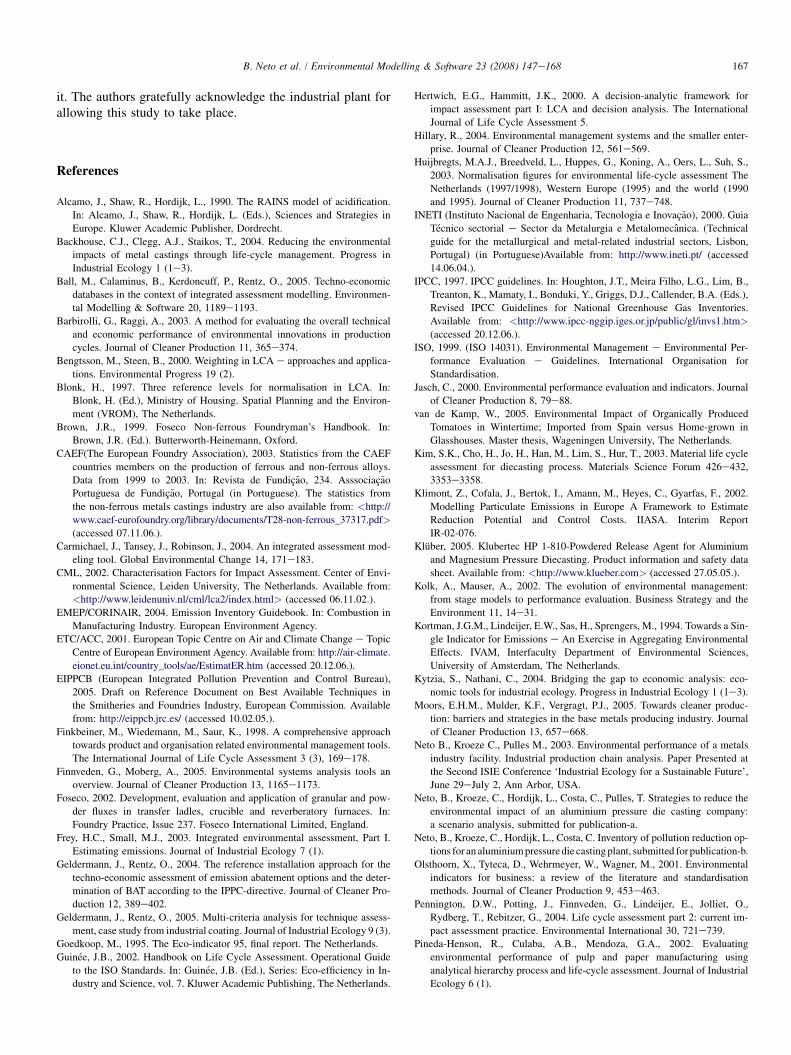
167B. Neto et al. / Environmental Modelling & Software 23 (2008) 147e168
it. The authors gratefully acknowledge the industrial plant forallowing this study to take place.
References
Alcamo, J., Shaw, R., Hordijk, L., 1990. The RAINS model of acidification.
In: Alcamo, J., Shaw, R., Hordijk, L. (Eds.), Sciences and Strategies in
Europe. Kluwer Academic Publisher, Dordrecht.
Backhouse, C.J., Clegg, A.J., Staikos, T., 2004. Reducing the environmental
impacts of metal castings through life-cycle management. Progress in
Industrial Ecology 1 (1e3).
Ball, M., Calaminus, B., Kerdoncuff, P., Rentz, O., 2005. Techno-economic
databases in the context of integrated assessment modelling. Environmen-
tal Modelling & Software 20, 1189e1193.
Barbirolli, G., Raggi, A., 2003. A method for evaluating the overall technical
and economic performance of environmental innovations in production
cycles. Journal of Cleaner Production 11, 365e374.
Bengtsson, M., Steen, B., 2000. Weighting in LCA e approaches and applica-
tions. Environmental Progress 19 (2).
Blonk, H., 1997. Three reference levels for normalisation in LCA. In:
Blonk, H. (Ed.), Ministry of Housing. Spatial Planning and the Environ-
ment (VROM), The Netherlands.
Brown, J.R., 1999. Foseco Non-ferrous Foundryman’s Handbook. In:
Brown, J.R. (Ed.). Butterworth-Heinemann, Oxford.
CAEF(The European Foundry Association), 2003. Statistics from the CAEF
countries members on the production of ferrous and non-ferrous alloys.
Data from 1999 to 2003. In: Revista de Fundic~ao, 234. Asssociac~ao
Portuguesa de Fundic~ao, Portugal (in Portuguese). The statistics from
the non-ferrous metals castings industry are also available from: <http://
www.caef-eurofoundry.org/library/documents/T28-non-ferrous_37317.pdf>
(accessed 07.11.06.).
Carmichael, J., Tansey, J., Robinson, J., 2004. An integrated assessment mod-
eling tool. Global Environmental Change 14, 171e183.
CML, 2002. Characterisation Factors for Impact Assessment. Center of Envi-
ronmental Science, Leiden University, The Netherlands. Available from:
<http://www.leidenuniv.nl/cml/lca2/index.html> (accessed 06.11.02.).
EMEP/CORINAIR, 2004. Emission Inventory Guidebook. In: Combustion in
Manufacturing Industry. European Environment Agency.
ETC/ACC, 2001. European Topic Centre on Air and Climate Change e Topic
Centre of European Environment Agency. Available from: http://air-climate.
eionet.eu.int/country_tools/ae/EstimatER.htm (accessed 20.12.06.).
EIPPCB (European Integrated Pollution Prevention and Control Bureau),
2005. Draft on Reference Document on Best Available Techniques in
the Smitheries and Foundries Industry, European Commission. Available
from: http://eippcb.jrc.es/ (accessed 10.02.05.).
Finkbeiner, M., Wiedemann, M., Saur, K., 1998. A comprehensive approach
towards product and organisation related environmental management tools.
The International Journal of Life Cycle Assessment 3 (3), 169e178.
Finnveden, G., Moberg, A., 2005. Environmental systems analysis tools an
overview. Journal of Cleaner Production 13, 1165e1173.
Foseco, 2002. Development, evaluation and application of granular and pow-
der fluxes in transfer ladles, crucible and reverberatory furnaces. In:
Foundry Practice, Issue 237. Foseco International Limited, England.
Frey, H.C., Small, M.J., 2003. Integrated environmental assessment, Part I.
Estimating emissions. Journal of Industrial Ecology 7 (1).
Geldermann, J., Rentz, O., 2004. The reference installation approach for the
techno-economic assessment of emission abatement options and the deter-
mination of BAT according to the IPPC-directive. Journal of Cleaner Pro-
duction 12, 389e402.
Geldermann, J., Rentz, O., 2005. Multi-criteria analysis for technique assess-
ment, case study from industrial coating. Journal of Industrial Ecology 9 (3).
Goedkoop, M., 1995. The Eco-indicator 95, final report. The Netherlands.
Guinee, J.B., 2002. Handbook on Life Cycle Assessment. Operational Guide
to the ISO Standards. In: Guinee, J.B. (Ed.), Series: Eco-efficiency in In-
dustry and Science, vol. 7. Kluwer Academic Publishing, The Netherlands.
Hertwich, E.G., Hammitt, J.K., 2000. A decision-analytic framework for
impact assessment part I: LCA and decision analysis. The International
Journal of Life Cycle Assessment 5.
Hillary, R., 2004. Environmental management systems and the smaller enter-
prise. Journal of Cleaner Production 12, 561e569.
Huijbregts, M.A.J., Breedveld, L., Huppes, G., Koning, A., Oers, L., Suh, S.,
2003. Normalisation figures for environmental life-cycle assessment The
Netherlands (1997/1998), Western Europe (1995) and the world (1990
and 1995). Journal of Cleaner Production 11, 737e748.
INETI (Instituto Nacional de Engenharia, Tecnologia e Inovac~ao), 2000. Guia
Tecnico sectorial e Sector da Metalurgia e Metalomecanica. (Technical
guide for the metallurgical and metal-related industrial sectors, Lisbon,
Portugal) (in Portuguese)Available from: http://www.ineti.pt/ (accessed
14.06.04.).
IPCC, 1997. IPCC guidelines. In: Houghton, J.T., Meira Filho, L.G., Lim, B.,
Treanton, K., Mamaty, I., Bonduki, Y., Griggs, D.J., Callender, B.A. (Eds.),
Revised IPCC Guidelines for National Greenhouse Gas Inventories.
Available from: <http://www.ipcc-nggip.iges.or.jp/public/gl/invs1.htm>
(accessed 20.12.06.).
ISO, 1999. (ISO 14031). Environmental Management e Environmental Per-
formance Evaluation e Guidelines. International Organisation for
Standardisation.
Jasch, C., 2000. Environmental performance evaluation and indicators. Journal
of Cleaner Production 8, 79e88.
van de Kamp, W., 2005. Environmental Impact of Organically Produced
Tomatoes in Wintertime; Imported from Spain versus Home-grown in
Glasshouses. Master thesis, Wageningen University, The Netherlands.
Kim, S.K., Cho, H., Jo, H., Han, M., Lim, S., Hur, T., 2003. Material life cycle
assessment for diecasting process. Materials Science Forum 426e432,
3353e3358.
Klimont, Z., Cofala, J., Bertok, I., Amann, M., Heyes, C., Gyarfas, F., 2002.
Modelling Particulate Emissions in Europe A Framework to Estimate
Reduction Potential and Control Costs. IIASA. Interim Report
IR-02-076.
Kluber, 2005. Klubertec HP 1-810-Powdered Release Agent for Aluminium
and Magnesium Pressure Diecasting. Product information and safety data
sheet. Available from: <http://www.klueber.com> (accessed 27.05.05.).
Kolk, A., Mauser, A., 2002. The evolution of environmental management:
from stage models to performance evaluation. Business Strategy and the
Environment 11, 14e31.
Kortman, J.G.M., Lindeijer, E.W., Sas, H., Sprengers, M., 1994. Towards a Sin-
gle Indicator for Emissions e An Exercise in Aggregating Environmental
Effects. IVAM, Interfaculty Department of Environmental Sciences,
University of Amsterdam, The Netherlands.
Kytzia, S., Nathani, C., 2004. Bridging the gap to economic analysis: eco-
nomic tools for industrial ecology. Progress in Industrial Ecology 1 (1e3).
Moors, E.H.M., Mulder, K.F., Vergragt, P.J., 2005. Towards cleaner produc-
tion: barriers and strategies in the base metals producing industry. Journal
of Cleaner Production 13, 657e668.
Neto B., Kroeze C., Pulles M., 2003. Environmental performance of a metals
industry facility. Industrial production chain analysis. Paper Presented at
the Second ISIE Conference ‘Industrial Ecology for a Sustainable Future’,
June 29eJuly 2, Ann Arbor, USA.
Neto, B., Kroeze, C., Hordijk, L., Costa, C., Pulles, T. Strategies to reduce the
environmental impact of an aluminium pressure die casting company:
a scenario analysis, submitted for publication-a.
Neto, B., Kroeze, C., Hordijk, L., Costa, C. Inventory of pollution reduction op-
tions for an aluminium pressure die casting plant, submitted for publication-b.
Olsthoorn, X., Tyteca, D., Wehrmeyer, W., Wagner, M., 2001. Environmental
indicators for business: a review of the literature and standardisation
methods. Journal of Cleaner Production 9, 453e463.
Pennington, D.W., Potting, J., Finnveden, G., Lindeijer, E., Jolliet, O.,
Rydberg, T., Rebitzer, G., 2004. Life cycle assessment part 2: current im-
pact assessment practice. Environmental International 30, 721e739.
Pineda-Henson, R., Culaba, A.B., Mendoza, G.A., 2002. Evaluating
environmental performance of pulp and paper manufacturing using
analytical hierarchy process and life-cycle assessment. Journal of Industrial
Ecology 6 (1).

168 B. Neto et al. / Environmental Modelling & Software 23 (2008) 147e168
Pluimers, J., 2001. An Environmental Systems Analysis of Greenhouse Horti-
culture in the Netherlands. Ph.D. thesis, Wageningen University, The
Netherlands.
Rabah, M., 1999. Cost effectiveness of abatement options for emission control
in Egyptian iron foundries. Waste Management 19, 283e292.
Rebitzer, G., Ekvall, T., Frischknecht, R., Hunkeler, D., Norris, G.,
Rydberg, T., Schmidt, W.P., Suh, S., Weidema, B.P., Pennington, D.W.,
2004. Life cycle assessment part 1: framework, goal and scope definition,
inventory analysis and applications. Environmental International 30,
701e720.
Sakamoto, Y., Tonooka, Y., 2000. Estimation of CO2 emission for each process
in the Japanese steel industry: a process analysis. International Journal of
Energy Research 24, 625e632.
Schwarz, B., 1997. Forecasting and scenario’s. In: Miser, H.J., Quade, E.S.
(Eds.), Handbook of Systems Analysis. vol. 2. Craft Issues and Procedural
Choices. John Wiley and Sons, Chichester, pp. 327e367.
Seppala, J., Koskela, S., Melanen, M., Palperi, M., 2002. The Finish metals in-
dustry and the environment. Resources, Conservation and Recycling 35,
61e76.
Silvo, K., Melanen, M., Honkasalo, A., Ruonala, S., Lindstrom, M., 2002.
Integrated pollution prevention and control e the finnish approach.
Resources, Conservation and Recycling 35, 45e60.
USEPA, 2002. EPA Air Pollution Control Cost Manual. EPA/452/B-02-001,
sixth ed. homepage, Available from:. <http://www.epa.gov/ttn/catc/
products.html> (accessed 07.11.06.).
Van Langen, P.H.G., 2002. The Anatomy of Design: Foundations, Models and
Applications. Ph.D. thesis, Vrije University, Amsterdam, The Netherlands.
Winiwarter, W., Schimak, G., 2005. Environmental software systems for emis-
sion inventories. Environmental Modelling & Software 20, 1469e1477.
Wrisberg, N., Haes, H.A.U., Triebswetter, U., Eder, P., Clift, R., 2002. Analyt-
ical tools for environmental design and management in a systems perspec-
tive, the combined use of analytical tools. In: Wrisberg, N., Haes, H.A.U.,
Triebswetter, U., Eder, P., Clift, R. (Eds.), Eco-efficiency in Industry and
Science. Kluwer Academic Publishers.
Zarate, I.O., Ezcurra, A., Lacaux, J.P., Dinh, P., 2000. Emission factor esti-
mates of cereal waste burning in Spain. Atmospheric Environment 34,
3183e3193.
Zobel, T., Almroth, C., Bresky, J., Burman, J., 2002. Identification and assess-
ment of environmental aspects in an EMS context: an approach to a new
reproducible method based on LCA methodology. Journal of Cleaner
Production 10, 381e396.
Zobel, T., Burman, J., 2004. Factors of importance in identification and assess-
ment of environmental aspects in an EMS context: experiences in Swedish
organizations. Journal of Cleaner Production 12, 13e27.
Related Documents