Ecological Modelling 222 (2011) 1209–1221 Contents lists available at ScienceDirect Ecological Modelling journal homepage: www.elsevier.com/locate/ecolmodel Modelling the effects of eutrophication, mitigation measures and an extreme flood event on estuarine benthic food webs Alexandra Baeta a,b,∗ , Nathalie Niquil b , João C. Marques a , Joana Patrício a a IMAR-CMA Marine and Environmental Research Centre, Department of Life Sciences, University of Coimbra, 3004-517 Coimbra, Portugal b Université de la Rochelle-CNRS, UMR 6250, Littoral Environnement et Sociétés (LIENSs), 2 rue Olympe de Gouges, F-17000 La Rochelle, France article info Article history: Received 30 June 2010 Received in revised form 8 December 2010 Accepted 11 December 2010 Available online 21 January 2011 Keywords: Ecological model Food web Eutrophication Management Flood Ecopath Mondego estuary Portugal abstract Human-mediated and natural disturbances such as nutrient enrichment, habitat modification, and flood events often result in significant shifts in species composition and abundance that translate into changes in the food web structure. Six mass-balanced models were developed using the “Ecopath with Ecosim” software package to assess changes in benthic food web properties in the Mondego estuarine ecosystem (Portugal). Field, laboratory and literature information were used to construct the models. The main study objective was to assess at 2 sites (a Zostera meadow and a bare sediment area) the effects of: (1) a period of anthropogenic enrichment, which led to excessive production of organic matter in the form of algal blooms (1993/1994); (2) the implementation of mitigation measures, following a long period of eutrophication (1999/2000); and (3) a centenary flood (winter 2000/2001). Different numbers of compartments were identified at each site and in each time period. In general, the Zostera site, due to its complex community, showed a higher number of compartments and a higher level of system activity (i.e. sum of consumptions, respiration, flow to detritus, production, total system throughput, net primary production and system omnivory index). The differences at the two sites in the three time periods in the breakdown of throughput were mainly due to differences in the biomass of the primary producers (higher primary production at the Zostera site). Consumption, respiration and flow to detritus were dominated by the grazers Hydrobia ulvae and Scrobicularia plana at the Zostera and bare sediment sites respectively. At both sites, after recovery measures were implemented there was an increase in S. plana and Hediste diversicolor biomass, consumption, respiration and flows to detritus, and a decrease in H. ulvae biomass and associated flows, which increased again after the flood event. The mass-balanced models showed that the trophic structure of the benthic communities in Mondego estuary was affected differently by each disturbance event. Interestingly, in our study a high system throughput seems to be associated with higher stress levels, which contradicts the idea that higher system activity is always a sign of healthier conditions. © 2010 Elsevier B.V. All rights reserved. 1. Introduction Estuaries are among the most productive, diverse, and econom- ically important ecosystems on earth (Hobbie, 2000; Paerl, 2006). With the high population densities and increasing socioeconomic demands typical of coastal areas, estuarine ecosystems are sub- jected to multiple anthropogenic stressors. These do not usually operate independently, but rather interact to produce combined impacts on biodiversity and ecosystem functioning (Vinebrooke et al., 2004; Dolbeth et al., 2007; Cardoso et al., 2008). ∗ Corresponding author at: IMAR-CMA Marine and Environmental Research Cen- tre, Department of Life Sciences, University of Coimbra, 3004-517 Coimbra, Portugal. Tel.: +351 239 837797; fax: +351 239 823603. E-mail address: [email protected] (A. Baeta). Nutrient enrichment is one of the widespread stressors. Estuar- ies, which are critical habitats for nutrient recycling and ecosystem productivity, often receive large nutrient inputs derived from human activities and agricultural discharges, which are gener- ally followed by severe eutrophication events (Valiela et al., 1997; Cloern, 2001; Bode et al., 2006; Lotze et al., 2006). Eutrophi- cation severely impacts the diversity of primary producers and consumers, which leads to alterations in the food web structure, ecosystem productivity and functioning. One of the most important aspects of this type of disturbance is the proliferation of fast- growing macroalgae that may replace slow-growing macrophytes and significantly decrease the areal extent of seagrass meadows, which decreases the ecological value of the entire estuary (Short and Wyllie-Echeverria, 1996; Howarth, 1988; Bricker et al., 1999; Valiela, 2006; Patrício et al., 2009). In addition to the impact of organic loading, estuarine ecosys- tems are also influenced by natural perturbations, such as extreme 0304-3800/$ – see front matter © 2010 Elsevier B.V. All rights reserved. doi:10.1016/j.ecolmodel.2010.12.010

Welcome message from author
This document is posted to help you gain knowledge. Please leave a comment to let me know what you think about it! Share it to your friends and learn new things together.
Transcript

Mfl
Aa
b
a
ARRAA
KEFEMFEMP
1
iWdjoie
tT
0d
Ecological Modelling 222 (2011) 1209–1221
Contents lists available at ScienceDirect
Ecological Modelling
journa l homepage: www.e lsev ier .com/ locate /eco lmodel
odelling the effects of eutrophication, mitigation measures and an extremeood event on estuarine benthic food webs
lexandra Baetaa,b,∗, Nathalie Niquilb, João C. Marquesa, Joana Patrícioa
IMAR-CMA Marine and Environmental Research Centre, Department of Life Sciences, University of Coimbra, 3004-517 Coimbra, PortugalUniversité de la Rochelle-CNRS, UMR 6250, Littoral Environnement et Sociétés (LIENSs), 2 rue Olympe de Gouges, F-17000 La Rochelle, France
r t i c l e i n f o
rticle history:eceived 30 June 2010eceived in revised form 8 December 2010ccepted 11 December 2010vailable online 21 January 2011
eywords:cological modelood webutrophicationanagement
loodcopathondego estuary
ortugal
a b s t r a c t
Human-mediated and natural disturbances such as nutrient enrichment, habitat modification, and floodevents often result in significant shifts in species composition and abundance that translate into changesin the food web structure. Six mass-balanced models were developed using the “Ecopath with Ecosim”software package to assess changes in benthic food web properties in the Mondego estuarine ecosystem(Portugal). Field, laboratory and literature information were used to construct the models. The mainstudy objective was to assess at 2 sites (a Zostera meadow and a bare sediment area) the effects of:(1) a period of anthropogenic enrichment, which led to excessive production of organic matter in theform of algal blooms (1993/1994); (2) the implementation of mitigation measures, following a longperiod of eutrophication (1999/2000); and (3) a centenary flood (winter 2000/2001). Different numbersof compartments were identified at each site and in each time period. In general, the Zostera site, due toits complex community, showed a higher number of compartments and a higher level of system activity(i.e. sum of consumptions, respiration, flow to detritus, production, total system throughput, net primaryproduction and system omnivory index). The differences at the two sites in the three time periods in thebreakdown of throughput were mainly due to differences in the biomass of the primary producers (higherprimary production at the Zostera site). Consumption, respiration and flow to detritus were dominatedby the grazers Hydrobia ulvae and Scrobicularia plana at the Zostera and bare sediment sites respectively.At both sites, after recovery measures were implemented there was an increase in S. plana and Hediste
diversicolor biomass, consumption, respiration and flows to detritus, and a decrease in H. ulvae biomassand associated flows, which increased again after the flood event. The mass-balanced models showedthat the trophic structure of the benthic communities in Mondego estuary was affected differently byeach disturbance event. Interestingly, in our study a high system throughput seems to be associated withh con
higher stress levels, whicconditions.. Introduction
Estuaries are among the most productive, diverse, and econom-cally important ecosystems on earth (Hobbie, 2000; Paerl, 2006).
ith the high population densities and increasing socioeconomicemands typical of coastal areas, estuarine ecosystems are sub-
ected to multiple anthropogenic stressors. These do not usually
perate independently, but rather interact to produce combinedmpacts on biodiversity and ecosystem functioning (Vinebrooket al., 2004; Dolbeth et al., 2007; Cardoso et al., 2008).∗ Corresponding author at: IMAR-CMA Marine and Environmental Research Cen-re, Department of Life Sciences, University of Coimbra, 3004-517 Coimbra, Portugal.el.: +351 239 837797; fax: +351 239 823603.
E-mail address: [email protected] (A. Baeta).
304-3800/$ – see front matter © 2010 Elsevier B.V. All rights reserved.oi:10.1016/j.ecolmodel.2010.12.010
tradicts the idea that higher system activity is always a sign of healthier
© 2010 Elsevier B.V. All rights reserved.
Nutrient enrichment is one of the widespread stressors. Estuar-ies, which are critical habitats for nutrient recycling and ecosystemproductivity, often receive large nutrient inputs derived fromhuman activities and agricultural discharges, which are gener-ally followed by severe eutrophication events (Valiela et al., 1997;Cloern, 2001; Bode et al., 2006; Lotze et al., 2006). Eutrophi-cation severely impacts the diversity of primary producers andconsumers, which leads to alterations in the food web structure,ecosystem productivity and functioning. One of the most importantaspects of this type of disturbance is the proliferation of fast-growing macroalgae that may replace slow-growing macrophytesand significantly decrease the areal extent of seagrass meadows,
which decreases the ecological value of the entire estuary (Shortand Wyllie-Echeverria, 1996; Howarth, 1988; Bricker et al., 1999;Valiela, 2006; Patrício et al., 2009).In addition to the impact of organic loading, estuarine ecosys-tems are also influenced by natural perturbations, such as extreme

1 odell
wattapmfegtfitqfsepZtws1
c2ib1bierc1uip
Pocdhaemtd
“eee
(
(
(
210 A. Baeta et al. / Ecological M
eather events (floods, droughts and heat waves), which can havestrong negative impact on key components of the estuarine sys-
em (e.g. Cardoso et al., 2008; Chainho et al., 2007). Apart fromhe hydrological conditions (e.g. flood and drought periods), vari-bility due to small spatial scale habitat heterogeneity (e.g. plantresence/absence, sediment grain size and organic matter content)ay have a large impact on communities, and thus on ecosystem
unctioning (Pearson and Rosenberg, 1978; Gray, 1997; Raffaellit al., 1998; Cloern, 2001; Patrício et al., 2009). For instance, sea-rass meadows, in comparison to bare sediment, contribute greatlyo estuarine functioning by sustaining longer and more complexood webs, which can affect ecosystem productivity and stabilityn periods of environmental change. Seagrasses increase sedimen-ation of fine sediment particles and thus enhance the quantity anduality of food for many macrofauna invertebrates, which are theundamental trophic link between basal resources and predatorsuch as fish and seabirds. Seagrass meadows are also a nursery forconomically valuable fish (Pinto et al., 2010) and a refuge fromredators (Duarte, 2002). Furthermore, seagrasses, particularlyostera noltii, can contribute to carbon and nutrient sequestra-ion and storage for longer periods than macroalgae. Therefore, theater over the meadow is of higher quality than the water over bare
ediment, and thus eutrophication effects are mitigated (Cebrian,999).
For all the abovementioned reasons, estuaries are particularlyhallenging to model. Previous studies (e.g. Patrício and Marques,006) have shown that an ecosystem consists of so many interact-
ng components that it is impossible to understand how it functionsy examining the component relationships in isolation (Likens,985; Allen, 1988). To avoid this problem, simplified models cane developed that contain enough of the characteristics of the orig-
nal system to resemble reality, but at the same time are simplenough to be understood (Brown, 2004). Mass-balance models rep-esent a “snapshot” of the trophic flows in the ecosystem, andan be used to describe at least part of the reality (Christensen,994). Information gained from studying trophic webs can besed to make predictions of the impacts of natural or human-
nduced events on ecosystems, which can be used for managementurposes.
Previous studies of Mondego estuary (Patrício et al., 2004;atrício and Marques, 2006) described two areas in 1993–1994:ne characterized by a Zostera bed considered to be in a healthyondition as it had high biodiversity, and a bare sediment siteescribed as highly stressed due to strong eutrophication thatad led to the loss of the Zostera meadow and the associ-ted species. In the present study, we return to the modelsstablished previously for these two sites and add diet infor-ation from natural stable isotope ratios to determine how
he properties have evolved since the models were originallyeveloped.
Therefore, six mass-balanced models were developed using theEcopath with Ecosim” software package (v 5.1) to assess differ-nces in benthic food web properties in the Mondego estuarinecosystem (Portugal). The main study objective was to assess theffects of:
1) a period of anthropogenic enrichment of the system which ledto overproduction of organic matter in the form of algal blooms(1993/1994);
2) mitigation measures (e.g. reducing nutrient loading, protecting
seagrass beds and enhancing hydrodynamic circulation) thatwere implemented with the aim of promoting the recoveryof the seagrass beds and the entire surrounding environmentfollowing a long period of eutrophication (1999/2000);3) a centenary flood (winter 2000/2001).
ing 222 (2011) 1209–1221
More specifically, the analysis of the properties of the 6 modelsallowed us to answer the following questions: (1) did the stressevents modify the structure of the primary producers? (2) Whatwas the impact of the stress on grazers and other consumers? (3)Did different types of stress (eutrophication vs flood) have the sameimpact on the communities? (4) Did the habitat structure (Z. noltiimeadows vs bare sediment) influence the community response tostress? And (5) did the mitigation measures lead to the “recovery”of the food webs?
2. Materials and methods
2.1. Study site
The Mondego estuary is a relatively small (860 ha), warm-temperate, polyhaline, intertidal system located on the westernAtlantic coast of Portugal. It consists of two arms: the northern andsouthern arms (Fig. 1). The southern arm is characterized by inter-tidal mudflats (almost 75% of the area) that are exposed at low tide.The tidal range varies between 0.35 and 3.3 m depending on the siteand tide coefficient, while the water residence time varies between1–2 (northern arm) and 3 days (southern arm).
From 1991 to 1997, the communication between the two armsof the estuary became totally interrupted in the upstream area,which caused the river discharge to flow essentially through thenorthern arm. Consequently, water circulation in the southern armbecame mainly dependent on tides and on the small freshwaterinput from a tributary, the Pranto River, artificially controlled bya sluice (Marques et al., 2009). This led to clear eutrophicationsymptoms in the southern arm (e.g. green macroalgal blooms)(Leston et al., 2008; Patrício et al., 2009). In 1997, to decreasethese eutrophication symptoms and test ways of improving thesystem’s condition, the freshwater discharge from the Pranto Riversluice into the southern arm was reduced to a minimum in order todecrease nutrient inputs, and was diverted to the northern arm byanother sluice located further upstream. Moreover, the communi-cation between the northern and southern arms was re-establishedto a very limited extent (periods of only 1.5–2 h before and aftereach high tide peak through a section of only 1 m2) to improvewater circulation (Neto, 2004; Lillebø et al., 2007; Marques et al.,2009).
A long-term study of the Mondego estuary ecosystem carriedout since the mid 1980s made it possible to determine the sys-tem’s responses to these modifications in the physical conditions,such as the changes in the Z. noltii beds and green macroalgae (Ulvaspp.) distribution (e.g. Patrício et al., 2009). Following the inter-ruption of the upstream communication between the two arms,the ecological conditions in the southern arm rapidly deteriorated.The combined effect of an increased water residence time andhigher nutrient concentrations was a major driving force behindthe seasonal Ulva spp. blooms and the consequent severe reduc-tion in the area occupied by Z. noltii beds due to competition withmacroalgae (Marques et al., 2003; Patrício et al., 2009). The shiftin benthic primary producers changed the benthic macrofaunatrophic structure (e.g. Marques et al., 1997, 2003; Cardoso et al.,2004; Patrício and Marques, 2006; Dolbeth et al., 2007). Accordingto Patrício et al. (2009), after experimental mitigation measureswere applied in 1998, this trend appeared to reverse to a certainextent, as the area occupied by Z. noltii was partially regained,the green Ulva spp. blooms stopped, and the macrofauna assem-
blages gave signs of recovering their former condition of the late80s.Winter 2000/01 was characterized by unprecedented high pre-cipitation values compared to the average long-term precipitation(2000/01: 1802.1 mm; 1940–1997: 1030.6 mm), which caused one

A. Baeta et al. / Ecological Modelling 222 (2011) 1209–1221 1211
F ent so aerial
oa
2
w(uawntafablaiaNwo
miGtgpa
bpswu
ig. 1. Map of Mondego estuary showing the sampling sites: Zostera and bare sedimf Mondego estuary. Mapping of benthic vegetation is based on field observations,
f the largest flood events of the century in the Mondego catchmentrea.
.2. Sampling program and laboratory treatment
Intertidal communities, separated apart by approximately 1 km,ere sampled fortnightly (February 1993–June 1994), and monthly
July1994–December 1994; January 1999–December 2000; Jan-ary 2001–December 2002). In all cases, sampling was conductedt two sites in the southern arm (Fig. 1), within the Z. noltii meadow,hich persisted during the early 1990s, and in an area where the Z.
oltii had disappeared, now characterized by bare sediment. Eachime at each site, six replicate cores were taken along a transect todepth of 20 cm (13 cm inner diameter) and then pooled together
or biological material analyses. The sediment was washed through500 mm mesh sieve and the biological material preserved in 4%uffered formalin. Animals and plants were identified to species
evel and subsequently dried at 70 ◦C for 72 h to estimate biomasss dry weight (DW), and ash free dry weight (AFDW) after combust-ng samples for 8 h at 450 ◦C. For each time period, the weights ofll taxa were summed to obtain an annual average standing stock.o data was available for Bacteria, therefore the bacterial biomassas considered has being part of the detritus compartment, as rec-
mmended by Christensen and Pauly (1992a,b).To determine the Chl a concentration, water samples were
onthly collected at the two habitats, from the water column, dur-ng high tide. Sampled water (500–1000 ml) was filtered throughF/C Whatman glass fibre filters (4.7 cm diameter) followed by ace-
one extraction according to Parsons et al. (1985), and expressed asChl a m−3. In the absence of a calculated factor for the chloro-
hyll to carbon conversion, the value of 50 (Eppley et al., 1977) waspplied and considered constant.
To obtain an approximate value for the microphytobenthos
iomass in the system, in June, July and September 2008, the micro-hytobenthos biomass was estimated at each sampling location byampling the top 1 cm of the six 27 cm−2 replicates. The samplesere carefully mixed, freeze-dried and kept in the dark at −20 ◦Cntil further processing. The Chl a content of the dried sedimentites (grey circles). Change in the area covered by Zostera noltii in the southern armphotographs and a GIS methodology (Arc View GIS version 8.2).
was extracted in 90% acetone over 20 h in the dark; Chl a was thenmeasured using a fluorometer, and expressed as g Chl a m−2. TheC:Chl a ratio was considered constant and equal to 40 mg C mg Chla−1 (De Jonge, 1980).
Carbon was converted to ash-free dry weight (AFDW) using therelation 1 g C = 0.45 g AFDW (Jørgensen et al., 1991).
2.3. Modelling approach
2.3.1. CompartmentsDifferent numbers of compartments were identified in each sit-
uation: 36, 31 and 24 in the Zostera site, and 25, 20 and 20 in the baresediment site, for the three periods, 1993/1994, 1999/2000 and2001/2002 respectively. Species that were not naturally present inone of the three years or sites or whose roles in the trophic networkwere unimportant (biomass < 0.001 g AFDW m−2) were not takeninto account. The Detritus compartment reflects the standing stockof non-living organic matter in the sediments (including differenttypes of plant tissue, dead microbes, faeces), the suspended organicmatter, inputs from the river basin and from the ocean, and flowsfrom living organisms.
2.3.2. Ecopath model equationsEcopath trophic models are mass-balanced models that account
for energy flows (to and from each compartment) in a food web. Theparameterization of the Ecopath model is based on two ‘master’equations. The first equation divides the production of each com-partment included in the system into predation mortality, exportsand biomass accumulation:
Bi ×(
P
B
)i× EEi −
∑j
(Bj ×
(Q
B
)j× DCij
)− Yi − BAi − Ei = 0
(1)
where Bi and Bj are the biomasses of prey (i) and predators (j)respectively; P/Bi the production/biomass ratio; EEi the ecotrophicefficiency, defined as the fraction of the production of each groupthat is used in the food web by means of predation and fishingexploitation; Yi the fisheries catch per unit area and time; Q/Bj the
1212 A. Baeta et al. / Ecological Modell
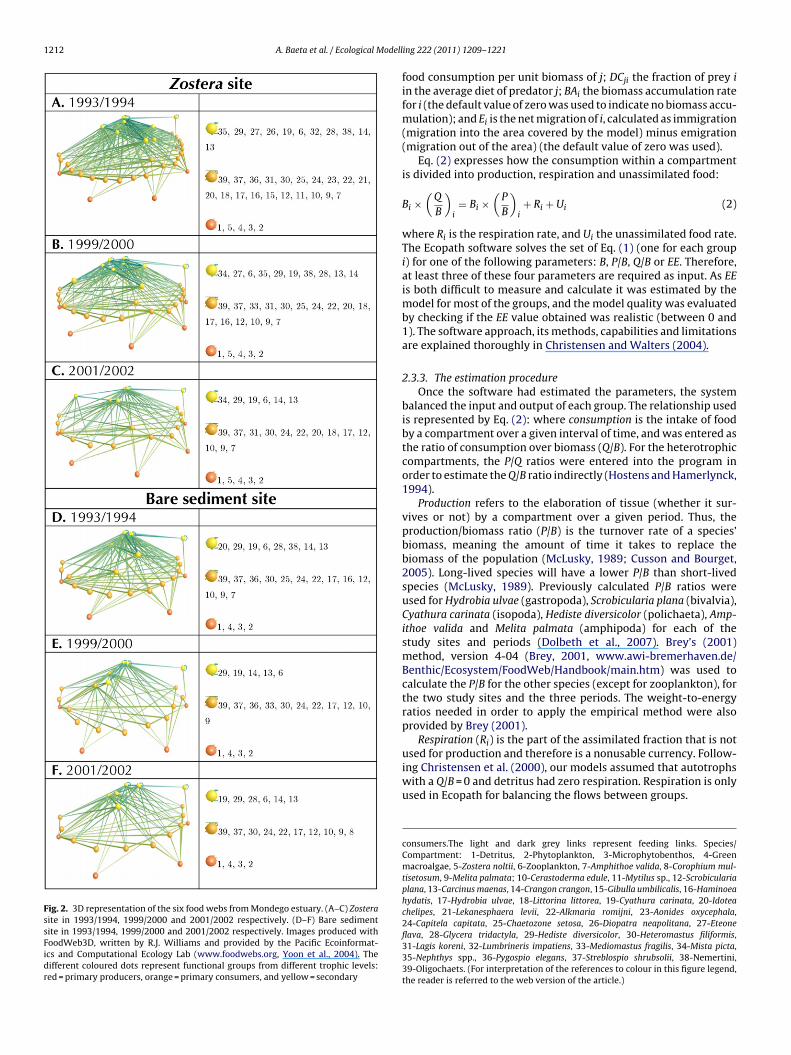
Fig. 2. 3D representation of the six food webs from Mondego estuary. (A–C) Zosterasite in 1993/1994, 1999/2000 and 2001/2002 respectively. (D–F) Bare sedimentsite in 1993/1994, 1999/2000 and 2001/2002 respectively. Images produced withFoodWeb3D, written by R.J. Williams and provided by the Pacific Ecoinformat-ics and Computational Ecology Lab (www.foodwebs.org, Yoon et al., 2004). Thedifferent coloured dots represent functional groups from different trophic levels:red = primary producers, orange = primary consumers, and yellow = secondary
ing 222 (2011) 1209–1221
food consumption per unit biomass of j; DCji the fraction of prey iin the average diet of predator j; BAi the biomass accumulation ratefor i (the default value of zero was used to indicate no biomass accu-mulation); and Ei is the net migration of i, calculated as immigration(migration into the area covered by the model) minus emigration(migration out of the area) (the default value of zero was used).
Eq. (2) expresses how the consumption within a compartmentis divided into production, respiration and unassimilated food:
Bi ×(
Q
B
)i= Bi ×
(P
B
)i+ Ri + Ui (2)
where Ri is the respiration rate, and Ui the unassimilated food rate.The Ecopath software solves the set of Eq. (1) (one for each groupi) for one of the following parameters: B, P/B, Q/B or EE. Therefore,at least three of these four parameters are required as input. As EEis both difficult to measure and calculate it was estimated by themodel for most of the groups, and the model quality was evaluatedby checking if the EE value obtained was realistic (between 0 and1). The software approach, its methods, capabilities and limitationsare explained thoroughly in Christensen and Walters (2004).
2.3.3. The estimation procedureOnce the software had estimated the parameters, the system
balanced the input and output of each group. The relationship usedis represented by Eq. (2): where consumption is the intake of foodby a compartment over a given interval of time, and was entered asthe ratio of consumption over biomass (Q/B). For the heterotrophiccompartments, the P/Q ratios were entered into the program inorder to estimate the Q/B ratio indirectly (Hostens and Hamerlynck,1994).
Production refers to the elaboration of tissue (whether it sur-vives or not) by a compartment over a given period. Thus, theproduction/biomass ratio (P/B) is the turnover rate of a species’biomass, meaning the amount of time it takes to replace thebiomass of the population (McLusky, 1989; Cusson and Bourget,2005). Long-lived species will have a lower P/B than short-livedspecies (McLusky, 1989). Previously calculated P/B ratios wereused for Hydrobia ulvae (gastropoda), Scrobicularia plana (bivalvia),Cyathura carinata (isopoda), Hediste diversicolor (polichaeta), Amp-ithoe valida and Melita palmata (amphipoda) for each of thestudy sites and periods (Dolbeth et al., 2007). Brey’s (2001)method, version 4-04 (Brey, 2001, www.awi-bremerhaven.de/Benthic/Ecosystem/FoodWeb/Handbook/main.htm) was used tocalculate the P/B for the other species (except for zooplankton), forthe two study sites and the three periods. The weight-to-energyratios needed in order to apply the empirical method were alsoprovided by Brey (2001).
Respiration (Ri) is the part of the assimilated fraction that is not
used for production and therefore is a nonusable currency. Follow-ing Christensen et al. (2000), our models assumed that autotrophswith a Q/B = 0 and detritus had zero respiration. Respiration is onlyused in Ecopath for balancing the flows between groups.consumers.The light and dark grey links represent feeding links. Species/Compartment: 1-Detritus, 2-Phytoplankton, 3-Microphytobenthos, 4-Greenmacroalgae, 5-Zostera noltii, 6-Zooplankton, 7-Amphithoe valida, 8-Corophium mul-tisetosum, 9-Melita palmata; 10-Cerastoderma edule, 11-Mytilus sp., 12-Scrobiculariaplana, 13-Carcinus maenas, 14-Crangon crangon, 15-Gibulla umbilicalis, 16-Haminoeahydatis, 17-Hydrobia ulvae, 18-Littorina littorea, 19-Cyathura carinata, 20-Idoteachelipes, 21-Lekanesphaera levii, 22-Alkmaria romijni, 23-Aonides oxycephala,24-Capitela capitata, 25-Chaetozone setosa, 26-Diopatra neapolitana, 27-Eteoneflava, 28-Glycera tridactyla, 29-Hediste diversicolor, 30-Heteromastus filiformis,31-Lagis koreni, 32-Lumbrineris impatiens, 33-Mediomastus fragilis, 34-Mista picta,35-Nephthys spp., 36-Pygospio elegans, 37-Streblospio shrubsolii, 38-Nemertini,39-Oligochaets. (For interpretation of the references to colour in this figure legend,the reader is referred to the web version of the article.)

odell
t(ow
2
fmaqcidtisih2dtdS21aeeFNMMeaa
2
tsedc
2
petdetecorIau(pu(f
A. Baeta et al. / Ecological M
Finally, the Unassimilated food (Ui) is an input fraction of foodhat is not assimilated (i.e. egested). Following Christensen et al.2000), our energy models used a Ui default value of 0.20 (i.e. 20%f the consumption for all groups), and the non-assimilated foodas allocated to the detritus.
.3.4. Diet compositionThe diet matrices of the benthic species were built using data
rom a variety of sources (Appendices A and B). Quantitative infor-ation on diet composition from the study system was only
vailable for the crab Carcinus maenas (Baeta et al., 2006), andualitative information was available for H. ulvae, S. plana, C.arinata, A. valida, M. palmata. Baeta et al. (2009a,b) measuredsotopic signatures (both �13C and �15N) in the tissues of pro-ucers and consumers and obtained qualitative information onhe trophic structure of the benthic and water column food websn the Mondego estuary for both the Zostera and bare sedimentites. Moreover, possible food sources for the macrobenthos werenvestigated by using linear mixing models (ISOSOURCE software,ttp://www.epa.gov/wed/pages/models/.htm) (Phillips and Gregg,001, 2003), and the mean dietary proportion of consumers wasetermined (Baeta et al., submitted for publication). Complemen-ary information on diet composition was gathered using dietaryata from the literature (see Rosado-Salórzano and Próo, 1998;erôdio and Catarino, 2000; Sand-Jensen, 1975; Dolbeth et al.,003; Pardal, 1998; Grilo et al., 2009; Pérez-Lloréns and Niell,993; Brotas and Catarino, 1995; Lillebø et al., 2005; Andersonnd Williams, 1998; Almeida et al., 2002; Appendix B) (Azeiteirot al., 1999; Baird et al., 2004; Bamber, 2004; Beukema, 1991; Bodet al., 2006; Cunha et al., 2000; Dauer et al., 1981; Eklöf et al., 2005;erreira et al., 2004; Garcia-Arberas and Rallo, 2002; Gaston andasci, 1988; Giere, 1975; Hily et al., 2008; Mancinelli et al., 2005;angum et al., 1968; Malaquias et al., 2004; Mazik and Elliott, 2000;cDermott and Roe, 1985; Mistri et al., 2001; Oh et al., 2001; Oug
t al., 1998; Pardal et al., 2000; Rakocinski et al., 1997; Solis-Weiss etl., 2004; Thiel and Reise, 1993; Verdelhos et al., 2005; Volkenbornnd Reise, 2007).
.3.5. Catches (Yi)A complete network needs estimates of the export rates from
he system, including the harvesting of economically importantpecies. In the present work, the harvesting of S. plana, Cerastodermadule and C. maenas for human consumption and the polychaete H.iversicolor and decapod Crangon crangon for bait for fisheries wasonsidered small enough to be negligible.
.3.6. Balancing the modelsFor each of the six models (one model per station and sam-
ling period), the software calculated the missing parameters. Asxpected, initially none of the models were balanced (e.g. nega-ive flows to detritus, EE higher than 1 – which indicates that theemand is too high to be sustainable). According to Christensent al. (2000) the normal procedure for building Ecopath models iso start with a low quality first model and then adjust the param-ters entered within the range of possible values, trying to avoidhanging the more reliable data. Therefore, changes were madene at the time, and each time the basic estimates routine waserun and re-examined. Data were re-edited whenever necessary.n our study, the most reliable data were the macrofauna biomassnd production, determined in situ, and consequently these val-es were left unchanged. One exception was the decapod biomass
C. crangon and C. maenas); for the decapod species the biomassarameter was estimated by the software because the original val-es were underestimated owing to the sampling strategy usedsampling was carried out using a TASM rather than nets suitableor catching pelagic organisms). For subsequent balancing it wasing 222 (2011) 1209–1221 1213
necessary to re-evaluate the diet composition of some compart-ments (e.g. C. maenas, C. crangon, C. carinata, H. diversicolor, Littorinalittorea), since the feeding habits of these species are highly labileand mainly depend on the food sources that are available in theecosystem. Adjustments were made within the range of the mini-mum and maximum contributions of each source in the consumers’diet, given by the linear mixing models (Baeta et al., submittedfor publication), as well as taking into account the trophic groupof each species. A diet fraction is impossible if it pushes anotherdiet fraction outside its feasible range. Therefore, we calculated theupper limit of the amount of a given prey item that a predator canconsume (i.e. available prey biomass) using the highest possibleproduction rate of the prey and the lowest total consumption ofthe prey by other predators. The highest fraction for prey i in thediet of predator j was then given by the highest available biomass ofprey i divided by the lowest possible consumption rate of predatorj. The lower limit for the diet fraction was obtained in a similar way(for more details see Baeta et al., submitted for publication).
2.3.7. Summary of ecological statistics and indicesA number of statistics that describe an ecosystem as a
whole were calculated for assessing the status of the ecosystem(Christensen et al., 2000) at the two study sites in the three timeperiods, that is, the sum of all consumptions, exports, respiratoryflows, flows to detritus, production (all in g AFDW m−2 y−1), andtotal biomass (excluding detritus) (g AFDW m−2). Other measureswere also estimated:
The total system throughput, TST (g AFDW m−2 y−1), is the sumof all flows in a system (consumption + export + flows to detri-tus + respiration).
The net primary production (g AFDW m−2 y−1) is calculated asthe total primary production from all producers.
The net system production (g AFDW m−2 y−1) is the differencebetween total primary production and total respiration. Accordingto Odum (1969), it will be large in immature systems and close tozero in mature ones. Moreover, systems with large imports mayhave negative system production.
The total primary production/total biomass (y−1) is expected to bea function of the system’s maturity. In immature systems, produc-tion exceeds respiration for most groups, and therefore the biomasscan be expected to accumulate over time, which in turn will leadto a decline in the ratio.
The total biomass/TST (y) is expected to increase and reach amaximum in the most mature stages of the system (Odum, 1971).
The system omnivory index, SOI, is the average omnivory indexof all consumers weighted by the logarithm of each consumer’sfood intake. It is a measure of how the feeding interactions are dis-tributed among trophic levels, and is useful for characterizing theextent to which a system displays web-like features (Christensenet al., 2000). When the value of the omnivory index is zero, theconsumer in question is specialized (i.e. feeds on a single trophiclevel). A large value indicates that the consumer feeds on manytrophic levels (Christensen et al., 2005).
The keystoneness and relative overall effect were estimated foreach compartment in order to indentify keystone species. Thesetwo indices derive from mixed trophic impacts analysis (Libralatoet al., 2006; Coll et al., 2007). The relative overall effect of a com-partment (εi) is the square root of the sum of square of all trophicimpacts of one compartment on each other. It allows the quantifica-tion of direct and indirect effects that one compartment would haveon the others. The keystoneness takes into account the biomass of
the compartment, a keystone species being one showing a struc-turing role in the ecosystem whereas having a low biomass. Forcompartment i:KSi = log[εi(1 − pi)] (3)

1214A
.Baetaet
al./EcologicalModelling
222 (2011) 1209–1221
Table 1Input data and calculated estimates (in parentheses) of all compartments in the food web network for the two areas (Z, Zostera noltii; bs, bare sediment area) for the three time periods (1993/1994; 1999/2000; 2001/2002).Biomass given in g AFDW m−2 (M, macrophytes; Am, amphipoda; B, bivalvia; D, decapoda; G, gastropoda; I, isopoda; P, polychaeta).
Compartment Name 1993/1994 1999/2000 2001/2002
Biomass P/Ba Q/Ba EEa Biomass P/Ba Q/Ba EEa Biomass P/Ba Q/Ba EEa
Z bs Z bs Z bs Z bs Z bs Z bs Z bs Z bs Z bs Z bs Z bs Z bs
1 Phytoplankton 0.336 0.330 135.00 135.00 (0.55) (0.79) 0.326 0.350 135.00 135.00 (0.54) (0.97) 0.316 0.330 135.00 135.00 (0.57) (0.94)2 Microphytobenthos 4.200 6.000 40.00 40.00 (0.96) (0.62) 4.200 6.000 40.00 40.00 (0.97) (0.36) 4.200 6.000 40.00 40.00 (0.98) (0.24)3 Green macroalgae 2.201 64.371 3.20 3.20 (0.97) (0.03) 1.679 2.178 3.20 3.20 (0.41) (0.08) 2.462 0.515 3.20 3.20 (0.20) (0.16)5 Zostera noltii (M) 194.141 2.50 (0.01) 62.266 2.50 (0.00) 108.222 2.50 (0.00)6 Zooplankton (0.069) (0.030) 22.00 18.00 (88.00) (90.00) 0.95 0.95 (0.025) (0.056) 22.00 18.00 (88.00) (90.00) 0.95 0.95 (0.042) (0.027) 22.00 18.00 (88.00) (90.00) 0.95 0.957 Ampithoe valida (Am) (0.169) 0.080 6.40 7.05 (32.00) (35.25) 0.95 0.75 0.039 6.47 (32.35) 0.98 0.018 5.38 (26.88) (0.95)8 Corophium multisetosum (Am) 0.006 6.87 (34.37) (0.39)9 Melita palmata (Am) 0.116 0.059 7.10 11.33 (35.50) (56.65) (0.98) (0.62) 0.007 (0.015) 7.79 3.42 (38.97) (17.10) (0.62) 0.95 0.021 0.007 5.95 2.11 (29.76) (10.55) (0.74) (0.20)
10 Cerastoderma edule (B) 4.484 0.131 0.91 7.91 (4.60) (39.53) (0.17) (0.05) 0.879 0.047 1.07 2.74 (5.36) (13.70) (0.07) (0.14) 0.409 0.092 0.91 2.35 (4.57) (11.77) (0.62) (0.16)11 Mytilus sp. 0.015 4.10 (20.50) (0.63)12 Scrobicularia plana (B) 2.668 8.337 1.00 1.60 (5.00) (8.00) (0.40) (0.06) 16.762 35.000 1.00 0.90 (5.00) (4.50) (0.14) (0.07) 15.756 23.174 1.00 1.06 (5.00) (5.30) (0.33) (0.09)13 Carcinus maenas (D) 0.780 0.252 2.01 2.94 (10.10) (14.72) (0.56) (0.86) 0.342 0.327 2.23 2.93 (11.13) (14.65) (0.86) (0.63) 0.680 (0.138) 1.92 4.29 (9.62) (21.43) (0.94) (0.51)14 Crangon crangon (D) (0.308) (0.092) 3.97 6.25 (19.90) (31.25) 0.95 0.95 (0.149) (0.152) 3.97 7.57 (19.87) (37.81) 0.95 0.95 (0.209) (0.074) 4.87 6.25 (24.36) (31.25) 0.95 0.9515 Gibulla umbilicallis (G) 0.045 1.81 (9.00) (0.45)16 Haminoea hydatis (G) 0.187 0.066 2.12 2.51 (10.60) (12.54) (0.06) (0.03) 0.101 3.84 (19.21) (0.03)17 Hydrobia ulvae (G) 59.809 6.751 2.00 4.78 (8.00) (23.90) (0.02) (0.01) 21.300 1.692 3.00 3.67 (15.00) (18.35) (0.03) (0.03) 45.273 0.537 2.00 3.30 (10.00) (16.65) (0.08) (0.20)18 Littorina spp. (G) 2.117 1.10 (5.50) (0.12) 0.578 1.03 (5.16) (0.09) 0.204 1.27 (6.37) (0.07)19 Cyathura carinata (I) 0.407 8.077 3.10 3.16 (15.50) (15.80 (0.39) (0.01) 1.095 9.397 2.00 1.53 (10.00) (7.65) (0.12) (0.03) 1.116 8.656 2.00 2.36 (10.00) (11.80) (0.12) (0.02)20 Idotea chelipes (I) 0.036 0.013 4.76 4.23 (23.79) (21.15) (0.93) (0.63) 0.005 5.10 (25.48) (0.94) 0.010 2.98 (14.89) (0.77)21 Lekanesphaera levii (I) 0.002 5.87 (29.37) (0.55)22 Alkmaria romijni (P) 0.022 0.113 9.45 13.15 (47.23) (65.73) (0.81) (0.39) 0.009 0.031 10.65 8.79 (53.25) (43.94) (0.31) (0.63) 0.028 0.057 5.93 9.99 (29.67) (49.95) (0.52) (0.46)23 Aonides oxycephala (P) 0.013 4.90 (24.50) (0.95)24 Capitella capitata (P) 0.009 0.023 7.66 9.72 (38.28) (48.61) (0.78) (0.44) 0.006 0.008 6.47 7.37 (32.35) (36.83) (0.37) (0.39) 0.271 0.006 2.62 9.52 (13.11) (47.60) (0.70) (0.59)25 Chaetozone setosa (P) 0.118 0.008 7.73 13.82 (38.65) (69.11) (0.83) (0.11) 0.032 6.46 (32.28) (0.40)26 Diopatra neapolitana (P) 0.012 2.75 (13.76) (0.59)27 Eteone flava (P) 0.002 6.48 (32.40) (0.66) 0.035 2.39 (11.94) (0.61)28 Glicera tridactyla (P) 0.214 0.004 2.18 5.12 (10.89) (25.62) (0.99) (0.62) 0.061 2.02 (10.09) (0.94) 0.005 5.04 (25.18) (0.78)29 Hediste diversicolor (P) (0.795) 0.423 2.40 1.85 (12.00) (9.25) 0.98 (0.99) 2.417 0.891 1.60 1.72 (8.00) (8.60) (0.97) (0.92) 6.952 2.906 2.00 1.98 (10.00) (9.90) (0.37) (0.96)30 Heteromastus filiformis (P) 0.455 0.142 3.39 4.56 (16.97) (22.81) (0.94) (0.79) 0.473 0.108 3.24 4.44 (16.19) (22.20) (0.96) (0.84) 0.141 0.038 3.60 5.34 (18.01) (26.72) (0.90) (0.74)31 Lagis koreni (P) 0.017 3.40 (17.00) (0.76) 0.008 3.77 (18.84) (0.35) 0.005 4.73 (23.67) (0.49)32 Lumbrineris impatiens (P) 0.081 2.72 (13.61) (0.89)33 Mediomastus fragilis (P) 0.004 0.005 5.75 6.60 (28.75) (33.02) (0.87) (0.23)34 Mista picta (P) 0.023 4.21 (21.07) (0.45) 0.049 2.46 (12.28) (0.69)35 Nephtys hombergii (P) 0.034 2.55 (12.76) (0.85) 0.040 2.27 (11.35) (0.86)36 Pygospio elegans (P) 0.002 0.010 8.37 10.12 (41.85) (50.60) (0.53) (0.12) 0.011 6.51 (32.53) (0.21)37 Streblospio shrubsoli (P) 0.011 0.009 9.28 13.95 (46.39) (69.76) (0.96) (0.09) 0.003 0.006 9.75 10.04 (48.73) (50.21) (0.89) (0.13) 0.059 0.014 4.42 8.39 (2.08) (41.94) (0.59) (0.44)38 Nemertini 0.004 0.002 5.06 9.65 (25.31) (48.24) (0.89) (0.45) 0.028 4.11 (20.59) (0.91)39 Oligochaets 0.132 0.004 6.74 12.75 (33.70) (63.75) (0.92) (0.52) 0.148 0.004 5.49 10.01 (27.45) (50.03) (0.82) (0.19) 0.071 0.022 3.66 10.10 (18.28) (50.27) (0.80) (0.61)40 Detritus 511.28 305.80 (0.49) (0.43) 511.28 305.8 (0.69) (0.55) 527.31 305 (0.77) (0.57)
a P, production; Q, consumption; EE, ecotrophic efficiency.

A. Baeta et al. / Ecological Modelling 222 (2011) 1209–1221 1215
Table 2Summary of ecological statistics/indices for the two areas (Zostera site and bare sediment site) for the three time periods (1993/1994; 1999/2000; 2001/2002).
Statistic/indices Zostera site Bare sediment site
1993/1994 1999/2000 2001/2002 1993/1994 1999/2000 2001/2002
Sum of all consumptions (g AFDW m−2 y−1) 592.255 470.232 642.164 395.542 289.694 277.682Sum of all exports (g AFDW m−2 y−1) 350.632 91.879 105.462 253.583 121.821 120.367Sum of all respiratory flows (g AFDW m−2 y−1) 356.904 282.031 385.115 237.927 173.816 166.609Sum of all flows into detritus (g AFDW m−2 y−1) 733.167 358.96 533.388 450.049 269.277 286.576Sum of all production (g AFDW m−2 y−1) 823 468 618 571 350 342Total system throughput (g AFDW m−2 y−1) 2036 1203 1666 1337 855 851Net primary production (g AFDW m−2 y−1) 705.756 373.048 489.093 490.537 294.22 286.198Total primary production/total respiration 1.977 1.323 1.270 2.062 1.693 1.718Net system production (g AFDW m−2 y−1) 348.852 91.016 103.979 252.611 120.403 119.589Total primary production/total biomass (y−1) 2.576 3.300 2.622 5.146 5.228 6.718Total biomass/total system throughput (y) 0.135 0.094 0.112 0.071 0.066 0.050Total biomass (excluding detritus) (g AFDW m−2) 274.01 113.042 186.514 95.327 56.279 42.604Connectance index 0.196 0.200 0.191 0.226 0.180 0.219System omnivory index 0.097 0.101 0.097 0.056 0.080 0.066
0%
20%
40%
60%
80%
100%
1993/1994 1999/2000 2001/2002 1993/1994 1999/2000 2001/2002
etis tnemides eraBetis aretsoZ
% o
f Thr
ough
put
Consumptions (by predation) Exports Respirations Flows into detritus
2036 85116661203 8551377
Fig. 3. Partitioning of throughput (total absolute values at the top of each bar) among consumption by predators, exports, flow to detritus and respiration at the Zostera siteand bare sediment site in the three time periods (1993/1994; 1999/2000 and 2001/2002).
-2
0
2
4
6
8
10
1993
/199
4
1999
/200
0
2001
/200
2
1993
/199
4
1999
/200
0
2001
/200
2
1993
/199
4
1999
/200
0
2001
/200
2
1993
/199
4
1999
/200
0
2001
/200
2
1993
/199
4
1999
/200
0
2001
/200
2
1993
/199
4
1999
/200
0
2001
/200
2
1993
/199
4
1999
/200
0
2001
/200
2
Phytoplankton Microphytobenthos Green macroalgae Zostera noltii Phytoplankton Microphytobenthos Green macroalgae
Zostera site Bare sediment site
Nat
ural
log
Flow
s (g
AFD
W m
-2y-1
)
-2
0
2
4
6
8
10
12
Nat
ural
log
Bio
mas
s (g
AFD
W m
-2 )Consumption (grazing) Flow to detritus Biomass
Zostera siteZostera site Bare sediment siteBare sediment site
F(
ig. 4. Flows (consumption, flow to detritus, exports and respiration) from each prima1993/1994, 1999/2000 and 2001/2002).
ry producer at the Zostera site and bare sediment site in the three time periods

1216 A. Baeta et al. / Ecological Modelling 222 (2011) 1209–1221
Fig. 5. Biomass (A and B), Consumption (C and D), Respiration (E and F) and Flow to detritus (G and H) for Hydrobia ulvae (Hyd), Cerastoderma edule (Cer), Scrobiculariaplana (Scr), Littorina spp. (Lit), Hediste diversicolor (Hed), Carcinus maenas (Car), other grazers (Ogra) and other consumers (Ocon) at the Zostera site and bare sediment siterespectively in the three time periods (1993/1994, 1999/2000 and 2001/2002).

A. Baeta et al. / Ecological Modelling 222 (2011) 1209–1221 1217
phymib
mac
zos
zoo amp
mel
cer
myt
scr
carcra
gibham
hydlit cya
ida
lek
alk
aon
cap
chadio
ete
gly hed
het
lag
lum
neppyg
str
nem
oli
-3
-2.5
-2
-1.5
-1
-0.5
0
0.5
0 0.2 0.4 0.6 0.8 1 1.2
Zostera, 1993/94
phy
mibmac
zoszoo
amp
mel
cer
scr
car cra
ham
hydlit cya
ido
alkcap
cha
ete
gly
hed
het
lag
lum
neppyg
str
nem
oli
-3
-2.5
-2
-1.5
-1
-0.5
0
0.5
0 0.2 0.4 0.6 0.8 1 1.2
Zostera, 1999/2000
phy
mib
mac
zos
zooamp
mel
cer
scr
car
crahyd
lit
cya
ido
alk
cap
hed
het
lag
mis
str
oli
-3.5
-3
-2.5
-2
-1.5
-1
-0.5
0
0.5
0 0.2 0.4 0.6 0.8 1 1.2
Zostera, 2001/02
phy
mib
mac
zoo
ampmel
cer
scr carcra
ham
hyd
cya
ido
alk
cap
cha
gly
hed
het
lagstr
nem
oli
-2.5
-2
-1.5
-1
-0.5
0
0.5
0 0.2 0.4 0.6 0.8 1 1.2
Bare sediment, 1993/94
phy
mibmac
zoomel
cer
scr
carcra
hyd
cya
alkcap
hed
het
med
pygstr
oli
-3
-2.5
-2
-1.5
-1
-0.5
0
0.5
0 0.2 0.4 0.6 0.8 1 1.2
Bare sediment, 1999/2000
phy
mibmac
zoo
amp
mel
cer
scr
carcra
hyd
cya
alk
cap
gly
hed
het
str
oli
-2.5
-2
-1.5
-1
-0.5
0
0.5
0 0.2 0.4 0.6 0.8 1 1.2
Bare sediment, 2001/02
Keys
tone
ness
Rela�ve overall effect
Key
ston
enes
sK
eyst
onen
ess
s senen ots yeKsseneno tsyeK
ss eneno ts yeK
Rela�ve overall effect
Rela�ve overall effect Rela�ve overall effect
tceffellarevo evitaleRtceffellarevo evitaleR
Fig. 6. Keystoneness (KSi) and relative overall effect (εi) of each compartment from the 6 food web models. Keystone compartments are those with high values forboth of them. phy = Phytoplankton, mib = Microphytobenthos, mac = Green macroalgae, zos = Zostera noltii, zoo = Zooplankton, amp = Ampithoe valida, mel = Melita pal-mata, cer = Cerastoderma edule, myt = Mytilus sp., scr = Scrobicularia plana, car = Carcinus maenas, cra = Crangon crangon, gib = Gibulla umbilicalis, ham = Haminoea hydatis,hyd = Hydrobia ulvae, lit = Littorina spp., cya = Cyathura carinata, ida = Idotea chelipes, lek = Lekanesfaera levii, alk = Alkmaria romijni, aon = Aonides oxycephala, cap = Capitellacapitata, cha = Chaetozone setosa, dio = Diopatra neapolitana, ete = Eteone flava, gly = Glycera tridactyla, hed = Hediste diversicolor, het = Heteromastus filiformis, lag = Lagis koreni,lum = Lumbrineris impatiens, nep = Nephyts spp., pyg = Pygospio elegans, str = Streblospio shrubsoli, nem = Nemertini, oli = Oligochaets.
1 odell
wb
3
3i
paia
ubaptta
ssTtTitAd
powTtuat(is
bnacsTT
b(iocctnfbo2
t
218 A. Baeta et al. / Ecological M
here pi is the contribution of the compartment i to the totaliomass of the food web.
. Results and discussion
.1. Summary statistics: comparing three time periods at twontertidal sites
The basic input data and model estimations of the dietary com-osition matrices at each site and in each period are given in Table 1nd Appendix A, respectively. The ecological system statistics andndices for the Zostera and bare sediment sites for the three periodsre given in Table 2.
Different numbers of compartments were identified in each sit-ation: 36, 31 and 24 at the Zostera site, and 25, 20 and 20 at theare sediment site, for the three periods, 1993/1994, 1999/2000nd 2001/2002 respectively. There was no aggregation of com-artments; species that were not naturally present in one of thehree areas or whose roles in the trophic network were unimpor-ant (biomass < 0.001 g AFDW m−2) were not taken into account atspecific time and space.
No aggregation of macrofauna species was also used in othertudies (e.g. Baird et al., 2004, 2007), as each species has its ownpecificity, and the same threshold value for negligible species.his is confirmed by the observation that there are some varia-ions in isotopic contents among the species (Baeta et al., 2009a,b).he same choice is not always done, as some authors gather speciesnto functional groups which has been shown to modify the proper-ies described by indices (e.g. Abarca-Arenas and Ulanowicz, 2002;ngelini and Agostinho, 2005). In this study, due to the very preciseata obtained no aggregations of species were made.
The total consumption, exports, respiration, flow to detritus androduction were higher in the Zostera site for the three time peri-ds compared to the bare sediment site, except for the total exports,hich was lower at the Zostera site in 1999/2000 and 2001/2002.
he Zostera site in the period 99/00 showed the lowest values forhe total exports. For the bare sediment system, the lowest val-es for the sum of each type of flow were found in the 1999/2000nd 2001/2002 periods, which had very similar values. Similarly,he total system throughput was always higher at the Zostera siteTable 2), which shows that there is a higher level of system activityn this community. Fig. 2 illustrates the six food webs (one for eachite and time period).
The overall structure of flows is partially influenced by the num-er of compartments. Respiration, flow to detritus and exports areot sensitive to the number of compartments, but consumptionnd the TST are. Accordingly, the Zostera site, due to its complexommunity, had a larger number of compartments than the bareediment site, and showed a higher level of system activity (e.g.ST). Probably for the same reason, both areas showed their highestST values during the period of nutrient enrichment (1993/1994).
To measure how the feeding interactions are distributedetween trophic levels, Ecopath calculates the Omnivory IndexOI) for each compartment (Christensen et al., 2005). Accord-ng to Heymans (2003), this index is dependent on the numberf compartments in the model: more compartments have moreonnections, and there is less omnivory when compartments areombined and diets consolidated. In this study, despite the dis-urbance events (nutrient enrichment or flood) and the differentumbers of compartments, the Zostera site showed a similar SOI
or all the time periods and always had higher values than the
are sediment site. Interestingly, the index decreased, althoughnly slightly, during the disturbance periods (1993/1994 and001/2002).In comparison with the previous preliminary attempt to modelhe food web characteristics of the two sites during the period of
ing 222 (2011) 1209–1221
nutrient enrichment (1993/1994) (Patrício and Marques, 2006), wefound several differences with regard to community structure andflows in the present study (e.g. present study: lower TST, total pro-duction, total respiration, total exports, flow to detritus, SOI). Inour models the species were not aggregated, the P/B ratios werecalculated for the two sites for each period, and new informationand measurements of the diets of benthic species (Baeta et al.,2006, 2009a,b, submitted for publication) were used for modelbalancing, which probably modified the previous models’ results.This allowed the quantitative contribution of the consumers’ foodsources to be estimated more accurately using mixing models andindex values as well as the quantification information on nutri-tion sources of the estuarine invertebrates inhabiting the two studyareas.
3.2. Effects of different ecological conditions on primaryproducers
The Zostera area in 1999/2000 and 2001/2002 showed simi-lar partitioning of the total throughput: between around 39% ofthe total flow was due to consumption, approximately 6–8% wasexported, about 30–32% flowed to detritus, and around 23% wasrespired (Fig. 3). At the Zostera site, the major difference concerneda higher value (18%) for exports during the nutrient enrichmentperiod (1993/1994).
The differences in the breakdown of throughput, with higherexports and flows to detritus in the period 1993/1994, were mainlydue to differences in the macrophyte biomass. It is well known thatmacrophytes support two types of food webs: a herbivorous web,in which herbivores feed directly on the plant, and a detritivorousweb, in which some species feed on the plant detritus. According toEnriques et al. (1993), macrophytes are major producers of organicmatter; however, little of this production enters the grazing foodchain because there is a time lag between production and utilisationsince few animals feed on these plants directly. This production isusually used after decomposition and a large proportion of the pro-duction decays to detritus or is washed away from the productionarea and used in other systems. This is consistent with the resultsof the current study (Fig. 4).
Similar results were obtained over time in the bare sedimentmodels, with a similar partitioning of the total throughput. Between30 and 34% of the total throughput was due to consumption, about32–34% flowed to detritus, and approximately 18–20% was respired(Fig. 3). The major difference found for the three periods was ahigher exports value in 1993/1994 compared to the other two peri-ods (19% vs 14% respectively). Although the microphytobenthosdata used in the six models were obtained from only sampling col-lections during June, July and September of 2008 (corresponding tothe growing season), it is likely that this compartment play a cru-cial role in this system production (Fig. 4). In 1993/1994, althoughthe macroalgae biomass was extremely high (64.4 g AFDW m−2)(Fig. 4), the consumption of this primary producer was very low.Consequently, at the bare sediment site, during the period of nutri-ent enrichment, a large percentage of the primary production (thatled to excessive production of organic matter in the form of greenalgal blooms) passed to the detritus compartment (Fig. 4).
The annual rate of net primary production showed higher valuesin 1993/1994 for both sites (Table 2), which clearly reflects the pri-mary production dynamic in each time period (Fig. 4). The Zosterasite had higher production than the bare sediment site, which isconsistent with the hypothesis that less impacted systems exhibit
higher rates of net primary production (Odum, 1969).Studies on the effects of different ecological conditions, forexample hurricanes and flood events, on primary producers do notshow, however, a clear direction. On one hand, hurricanes effectsare low on primary producers; Anton et al. (2009) report: “Overall,
odell
ntsttrtts
3
IurtS6nitdef2ptt
ttpemsoitrtTfbui
nc
temaitZtra
plapI
A. Baeta et al. / Ecological M
atural temporal changes recorded before the storm were largerhan any post-hurricane changes. These findings indicate that thiseagrass meadow was naturally highly dynamic and very resistanto Hurricane Katrina”. On another hand, seagrass meadows seemso shrink a lot due to flood events; Campbell and McKenzie (2004)eport: “Mapping surveys showed that approximately 90% of inter-idal seagrasses in the northern Great Sandy Strait disappeared afterhe February 1999 flooding of the Mary River. Full recovery of alleagrass meadows took 3 years”.
.3. Effects of disturbances on grazers and other consumers
The grazers accounted for most of the consumer biomass (Fig. 5).n particular at the Zostera site, independently of the time period, H.lvae, C. edule, S. plana, L. litorea, H. diversicolor and C. maenas rep-esented 99% of the total grazer biomass and approximately 95% ofhe total consumer biomass (Fig. 5A). At the bare sediment site,. plana, H. diversicolor, H. ulvae and C. maenas corresponded to4–79% of the total consumer biomass (Fig. 5B). It is also worthoting that in this habitat the other consumers play a relevant role
n the system consumption flows, unlike what was observed inhe Zostera meadow community, in which the flows were totallyominated by grazers. It is well known that engineer species, andspecially Z. noltii, lead to high diversity (Duarte, 2002) and alsoavour epibenthic compared to endobenthic species (Bouma et al.,009), by leading to a more complex habitat above ground. In theresent study, both endo and epibenthic species are favoured byhe Zostera, possibly because the roots of the macrophyte are notoo dense.
In summary, H. ulvae is the species dominating the biomass inhe macrophyte meadows and S. plana plays the dominant role inhe bare sediment habitat. Not surprisingly, the consumption, res-iration and flow to detritus are dominated by these two species,ach in its preferred habitat (Fig. 5C–H). For all Zostera meadowodels, H. ulvae appears as being one of the 3 most important
pecies. It shows, at the same time, one of the highest relativeverall effects, which means that its influence is high, directly orndirectly, on all other species, and a high keystoneness. This meanshat even when considering only a unit of its biomass, the effectemains very high. So the key role of H. ulvae is not only connectedo its biomass, but also to the trophic situation inside the food web.wo other species are found as key compartment in the Zosteraood webs: C. carinata and H. diversicolor. The keystoneness in theare sediment habitat is also high for these two compartments. H.lvae is not anymore among the key species, nevertheless S. plana
s always present among the 6 most important species.What was the effect of the different types of disturbances (i.e.
utrient enrichment, mitigation measures and centenary flood) ononsumers?
At both sites, H. ulvae showed the highest biomass, consump-ion, respiration and flow to detritus during the period of organicnrichment. After preliminary mitigation measures were imple-ented, the structure and activity indices decreased, and then rose
gain after another disturbance event, i.e. the centenary flood dur-ng the winter of 2001. In Fig. 6, the position of H. ulvae showshat it remains among the key species in the 3 models at theostera meadow. Its relative overall effect reduces from 1993/1994o 1999/2000 and also to 2001/2002, however the keystonenessemains high, showing that even a reduced biomass remains withhigh effect on other compartments.
Patrício et al. (2009) used the Mondego estuary to test the
erformance and robustness of a set of ecological indicators to high-ight the changes in the ecological state of intertidal areas overperiod of 17 years (1985–2002). They tested differences over
eriods characterized by different anthropogenic disturbances.ndices were compared with biological and abiotic descriptors
ing 222 (2011) 1209–1221 1219
(macroalgae, macrophytes, benthic macrofauna, nutrient concen-trations, sediment grain size and total organic carbon). Their resultsshowed that during the period of works and closure of the channelbetween the 2 arms of the estuary (1993/1994), the abundance ofsome opportunistic polychaete species of Tubificidae and H. ulvae(Alkmaria romijni, Heteromastus filiformis, Capitela capitata andChaetozone setose) was much higher than in the period before thedisturbance (1986) and the period following mitigation measures(1998–2002). Our model results are in line with the abovemen-tioned study, and among these opportunistic polychaete species,H. filiformis shows the highest value of keystoneness and relativeoverall effect.
Moreover, at both sites after mitigation measures were imple-mented there was an increase in S. plana and H. diversicolor biomass,consumption, respiration and flow to detritus. At the Zostera site,these species were apparently not affected by the flood event; how-ever, at the bare sediment site, S. plana decreased in biomass andflows after the winter 2001 extreme weather event. Fig. 6 showsthat the main keystones species of the bare mudflat are by far theH. diversicolor and C. carinata.
Finally, during the nutrient enrichment period, at the bare sed-iment site it was clearly visible that the other consumers played asubstantial role in the system flows. Their contribution decreasedafter the mitigation measures then regained importance after anew disturbance event (i.e. the flood). Numerous species have highkeystoneness values in 1993/1994, however only H. diversicolorbecomes dominant in 1999/2000 and it remains more or less thesame after the flood event.
3.4. Can food web analysis have management implications?
In the early and mid 1990s, nutrient enrichment of the systemled to macroalgal blooms which depressed the previously domi-nant macrophyte communities (Marques et al., 2003; Patrício et al.,2009). In 1998, mitigation measures were implemented in order torestore the Z. noltii beds and the overall quality of the system. Afew species responded positively (e.g. higher biomass of S. planaand H. diversicolor; lower biomass of H. ulvae), which led to morestructured and stable populations, closer to the less disturbed con-ditions observed in the 80s (Patrício et al., 2009). The results of themass-balanced models show that the trophic structure of the ben-thic communities of Mondego estuary was affected differently bydistinct disturbance events. Interestingly, in this study, a high sys-tem throughput seems to be associated with higher stress levels,which contradicts the idea that higher system activity is always asign of healthier conditions (the period of mitigation measures pre-sented lower TST). This observation should serve as a warning andrequire special precautions in terms of ecological quality assess-ment and management. Moreover, knowing that the direct andindirect responses to changes in hydrology, nutrient enrichment,and extreme weather events can be different in different habitats(Cloern, 2001), realistic management actions need to be based on anew paradigm that takes the entire system into account. Our resultsshow that some important properties are only revealed at the sys-tem level (Jørgensen, 2002). Therefore, a succeeding manuscript isalready in preparation to take full advantage of the results, sincefurther research is needed to link the overall system indices (e.g.biomass/total system throughput, net system production and sys-tem omnivory index) with recognized theories of maturity andsystem development (e.g. Odum, 1971).
Acknowledgments
The present study was partially funded by the research projectsRECONNECT (PTDC/MAR/64627/2006), EXTREMIS (III/36/2008),WISER (FP7-ENV-2008-226273), and 3M-RECITAL (LTER/BIA-

1 odell
BBanPWhb
A
t
R
A
A
A
A
A
A
A
A
B
B
B
B
B
B
B
B
B
B
B
B
B
B
C
C
220 A. Baeta et al. / Ecological M
EC/0019/2009). It was supported by the FCT (Portuguese Nationaloard of Scientific Research) with a grant (SFRH/BD/23574/2005)nd was also subsidized by the European Social Fund and MCTESational funds, through the POPH: Human Potential Operationalrogramme – NSRF: National Strategic Reference Framework – 4.4.e are grateful to all our colleagues who made data available and
elped during the modelling process. Special thanks go to M. Dol-eth, Jeremy Lobry, Géraldine Lassalle and T. Brey.
ppendix A. Supplementary data
Supplementary data associated with this article can be found, inhe online version, at doi:10.1016/j.ecolmodel.2010.12.010.
eferences
barca-Arenas, L.G., Ulanowicz, R.E., 2002. The effects of taxonomic aggregation onnetwork analysis. Ecol. Model. 149, 285–296.
llen, P.M., 1988. Evolution: why the whole is greater than the sum of the parts.Ecodynamics: contributions to Theoretical Ecology. Part 1: evolution. In: Wolff,W., Soeder, C.J., Drepper, F.R. (Eds.), Proceedings of an International Workshop.Germany, 19–20 October 1987. Springer-Verlag, Berlin, pp. 2–30.
lmeida, M.A., Cunha, M.A., Alcântara, F., 2002. Seasonal change in the proportionof bacterial and phytoplankton production along a salinity gradient in a shallowestuary. Hydrobiologia 475/476, 251–262.
nderson, T.R., Williams, P.J.B., 1998. Modelling the seasonal cycle of dissolvedorganic carbon at station E1 in the English Channel. Estuar. Coast Shelf Sci. 46,93–109.
ngelini, R., Agostinho, A.A., 2005. Food web model of the upper Paranà river food-plain: description and aggregation effects. Ecol. Model. 181, 109–121.
níbal, J.M., 1998. Impacte da macroepifauna sobre as macroalgas Ulvales (Chloro-phyta) na ria Formosa. MSc Thesis, University of Coimbra, 73 pp.
nton, A., Cebrian, J., Duarte, C.M., Heck@@Jr.Kenneth, L., Goff, J., 2009. Low impactof Hurricane Katrina on Seagrass Community Structure and Functioning in theNorthern Gulf of Mexico. Bull. Mar. Sci. 85, 45–59.
zeiteiro, U.M.M., Marques, J.C., Ré, P., 1999. Zooplankton annual cycle in the Mon-dego River estuary (Portugal). Arquivos do Museu Bocage III, 239–264.
aeta, A., Cabral, H.N., Marques, J.C., Pardal, M.A., 2006. Feeding ecology of the greencrab Carcinus maenas (L., 1758) in a temperate estuary, Portugal. Crustaceana79, 1181–1193.
aeta, A., Valiela, I., Rossi, F., Pinto, R., Richard, P., Niquil, N., Marques, J.C., 2009a.Eutrophication and trophic structure in response to the presence of the eelgrassZostera noltii. Mar. Biol. 156, 2107–2120.
aeta, A., Pinto, R., Valiela, I., Richard, P., Niquil, N., Marques, J.C., 2009b. �15N and�13C in the Mondego estuary food web: Seasonal variation in producers andconsumers. Mar. Environ. Res. 67, 109–116.
aeta, A., Rossi, F., Patrício, J., Marques, J.C. Habitat-related diet of macrofauna con-sumers in intertidal areas. Estuar. Coast Shelf Sci., submitted for publication.
amber, R.N., 2004. Temporal variation and monitoring of important lagoonal com-munities and species in Wales. Bangor, CCW Marine Monitoring Report no: 12,42 pp.
aird, D., Asmus, H., Asmus, R., 2004. Energy flow of a boreal intertidal ecosystem,the Sylt-Rømø Bight. Mar. Ecol. Prog. Ser. 279, 45–61.
aird, D., Asmus, H., Asmus, R., 2007. Trophic dynamics of eight intertidal commu-nities of the Sylt-Rømø Bight ecosystem, northern Wadden Sea. Mar. Ecol. Prog.Ser. 351, 25–41.
eukema, J.J., 1991. Changes in composition of bottom fauna of a tidal-flat areaduring a period of eutrophication. Mar. Biol. 111, 293–301.
ode, A., Alvarez-Ossorio, M.T., Varela, M., 2006. Phytoplankton and macrophytecontributions to littoral food webs in the Galician upwelling estimated fromstable isotopes. Mar. Ecol. Prog. Ser. 318, 89–102.
ouma, T.J., Olenin, S., Reise, K., Ysebaert, Y., 2009. Ecosystem engineering and bio-diversity in coastal sediments: posing hypotheses. Helgol. Mar. Res. 63, 95–106.
rey, T., 2001. Population dynamics in benthic invertebrates. A virtualhandbook. Version 01.2. http://www.awi-bremerhaven.de/Benthic/Ecosystem/FoodWeb/Handbook/main.html. Alfred Wegener Institute for Polar and MarineResearch, Germany.
ricker, S.B., Clement, C.G., Pirhalla, D.E., Orlando, S.P., Farrow, D.R.G., 1999. NationalEstuarine Eutrophication Assessment: Effects of Nutrient Enrichment in theNation’s Estuaries. NOAA, National Ocean Service, Special Projects Office andthe National Centers for Coastal Ocean Science. Silver Spring, MD, 71 pp.
rotas, V., Catarino, F., 1995. Microphytobenthos primary production of Tagus estu-ary intertidal flats (Portugal). Aquat. Ecol. 29, 315–321.
rown, M.T., 2004. A picture is worth a thousand words: energy systems languageand simulation. Ecol. Model. 178, 83–100.
ampbell, S.J., McKenzie, L.J., 2004. Flood related loss and recovery of intertidal sea-grass meadows in southern Queensland, Australia. Estuar. Coast Shelf Sci. 60,477–490.
ardoso, P.G., Raffaelli, D., Lillebø, A.I., Verdelhos, T., Pardal, M.A., 2008. The impactof extreme flooding events and anthropogenic stressors on the macrobenthiccommunities’ dynamics. Estuar. Coast Shelf Sci. 76, 553–565.
ing 222 (2011) 1209–1221
Cardoso, P.G., Pardal, M.A., Lillebø, A.I., Ferreira, S.M., Raffaelli, D., Marques, J.C., 2004.Dynamic changes in seagrass assemblages under eutrophication and implica-tions for recovery. J. Exp. Mar. Biol. Ecol. 302, 233–248.
Cebrian, J., 1999. Patterns in the fate of production in plant communities. Am. Nat.154, 449–468.
Chainho, P., Costa, J.L., Chaves, M.L., Dauer, D.M., Costa, M.J., 2007. Influence of sea-sonal variability in benthic invertebrate community structure on the use of bioticindices to assess the ecological status of a Portuguese estuary. Mar. Pollut. Bull.54, 1586–1597.
Christensen, V., Pauly, D., 1992a. A guide to the Ecopath II program (version 2.1.).ICLARM Software, pp. 6–72.
Christensen, V., 1994. Energy-based ascendency. Ecol. Model. 72, 129–144.Christensen, V., Pauly, D., 1992b. ECOPATH II – a software for balancing steady-
state ecosystem models and calculating network characteristics. Ecol. Model.61, 169–185.
Christensen, V., Walters, C.J., Pauly, D., 2000. Ecopath with Ecosim—A User’s Guide.University of British Columbia, Fisheries Centre, Vancouver, Canada and ICLARM,Penang, Malaysia, 131 pp.
Christensen, V., Walters, C.J., Pauly, D., 2005. Ecopath with Ecosim Version 5, Helpsystem©. University of British Columbia, Fisheries Centre, Vancouver, Canada.
Christensen, V., Walters, C.J., 2004. Ecopath with Ecosim: methods, capabilities andlimitations. Ecol. Model. 172, 109–139.
Cloern, J.E., 2001. Our evolving conceptual model of the coastal eutrophication prob-lem. Mar. Ecol. Prog. Ser. 210, 223–253.
Coll, M., Santojanni, A., Palomera, I., Tudela, S., Arneri, E., 2007. An ecological modelof the northern and central Adriatic sea: analysis of ecosystem structure andfishing impacts. J. Mar. Syst. 67, 119–154.
Cunha, M.A., Almeida, M.A., Alcântara, F., 2000. Patterns of ectoenzymatic and het-erotrophic bacterial activities along a salinity gradient in a shallow tidal estuary.Mar. Ecol. Prog. Ser. 204, 1–12.
Cusson, M., Bourget, E., 2005. Global patterns of macroinvertebrate production inmarine benthic habitats. Mar. Ecol. Prog. Ser. 297, 1–14.
Dauer, D.M., Maybury, C.A., Ewing, R.M., 1981. Feeding behaviour and general ecol-ogy of several spionid polychaetes from the Chesapeake Bay. J. Exp. Mar. Biol.Ecol. 54, 21–38.
De Jonge, V.N., 1980. Fluctuations in the organic carbon to chlorophyll a ratios forestuarine benthic diatom populations. Mar. Ecol. Prog. Ser. 2, 345–353.
Dolbeth, M., Pardal, A., Lillebø, I., Azeiteiro, U.M.M., Marques, J.C., 2003. Short- andlong-term effects of eutrophication on the secondary production of an intertidalmacrobenthic community. Mar. Biol. 143, 1229–1238.
Dolbeth, M., Cardoso, P.G., Ferreira, S.M., Verdelhos, T., Raffaelli, D., Pardal, M.A.,2007. Anthropogenic and natural disturbance effects on a macrobenthic estuar-ine community over a 10-year period. Mar. Pollut. Bull. 54, 576–585.
Duarte, C.M., 2002. The future of seagrass meadows. Environ. Conserv. 29, 192–206.Eklöf, J.S., de la Torre Castro, M., Adelsköld, L., Jiddawi, N.S., Kautsky, N., 2005. Dif-
ferences in macrofaunal and seagrass assemblages in seagrass beds with andwithout seaweed farms. Estuar. Coast Shelf Sci. 63, 385–396.
Enriques, E., Duarte, C.M., Sand-Jensen, K., 1993. Patterns in decomposition ratesamong photosynthetic organisms: the importance of detritus C:N:P content.Oecologia 94, 457–471.
Eppley, R.W., Harrison, W.G., Chisholm, S.W., Stewart, E., 1977. Particulate organicmatter in surface waters off Southern California and its relationships to phyto-plankton. J. Mar. Res. 35, 671–696.
Ferreira, S.M., Pardal, M.A., Lillebø, A.I., Cardoso, P.G., Marques, J.C., 2004. Popula-tion dynamics of Cyathura carinata (Isopoda) in a eutrophic temperate estuary.Estuar. Coast Shelf Sci. 61, 669–677.
Garcia-Arberas, L., Rallo, A., 2002. Life cycle, demography and secondary productionof the polychaete Hediste diversicolor in a non-polluted estuary in the Bay ofBiscay. Mar. Ecol. 23, 237–251.
Gaston, G.R., Nasci, J.C., 1988. Trophic structure of macrobenthic communities in theCalcasieu estuary, Louisiana. Estuaries 11, 201–211.
Giere, O., 1975. Population structure, food relations and ecological role of marineoligochaetes, with special reference to meiobenthic species. Mar. Biol. 31,139–156.
Grilo, T.F., Cardoso, P.G., Dolbeth, M., Pardal, M.A., 2009. Long-term changes onamphipods’ population dynamics of a temperate estuary following an ecosystemrestoration. Hydrobiologia 630, 91–104.
Heymans, J.J., 2003. Ecosystem models of Newfoundland and SoutheasternLabrador: additional information and analyses for ‘Back to the Future’ , FisheriesCentre Research Reports 11, 79 pp.
Hily, C., Le Loc’h, F., Grall, J., Glémarec, M., 2008. Soft bottom macrobenthic commu-nities of North Biscay revisited: Long-term evolution under fisheries-climateforcing. Estuar. Coast Shelf Sci. 78, 413–425.
Hobbie, J.E. (Ed.), 2000. Estuarine Science: A Synthetic Approach to Research andPractice. Island Press, Washington, DC.
Hostens, K., Hamerlynck, O., 1994. The mobile epifauna of the soft bottoms in thesubtidal Oosterscheld Estuary: structure, function and impact of the storm-surgebarrier. Hydrobiologia 282/283, 479–496.
Howarth, R.W., 1988. Nutrient limitation of net primary production in marineecosystems. Annu. Rev. Ecol. Syst. 19, 89–110.
Gray, J.S., 1997. Marine biodiversity: patterns, threats and conservation needs. Bio-divers. Conserv. 6, 153–175.
Jørgensen, S.E., Nielsen, S.N., Jørgensen, L., 1991. Handbook of Ecological Parametersand Ecotoxicology. Elsevier, Amsterdam.
Jørgensen, S.E., 2002. Integration of Ecosystem Theories: A Pattern, 3rd ed. KluwerAcademic Publishers, The Netherlands, 420 pp.

odell
L
L
L
L
L
L
M
M
M
M
M
M
M
M
M
M
N
OOO
O
P
P
P
A. Baeta et al. / Ecological M
eston, S., Lillebø, A.I., Pardal, M.A., 2008. The response of primary producer assem-blages to mitigation measures to reduce eutrophication in a temperate estuary.Estuar. Coast Shelf Sci. 77, 688–696.
ibralato, S., Christensen, V., Pauly, D., 2006. A method for identifying keystonespecies in food web models. Ecol. Model. 195, 153–171.
ikens, G.E., 1985. An Ecosystem Approach to Aquatic Ecology: Mirror Lake and itsEnvironment. Springer-Verlag, New York.
illebø, A.I., Neto, J.M., Martins, I., Verdelhos, T., Leston, S., Cardoso, P.G., Ferreira, S.M.,Marques, J.C., Pardal, M.A., 2005. Management of a shallow temperate estuaryto control eutrophication: the effect of hydrodynamics on the system’s nutrientloading. Estuar. Coast Shelf Sci. 65, 697–707.
illebø, A.I., Teixeira, H., Pardal, M.A., Marques, J.C., 2007. Applying quality status cri-teria to a temperate estuary before and after the mitigation measures to reduceeutrophication symptoms. Estuar. Coast Shelf Sci. 72, 177–187.
otze, H.K., Lenihan, H.S., Bourque, B.J., Bradbury, R.H., Cooke, R.G., Kay, M.C., Kidwell,S.M., Kirby, M.X., Peterson, C.H., Jackson, J.B.C., 2006. Depletion, degradation, andrecovery potential of Estuaries and Coastal Seas. Science 312, 1806–1809.
ancinelli, G., Sabetta, L., Basset, A., 2005. Short-term patch dynamics of macroin-vertebrate colonization on decaying reed detritus in a mediterranean lagoon(Lake Alimini Grande, Apulia, SE Italy). Mar. Biol. 148, 271–283.
angum, C.P., Santos, S.L., Rhodes, W.R., 1968. Distribution and feeding in theonuphid polychaete Diopatra cuprea (Bosc). Mar. Biol. 2, 33–40.
arques, J.C., Pardal, M.A., Nielsen, S.N., Jørgensen, S.E., 1997. Analysis of the prop-erties of exergy and biodiversity along an estuarine gradient of eutrophication.Ecol. Model. 102, 155–167.
arques, J.C., Nielsen, S.N., Pardal, M.A., Jørgensen, S.E., 2003. Impact of eutrophi-cation and river management within a framework of ecosystem theories. Ecol.Model. 166, 147–168.
arques, J.C., Basset, A., Brey, T., Elliot, M., 2009. The ecological sustainability trigon– a proposed conceptual framework 4 for creating and testing managementscenarios. Mar. Pollut. Bull. 58, 1773–1779.
alaquias, M.A.E., Condinho, S., Cervera, J.L., Sprung, M., 2004. Diet and feedingbiology of Haminoea orbygniana (Mollusca: Gastropoda: Cephalaspidea). J. Mar.Biol. Assoc. UK 84, 767–772.
azik, K., Elliott, M., 2000. The effects of chemical pollution on the bioturbationpotential of estuarine intertidal mudflats. Helgol. Mar. Res. 54, 99–109.
cDermott, J.J., Roe, P., 1985. Food, feeding ecology of nemerteans. Am. Zool. 25,113–125.
cLusky, D.S., 1989. The Estuarine Ecosystem, second ed. Chapman and Hall, NewYork, 215 pp.
istri, M., Fano, E.A., Rossi, R., 2001. Redundancy of macrobenthos from lagoonalhabitats in the Adriatic Sea. Mar. Ecol. Prog. Ser. 215, 289–296.
eto, J.M., 2004. Nutrient enrichment in a temperate macro-tidal system. Scenarioanalysis and contribution to coastal management, PhD Thesis, University ofCoimbra, Portugal.
dum, E.P., 1969. The strategy of ecosystem development. Science 164, 262–270.dum, E.P., 1971. Fundamentals of Ecology. W.B. Saunders Co, Philadelphia, 574 pp.h, C.W., Hartnoll, R.G., Nash, R.D.M., 2001. Feeding ecology of the common shrimp
Crangon crangon in Port Erin Bay, Isle of Man, Irish Sea. Mar. Ecol. Prog. Ser. 214,211–223.
ug, E., Nais, K., Rygg, B., 1998. Relationship between soft bottom macrofauna andpolycyclic aromatic hydrocarbons (PAH) form smelter discharge in Norwegianfjords and coastal waters. Mar. Ecol. Prog. Ser. 173, 39–52.
aerl, H.W., 2006. Assessing and managing nutrient-enhanced eutrophication inestuarine and coastal waters: Interactive effects of human and climatic per-turbations. Ecol. Eng. 26, 40–54.
ardal, M.A., 1998. Impacto da eutrofizacão nas comunidades macrobentónicas do
braco Sul do estuário do Mondego (Portugal). PhD Thesis, University of Coimbra,315 pp.ardal, M.A., Marques, J.C., Metelo, I., Lillebø, A.I., Flindt, M.R., 2000. Impact ofeutrophication on the life cycle, population dynamics and production of Amp-ithoe valida (Amphipoda) along an estuarine spatial gradient (Mondego estuary,Portugal). Mar. Ecol. Prog. Ser. 196, 207–219.
ing 222 (2011) 1209–1221 1221
Parsons, T.R., Maita, Y., Lally, C.M., 1985. Pigments. In: A Manual of Chemical andBiological Methods for Seawater Analysis. Pergamon Press, pp. 101–104.
Patrício, J., Ulanowicz, R., Pardal, M.A., Marques, J.C., 2004. Ascendency as ecologicalindicator: a case study on estuarine pulse eutrophication. Estuar. Coast Shelf Sci.60, 23–35.
Patrício, J., Marques, J.C., 2006. Mass balanced models of the food web in three areasalong a gradient of eutrophication symptoms in the south arm of the Mondegoestuary (Portugal). Ecol. Model. 197, 21–34.
Patrício, J., Neto, J.M., Teixeira, H., Salas, F., Marques, J.C., 2009. The robustness of eco-logical indicators to detect long-term changes in the macrobenthos of estuarinesystems. Mar. Environ. Res. 68, 25–36.
Pearson, T.H., Rosenberg, R., 1978. Macrobenthic succession in relation to organicenrichment and pollution of the marine environment. Ocean Mar. Biol. Annu.Rev. 16, 229–311.
Pérez-Lloréns, J.L., Niell, F.X., 1993. Seasonal dynamics of biomass and nutrient con-tent in the intertidal seagrass Zostera noltii Hornem from Palmones River estuary,Spain. Aquat. Bot. 46, 49–66.
Phillips, D.L., Gregg, J.W., 2001. Uncertainty in source partitioning using stable iso-topes. Oecologia 127, 171–179.
Phillips, D.L., Gregg, J.W., 2003. Source partitioning using stable isotopes: copingwith too many sources. Oecologia 136, 261–269.
Pinto, R., Patrício, J., Neto, J.M., Salas, F., Marques, J.C., 2010. Assessing estuarine qual-ity under the ecosystem services scope: ecological and socioeconomic aspects.Ecol. Complex. 7, 389–402.
Raffaelli, D.G., Raven, J.A., Poole, L.J., 1998. Ecological impact of green macroalgalblooms. Oceanogr. Mar. Biol. Annu. Rev. 16, 229–311.
Rakocinski, C.F., Brown, S.S., Gaston, G.R., Heard, R.W., Walker, W.W., Summers, J.K.,1997. Macrobenthic responses to natural and contaminant-related gradients innorthern Gulf of Mexico estuaries. Ecol. Appl. 7, 1278–1298.
Rosado-Salórzano, R., Próo, S.A., 1998. Preliminary trophic structure model for Tam-pamachoco lagoon, Veracruz, Mexico. Ecol. Model. 109, 141–154.
Sand-Jensen, K., 1975. Biomass, net production and growth dynamics in an eel-grass (Zostera marina L.) population in Vellerup Vig, Denmark. Ophelia 14,185–201.
Serôdio, J., Catarino, F., 2000. Modelling the primary productivity of intertidal micro-phytobenthos: time scales of variability and effects of migratory rhythms. Mar.Ecol. Prog. Ser. 192, 13–30.
Short, F.T., Wyllie-Echeverria, S., 1996. Natural and human induced disturbance ofseagrasses. Environ. Conserv. 23, 17–27.
Solis-Weiss, V., Aleffi, F., Bettoso, N., Rossin, P., Orel, G., Fonda-Umani, S., 2004. Effectsof industrial and urban pollution on the benthic macrofauna in the Bay of Muggia(industrial port of Trieste, Italy). Sci. Total Environ. 328, 247–263.
Thiel, M., Reise, K., 1993. Interaction of nemertines and their prey on tidal flats. Neth.J. Sea Res. 31, 163–172.
Valiela, I., 2006. Global Coastal Change. Blackwell Publishing, Oxford, England, 368pp.
Valiela, I., McClelland, J., Hauxwell, J., Behr, P.J., Hersh, D., Foreman, K., 1997. Macroal-gal blooms in shallow estuaries: controls and ecophysiological and ecosystemconsequences. Limnol. Oceanogr. 42, 1105–1118.
Verdelhos, T., Neto, J.M., Marques, J.C., Pardal, M.A., 2005. The effect of eutrophi-cation abatement on the bivalve Scrobicularia plana. Estuar. Coast Shelf Sci. 63,168–261.
Vinebrooke, R.D., Cottingham, K.L., Norberg, J., Scheffer, M., Dodson, S.I., Maberly,S.C., Sommer, U., 2004. Impacts of multiple stressors on biodiversity and ecosys-tem functioning: the role of species co-tolerance. Oikos 104, 451–457.
Volkenborn, N., Reise, K., 2007. Lugworm exclusion experiment: responses bydeposit feeding worms to biogenic habitat transformation. J. Exp. Mar. Biol. Ecol.
330, 169–179.Yoon, I., Williams, R.J., Levine, E., Yoon, S., Dunne, J.A., Martinez, N.D., 2004. Webson the Web (WoW): 3D visualization of ecological networks on the WWW forcollaborative research and education. In: Proceedings of the IS&T/SPIE Sym-posium on Electronic Imaging, Visualization and Data Analysis, vol. 5295 , pp.124–132.
Related Documents