MARINE ECOLOGY PROGRESS SERIES Mar Ecol Prog Ser Vol. 406: 1–17, 2010 doi: 10.3354/meps08588 Published May 10 INTRODUCTION Phytoplankton community composition varies widely over the global ocean resulting from differences in fitness and species selection in the physical, chemi- cal and predatory environment. Relative fitness of phytoplankton is determined by a number of factors, including the growth dependence on nutrient avail- ability, light and temperature, as well as suscepti- bility to predation, viral lysis and other causes of mortality. © Inter-Research 2010 · www.int-res.com *Email: [email protected] FEATURE ARTICLE Modelling the effects of chromatic adaptation on phytoplankton community structure in the oligotrophic ocean A. E. Hickman 1, 2, *, S. Dutkiewicz 2 , R. G. Williams 1 , M. J. Follows 2 1 Department of Ocean and Earth Sciences, University of Liverpool, Liverpool L69 3GP, UK 2 Department of Earth, Atmospheric and Planetary Sciences, Massachusetts Institute of Technology, Cambridge, Massachusetts 01239, USA ABSTRACT: We explored the role of chromatic adap- tation in shaping vertical phytoplankton community structures using a trait-based ecosystem model. The model included 1000 ‘phytoplankton types’ and was applied to the oligotrophic South Atlantic Gyre in a 1- dimensional framework, where ‘phytoplankton types’ refers to the model phytoplankton that were stochas- tically assigned unique physiological characteristics. The model incorporates multi-spectral optics and light absorption properties for the different phytoplankton. The model successfully reproduced observed vertical gradients in the nitrate, bulk phytoplankton proper- ties and community structure. Model phytoplankton types with Synechococcus-like spectral light absorp- tion properties were outcompeted at depth, where eukaryote-like spectral properties were advantageous. In contrast, photoinhibition was important for vertical separation of high-light and low-light Prochlorococcus model analogues. In addition, temperature depen- dence was important for selection of phytoplankton types on the temperature gradient. The fittest, or successful, phytoplankton types were characterised by combinations of simultaneously optimal traits that suited them to a particular depth in the water col- umn, reflecting the view that phytoplankton have co-evolved multiple traits that are advantageous in a particular environmental condition or niche. KEY WORDS: Phytoplankton · Chromatic adapta- tion · Photosynthesis · Niche · Modelling · Species · Selection · Pigments Resale or republication not permitted without written consent of the publisher The underwater light spectrum provides a complex environ- ment for phytoplankton photosynthesis and growth. Image: Alex Mustard (amustard.com) OPEN PEN ACCESS CCESS

Welcome message from author
This document is posted to help you gain knowledge. Please leave a comment to let me know what you think about it! Share it to your friends and learn new things together.
Transcript
MARINE ECOLOGY PROGRESS SERIESMar Ecol Prog Ser
Vol. 406: 1–17, 2010doi: 10.3354/meps08588
Published May 10
INTRODUCTION
Phytoplankton community composition varies widelyover the global ocean resulting from differences infitness and species selection in the physical, chemi-cal and predatory environment. Relative fitness ofphytoplankton is determined by a number of factors,including the growth dependence on nutrient avail-ability, light and temperature, as well as suscepti-bility to predation, viral lysis and other causes ofmortality.
© Inter-Research 2010 · www.int-res.com*Email: [email protected]
FEATURE ARTICLE
Modelling the effects of chromatic adaptation onphytoplankton community structure in the
oligotrophic ocean
A. E. Hickman1, 2,*, S. Dutkiewicz2, R. G. Williams1, M. J. Follows2
1Department of Ocean and Earth Sciences, University of Liverpool, Liverpool L69 3GP, UK2Department of Earth, Atmospheric and Planetary Sciences, Massachusetts Institute of Technology, Cambridge,
Massachusetts 01239, USA
ABSTRACT: We explored the role of chromatic adap-tation in shaping vertical phytoplankton communitystructures using a trait-based ecosystem model. Themodel included 1000 ‘phytoplankton types’ and wasapplied to the oligotrophic South Atlantic Gyre in a 1-dimensional framework, where ‘phytoplankton types’refers to the model phytoplankton that were stochas-tically assigned unique physiological characteristics.The model incorporates multi-spectral optics and lightabsorption properties for the different phytoplankton.The model successfully reproduced observed verticalgradients in the nitrate, bulk phytoplankton proper-ties and community structure. Model phytoplanktontypes with Synechococcus-like spectral light absorp-tion properties were outcompeted at depth, whereeukaryote-like spectral properties were advantageous.In contrast, photoinhibition was important for verticalseparation of high-light and low-light Prochlorococcusmodel analogues. In addition, temperature depen-dence was important for selection of phytoplanktontypes on the temperature gradient. The fittest, orsuccessful, phytoplankton types were characterisedby combinations of simultaneously optimal traits thatsuited them to a particular depth in the water col-umn, reflecting the view that phytoplankton haveco-evolved multiple traits that are advantageous ina particular environmental condition or niche.
KEY WORDS: Phytoplankton · Chromatic adapta-tion · Photosynthesis · Niche · Modelling · Species ·Selection · Pigments
Resale or republication not permitted without written consent of the publisher
The underwater light spectrum provides a complex environ-ment for phytoplankton photosynthesis and growth.
Image: Alex Mustard (amustard.com)
OPENPEN ACCESSCCESS
Mar Ecol Prog Ser 406: 1–17, 2010
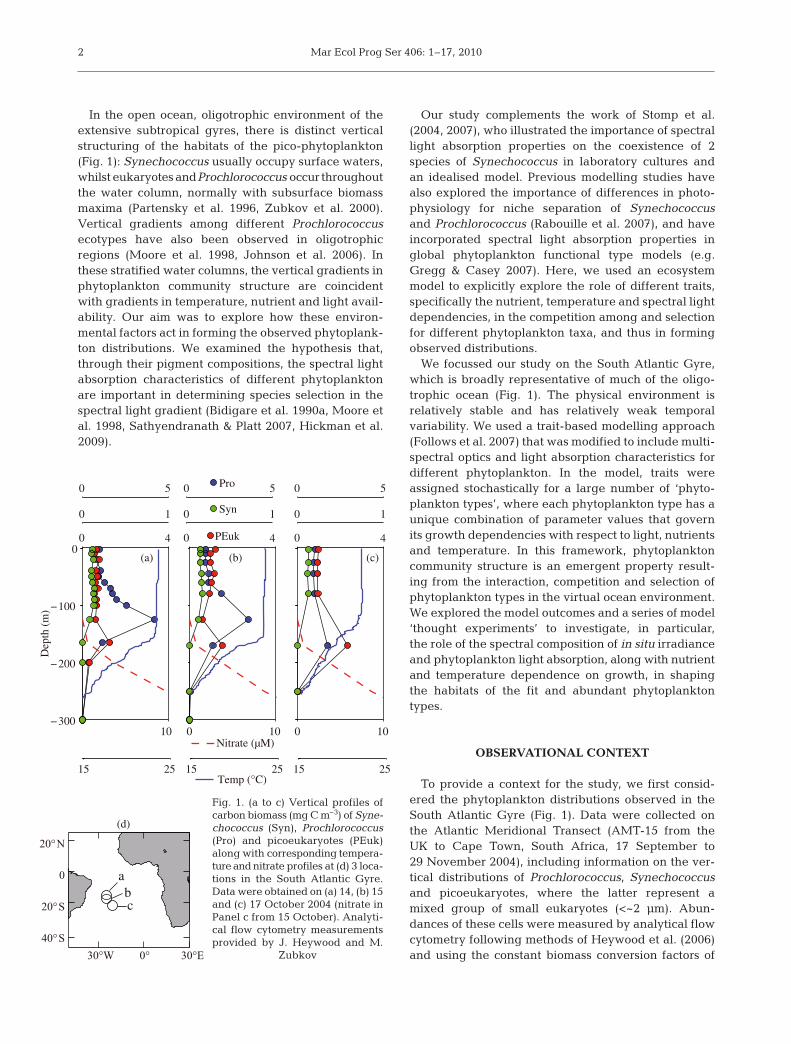
In the open ocean, oligotrophic environment of theextensive subtropical gyres, there is distinct verticalstructuring of the habitats of the pico-phytoplankton(Fig. 1): Synechococcus usually occupy surface waters,whilst eukaryotes andProchlorococcus occur throughoutthe water column, normally with subsurface biomassmaxima (Partensky et al. 1996, Zubkov et al. 2000).Vertical gradients among different Prochlorococcusecotypes have also been observed in oligotrophicregions (Moore et al. 1998, Johnson et al. 2006). Inthese stratified water columns, the vertical gradients inphytoplankton community structure are coincidentwith gradients in temperature, nutrient and light avail-ability. Our aim was to explore how these environ-mental factors act in forming the observed phytoplank-ton distributions. We examined the hypothesis that,through their pigment compositions, the spectral lightabsorption characteristics of different phytoplanktonare important in determining species selection in thespectral light gradient (Bidigare et al. 1990a, Moore etal. 1998, Sathyendranath & Platt 2007, Hickman et al.2009).
Our study complements the work of Stomp et al.(2004, 2007), who illustrated the importance of spectrallight absorption properties on the coexistence of 2species of Synechococcus in laboratory cultures andan idealised model. Previous modelling studies havealso explored the importance of differences in photo-physiology for niche separation of Synechococcusand Prochlorococcus (Rabouille et al. 2007), and haveincorporated spectral light absorption properties inglobal phytoplankton functional type models (e.g.Gregg & Casey 2007). Here, we used an ecosystemmodel to explicitly explore the role of different traits,specifically the nutrient, temperature and spectral lightdependencies, in the competition among and selectionfor different phytoplankton taxa, and thus in formingobserved distributions.
We focussed our study on the South Atlantic Gyre,which is broadly representative of much of the oligo-trophic ocean (Fig. 1). The physical environment isrelatively stable and has relatively weak temporalvariability. We used a trait-based modelling approach(Follows et al. 2007) that was modified to include multi-spectral optics and light absorption characteristics fordifferent phytoplankton. In the model, traits wereassigned stochastically for a large number of ‘phyto-plankton types’, where each phytoplankton type has aunique combination of parameter values that governits growth dependencies with respect to light, nutrientsand temperature. In this framework, phytoplanktoncommunity structure is an emergent property result-ing from the interaction, competition and selection ofphytoplankton types in the virtual ocean environment.We explored the model outcomes and a series of model‘thought experiments’ to investigate, in particular,the role of the spectral composition of in situ irradianceand phytoplankton light absorption, along with nutrientand temperature dependence on growth, in shapingthe habitats of the fit and abundant phytoplanktontypes.
OBSERVATIONAL CONTEXT
To provide a context for the study, we first consid-ered the phytoplankton distributions observed in theSouth Atlantic Gyre (Fig. 1). Data were collected onthe Atlantic Meridional Transect (AMT-15 from theUK to Cape Town, South Africa, 17 September to29 November 2004), including information on the ver-tical distributions of Prochlorococcus, Synechococcusand picoeukaryotes, where the latter represent amixed group of small eukaryotes (<~2 μm). Abun-dances of these cells were measured by analytical flowcytometry following methods of Heywood et al. (2006)and using the constant biomass conversion factors of
2
10−300
−200
−100
0
Nitrate (µM)
Dep
th (
m)
0 4
0 1
(c)
20°N
0
20°S
40°S
30°W 0° 30°E
a
bc
15 25Temp (°C)
0 5
(a) (b)
0 4PEuk
0 1Syn
0 5Pro
0 4
0 1
0 5
0 10 0 10
15 25 15 25
(d)
Fig. 1. (a to c) Vertical profiles ofcarbon biomass (mg C m–3) of Syne-chococcus (Syn), Prochlorococcus(Pro) and picoeukaryotes (PEuk)along with corresponding tempera-ture and nitrate profiles at (d) 3 loca-tions in the South Atlantic Gyre.Data were obtained on (a) 14, (b) 15and (c) 17 October 2004 (nitrate inPanel c from 15 October). Analyti-cal flow cytometry measurementsprovided by J. Heywood and M.
Zubkov
Hickman et al.: Modelling phytoplankton communities
Zubkov et al. (1998). These small cells accounted for~80% of the phytoplankton chlorophyll a (chl a), asmeasured by size fractionation. Synechococcus wererestricted to the surface mixed layer (Fig. 1), whilstProchlorococcus and picoeukaryotes together domi-nated the biomass throughout the water column. BothProchlorococcus and picoeukaryotes exhibited subsur-face biomass peaks. The vertical gradients in thephytoplankton community structure are broadly per-sistent over the South Atlantic Gyre (Fig. 1), and are inaccord with previous observations in the region(Zubkov et al. 2000), and those in other oligotrophicregions (Partensky et al. 1996). Vertical gradients indifferent Prochlorococcus ecotypes have also been ob-served in the South Atlantic Gyre (Johnson et al. 2006).
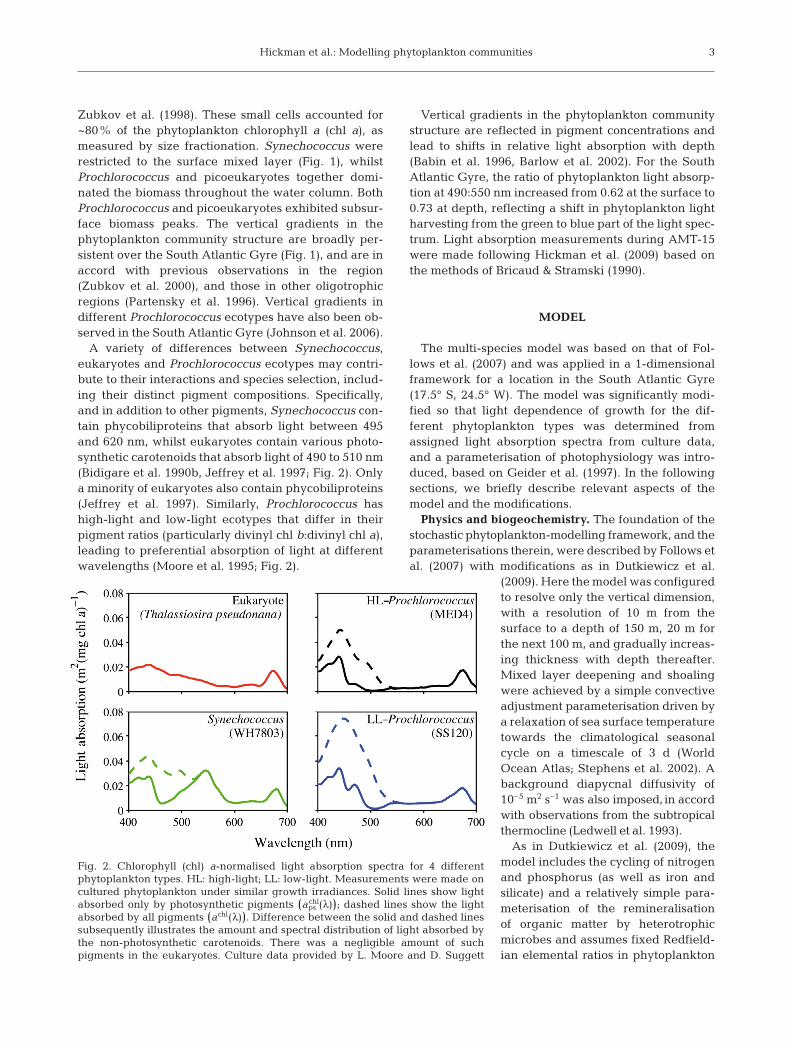
A variety of differences between Synechococcus,eukaryotes and Prochlorococcus ecotypes may contri-bute to their interactions and species selection, includ-ing their distinct pigment compositions. Specifically,and in addition to other pigments, Synechococcus con-tain phycobiliproteins that absorb light between 495and 620 nm, whilst eukaryotes contain various photo-synthetic carotenoids that absorb light of 490 to 510 nm(Bidigare et al. 1990b, Jeffrey et al. 1997; Fig. 2). Onlya minority of eukaryotes also contain phycobiliproteins(Jeffrey et al. 1997). Similarly, Prochlorococcus hashigh-light and low-light ecotypes that differ in theirpigment ratios (particularly divinyl chl b:divinyl chl a),leading to preferential absorption of light at differentwavelengths (Moore et al. 1995; Fig. 2).
Vertical gradients in the phytoplankton communitystructure are reflected in pigment concentrations andlead to shifts in relative light absorption with depth(Babin et al. 1996, Barlow et al. 2002). For the SouthAtlantic Gyre, the ratio of phytoplankton light absorp-tion at 490:550 nm increased from 0.62 at the surface to0.73 at depth, reflecting a shift in phytoplankton lightharvesting from the green to blue part of the light spec-trum. Light absorption measurements during AMT-15were made following Hickman et al. (2009) based onthe methods of Bricaud & Stramski (1990).
MODEL
The multi-species model was based on that of Fol-lows et al. (2007) and was applied in a 1-dimensionalframework for a location in the South Atlantic Gyre(17.5° S, 24.5° W). The model was significantly modi-fied so that light dependence of growth for the dif-ferent phytoplankton types was determined fromassigned light absorption spectra from culture data,and a parameterisation of photophysiology was intro-duced, based on Geider et al. (1997). In the followingsections, we briefly describe relevant aspects of themodel and the modifications.
Physics and biogeochemistry. The foundation of thestochastic phytoplankton-modelling framework, and theparameterisations therein, were described by Follows etal. (2007) with modifications as in Dutkiewicz et al.
(2009). Here the model was configuredto resolve only the vertical dimension,with a resolution of 10 m from thesurface to a depth of 150 m, 20 m forthe next 100 m, and gradually increas-ing thickness with depth thereafter.Mixed layer deepening and shoalingwere achieved by a simple convectiveadjustment parameterisation driven bya relaxation of sea surface temperaturetowards the climatological seasonalcycle on a timescale of 3 d (WorldOcean Atlas; Stephens et al. 2002). Abackground diapycnal diffusivity of10–5 m2 s–1 was also imposed, in accordwith observations from the subtropicalthermocline (Ledwell et al. 1993).
As in Dutkiewicz et al. (2009), themodel includes the cycling of nitrogenand phosphorus (as well as iron andsilicate) and a relatively simple para-meterisation of the remineralisationof organic matter by heterotrophicmicrobes and assumes fixed Redfield-ian elemental ratios in phytoplankton
3
Fig. 2. Chlorophyll (chl) a-normalised light absorption spectra for 4 differentphytoplankton types. HL: high-light; LL: low-light. Measurements were made oncultured phytoplankton under similar growth irradiances. Solid lines show lightabsorbed only by photosynthetic pigments (aps
chl(λ)); dashed lines show the lightabsorbed by all pigments (achl(λ)). Difference between the solid and dashed linessubsequently illustrates the amount and spectral distribution of light absorbed bythe non-photosynthetic carotenoids. There was a negligible amount of suchpigments in the eukaryotes. Culture data provided by L. Moore and D. Suggett
Mar Ecol Prog Ser 406: 1–17, 2010
(120:16:1 C:N:P). Given the focus of the current study,no large phytoplankton types were initialised, no typesrequired silicate, and iron concentrations were main-tained so that iron was never limiting.
A climatological annual cycle of 24 h mean irradi-ance for the South Atlantic Gyre location, obtained fromSea-viewing Wide Field-of-view Sensor (SeaWiFS)photosynthetically available radiation (PAR) data, wasimposed at the surface. Initial nutrient fields wereobtained from the World Ocean Atlas 2001 (Conkrightet al. 2002), and the delivery of nitrate and phosphatedue to lateral advection and isopycnal transfer, impor-tant in oligotrophic gyres (Williams & Follows 1998,Dutkiewicz et al. 2005), was parameterised by addi-tional sources throughout the upper 200 m. The im-posed convergence of lateral fluxes (0.00125 μM P yr–1
and 0.02 μM N yr–1) were consistent with those in-ferred from climatological data (Williams & Follows1998) and as diagnosed in a 3-dimensional model(Dutkiewicz et al. 2009).
Spectral irradiance. The ecosystem model here dif-fered from the previously published configurations(Follows et al. 2007, Dutkiewicz et al. 2009) in terms ofthe treatment of light and photophysiology. Here weresolved the wavelength composition by consideringirradiance at 13 wavelengths between 400 and 700 nm,more than the minimum of 6 recommended by Kettle &Merchant (2008). The (normalised) wavelength spec-trum of incident irradiance was obtained from opticsprofile data collected in the South Atlantic Gyre regionduring AMT-15 (via extrapolation of the light intensityat available wavelengths to the surface), and wasscaled by the incident PAR to spectrally resolve inci-dent irradiance. The seasonal change in the incidentlight spectrum was not considered, but is minimal com-pared to the variation with depth.
Penetration of irradiance, I (μmol photons m–2 s–1) foreach of the 13 wavelengths, λ (nm), was obtained ateach depth, zk (m),
(1)
where zk –1/2 and zk +1/2 refer to the depths of the topand bottom of the depth bin respectively, and subscriptk is a counter for the depth bin. The spectral lightattenuation, kd(λ,zk) (m–1), was calculated from theattenuation by water, kd,w(λ) (Pope & Fry 1997), col-ored dissolved organic matter (CDOM), kd,cdom(λ) (fromKitidis et al. 2006 using coefficients from the SouthAtlantic Gyre region) and phytoplankton,
(2)
where the attenuation by phytoplankton was summedover all phytoplankton types, j. a j
chl(λ) is the chl a-normalised light absorption (m2 mg–1 chl a) for each
phytoplankton type at each of the 13 wavelengths, andchlj(zk) is the chl a concentration (mg chl a m–3) foreach phytoplankton type for the depth bin zk. The irra-diance used for calculating phytoplankton growth wasthe mean irradiance within the depth bin:
(3)
Total PAR was obtained from the sum of irradiancebetween 400 and 700 nm, assuming a linear interpola-tion between the 13 wavelengths.
Phytoplankton light absorption. Phytoplankton lightabsorption spectra were obtained from cultures of 4species grown at similar growth irradiances, whichwere considered to be representatives of high-lightProchlorococcus (HLPro), low-light Prochlorococcus(LLPro), Synechococcus (Syn) and eukaryotes (Euk).The cultures were: Prochlorococcus MED4 and SS120grown at 70 μmol photons m–2 s–1 (Moore & Chisholm1999), Synechococcus WH7803 grown at 50 μmol pho-tons m–2 s–1 (Suggett et al. 2004) and Thalassiosirapseudonana grown at 25 μmol photons m–2 s–1 (Suggettet al. 2009), respectively.
The light absorption by all pigments provided by theculture measurements (aj
chl(λ)) was used in the calcu-lation of light attenuation, whereas estimation of phyto-plankton growth was based on light absorption onlyby photosynthetically active pigments (aps, j
chl (λ)), thusignoring absorption by non-photosynthetic carotenoids(Fig. 2). The light absorption spectrum for only thephotosynthetic pigments (aps, j
chl (λ)) was obtained by ad-justing the measured light absorption spectra (aj
chl(λ))by the ratio of light absorption by non-photosyntheticto total pigments at each wavelength (Babin et al.1996, Hickman et al. 2009). The wavelength-dependentratio was obtained from pigment-reconstructed spec-tra, following the traditional pigment-reconstructiontechnique (Bidigare et al. 1990b, Hickman et al. 2009).
The relative pigment concentrations for the recon-structions were calculated by scaling the weight-specificabsorption spectra for the main pigment groups (photo-synthetic carotenoids, non-photosynthetic carotenoids,chl a, b and c and phycoerythrobilin-rich phycobilinsrelevant for the representative Synechococcus; Bidigareet al. 1990b) expected for each phytoplankton type (ac-cording to Jeffrey et al. 1997) in order to yield the lowestsum of residuals between the pigment-reconstructedand measured light absorption spectra. For each of the4 phytoplankton types, the average residuals across allwavelengths was <0.0035 m2 mg–1 chl a. Weight-specificabsorption coefficients for the divinyl chlorophylls pre-sent in Prochlorococcus were assumed to be the sameas those of the monovinyl chlorophylls.
Phytoplankton growth. The growth rate, PjC(s–1), of
each phytoplankton type, j, was determined by thesteady state solution of the light-growth dependency of
I z I z I zk k k( , ) exp . ln ( , ) ln ( ,( / /λ λ λ= [ ] ++ −0 5 1 2 1 2)) )[ ]{ }
k z k k a zk j j kj
d d w d cdomchl chl( , ) ( ) ( ) [ ( ) ( )], ,λ λ λ λ= + + ∑∑
I z I z k z zk k k k( , ) ( , )exp[ ( , )(/ / /λ λ λ+ − += − −1 2 1 2 1 2d zzk / )]− 1 2
4
Hickman et al.: Modelling phytoplankton communities
Geider et al. (1997), which provided a variable chl aconcentration, and was thus a modification of Followset al. (2007). The light-growth dependency was basedon an exponential form of the carbon-specific photo-synthesis versus irradiance curve, modified to resolvethe visible spectrum,
(4)
where PjC is the carbon specific growth rate, and
PCm,j (s–1) is the maximum (light saturated) photosyn-
thetic rate, given by
(5)
where μj is the maximum possible growth rate (s–1),and γ j
N and γ jT, reflect the degree of limitation by nutri-
ents and temperature and have values between 0 and1 (described below). The linear slope of the photosyn-thesis versus irradiance curve depends on the chl a tocarbon ratio, θj (g:g), which varies with photoacclima-tion (Geider et al. 1997):
(6)
ΛIj in Eqs. (4) and (6) is the instantaneous photosyn-
thetic rate given the amount of light absorbed by thephytoplankton, which is determined from the spectralirradiance and spectral light absorption coefficient foreach phytoplankton type,
(7)
where φm is the maximum quantum yield of carbonfixation (mol carbon mol–1 photons), and θm is the max-imum possible value of the chl a to carbon ratio. Bothparameters were assumed to be the same for all phyto-plankton types (φm = 0.04 mol carbon mol–1 photonsand θm = 1/60 g:g, typical values observed for phyto-plankton; Kyewalyanga et al. 1998, Geider et al. 1997).Phytoplankton types were assumed to be fully accli-mated to in situ irradiance, as in the steady state solu-tion of Geider et al. (1997), which is reasonable giventhe daily mean irradiance used and the relatively sta-ble nature of the oligotrophic environment. In addition,for the Prochlorococcus-like phytoplankton types,divinyl-chl a was assumed to be equivalent to chl a forall calculations.
For phytoplankton types assigned to be susceptibleto photoinhibition, Pj
C was reduced depending on theratio of irradiance, I (the total between 400 and700 nm) to Ekj (μmol photons m–2 s–1) according to
(8)
Ekj is the light saturation parameter and represents theintercept of the maximum (P C
m,j) and the linear initialslope [θj φma chl
ps,j–––––––
(λ)] of the carbon-specific photosynthe-sis versus irradiance curve,
(9)
where a chlps,j
–––––––(λ) is the mean light absorption by photo-
synthetically active pigments across wavelengths of400 to 700 nm. Photoinhibition only acts when irradi-ance is greater than Ekj. The degree of photoinhibitionwas set by a factor κ, here equal to 1.2; for simplicity,there is no spectral dependence included for photoin-hibition.
The light-growth response for different phyto-plankton types was thus based on the assigned lightabsorption properties (a chl
ps,j), along with an associatedsusceptibility (or not) to photoinhibition.
The temperature-growth function was based on anEppley curve (Eppley 1972), with each phytoplanktontype assigned an envelope within which it grows effi-ciently (Follows et al. 2007):
(10)
The coefficients defining the temperature envelopewere the same for each phytoplankton type (A = 1.04,B = 0.001, C = 4, τ1 = 3 and τ2 = 0.3, all dimensionless,as in Dutkiewicz et al. 2009), except T0,j (°C), the opti-mum temperature for growth, hereafter referred to asTopt.
The nutrient-growth dependency γ Nj was deter-
mined by the most limiting nutrient (Follows et al.2007), with the individual nutrient limitations based ona Michaelis-Menten function, Ni/(Ni +Kij), and modi-fied for nitrogen to include inhibition of nitrate uptakeby ammonium (Dutkiewicz et al. 2009); subscript iindicates the nutrient (phosphate, nitrate), Ni is thenutrient concentration (μM) and Kij is the nutrient half-saturation constant (μM). Nutrient-growth dependen-cies differed between phytoplankton types accordingto the required sources of nitrogen and the half-saturation constant, Kij, hereafter referred to as Ksat,which were translated for N and P according to thefixed Redfield stoichiometry.
The model included 2 grazers (as in Dutkiewicz et al.2009), but since there were no imposed size differ-ences between phytoplankton types in the currentstudy, grazing did not influence the phytoplanktoncommunity structure.
Trait choices. Trait choices for the model phyto-plankton types were assigned based on a series of coinflips and random selection of parameter values (Fig. 3).Phytoplankton types were assigned to 1 of 3 nutrientresource groups: a requirement for NH4 only, NH4 and
γτ
τjT T T T j– ( ),= −( )−1
12
0A exp B C
EkP
aj
j
j j ( )
,
,
= mC
m pschlθ φ λ
P PEk
Ij j
j,
( )inhib
C C=
=
=
∑κ
λλ
λ
400
700
Λ jI
ja I( ) ( ),==
=
∑φ λ λλ
λ
m pschl
400
700
θ θθj
jI
jP ,
=+
m
m
mC
12
Λ
P j j j jmC N T
, = μ γ γ
P PPj j
jI
j
j
CmC
mC
= −−⎛
⎝⎜⎞⎠⎟
⎡⎣⎢
⎤⎦⎥
,,
exp1Λ θ
5
Mar Ecol Prog Ser 406: 1–17, 2010
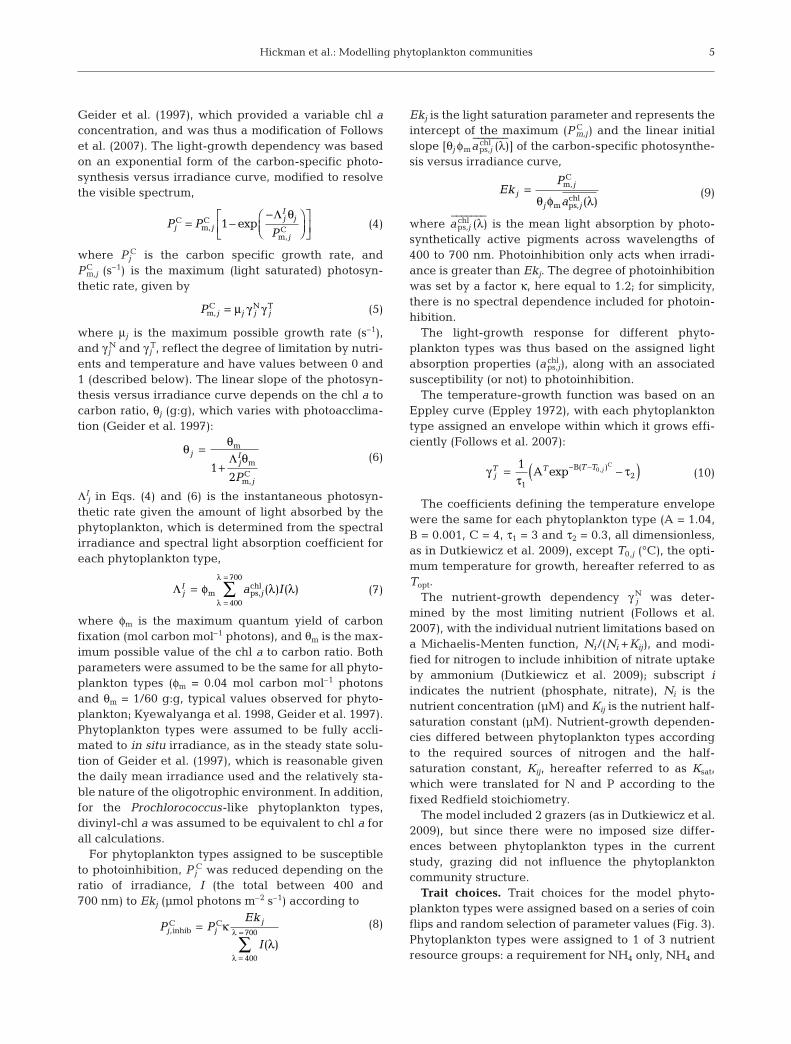
NO2 in combination, or NH4, NO2 and NO3 in com-bination, broadly reflecting possible combinations forphytoplankton (Moore et al. 2002). Within each nutri-ent resource group, phytoplankton types were as-signed chl a-specific light absorption spectra accordingto Figs. 2 & 3. Superimposed onto this framework wasa random selection for values for temperature opti-mum (Topt; Eq. 10) and half-saturation coefficient (Ksat)from plausible ranges (Fig. 3). The probability of traitchoices was chosen so that a roughly equal number ofphytoplankton types were assigned with each of the 4different sets of light absorption properties (Fig. 3).
The phytoplankton types that did not require nitratewere assumed to be representative of Prochlorococcusand, thus, the lower Ksat range was a reasonableassumption given their small size (Chisholm 1992).Photoinhibition was imposed on phytoplankton typesthat were assigned LLPro absorption characteristics assuggested by culture studies (Moore et al. 1998, Six etal. 2007).
Model application and assessment. The model wasinitialised with 1000 phytoplankton types, whichensured that the possible trait parameter space wassufficiently well sampled to eliminate any significantdependence of the solutions on the stochastic initialisa-tion. The model was integrated for 20 yr, after whichtime the annual cycles of nutrient fields and phyto-plankton community structure were repeatable andconsistent. All phytoplankton types were retained
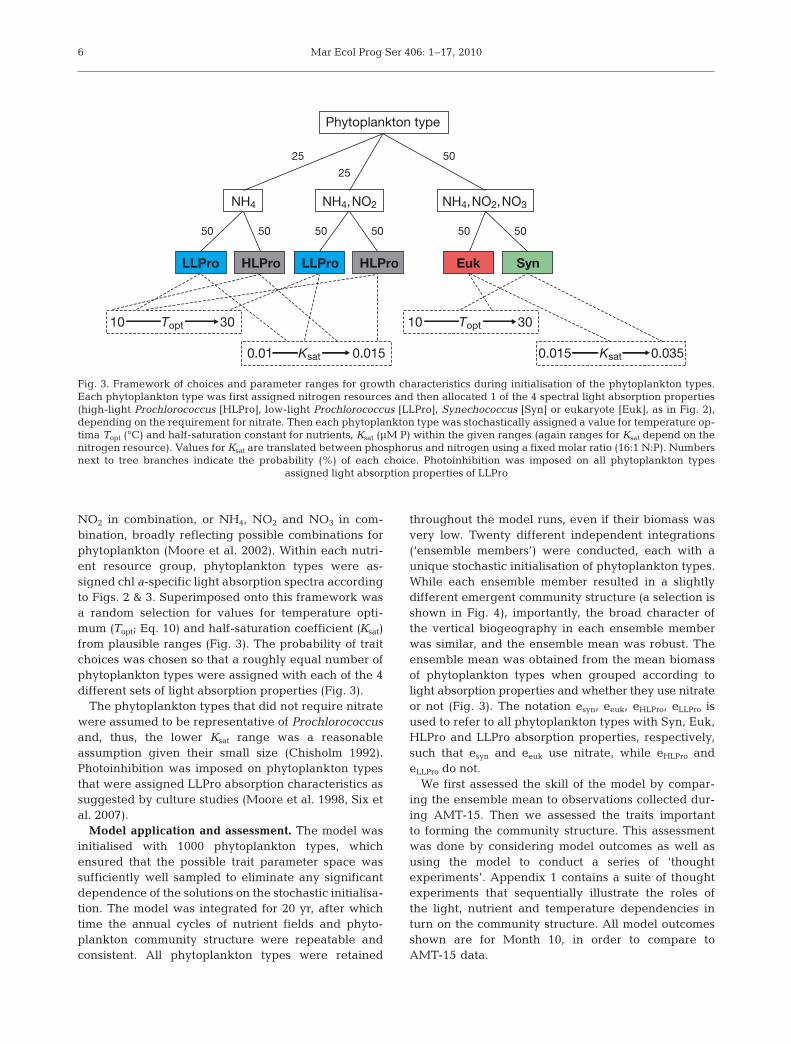
throughout the model runs, even if their biomass wasvery low. Twenty different independent integrations(‘ensemble members’) were conducted, each with aunique stochastic initialisation of phytoplankton types.While each ensemble member resulted in a slightlydifferent emergent community structure (a selection isshown in Fig. 4), importantly, the broad character ofthe vertical biogeography in each ensemble memberwas similar, and the ensemble mean was robust. Theensemble mean was obtained from the mean biomassof phytoplankton types when grouped according tolight absorption properties and whether they use nitrateor not (Fig. 3). The notation esyn, eeuk, eHLPro, eLLPro isused to refer to all phytoplankton types with Syn, Euk,HLPro and LLPro absorption properties, respectively,such that esyn and eeuk use nitrate, while eHLPro andeLLPro do not.
We first assessed the skill of the model by compar-ing the ensemble mean to observations collected dur-ing AMT-15. Then we assessed the traits importantto forming the community structure. This assessmentwas done by considering model outcomes as well asusing the model to conduct a series of ‘thoughtexperiments’. Appendix 1 contains a suite of thoughtexperiments that sequentially illustrate the roles ofthe light, nutrient and temperature dependencies inturn on the community structure. All model outcomesshown are for Month 10, in order to compare toAMT-15 data.
6
Phytoplankton type
25 50
505050505050
25
10 Topt 30
LLPro LLPro SynEukHLProHLPro
NH4 NH4,NO2 NH4,NO2,NO3
0.01 Ksat 0.015 0.015 Ksat 0.035
10 Topt 30
Fig. 3. Framework of choices and parameter ranges for growth characteristics during initialisation of the phytoplankton types.Each phytoplankton type was first assigned nitrogen resources and then allocated 1 of the 4 spectral light absorption properties(high-light Prochlorococcus [HLPro], low-light Prochlorococcus [LLPro], Synechococcus [Syn] or eukaryote [Euk], as in Fig. 2),depending on the requirement for nitrate. Then each phytoplankton type was stochastically assigned a value for temperature op-tima Topt (°C) and half-saturation constant for nutrients, Ksat (μM P) within the given ranges (again ranges for Ksat depend on thenitrogen resource). Values for Ksat are translated between phosphorus and nitrogen using a fixed molar ratio (16:1 N:P). Numbersnext to tree branches indicate the probability (%) of each choice. Photoinhibition was imposed on all phytoplankton types
assigned light absorption properties of LLPro
Hickman et al.: Modelling phytoplankton communities
RESULTS
Nitrate, biomass and chlorophyll
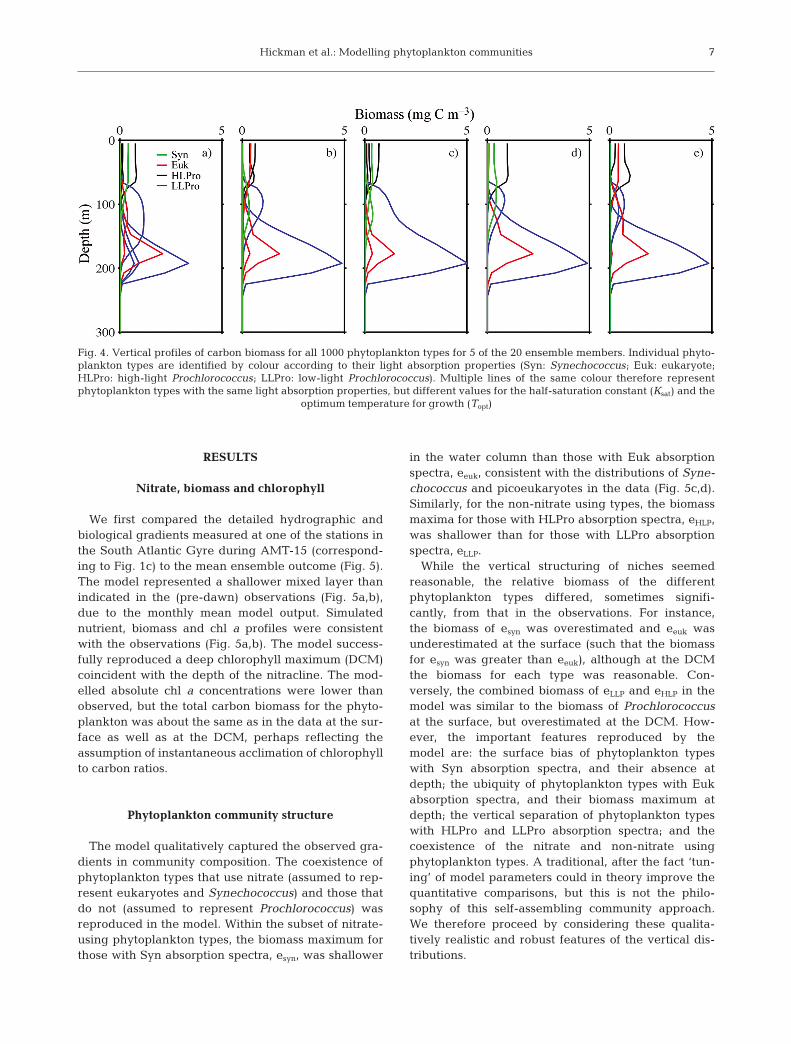
We first compared the detailed hydrographic andbiological gradients measured at one of the stations inthe South Atlantic Gyre during AMT-15 (correspond-ing to Fig. 1c) to the mean ensemble outcome (Fig. 5).The model represented a shallower mixed layer thanindicated in the (pre-dawn) observations (Fig. 5a,b),due to the monthly mean model output. Simulatednutrient, biomass and chl a profiles were consistentwith the observations (Fig. 5a,b). The model success-fully reproduced a deep chlorophyll maximum (DCM)coincident with the depth of the nitracline. The mod-elled absolute chl a concentrations were lower thanobserved, but the total carbon biomass for the phyto-plankton was about the same as in the data at the sur-face as well as at the DCM, perhaps reflecting theassumption of instantaneous acclimation of chlorophyllto carbon ratios.
Phytoplankton community structure
The model qualitatively captured the observed gra-dients in community composition. The coexistence ofphytoplankton types that use nitrate (assumed to rep-resent eukaryotes and Synechococcus) and those thatdo not (assumed to represent Prochlorococcus) wasreproduced in the model. Within the subset of nitrate-using phytoplankton types, the biomass maximum forthose with Syn absorption spectra, esyn, was shallower
in the water column than those with Euk absorptionspectra, eeuk, consistent with the distributions of Syne-chococcus and picoeukaryotes in the data (Fig. 5c,d).Similarly, for the non-nitrate using types, the biomassmaxima for those with HLPro absorption spectra, eHLP,was shallower than for those with LLPro absorptionspectra, eLLP.
While the vertical structuring of niches seemedreasonable, the relative biomass of the differentphytoplankton types differed, sometimes signifi-cantly, from that in the observations. For instance,the biomass of esyn was overestimated and eeuk wasunderestimated at the surface (such that the biomassfor esyn was greater than eeuk), although at the DCMthe biomass for each type was reasonable. Con-versely, the combined biomass of eLLP and eHLP in themodel was similar to the biomass of Prochlorococcusat the surface, but overestimated at the DCM. How-ever, the important features reproduced by themodel are: the surface bias of phytoplankton typeswith Syn absorption spectra, and their absence atdepth; the ubiquity of phytoplankton types with Eukabsorption spectra, and their biomass maximum atdepth; the vertical separation of phytoplankton typeswith HLPro and LLPro absorption spectra; and thecoexistence of the nitrate and non-nitrate usingphytoplankton types. A traditional, after the fact ‘tun-ing’ of model parameters could in theory improve thequantitative comparisons, but this is not the philo-sophy of this self-assembling community approach.We therefore proceed by considering these qualita-tively realistic and robust features of the vertical dis-tributions.
7
Fig. 4. Vertical profiles of carbon biomass for all 1000 phytoplankton types for 5 of the 20 ensemble members. Individual phyto-plankton types are identified by colour according to their light absorption properties (Syn: Synechococcus; Euk: eukaryote;HLPro: high-light Prochlorococcus; LLPro: low-light Prochlorococcus). Multiple lines of the same colour therefore representphytoplankton types with the same light absorption properties, but different values for the half-saturation constant (Ksat) and the
optimum temperature for growth (Topt)
Mar Ecol Prog Ser 406: 1–17, 2010
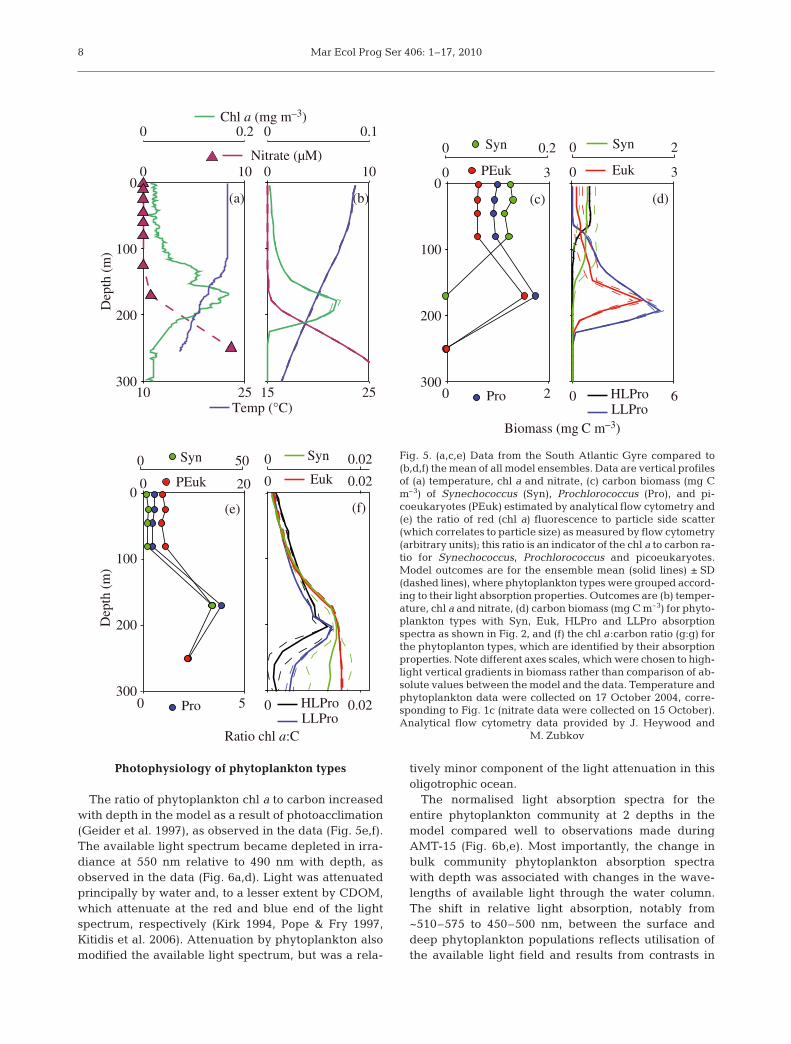
Photophysiology of phytoplankton types
The ratio of phytoplankton chl a to carbon increasedwith depth in the model as a result of photoacclimation(Geider et al. 1997), as observed in the data (Fig. 5e,f).The available light spectrum became depleted in irra-diance at 550 nm relative to 490 nm with depth, asobserved in the data (Fig. 6a,d). Light was attenuatedprincipally by water and, to a lesser extent by CDOM,which attenuate at the red and blue end of the lightspectrum, respectively (Kirk 1994, Pope & Fry 1997,Kitidis et al. 2006). Attenuation by phytoplankton alsomodified the available light spectrum, but was a rela-
tively minor component of the light attenuation in thisoligotrophic ocean.
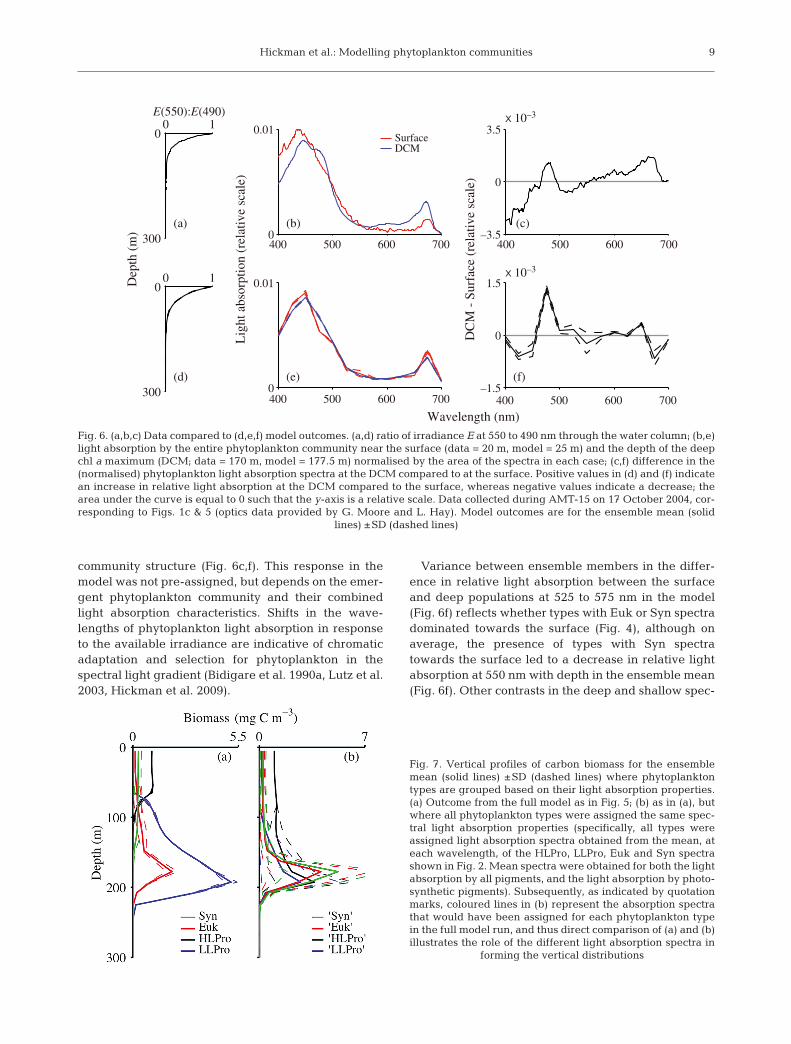
The normalised light absorption spectra for theentire phytoplankton community at 2 depths in themodel compared well to observations made duringAMT-15 (Fig. 6b,e). Most importantly, the change inbulk community phytoplankton absorption spectrawith depth was associated with changes in the wave-lengths of available light through the water column.The shift in relative light absorption, notably from~510–575 to 450–500 nm, between the surface anddeep phytoplankton populations reflects utilisation ofthe available light field and results from contrasts in
8
10 25300
200
100
0
Temp (°C)
0 10
0 0.2
(a)
0 2Pro
0 3PEuk
0 0.2Syn
(c)
0 5Pro
0 20PEuk
0 50Syn
(e)
15 25
0 10
0 0.1
(b)
0 6HLProLLPro
0 3Euk
0 2Syn
(d)
0 0.02HLProLLPro
0 0.02Euk
Nitrate (µM)
0 0.02Syn
(f)
300
200
100
0
Dep
th (
m)
Dep
th (
m)
300
200
100
0
Biomass (mg C m–3)
Ratio chl a:C
Chl a (mg m–3)
Fig. 5. (a,c,e) Data from the South Atlantic Gyre compared to(b,d,f) the mean of all model ensembles. Data are vertical profilesof (a) temperature, chl a and nitrate, (c) carbon biomass (mg Cm–3) of Synechococcus (Syn), Prochlorococcus (Pro), and pi-coeukaryotes (PEuk) estimated by analytical flow cytometry and(e) the ratio of red (chl a) fluorescence to particle side scatter(which correlates to particle size) as measured by flow cytometry(arbitrary units); this ratio is an indicator of the chl a to carbon ra-tio for Synechococcus, Prochlorococcus and picoeukaryotes.Model outcomes are for the ensemble mean (solid lines) ± SD(dashed lines), where phytoplankton types were grouped accord-ing to their light absorption properties. Outcomes are (b) temper-ature, chl a and nitrate, (d) carbon biomass (mg C m–3) for phyto-plankton types with Syn, Euk, HLPro and LLPro absorptionspectra as shown in Fig. 2, and (f) the chl a:carbon ratio (g:g) forthe phytoplanton types, which are identified by their absorptionproperties. Note different axes scales, which were chosen to high-light vertical gradients in biomass rather than comparison of ab-solute values between the model and the data. Temperature andphytoplankton data were collected on 17 October 2004, corre-sponding to Fig. 1c (nitrate data were collected on 15 October).Analytical flow cytometry data provided by J. Heywood and
M. Zubkov
Hickman et al.: Modelling phytoplankton communities
community structure (Fig. 6c,f). This response in themodel was not pre-assigned, but depends on the emer-gent phytoplankton community and their combinedlight absorption characteristics. Shifts in the wave-lengths of phytoplankton light absorption in responseto the available irradiance are indicative of chromaticadaptation and selection for phytoplankton in thespectral light gradient (Bidigare et al. 1990a, Lutz et al.2003, Hickman et al. 2009).
Variance between ensemble members in the differ-ence in relative light absorption between the surfaceand deep populations at 525 to 575 nm in the model(Fig. 6f) reflects whether types with Euk or Syn spectradominated towards the surface (Fig. 4), although onaverage, the presence of types with Syn spectratowards the surface led to a decrease in relative lightabsorption at 550 nm with depth in the ensemble mean(Fig. 6f). Other contrasts in the deep and shallow spec-
9
400 500 600 700
400 500 600 700 400 500 600 700
0
0.01
Wavelength (nm)
Lig
ht
abso
rpti
on (
rela
tive
scal
e)
(e)
0 1
300
0
(d)
0
0.01SurfaceDCM
(b)
0 1
300
0
E(550):E(490)
Dep
th (
m)
(a)
DC
M -
Surf
ace
(rel
ativ
e sc
ale)
400 500 600 700–1.5
0
1.5x 10–3
x 10–3
(f)
–3.5
0
3.5
(c)
Fig. 6. (a,b,c) Data compared to (d,e,f) model outcomes. (a,d) ratio of irradiance E at 550 to 490 nm through the water column; (b,e)light absorption by the entire phytoplankton community near the surface (data = 20 m, model = 25 m) and the depth of the deepchl a maximum (DCM; data = 170 m, model = 177.5 m) normalised by the area of the spectra in each case; (c,f) difference in the(normalised) phytoplankton light absorption spectra at the DCM compared to at the surface. Positive values in (d) and (f) indicatean increase in relative light absorption at the DCM compared to the surface, whereas negative values indicate a decrease; thearea under the curve is equal to 0 such that the y-axis is a relative scale. Data collected during AMT-15 on 17 October 2004, cor-responding to Figs. 1c & 5 (optics data provided by G. Moore and L. Hay). Model outcomes are for the ensemble mean (solid
lines) ±SD (dashed lines)
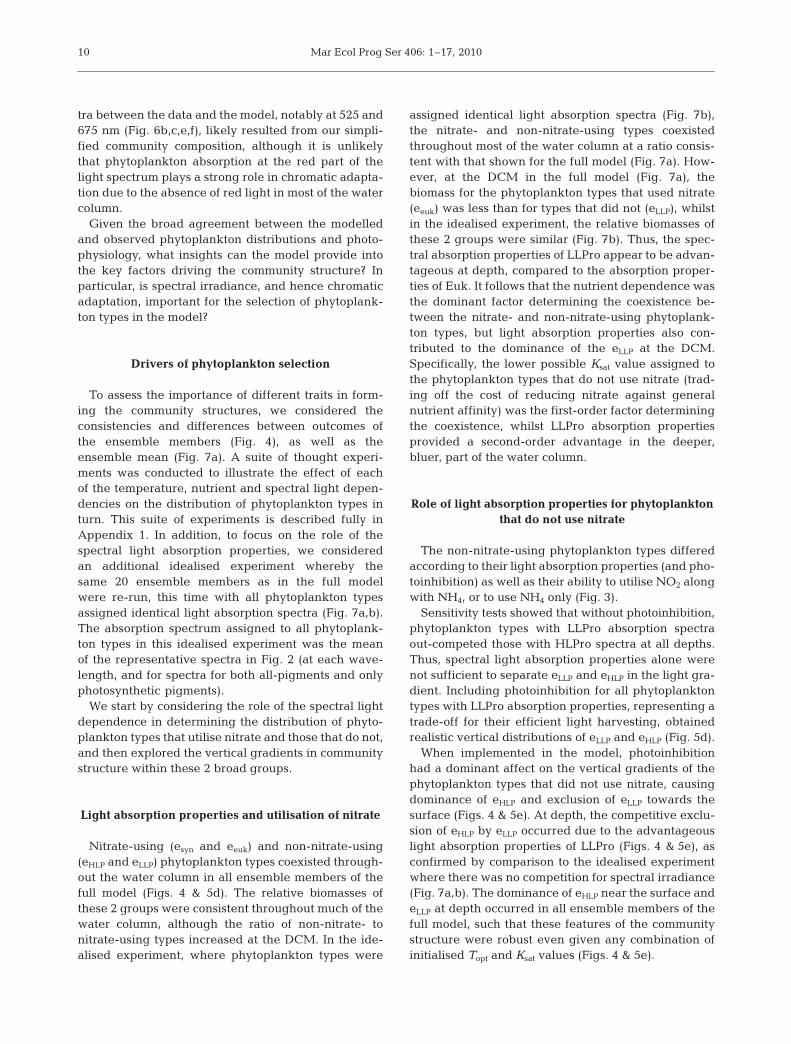
Fig. 7. Vertical profiles of carbon biomass for the ensemblemean (solid lines) ±SD (dashed lines) where phytoplanktontypes are grouped based on their light absorption properties.(a) Outcome from the full model as in Fig. 5; (b) as in (a), butwhere all phytoplankton types were assigned the same spec-tral light absorption properties (specifically, all types wereassigned light absorption spectra obtained from the mean, ateach wavelength, of the HLPro, LLPro, Euk and Syn spectrashown in Fig. 2. Mean spectra were obtained for both the lightabsorption by all pigments, and the light absorption by photo-synthetic pigments). Subsequently, as indicated by quotationmarks, coloured lines in (b) represent the absorption spectrathat would have been assigned for each phytoplankton typein the full model run, and thus direct comparison of (a) and (b)illustrates the role of the different light absorption spectra in
forming the vertical distributions
Mar Ecol Prog Ser 406: 1–17, 2010
tra between the data and the model, notably at 525 and675 nm (Fig. 6b,c,e,f), likely resulted from our simpli-fied community composition, although it is unlikelythat phytoplankton absorption at the red part of thelight spectrum plays a strong role in chromatic adapta-tion due to the absence of red light in most of the watercolumn.
Given the broad agreement between the modelledand observed phytoplankton distributions and photo-physiology, what insights can the model provide intothe key factors driving the community structure? Inparticular, is spectral irradiance, and hence chromaticadaptation, important for the selection of phytoplank-ton types in the model?
Drivers of phytoplankton selection
To assess the importance of different traits in form-ing the community structures, we considered theconsistencies and differences between outcomes ofthe ensemble members (Fig. 4), as well as theensemble mean (Fig. 7a). A suite of thought experi-ments was conducted to illustrate the effect of eachof the temperature, nutrient and spectral light depen-dencies on the distribution of phytoplankton types inturn. This suite of experiments is described fully inAppendix 1. In addition, to focus on the role of thespectral light absorption properties, we consideredan additional idealised experiment whereby thesame 20 ensemble members as in the full modelwere re-run, this time with all phytoplankton typesassigned identical light absorption spectra (Fig. 7a,b).The absorption spectrum assigned to all phytoplank-ton types in this idealised experiment was the meanof the representative spectra in Fig. 2 (at each wave-length, and for spectra for both all-pigments and onlyphotosynthetic pigments).
We start by considering the role of the spectral lightdependence in determining the distribution of phyto-plankton types that utilise nitrate and those that do not,and then explored the vertical gradients in communitystructure within these 2 broad groups.
Light absorption properties and utilisation of nitrate
Nitrate-using (esyn and eeuk) and non-nitrate-using(eHLP and eLLP) phytoplankton types coexisted through-out the water column in all ensemble members of thefull model (Figs. 4 & 5d). The relative biomasses ofthese 2 groups were consistent throughout much of thewater column, although the ratio of non-nitrate- tonitrate-using types increased at the DCM. In the ide-alised experiment, where phytoplankton types were
assigned identical light absorption spectra (Fig. 7b),the nitrate- and non-nitrate-using types coexistedthroughout most of the water column at a ratio consis-tent with that shown for the full model (Fig. 7a). How-ever, at the DCM in the full model (Fig. 7a), thebiomass for the phytoplankton types that used nitrate(eeuk) was less than for types that did not (eLLP), whilstin the idealised experiment, the relative biomasses ofthese 2 groups were similar (Fig. 7b). Thus, the spec-tral absorption properties of LLPro appear to be advan-tageous at depth, compared to the absorption proper-ties of Euk. It follows that the nutrient dependence wasthe dominant factor determining the coexistence be-tween the nitrate- and non-nitrate-using phytoplank-ton types, but light absorption properties also con-tributed to the dominance of the eLLP at the DCM.Specifically, the lower possible Ksat value assigned tothe phytoplankton types that do not use nitrate (trad-ing off the cost of reducing nitrate against generalnutrient affinity) was the first-order factor determiningthe coexistence, whilst LLPro absorption propertiesprovided a second-order advantage in the deeper,bluer, part of the water column.
Role of light absorption properties for phytoplanktonthat do not use nitrate
The non-nitrate-using phytoplankton types differedaccording to their light absorption properties (and pho-toinhibition) as well as their ability to utilise NO2 alongwith NH4, or to use NH4 only (Fig. 3).
Sensitivity tests showed that without photoinhibition,phytoplankton types with LLPro absorption spectraout-competed those with HLPro spectra at all depths.Thus, spectral light absorption properties alone werenot sufficient to separate eLLP and eHLP in the light gra-dient. Including photoinhibition for all phytoplanktontypes with LLPro absorption properties, representing atrade-off for their efficient light harvesting, obtainedrealistic vertical distributions of eLLP and eHLP (Fig. 5d).
When implemented in the model, photoinhibitionhad a dominant affect on the vertical gradients of thephytoplankton types that did not use nitrate, causingdominance of eHLP and exclusion of eLLP towards thesurface (Figs. 4 & 5e). At depth, the competitive exclu-sion of eHLP by eLLP occurred due to the advantageouslight absorption properties of LLPro (Figs. 4 & 5e), asconfirmed by comparison to the idealised experimentwhere there was no competition for spectral irradiance(Fig. 7a,b). The dominance of eHLP near the surface andeLLP at depth occurred in all ensemble members of thefull model, such that these features of the communitystructure were robust even given any combination ofinitialised Topt and Ksat values (Figs. 4 & 5e).
10
Hickman et al.: Modelling phytoplankton communities
Laboratory and field observations suggest thatphotoinhibition is important for the general absenceof some low-light Prochlorococcus ecotypes in surfacewaters (Moore & Chisholm 1999, Zinser et al. 2007),although there are likely to be other or additionaltrade-offs important to the niche separation of theseorganisms (Zinser et al. 2007). Culture studies haveshown that a low-light Prochlorococcus ecotype (SS120)is more susceptible to photoinhibition than a high-lightstrain due to a relatively slow repair rate of photo-damaged photosystem-II’s (Six et al. 2007). All Pro-chlorococcus ecotypes may be more susceptible tophotoinhibition than other phytoplankton due to thepresence of divinyl chlorophylls, which are consideredto be more expensive to repair than the monovinylchlorophyll forms (Tomo et al. 2009). The low-lightProchlorococcus, with a high divinyl chl b: divinyl chl aratio, are adapted to highly efficient utilisation of bluelight at depth, while the relatively less efficient lightabsorption properties of high-light Prochlorococcus,with a low divinyl chl b :divinyl chl a ratio, presumablyreflects a balance between light absorption for photo-synthesis and minimising the risk of photodamage.
In the model, the utilisation of different nitrogensources was also important for the vertical distributionsof phytoplankton types that did not use nitrate, repre-senting Prochlorococcus. At the DCM, and thus at thenutricline, eLLP that used NO2 as well as NH4 had acompetitive advantage compared to those that onlyused NH4. In contrast, near the surface where NO2
concentrations were low, eHLP that utilised NO2 as wellas NH4 did not have a significant advantage. This pref-erence for reduced nitrogen source is consistent withculture studies showing that low-light Prochlorococcusecotypes assimilate NO2 as well as NH4, whilst cul-tured high-light ecotypes have lost the ability to useNO2 (Moore et al. 2002, Rocap et al. 2003). The modeltherefore supports the view that this trait is also impor-tant for niche partitioning of different Prochlorococcusecotypes on vertical nutrient gradients (Moore et al.2002, Bragg et al. 2010).
Role of light absorption properties for phytoplanktonthat use nitrate
The group of phytoplankton types that use nitrateconsisted of phytoplankton with Syn and Euk spectralabsorption properties.
In the idealised experiment without competition forspectral irradiance (Fig. 7b), the biomass of the phyto-plankton types that had, in the full model, beenassigned Syn and Euk absorption properties (the redand green lines in Fig. 7b) followed the same verticalgradient; their slight difference in absolute biomass
was due to the stochastic assignment of Topt and Ksat
for the phytoplankton types within each group, andthis difference was not significant. It was therefore thelight absorption properties that had resulted in the ver-tical gradients of these phytoplankton types in the fullmodel (Figs. 5d & 7a). The phytoplankton types withSyn absorption spectra (esyn) were not successful at thedepth of the DCM in any ensemble member due totheir competitive exclusion by those with Euk absorp-tion spectra (eeuk; Fig. 4), something that could not beovercome by any co-assigned combination of Topt andKsat values within the given ranges (Figs. 4 & 5e).
Towards the surface, however, the competition be-tween esyn and eeuk was more complicated. Whether aphytoplankton type with Syn or Euk absorption prop-erties dominated near the surface varied betweenensemble members (Fig. 4), and thus depended on thevalues of Topt and Ksat for the corresponding phyto-plankton types. Overall, however, types with Syn ab-sorption properties had a competitive advantage overthose with Euk spectra as evidenced by their higherbiomass in the ensemble mean (Fig. 5). At 25 m in theensemble mean, the biomass of esyn was significantlygreater than the biomass of eeuk at the 95% confidencelevel (according to a t-test).
In an additional idealised experiment where all oftheir other traits were equal, phytoplankton types withabsorption spectra of Syn and Euk coexisted towardsthe surface (see Appendix 1: Test 1, Fig. A1b for thefull description of this experiment). This coexistenceoccurs due to their utilisation of different componentsof the light spectrum (Stomp et al. 2004, 2007), result-ing in similar light-dependent growth rates. In the fullmodel, the spectral absorption properties of thesephytoplankton types thus play a less dominant role,allowing other traits to ‘tip-the-balance’ and be moresignificant in forming the resulting distributions.
The light absorption properties affect the growthrate according to Eq. (7). The value of the summedcomponent, and therefore ΛI
j, increases when the lightabsorption spectrum is similar to the wavelength com-position of available light (Sathyendranath & Platt2007). For the light field of the ensemble mean state,the value of ΛI
j was 20% higher for phytoplanktontypes with Syn compared to Euk absorption spectra at25 m, but the growth rate (s–1) was only 1% greater(given the nutrient fields from the ensemble mean andassuming that all other characteristics were equal:Topt = 22°C and Ksat = 0.01). This small difference ingrowth rate is partly due to compensation by photo-acclimation, which results in a different chl a to carbonratio between the phytoplankton types (0.025 and0.030 g:g for the type with Syn and Euk absorptionspectra, respectively). In contrast, the value of ΛI
j andthe growth rate were both 5% higher for the phyto-
11
Mar Ecol Prog Ser 406: 1–17, 2010
plankton types with Euk compared to Syn absorptionspectra at 170 m, where the ratio of chl a to carbon wasnear maximal. Thus, the light absorption propertieshad a greater influence on growth rate at depth, andled to competitive exclusion of esyn by eeuk in the fullmodel, even for any combination of Topt and Ksat valueswithin the prescribed ranges (Figs. 3 & 4). The im-portance of the light absorption properties at depthreflects the fact that ΛI
j determines the light-limitedslope of the photosynthesis versus irradiance curveand hence light-limited growth rate (Eqs. 4 and 6). Theabsence of phytoplankton types with Syn absorptionspectra at depth in the model is consistent with Syne-chococcus being light-limited due to their spectrallight requirements (Wood 1985). Our model indicatedthat phytoplankton types with Syn absorption proper-
ties could survive at depth, were it not for their com-petitive exclusion by eeuk.
The slight advantage of phytoplankton types withSyn compared to Euk absorption properties towardsthe surface implies some light limitation of growth. Theprecise ratio of the biomass of these types (such as inAppendix 1: Test 1, Fig. A1b) is likely to result from asubtle interplay between light absorption and mixing(Stomp et al. 2007).
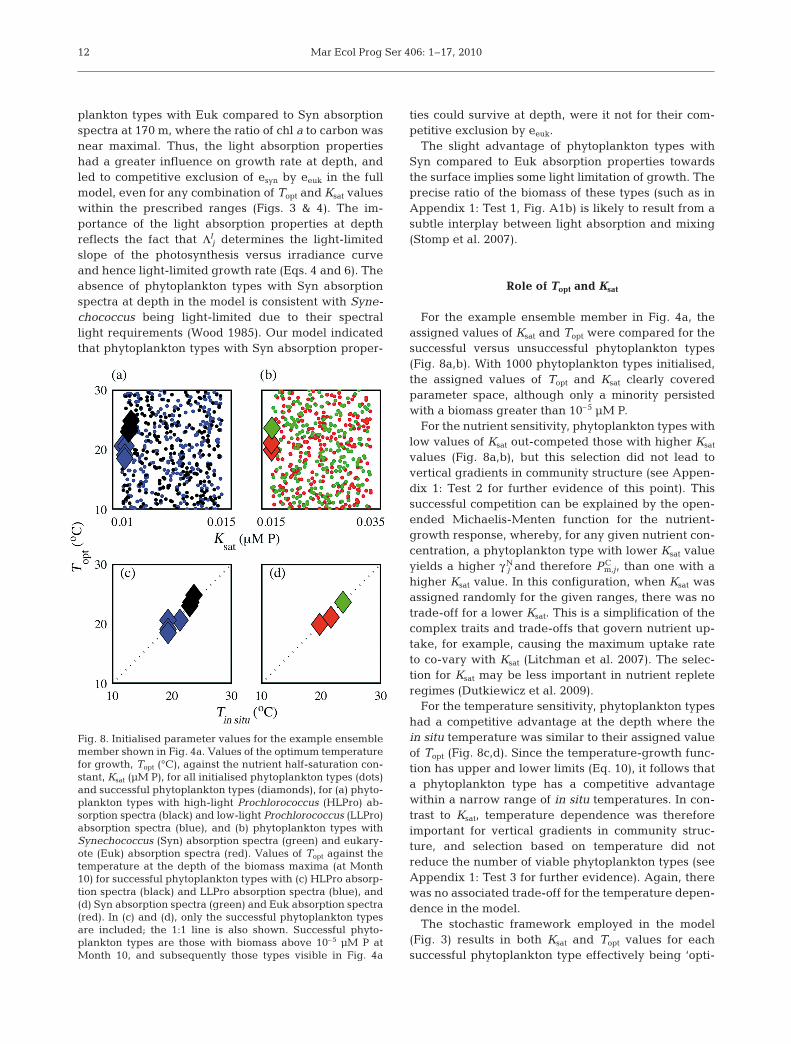
Role of Topt and Ksat
For the example ensemble member in Fig. 4a, theassigned values of Ksat and Topt were compared for thesuccessful versus unsuccessful phytoplankton types(Fig. 8a,b). With 1000 phytoplankton types initialised,the assigned values of Topt and Ksat clearly coveredparameter space, although only a minority persistedwith a biomass greater than 10–5 μM P.
For the nutrient sensitivity, phytoplankton types withlow values of Ksat out-competed those with higher Ksat
values (Fig. 8a,b), but this selection did not lead tovertical gradients in community structure (see Appen-dix 1: Test 2 for further evidence of this point). Thissuccessful competition can be explained by the open-ended Michaelis-Menten function for the nutrient-growth response, whereby, for any given nutrient con-centration, a phytoplankton type with lower Ksat valueyields a higher γ N
j and therefore PCm,j, than one with a
higher Ksat value. In this configuration, when Ksat wasassigned randomly for the given ranges, there was notrade-off for a lower Ksat. This is a simplification of thecomplex traits and trade-offs that govern nutrient up-take, for example, causing the maximum uptake rateto co-vary with Ksat (Litchman et al. 2007). The selec-tion for Ksat may be less important in nutrient repleteregimes (Dutkiewicz et al. 2009).
For the temperature sensitivity, phytoplankton typeshad a competitive advantage at the depth where thein situ temperature was similar to their assigned valueof Topt (Fig. 8c,d). Since the temperature-growth func-tion has upper and lower limits (Eq. 10), it follows thata phytoplankton type has a competitive advantagewithin a narrow range of in situ temperatures. In con-trast to Ksat, temperature dependence was thereforeimportant for vertical gradients in community struc-ture, and selection based on temperature did notreduce the number of viable phytoplankton types (seeAppendix 1: Test 3 for further evidence). Again, therewas no associated trade-off for the temperature depen-dence in the model.
The stochastic framework employed in the model(Fig. 3) results in both Ksat and Topt values for eachsuccessful phytoplankton type effectively being ‘opti-
12
Fig. 8. Initialised parameter values for the example ensemblemember shown in Fig. 4a. Values of the optimum temperaturefor growth, Topt (°C), against the nutrient half-saturation con-stant, Ksat (μM P), for all initialised phytoplankton types (dots)and successful phytoplankton types (diamonds), for (a) phyto-plankton types with high-light Prochlorococcus (HLPro) ab-sorption spectra (black) and low-light Prochlorococcus (LLPro)absorption spectra (blue), and (b) phytoplankton types withSynechococcus (Syn) absorption spectra (green) and eukary-ote (Euk) absorption spectra (red). Values of Topt against thetemperature at the depth of the biomass maxima (at Month10) for successful phytoplankton types with (c) HLPro absorp-tion spectra (black) and LLPro absorption spectra (blue), and(d) Syn absorption spectra (green) and Euk absorption spectra(red). In (c) and (d), only the successful phytoplankton typesare included; the 1:1 line is also shown. Successful phyto-plankton types are those with biomass above 10–5 μM P atMonth 10, and subsequently those types visible in Fig. 4a
Hickman et al.: Modelling phytoplankton communities
mised’ for the environmental conditions. The optimi-sation of traits is in accord with the concept of evo-lutionary selection that leads to phytoplankton havingmultiple characteristics that suit them to a givenenvironment. For example, high-light and low-lightProchlorococcus ecotypes have corresponding highand low Topt, respectively (Zinser et al. 2007). The co-optimal adaptation of multiple traits between Pro-chlorococcus ecotypes also extends to their differentialnitrogen sources (Moore et al. 2002) and underpinstheir biogeography (Johnson et al. 2006, Zinser et al.2007). However, the combination of temperature andlight dependence clearly involves a complicated inter-play between traits and trade-offs (Zinser et al. 2007).
The simplified mixing regime in the model mayhave led to an overemphasised temperature gradient(Fig. 5a,b), and subsequently temperature-drivengradients in community structure above the DCM(Appendix 1: Fig. A1d). However, the selection fortemperature occurs within, rather than between, spec-tral classes such that it does not influence our assess-ment of the importance of chromatic adaptation.
DISCUSSION
A stochastic, ‘self-organising’ model of marinephytoplankton was employed to investigate the roleof chromatic adaptation in determining the verticalorganisation of the phytoplankton communities in theoligotrophic oceans. We have implemented parameter-isations of photoacclimation along with wavelength-dependent light absorption and radiative transfer inthe model. One thousand phytoplankton types wereeach initialised with a unique set of physiological char-acteristics, including spectral light absorption prop-erties, and the phytoplankton community was allowedto self-assemble through in silico ‘survival of the fittest’.
The model was applied for a vertical profile in theSouth Atlantic Gyre, representative of the oligotrophicenvironment covering much of the ocean’s mid-latitudes. The emergent profiles of phytoplankton bio-mass, chl a and vertical gradients in community struc-ture of the phytoplankton were qualitatively consistentwith observations from the Atlantic Meridional Tran-sect, albeit with some contrasts in absolute values. Fol-lowing a number of model thought experiments, theskill of the model in reproducing the community struc-ture was strongly dependent on chromatic adaptation;the model’s self-assembled phytoplankton communityreflects a selective pressure from the photophysiologyand pigments. Our demonstration of the importance ofchromatic adaptation in an oceanic simulation is con-sistent with observational (e.g. Bidigare et al. 1990a,Ting et al. 2002, Lutz et al. 2003) and idealised model
studies (Stomp et al. 2004, Sathyendranath & Platt 2007).In the model, organisation of the phytoplankton
community was strongly affected by the inorganicnitrogen source, which segregated the water columninto 2 broad groups: phytoplankton types that usednitrate (Synechococcus and eukaryotes) and those thatdid not (Prochlorococcus, or a subset thereof). Thecompetition for spectral irradiance had a secondaryinfluence on the coexistence between these 2 groups,most notably that phytoplankton types with absorptionproperties of the low-light Prochlorococcus had anadvantage over those with absorption properties of thepicoeukaryote at the DCM. Whether Prochlorococcusor eukaryotes dominate at the base of the euphoticzone thus depends on the co-availability of light andnutrients. Within the 2 broad groups controlled by theinorganic nitrogen source, pigments and photophysio-logy played a dominant role in structuring the com-munity. Their spectral light requirements restrictedSynechococcus to a surface water habitat due to com-petitive exclusion by eukaryotes at depth. In the sur-face, however, these 2 phytoplankters could coexistdepending on their other traits. The spectral lightrequirements of the high- and low-light Prochlorococ-cus types did not lead to a vertical separation. Instead,realistic habitat organisation was only achieved whenphotoinhibition was imposed as a trade-off to thehighly efficient light absorption of the low-light types.This role of photoinhibition for the absence of low-lightProchlorococcus ecotypes near the surface is consis-tent with culture and field studies (Moore & Chisholm1999, Six et al. 2007, Zinser et al. 2007).
Multiple traits, here specifically the growth rate de-pendencies on light, nutrients and temperature, wereco-optimal for the depths where phytoplankton typesoccurred in the water column. Thus, while opticalproperties play a role in the structuring of habitat, theyrepresent just one of several factors that have co-evolved to be optimal in a particular environment andtogether shape the niches of different phytoplankton.
The model study made a number of simplifying as-sumptions in order to focus on the role of chromaticadaptation. Prochlorococcus ecotypes that could utilisenitrate (Casey et al. 2007), other size classes, or addi-tional traits such as grazing defence, mixotrophy ormobility that potentially influence niche partitioningin the real ocean, were not explicitly included in themodel. There were also simplifying assumptions aboutthe chemical environment (such as a fixed uptake ratiofor nutrients and no iron dependence) and the para-meterisations for growth dependencies (such as theEppley curve for temperature and Michaelis-Mentenform for nutrient-dependent growth; Follows et al.2007, Dutkiewicz et al. 2009). Although these simplifi-cations may have influenced the resulting absolute
13
Mar Ecol Prog Ser 406: 1–17, 2010
biomass values, they would not qualitatively alter theeffect of spectral irradiance on species selection.
For this initial study, 4 phytoplankton types werechosen that had distinctly different light absorptionspectra. The effects of photoacclimation and pigmentpackaging on the absorption spectra were not de-scribed, but were implicit in the culture measurements(Fig. 2). We subsequently assume that the 4 chosentypes have absorption properties similar to the specieswithin the groups they represent (i.e. Synechococcus,high-light and low-light Prochlorococcus and eukary-otes), and that spectral effects of acclimation arenegligible compared to the difference in absorptionproperties between the groups. This assumption isreasonable, noting particularly that the picoeukaryotepopulation in the oligotrophic regions also consists offlagellates that are of similar size and contain pigmentsthat absorb light at similar wavelengths to our repre-sentative eukaryote, and that Synechococcus ecotypeswith larger amounts of other phycobilins than arecontained in our phycoerythrobilin-rich representativealso occur in the oligotrophic ocean (Scanlan et al.2009). While our simplified choices for the representa-tive absorption spectra could have contributed to themismatch in absolute biomass of the different types(Fig. 5c,d), as well as the community light absorptionproperties (Fig. 6b,c,e,f), between the model and thedata, the model successfully reproduced the observedvertical gradients in community structure and revealeda clear role of chromatic adaptation that is consistentwith observations. The importance of other phycobilins(phycourobilin and phycocyanobilin) within Synecho-coccus, or the range of pigment types within differenteukaryotes could be explored in future studies.
Our results reveal co-optimality of multiple traits fora given niche, consistent with the evolutionary view. Akey next step is exploring the interdependencies oftraits and their physiological trade-offs (e.g. Litch-man et al. 2007). For example, there is an interestingtrade-off between light and nitrogen requirement inSynechococcus. Phycobilisomes are particularly rich innitrogen (Raven 1984), creating a high nitrogen de-mand for the cells and, presumably, a preference for anitrogen (and therefore nitrate)-rich environment. Atthe same time, the spectral dependence of absorptionby these phycobilisomes favours a surface water habi-tat. The tension between these selective pressures maybe important for the distribution of Synechococcus inthe very oligotrophic central gyres, where they occurin near surface waters but do not dominate the phyto-plankton biomass (Zubkov et al. 1998, 2000, Heywoodet al. 2006). A complex ecosystem model, such as thatused here, could provide a useful framework for futuretargeted studies into the interdependences of traitsand trade-offs, and their role for community ecology.
In summary, we have demonstrated the importanceof chromatic adaptation for shaping phytoplanktoncommunities in the South Atlantic Gyre. The phyto-plankton growth dependencies on light, nutrients andtemperature were co-optimal, supporting the view thatmultiple traits have co-evolved to define an organism’sniche. Although we have focussed on an oligotrophicenvironment, the processes and interactions exploredhere underpin phytoplankton selection and thus havea wider relevance to the global ocean.
Acknowledgements. We thank D. Suggett and L. Moore forproviding culture data; J. Heywood and M. Zubkov for ana-lytical flow cytometry measurements; L. Hay and G. Moorefor spectral optical profiler data; the wider Atlantic Merid-ional Transect (AMT) community for providing ancillary data;and the officers and crew of RRS ‘Discovery’ during AMT-15.We also thank W. Gregg for valuable discussion on the opticalframework and 5 anonymous referees for their insightfulcomments. This work was jointly funded through the UKNatural Environment Research Council (NERC) (grant NE/F002408/1), NASA (grant NNX09AE44G) and the Gordonand Betty Moore Foundation. The study was also supportedby NERC through the AMT consortium (NER/O/S/2001/00680) and is contribution number 186 of the AMT pro-gramme. Participation of A.E.H. in AMT-15 was funded by aNERC PhD studentship.
LITERATURE CITED
Babin M, Morel A, Claustre H, Bricaud A, Kolber Z, Fal-kowski PG (1996) Nitrogen- and irradiance-dependentvariations of the maximum quantum yield of carbon fixa-tion in eutrophic, mesotrophic and oligotrophic marinesystems. Deep-Sea Res I 43:1241–1272
Barlow RG, Aiken J, Holligan PM, Cummings DG, Mari-torena S, Hooker S (2002) Phytoplankton pigment andabsorption characteristics along meridional transects inthe Atlantic Ocean. Deep-Sea Res II 47:637–660
Bidigare RR, Marra J, Dickey TD, Iturriaga R, Baker KS,Smith RC, Pak H (1990a) Evidence for phytoplanktonsuccession and chromatic adaptation in the Sargasso Seaduring spring 1985. Mar Ecol Prog Ser 60:113–122
Bidigare RR, Ondrusek ME, Morrow JH, Kiefer DA (1990b)In-vivo absorption properties of algal pigments. Proc SPIE1302:290
Bragg JG, Dutkiewicz S, Jahn O, Follows MJ, Chisholm SW(2010) Modeling selective pressures on picocyanobac-terial nitrogen use in the global ocean. PLoS ONE 5:e9569,doi:10.1371/journL.PONE.0009569
Bricaud A, Stramski D (1990) Spectral absorption coefficientsof living phytoplankton and nonalgal biogenous matter: acomparison between the Peru upwelling area and theSargasso Sea. Limnol Oceanogr 35:562–582
Casey J, Lomas MW, Mandecki J, Walker DE (2007) Pro-chlorococcus contributes to new production in the Sar-gasso Sea deep chlorophyll maximum. Geophys Res Lett34:L10604, doi:10.1029/2006GL028725
Chisholm SW (1992) Phytoplankton size. In: Falkowski PG,Woodhead AD (eds) Primary productivity and biogeo-chemical cycles in the sea. Plenum Press, New York, NY,p 213–237
Conkright ME, Garcia HE, O’Brian TD, Locarnini RA, Boyer
14
Hickman et al.: Modelling phytoplankton communities
TP, Stephens C, Antonov JI (2002) World ocean atlas 2001,Vol 4. Nutrients. In: Levitus S (ed) NOAA Atlas NESDIS52. US Government Printing Office, Washington, DC
Dutkiewicz S, Follows MJ, Parekh P (2005) Interactions of theiron and phosphorus cycles: a three-dimensional modelstudy. Glob Biogeochem Cycles 19:GB1021, doi:10.1029/2004GB002342
Dutkiewicz S, Follows MJ, Bragg J (2009) Modeling the cou-pling of ocean ecology and biogeochemistry. Glob Bio-geochem Cycles 23:GB4017, doi:10.1029/2008GB003405
Eppley RW (1972) Temperature and phytoplankton growth inthe sea. Fish Bull 70:1063–1085
Follows MJ, Dutkiewicz S, Grant S, Chisholm SW (2007)Emergent biogeography of microbial communities in amodel ocean. Science 315:1843–1846
Geider RJ, MacIntyre HL, Kana TM (1997) Dynamic model ofphytoplankton growth and acclimation: responses of thebalanced growth rate and the chlorophyll a:carbon ratio tolight, nutrient-limitation and temperature. Mar Ecol ProgSer 148:187–200
Gregg WW, Casey NW (2007) Modeling coccolithophores inthe global oceans. Deep-Sea Res II 54:447–477
Heywood JL, Zubkov MV, Tarran GA, Fuchs BM, HolliganPM (2006) Prokaryoplankton standing stocks in oligo-trophic gyre and equatorial provinces of the AtlanticOcean: evaluation of inter-annual variability. Deep-SeaRes II 53:1530–1547
Hickman AE, Holligan PM, Moore CM, Sharples J, KrivtsovV, Palmer MR (2009) Distribution and chromatic adapta-tion of phytoplankton within a shelf sea thermocline.Limnol Oceanogr 54:525–536
Jeffrey SW, Mantoura REC, Wright SW (1997) Phytoplanktonpigments in oceanography: guidelines to modern meth-ods. UNESCO, Paris
Johnson ZI, Zinser ER, Coe A, McNulty NP, Woodward EMS,Chisholm SW (2006) Niche partitioning among Prochloro-coccus phenotypes along ocean-scale environmental gra-dients. Science 311:1737–1740
Kettle H, Merchant CJ (2008) Modeling ocean primary pro-duction: sensitivity to spectral resolution of attenuationand absorption of light. Prog Oceanogr 78:135–146
Kirk JTO (1994) Light and photosynthesis in aquatic ecosys-tems. Cambridge University Press, Cambridge
Kitidis V, Stubbins AP, Uher G, Upstill Goddard RC, LawCS, Woodward EMS (2006) Variability of chromophoricorganic matter in surface waters of the Atlantic Ocean.Deep-Sea Res II 53:1666–1684
Kyewalyanga MN, Platt T, Sathyendranath S, Lutz VA, StuartV (1998) Seasonal variations in physiological parametersof phytoplankton across the North Atlantic. J Plankton Res20:17–42
Ledwell JR, Watson AJ, Law CS (1993) Evidence for slowmixing across the pycnocline from an open-ocean tracer-release experiment. Nature 364:701–703
Litchman E, Klausmeier CA, Schofield OM, Falkowski PG(2007) The role of functional traits and trade-offs in struc-turing phytoplankton communities: scaling from cellularto ecosystem level. Ecol Lett 10:1170–1181
Lutz VA, Sathyendranath S, Head EJH, Li WKW (2003) Vari-ability in pigment composition and optical characteristicsof phytoplankton in the Labrador Sea and the CentralNorth Atlantic. Mar Ecol Prog Ser 260:1–18
Moore LR, Chisholm SW (1999) Photophysiology of themarine cyanobacterium Prochlorococcus: ecotypic dif-ferences among cultured isolates. Limnol Oceanogr 43:628–638
Moore LR, Goericke R, Chisholm S (1995) Comparative phys-
iology of Synechococcus and Prochlorococcus: influenceof light and temperature on growth, pigments, fluores-cence and absorptive properties. Mar Ecol Prog Ser 116:259–275
Moore LR, Rocap G, Chisholm SW (1998) Physiology and mol-ecular phylogeny of coexisting Prochlorococcus pheno-types. Nature 393:464–466
Moore LR, Post AF, Rocap G, Chisholm SW (2002) Utilizationof different nitrogen sources by the marine cyanobacteriaProchlorococcus and Synechococcus. Limnol Oceanogr47:989–996
Partensky F, Blanchot J, Lantoine F, Neveux J, Marie D (1996)Vertical structure of picophytoplankton at differenttrophic sites of the tropical northeastern Atlantic Ocean.Deep-Sea Res I 43:1191–1213
Pope RM, Fry ES (1997) Absorption spectrum (380–700 nm)of pure water. II. Integrating cavity measurements. ApplOpt 36:8710–8723
Rabouille S, Edwards CA, Zehr JP (2007) Modelling the verti-cal distribution of Prochlorococcus and Synechococcus inthe North Pacific Subtropical Ocean. Environ Microbiol9:2588–2602
Raven JA (1984) A cost-benefit analysis of photon absorptionby photosynthetic unicells. New Phytol 98:593–625
Rocap G, Larimer FW, Lamerdin JW, Malfatti S and others(2003) Genome divergence in two Prochlorococcus pheno-types reflects oceanic niche differentiation. Nature 424:1042–1047
Sathyendranath S, Platt T (2007) Spectral effects in bio-opticalcontrol on the ocean system. Oceanologia 49:5–39
Scanlan DJ, Ostrowski M, Mazard S, Dufresne A and others(2009) Ecological genomics of marine picocyanobacteria.Microbiol Mol Biol Rev 73:249–299
Six C, Finkel ZV, Irwin AJ, Campbell DA (2007) Light vari-ability illuminates niche-partitioning among marine pico-cyanobacteria. PLoS ONE 2:e1341, doi:10.1371/journal.pone.0001341
Stephens C, Antonov JI, Boyer TP, Conkright ME, LocarniniRA, O’Brian TDO, Garcia HE (2002) World ocean atlas2001, Vol 1. Temperature. In: Levitus S (ed) NOAA AtlasNESDIS 49. US Government Printing Office, Washington,DC
Stomp M, Huisman J, de Jongh F, Veraart AJ and others(2004) Adaptive divergence in pigment composition pro-motes phytoplankton biodiversity. Nature 432:104–107
Stomp M, Huisman J, Vörös L, Pick FR, Laamanen M,Haverkamp T, Stal LJ (2007) Colourful coexistence of redand green picocyanobacteria in lakes and seas. Ecol Lett10:290–298
Suggett DJ, MacIntyre HL, Geider RJ (2004) Evaluation ofbiophysical and optical determinations of light absorptionby photosystem II in phytoplankton. Limnol OceanogrMethods 2:316–332
Suggett DJ, Moore CM, Hickman AE, Geider RJ (2009) Inter-pretation of fast repetition rate (FRR) fluorescence: signa-tures of phytoplankton community structure versus physi-ological state. Mar Ecol Prog Ser 376:1–19
Ting CS, Rocap G, King J, Chisholm SW (2002) Cyanobacter-ial photosynthesis in the oceans: the origins and sig-nificance of divergent light harvesting strategies. TrendsMicrobiol 10:134–142
Tomo T, Akimoto S, Ito H, Tsuchiya T, Fukuya M, Tanaka A,Mimuro M (2009) Replacement of chlorophyll with di-vinyl chlorophyll in the antenna and reaction centre com-plexes of the cyanobacterium Synechocystis sp. PCC 6803:characterisation of spectral and photochemical properties.Biochim Biophys Acta 1787:191–200
15
Williams RG, Follows MJ (1998) The Ekman transfer of nutri-ents and maintenance of new production over the NorthAtlantic. Deep-Sea Res I 45:461–489
Wood AM (1985) Adaptation of photosynthetic apparatus ofmarine ultraphytoplankton to natural light fields. Nature316:253–255
Zinser ER, Johnson ZI, Coe A, Karaca E, Veneziano D,Chisholm SW (2007) Influence of light and temperature onProchlorococcus phenotype distributions in the Atlantic
Ocean. Limnol Oceanogr 52:2205–2220Zubkov MV, Sleigh MA, Tarran GA, Burkill PH, Leakey
RJG (1998) Picoplanktonic community structure on anAtlantic transect from 50° N to 50° S. Deep-Sea Res I 45:1339–1355
Zubkov MV, Sleigh MA, Burkill PH, Leakey RJG (2000)Picoplankton community structure on the Atlantic Merid-ional Transect: a comparison between seasons. ProgOceanogr 45:369–386
Mar Ecol Prog Ser 406: 1–17, 201016
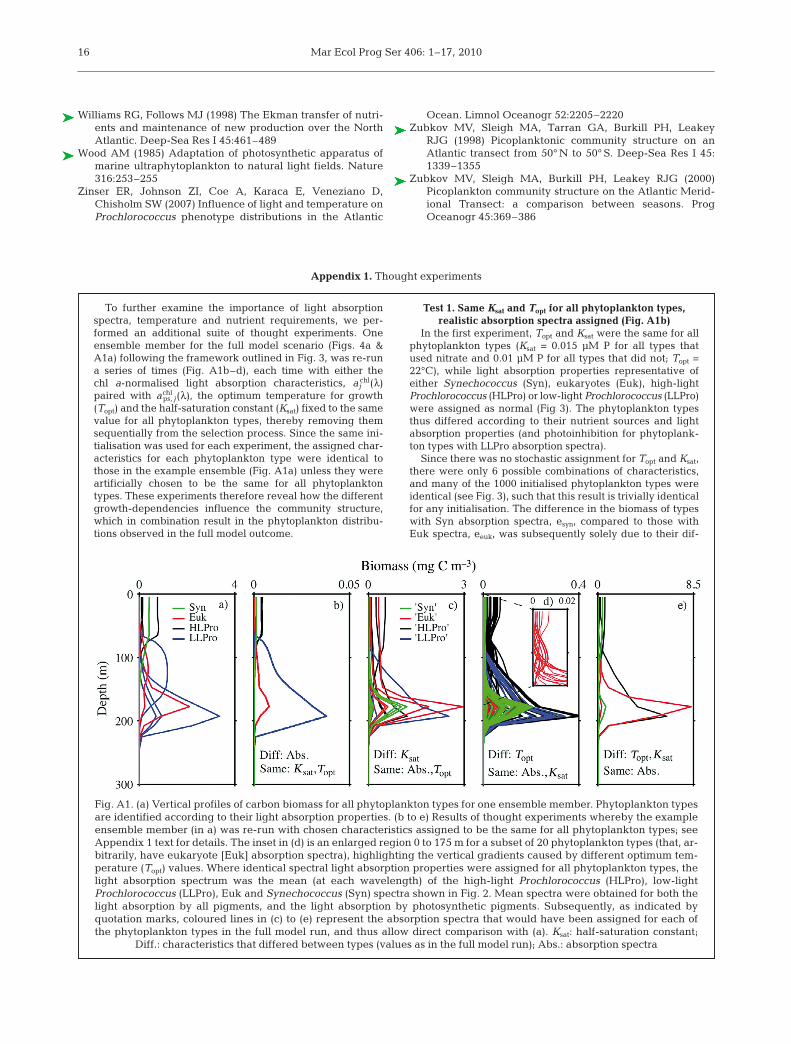
Appendix 1. Thought experiments
To further examine the importance of light absorptionspectra, temperature and nutrient requirements, we per-formed an additional suite of thought experiments. Oneensemble member for the full model scenario (Figs. 4a &A1a) following the framework outlined in Fig. 3, was re-runa series of times (Fig. A1b–d), each time with either thechl a-normalised light absorption characteristics, aj
chl(λ)paired with achl
ps, j(λ), the optimum temperature for growth(Topt) and the half-saturation constant (Ksat) fixed to the samevalue for all phytoplankton types, thereby removing themsequentially from the selection process. Since the same ini-tialisation was used for each experiment, the assigned char-acteristics for each phytoplankton type were identical tothose in the example ensemble (Fig. A1a) unless they wereartificially chosen to be the same for all phytoplanktontypes. These experiments therefore reveal how the differentgrowth-dependencies influence the community structure,which in combination result in the phytoplankton distribu-tions observed in the full model outcome.
Test 1. Same Ksat and Topt for all phytoplankton types,realistic absorption spectra assigned (Fig. A1b)
In the first experiment, Topt and Ksat were the same for allphytoplankton types (Ksat = 0.015 μM P for all types thatused nitrate and 0.01 μM P for all types that did not; Topt =22°C), while light absorption properties representative ofeither Synechococcus (Syn), eukaryotes (Euk), high-lightProchlorococcus (HLPro) or low-light Prochlorococcus (LLPro)were assigned as normal (Fig 3). The phytoplankton typesthus differed according to their nutrient sources and lightabsorption properties (and photoinhibition for phytoplank-ton types with LLPro absorption spectra).
Since there was no stochastic assignment for Topt and Ksat,there were only 6 possible combinations of characteristics,and many of the 1000 initialised phytoplankton types wereidentical (see Fig. 3), such that this result is trivially identicalfor any initialisation. The difference in the biomass of typeswith Syn absorption spectra, esyn, compared to those withEuk spectra, eeuk, was subsequently solely due to their dif-
Fig. A1. (a) Vertical profiles of carbon biomass for all phytoplankton types for one ensemble member. Phytoplankton typesare identified according to their light absorption properties. (b to e) Results of thought experiments whereby the exampleensemble member (in a) was re-run with chosen characteristics assigned to be the same for all phytoplankton types; seeAppendix 1 text for details. The inset in (d) is an enlarged region 0 to 175 m for a subset of 20 phytoplankton types (that, ar-bitrarily, have eukaryote [Euk] absorption spectra), highlighting the vertical gradients caused by different optimum tem-perature (Topt) values. Where identical spectral light absorption properties were assigned for all phytoplankton types, thelight absorption spectrum was the mean (at each wavelength) of the high-light Prochlorococcus (HLPro), low-lightProchlorococcus (LLPro), Euk and Synechococcus (Syn) spectra shown in Fig. 2. Mean spectra were obtained for both thelight absorption by all pigments, and the light absorption by photosynthetic pigments. Subsequently, as indicated byquotation marks, coloured lines in (c) to (e) represent the absorption spectra that would have been assigned for each ofthe phytoplankton types in the full model run, and thus allow direct comparison with (a). Ksat: half-saturation constant;
Diff.: characteristics that differed between types (values as in the full model run); Abs.: absorption spectra
Hickman et al.: Modelling phytoplankton communities 17
Appendix 1 (continued)
ferences in light absorption properties. This result showsthat the light absorption properties allow coexistence of esyn
and eeuk towards the surface, resulting from their utilisationof different components of the light spectrum (Stomp et al.2004, 2007). Further, it reveals an advantage for Syn com-pared to Euk spectra towards the surface, given the higherbiomass for esyn (Fig. A1b). The dominant effects of spectralabsorption properties and photoinhibition discussed in themain text also describe the vertical separation of phyto-plankton types with HLPro and LLPro absorption propertiesin this experiment.
This experiment revealed similar vertical gradients incommunity composition as observed for the ensemble meanof the full model (Fig. 5d).
Test 2. Same Topt and absorption spectra for all types, Ksat
assigned stochastically (Fig. A1c)
In the second thought experiment, all phytoplankton typeswere provided with the same (mean) light absorption spectraand a constant value for Topt (Topt = 22°C), while Ksat was as-signed stochastically. The line colours in Fig. A1c representthe absorption spectrum and were assigned for directlycorresponding phytoplankton types in the full model, eventhough the light absorption properties are now the samefor all types. This enables a comparison to the distributionsinthe full model outcome (Fig. A1c). Accepting that photoin-hibition and the nitrogen resource requirements causedsome vertical structure within the non-nitrate-using phyto-plankton types, there were no apparent vertical shifts incommunity structure caused by the contrasting values of Ksat.The selection for low Ksat values (Fig. 8a,b) strongly influ-enced which phytoplankton types were successful and signif-icantly reduced the number of viable types. However, thesuccessful types were consistently dominant at all depths.Thus, in the full model, the selection for Ksat values reducedthe number of potentially successful phytoplankton types(and all successful types had low Ksat values) but did not sig-nificantly influence the vertical gradients in communitystructure.
Test 3. Same Ksat and absorption spectra for all types, Topt
assigned stochastically (Fig. A1d)
In the third thought experiment, all phytoplankton typeshad the same (mean) light absorption spectra and the sameKsat value (Ksat = 0.015 μM P for all phytoplankton types thatused nitrate and 0.01 μM P for those that did not), while Topt
was assigned stochastically. Variations in the value of Topt,
and corresponding competition on the temperate gradient(Fig. 8c,d), caused fine-scale vertical gradients in thecommunity structure through the water column (inset inFig. A1d). This selection on the temperature gradient wasresponsible for the success of numerous different phyto-plankton types within the light resource groupings, forexample, the multiple phytoplankton types with LLProabsorption spectra (i.e. blue lines) in the full ensemble mem-ber (Fig. A1a). Selection due to the temperature dependencedid not reduce the number of successful phytoplanktontypes.
The vertical gradients in community structure observed inthe full model outcome were thus dependent on the temper-ature dependence; phytoplankton types that were success-ful towards the surface had high values of Topt, whilst thosesuccessful at depth had lower values of Topt.
Test 4. Same absorption spectra for all types, Topt and Ksat
assigned stochastically (Fig. A1e)
In a final thought experiment, all phytoplankton typeshad the same (mean) light absorption spectra, whilst Topt
and Ksat were assigned stochastically. This experiment thusrepresents an ensemble member that contributed to themean shown in Fig. 7b. Although not identical, there weresimilarities between this experiment (Fig. A1e) and theensemble outcome from the full model (Fig. A1a). For exam-ple, in the ensemble from the full model (Fig. A1a), a phyto-plankton type with Syn absorption spectra dominated at thesurface, whilst in the experiment (Fig. A1e), this alsooccurred, albeit by chance due to the assigned Topt and Ksat
values, rather than spectral light absorption properties. Sim-ilarly, Ksat and Topt were optimal for growth at the DCM forthe phytoplankton type also assigned Euk absorption spec-tra in the example ensemble (Fig. A1a,e). It follows that inthe full example ensemble member (Fig. A1a), the success-ful phytoplankton types with Euk and Syn light absorptionproperties had dependencies on temperature, nutrients andlight that were co-optimal. Successful phytoplankton typesin the full model therefore also, on average, had a co-optimal combination of traits.
In summary, this series of thought experiments revealshow the spectral light properties, Ksat and Topt act on phyto-plankton selection. Crucially, the model preferentiallyselected for phytoplankton with co-optimal traits. Thus, thesuccessful phytoplankton types in the ensemble mean(Fig. 5) had, in addition to their dependence on spectral irra-diance, low half saturation constants for nutrient uptake andtemperature optima suitable for the depth at which theyoccurred in the water column.
Editorial responsibility: Graham Savidge, Portaferry, UK
Submitted: October 3, 2009; Accepted: March 16, 2010Proofs received from author(s): April 11, 2010
Related Documents