38 Modelling the distribution of stoats on New Zealand offshore islands Andrew J. Veale 1,* , Oliver D. Hannaford 2 , James C. Russell 1 and Mick N. Clout 1 1 Biodiversity, Biosecurity and Conservation, School of Biological Sciences, Tamaki Campus, University of Auckland, Private Bag 92019, Auckland 1142, New Zealand 2 Institute of Information & Mathematical Sciences, Department of Statistics, Massey University Albany, Private Bag 102904, New Zealand *Author for correspondence (Email: [email protected]) Published on-line: 14 December 2011 Abstract: Establishing the factors that correlate with the distribution of invasive species on islands provides a means of evaluating invasion potential and pathways, and enables the invasion risk for specific areas to be predicted. These island risk profiles then provide a basis for conservation managers to prioritise conservation areas, and to create appropriate monitoring regimes. In New Zealand, stoats (Mustela erminea) are invasive predators responsible for numerous local extinctions of birds, and they present a significant invasion risk for offshore islands. Here we examine the distribution of stoats on New Zealand’s offshore islands in order to establish what factors are correlated with their distribution, and predict which islands display a high invasion risk. Data on the distribution of stoats were compiled, along with the characteristics of New Zealand’s islands and their settlement history. The distribution of stoats on these islands was regressed on island characteristics using a logistic generalised linear model. Species interactions were examined by including the distribution of a range of other introduced mammalian species. The distribution of stoats was found to be strongly affected by the distance offshore and by the area of the island. No significant correlations with the extent of human settlement or the presence of other animals were detected. The model indicates that the invasibility of islands by stoats has been underestimated. Islands within 1 km of the mainland have a very high stoat invasion risk, which is consistent with known invasions, and for large islands (≥ 500 ha) there remains a significant risk to at least 3 km offshore. This model provides a framework for assessing risks of stoat incursion and makes specific predictions of islands with a significant invasion risk that have not had stoats detected before. Keywords: invasion; invasive species; logistic model; Mustela erminea; risk profile Introduction New Zealand’s offshore islands are a major focus for ecological research and conservation, due both to the high endemism of the biota present (Cheeseman 1888; Fleming 1979), and because they have provided refugia for species made extinct on the main islands following human settlement (Worthy & Holdaway 2002; Innes et al. 2010). A growing number of these islands have had successful invasive mammal eradications, enabling their ecological restoration and allowing them to provide sanctuary for endangered fauna (Atkinson 2001; Wilson 2004; Clout & Russell 2008). With the growing list of mammal-free islands, the risk of reinvasion has similarly increased: particularly as islands that are larger, inhabited and closer to the mainland have eradication operations conducted on them (Clout & Russell 2008). Of the suite of invasive species introduced to New Zealand, stoats (Mustela erminea) have one of the greatest island invasion/reinvasion potentials (Parkes & Murphy 2003; Bellingham et al. 2010), and have the greatest negative effect on bird population productivity (Lavers et al. 2010). Stoats were introduced to New Zealand in 1884 (Thomson 1922) for the purposes of rabbit control, and were first noted for their invasion of islands in 1900, when they catastrophically invaded Resolution Island, causing the local extinction of a number of bird species (Hill & Hill 1987). Subsequent to this, stoats have been detected on at least 90 islands, and this colonisation is believed to have been entirely through unaided natural dispersal (King 2005). The best-documented series of these invasions have been the incursions of stoats on Maud Island 900 m offshore in the Marlborough Sounds. On this island there have been three separate invasions by pregnant female stoats since 1982, resulting in a total of 18 stoats caught on the island. The first of these invasions (a pregnant female with seven kits) extirpated the South Island saddleback (Philesturnus caruncalatus) population on the island (Crouchley 1994, King & Powell 2007). The smallest island in New Zealand shown to have a resident stoat population is Motuoruhi (57 ha). On this island, eight stoats were captured in the initial trapping season (2003), then over the subsequent 8 years only five stoats were sporadically caught, all incursions (Rob Chappell, DOC Coromandel, pers. comm. 2010). This island must be near the lower limit of island size that can support a stoat population for any length of time. For islands smaller than this, the presence of stoats will be determined by the immigration rate, and the duration of occupation by each stoat (before either leaving to another island or dying). Stoats are extremely adept swimmers and it is believed that this is their primary invasion pathway. There are eyewitness accounts of a stoat swimming ‘a determinedly straight course’ for some 400 m to an island in Baltimore Bay (south-west Ireland) that still had healthy rabbits after the mainland stock had been decimated by myxomatosis (King & Moors 1979). In New Zealand, stoats have been seen swimming across Acheron Passage towards Resolution Island (Wodzicki & Bull 1951) – a distance of at least 560 m; they have been recorded swimming in Lake Taupo over 1.6 km from land (Fitzgerald 1978); and a stoat was observed swimming across New Zealand Journal of Ecology (2012) 36(1): 38-47 © New Zealand Ecological Society. Available on-line at: http://www.newzealandecology.org/nzje/

Welcome message from author
This document is posted to help you gain knowledge. Please leave a comment to let me know what you think about it! Share it to your friends and learn new things together.
Transcript
38 New Zealand Journal of Ecology, Vol. 36, No. 1, 2012
Modelling the distribution of stoats on New Zealand offshore islands
Andrew J. Veale1,*, Oliver D. Hannaford2, James C. Russell1 and Mick N. Clout11Biodiversity, Biosecurity and Conservation, School of Biological Sciences, Tamaki Campus, University of Auckland, Private Bag 92019, Auckland 1142, New Zealand2Institute of Information & Mathematical Sciences, Department of Statistics, Massey University Albany, Private Bag 102904, New Zealand*Author for correspondence (Email: [email protected])
Published on-line: 14 December 2011
Abstract: Establishing the factors that correlate with the distribution of invasive species on islands provides a means of evaluating invasion potential and pathways, and enables the invasion risk for specific areas to be predicted. These island risk profiles then provide a basis for conservation managers to prioritise conservation areas, and to create appropriate monitoring regimes. In New Zealand, stoats (Mustela erminea) are invasive predators responsible for numerous local extinctions of birds, and they present a significant invasion risk for offshore islands. Here we examine the distribution of stoats on New Zealand’s offshore islands in order to establish what factors are correlated with their distribution, and predict which islands display a high invasion risk. Data on the distribution of stoats were compiled, along with the characteristics of New Zealand’s islands and their settlement history. The distribution of stoats on these islands was regressed on island characteristics using a logistic generalised linear model. Species interactions were examined by including the distribution of a range of other introduced mammalian species. The distribution of stoats was found to be strongly affected by the distance offshore and by the area of the island. No significant correlations with the extent of human settlement or the presence of other animals were detected. The model indicates that the invasibility of islands by stoats has been underestimated. Islands within 1 km of the mainland have a very high stoat invasion risk, which is consistent with known invasions, and for large islands (≥ 500 ha) there remains a significant risk to at least 3 km offshore. This model provides a framework for assessing risks of stoat incursion and makes specific predictions of islands with a significant invasion risk that have not had stoats detected before.
Keywords: invasion; invasive species; logistic model; Mustela erminea; risk profile
Introduction
New Zealand’s offshore islands are a major focus for ecological research and conservation, due both to the high endemism of the biota present (Cheeseman 1888; Fleming 1979), and because they have provided refugia for species made extinct on the main islands following human settlement (Worthy & Holdaway 2002; Innes et al. 2010). A growing number of these islands have had successful invasive mammal eradications, enabling their ecological restoration and allowing them to provide sanctuary for endangered fauna (Atkinson 2001; Wilson 2004; Clout & Russell 2008). With the growing list of mammal-free islands, the risk of reinvasion has similarly increased: particularly as islands that are larger, inhabited and closer to the mainland have eradication operations conducted on them (Clout & Russell 2008). Of the suite of invasive species introduced to New Zealand, stoats (Mustela erminea) have one of the greatest island invasion/reinvasion potentials (Parkes & Murphy 2003; Bellingham et al. 2010), and have the greatest negative effect on bird population productivity (Lavers et al. 2010).
Stoats were introduced to New Zealand in 1884 (Thomson 1922) for the purposes of rabbit control, and were first noted for their invasion of islands in 1900, when they catastrophically invaded Resolution Island, causing the local extinction of a number of bird species (Hill & Hill 1987). Subsequent to this, stoats have been detected on at least 90 islands, and this colonisation is believed to have been entirely through unaided natural dispersal (King 2005). The best-documented series of
these invasions have been the incursions of stoats on Maud Island 900 m offshore in the Marlborough Sounds. On this island there have been three separate invasions by pregnant female stoats since 1982, resulting in a total of 18 stoats caught on the island. The first of these invasions (a pregnant female with seven kits) extirpated the South Island saddleback (Philesturnus caruncalatus) population on the island (Crouchley 1994, King & Powell 2007). The smallest island in New Zealand shown to have a resident stoat population is Motuoruhi (57 ha). On this island, eight stoats were captured in the initial trapping season (2003), then over the subsequent 8 years only five stoats were sporadically caught, all incursions (Rob Chappell, DOC Coromandel, pers. comm. 2010). This island must be near the lower limit of island size that can support a stoat population for any length of time. For islands smaller than this, the presence of stoats will be determined by the immigration rate, and the duration of occupation by each stoat (before either leaving to another island or dying).
Stoats are extremely adept swimmers and it is believed that this is their primary invasion pathway. There are eyewitness accounts of a stoat swimming ‘a determinedly straight course’ for some 400 m to an island in Baltimore Bay (south-west Ireland) that still had healthy rabbits after the mainland stock had been decimated by myxomatosis (King & Moors 1979). In New Zealand, stoats have been seen swimming across Acheron Passage towards Resolution Island (Wodzicki & Bull 1951) – a distance of at least 560 m; they have been recorded swimming in Lake Taupo over 1.6 km from land (Fitzgerald 1978); and a stoat was observed swimming across
New Zealand Journal of Ecology (2012) 36(1): 38-47 © New Zealand Ecological Society.
Available on-line at: http://www.newzealandecology.org/nzje/
39Veale et al.: Modelling island stoat distribution
Lake Waikaremoana, a distance of 3–4 km (J. Miles, DOC, pers. comm. 2011). Stoats have also been observed floating on woody debris in the Hauraki Gulf in the vicinity of the Noises Islands (B. Neureuter, Neureuter Family Trust, pers. comm. 2003). Stoat trapping data from the western Coromandel islands (R. Chappell unpubl.) indicates that stoats will swim over a kilometre not as a single life event, but as a routine dispersal for food. Not only do stoats swim out to islands, but they can also swim significant distances between small islands. This has been the observed pattern in their native range where stoats have been recorded swimming in Scottish lochs to very small islets to briefly explore for prey before moving on (Boyd 1958), and in Finland where stoats move frequently among thousands of islands (Heikkila et al. 1994).
The distribution of stoats on islands was reviewed by Taylor and Tilley (1984) and McKinlay (1997), who concluded that minimum swimming distance is the primary determining factor of stoat presence. These reviews state that 1.2–1.5 km is the maximum swimming range of stoats, and this belief is often quoted in relation to island restoration potential (e.g. Miller et al. 1994; Colbourne 2005). These previous studies, however, have only been qualitative, simply reviewing which islands have had stoats recorded on them, and equating the maximum distance recorded with the maximum swimming range. In these studies it was also assumed that established stoat populations on islands more than 1.5 km offshore (e.g. Rangitoto and Motutapu) must have been anthropogenically introduced, so these were excluded from estimates of invasion potential. More recently, Elliott and colleagues (2010) modelled stoat invasion rates on the small islands in Fiordland. They found that beyond 500 m the invasion rate dropped off significantly, so that islands beyond this distance were likely to have one stoat invade every 10 years or so. This study, while useful for island management in the region, does not assess the absolute potential for island invasion; rare long-distance-dispersal events are important for assessing invasion risk. Also, like the previous papers, Elliot and colleagues focused only on island distance offshore, neglecting other potential factors that may influence stoat invasion.
In recent years there have been a number of stoat incursions on islands thought to be outside their swimming range (see Appendix 1 for a full list of islands where stoats have occurred). This highlights the need for a better understanding of stoat invasion pathways and potential. Ideally, quantitative information and statistical modelling should enable the development of island ‘risk profiles’, which managers could then justifiably use to prioritise islands for conservation management, and to effect monitoring regimes on those considered at risk (Atkinson & Taylor 1991). Such risk profiling and modelling have been developed for New Zealand islands by Russell and Clout (2004) for the four rodent species present, which are the other mammalian predators likely to invade islands.
This paper sets out to quantify those characteristics that are correlated with the distribution of stoats on islands. This is done using the extensive data now available for New Zealand’s islands over 5 ha in area, including both offshore and lacustrine islands.
Methods
DatasetsData on the geographical morphology, habitats, exotic mammal distributions and settlement history of islands ≥ 5 ha (excluding the North and South Island) were obtained from Russell & Clout (2004). Species distribution data were then updated; primarily from the Department of Conservation (DOC) incursions database and from monitoring records obtained from local DOC offices. As stoats have never been taken to or recorded on Stewart Island, the islands surrounding it were excluded from the model.
Classification of species distribution was simplified to presence (at some stage of the island’s history), absence (not found on the island despite some investigation), or unknown (not enough information). Species absence is difficult to confirm, particularly for less detectable species such as stoats (Choquenot et al. 2001). They may have once occurred and subsequently gone extinct without any record (a temporal error), or may be present in such low numbers that they remain undetected (a spatial error). These errors may vary with other factors measured (area, settlement history) or unmeasured (island visitation rate, sampling effort) in the study. Measurement of such errors would be difficult (McArdle et al. 1990). On most islands, monitoring effort specific to stoats has been sporadic or opportunistic over the last century, and conducted only for short periods. The model therefore included any island where even minimal monitoring has been undertaken and it is acknowledged that there will be an underestimate of stoat incursions due to these factors, but an overestimate of current presence.
The co-occurrence of stoats and other invasive mammals (at some stage of the island’s history) may not coincide perfectly due to the inexact nature of the records of invasion timing. It is assumed, however, that when both stoats and other mammal species have been recorded on an island, it is likely that they will have co-occurred at some point. The timings of invasions (where known) were not incorporated into the models. Data on 16 variables were collected for each island in the study (Table 1).
Statistical analysisLogistic multiple regression models (McCullagh & Nelder 1989) were constructed in the program R (Ihaka & Gentleman 1996), relating the presence of stoats to explanatory variables hypothesised a priori (Table 1). The variables Elevation, Area and Distance were log10 transformed to remove right-skewness in their distributions. This resulted in more linear model fits and increased normality in their distributions.
Models were constructed with the goals of identifying and interpreting the explanatory variables that govern stoat distribution on New Zealand offshore islands and to predict islands at risk from stoat incursion that have not previously had stoats detected on them. To produce this predictive model, backwards selection was performed using the c2 approximate likelihood ratio test (Wilks 1938). Collinearity was tested for using standard variance inflation factors for each explanatory variable (Fox & Monette 1992). Diagnostic ROC statistics were calculated for the model to assess predictive power. It is regarded that C statistics ≥ 0.8 indicate models with excellent discriminatory capability (Hosmer & Lemeshow 2000); therefore models with very high discriminatory power.
40 New Zealand Journal of Ecology, Vol. 36, No. 1, 2012
Table 1. Variables and their description within the context of this study.__________________________________________________________________________________________________________________________________________________________________
Variable Description Range__________________________________________________________________________________________________________________________________________________________________
Continuous Areaa Land area of the island (ha) 2.5 – 174 600Elevationa Maximum elevation of the island (m) 4 – 1196Distance sourcea Distance from the nearest steppingstone island or mainland (whichever is closer) (m) 25 – 39 600
Discrete GDIa Geological Diversity Index (number of rock types present sensu Atkinson 1992) 1–6BHDIa Biological Habitat Diversity Index (number of biological habitat types present sensu Atkinson (1992)) 0–34
Binary (0/1) Mammals Presence/absence of stoats, Norway rats, ship rats, kiore, mice, rabbits, possums and cats 0/1 each
Categorical Landing Presence of a landing structure (wharf) Settlement – : Never inhabited A : Abandoned R : Government (Ranger) station F : Unmanned farm I : Inhabited Latitude 0 : Northern – north of 38°S (Bay of Islands, Hauraki Gulf, Bay of Plenty) 1 : Central – between 38°S and 42°S (Marlborough Sounds, Greater Cook Strait) 2 : Southern – south of 42°S (Fiordland) __________________________________________________________________________________________________________________________________________________________________a log10 transformed
Results
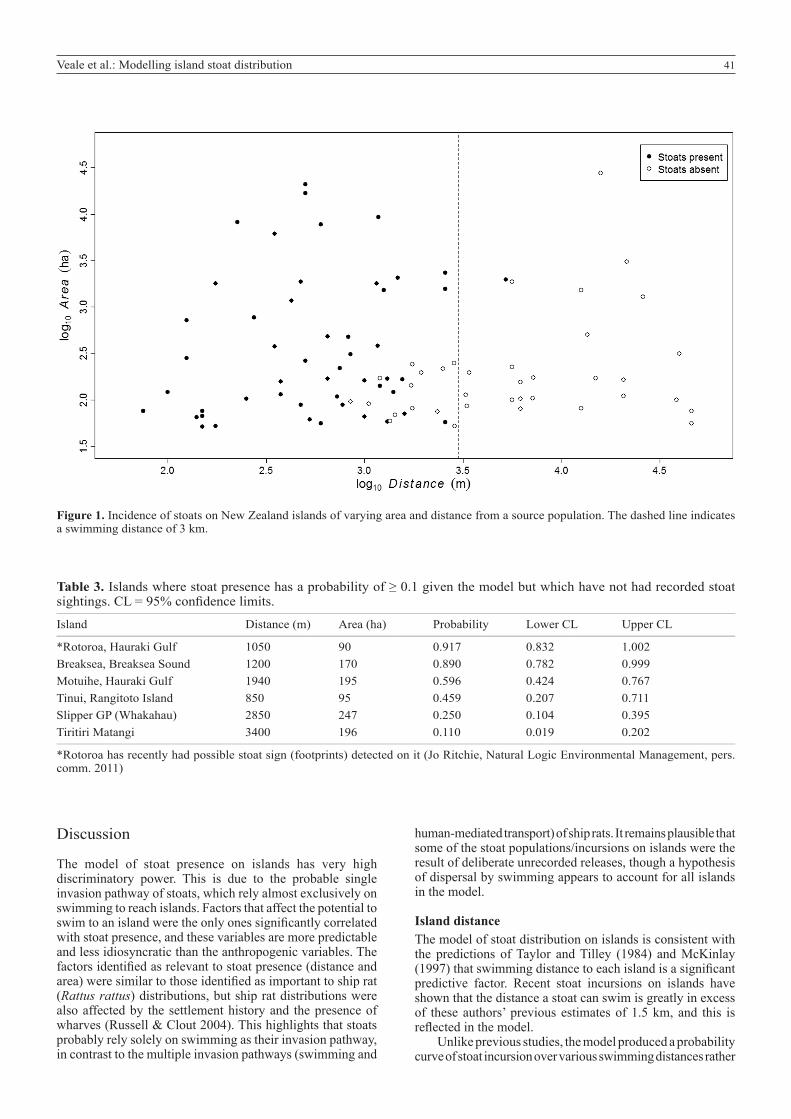
A clear relationship between stoat presence and both Area and Distance from Source was detected (Fig. 1). The relationship between stoat presence/absence appeared to break down for small islands, where very few islands have stoat presence recorded, and these islands were scattered across a wide distance range. Islands under 50 ha are believed to be approaching the minimum size required to support a resident stoat population, and inclusion of these islands will cause a temporal error due to the difference in the detectability of stoats on these islands. As it was believed that the assumption of presence equalling detection on these islands was violated, islands < 50 ha were excluded from the model.
The optimal model for predicting stoat presence/absence on islands had three significant variables: Area, Distance from Source and Latitude, with interactions between Latitude and Area (Table 2). The northern and southern islands had similar prediction curves, but the central islands had a very high likelihood of stoat presence. This pattern was greatly influenced by a single point (Kapiti Island) due to the low number of islands in this group and the great distance to this
Table 2. P-values of significant explanatory variables in the stoat distribution model.____________________________________________________________________________
Variable Full model Latitude excluded____________________________________________________________________________
log10(Distance) <0.001 *** <0.001 ***log10(Area) 0.001 ** 0.001 **Latitude 0.102 log10(Area):Latitude 0.027 * ____________________________________________________________________________
*** P < 0.001, ** P < 0.01, * P < 0.05
island. Because the inclusion of Latitude as an explanatory variable appeared to be linked with this, a reduced model was created that excluded Latitude as a variable (Table 2).
Stoat presence was positively related to log10 Area and negatively related to log10 Distance from Source, as classical island biogeographical theory would suggest. No significant relationships were observed between stoat presence and any anthropogenic factors (settlement history or landing structures). The presence/absence of any of the other introduced mammals investigated did not significantly add to the model, given the other variables retained. Collinearity was not observed between the variables retained in the model, and while some collinearity was observed between Area and some of the rodents present, these rodents were not significantly correlated with stoat presence when Area was not included in the model.
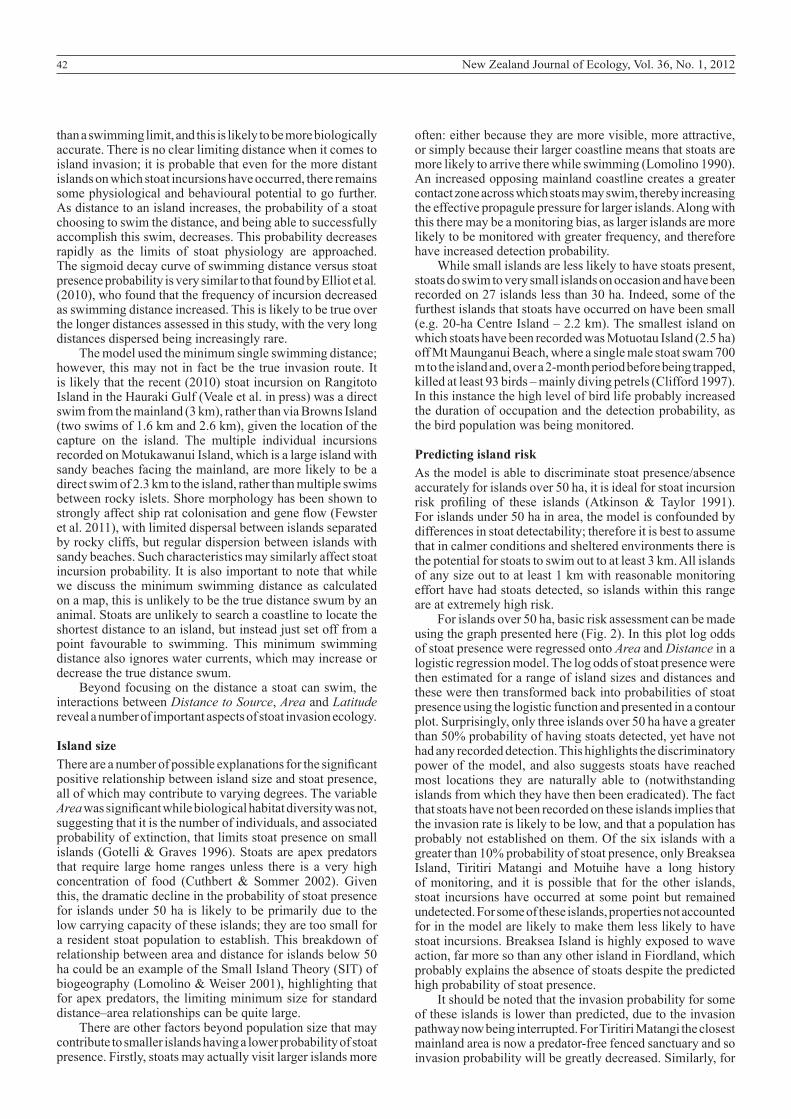
The model produced for stoat presence/absence prediction had high predictive power and discrimination. This is particularly evident in the ROC C statistic = 0.97, which approaches 1 for perfectly discriminating models. Across all latitudes, very small islands have extremely low probability of stoat presence across all distances. Islands of 50 ha area have a probability of close to 100% stoat presence when near to a source population, and greater than 50% probability of stoat presence out to distances of 1750 m. Larger islands of 500 ha have a greater than 50% probability of stoat presence out to over 2600 m, and for large islands over 1000 ha there is a greater than 50% probability to 3000 m.
New Zealand islands for which stoats have not been recorded, but which had a non-negligible likelihood of stoat presence (Pr(stoats) ≥ 0.1) were predicted using the model. These predictions identify islands that are either affected by factors not modelled, have had undetected stoat incursions, or are at risk of stoat incursion. Six islands over 50 ha that have never had stoats recorded on them had a predicted probability of over 10% for stoat presence (Table 3).
41Veale et al.: Modelling island stoat distribution
Figure 1. Incidence of stoats on New Zealand islands of varying area and distance from a source population. The dashed line indicates a swimming distance of 3 km.
Table 3. Islands where stoat presence has a probability of ≥ 0.1 given the model but which have not had recorded stoat sightings. CL = 95% confidence limits.__________________________________________________________________________________________________________________________________________________________________
Island Distance (m) Area (ha) Probability Lower CL Upper CL__________________________________________________________________________________________________________________________________________________________________
*Rotoroa, Hauraki Gulf 1050 90 0.917 0.832 1.002Breaksea, Breaksea Sound 1200 170 0.890 0.782 0.999Motuihe, Hauraki Gulf 1940 195 0.596 0.424 0.767Tinui, Rangitoto Island 850 95 0.459 0.207 0.711Slipper GP (Whakahau) 2850 247 0.250 0.104 0.395Tiritiri Matangi 3400 196 0.110 0.019 0.202__________________________________________________________________________________________________________________________________________________________________
*Rotoroa has recently had possible stoat sign (footprints) detected on it (Jo Ritchie, Natural Logic Environmental Management, pers. comm. 2011)
Discussion
The model of stoat presence on islands has very high discriminatory power. This is due to the probable single invasion pathway of stoats, which rely almost exclusively on swimming to reach islands. Factors that affect the potential to swim to an island were the only ones significantly correlated with stoat presence, and these variables are more predictable and less idiosyncratic than the anthropogenic variables. The factors identified as relevant to stoat presence (distance and area) were similar to those identified as important to ship rat (Rattus rattus) distributions, but ship rat distributions were also affected by the settlement history and the presence of wharves (Russell & Clout 2004). This highlights that stoats probably rely solely on swimming as their invasion pathway, in contrast to the multiple invasion pathways (swimming and
human-mediated transport) of ship rats. It remains plausible that some of the stoat populations/incursions on islands were the result of deliberate unrecorded releases, though a hypothesis of dispersal by swimming appears to account for all islands in the model.
Island distanceThe model of stoat distribution on islands is consistent with the predictions of Taylor and Tilley (1984) and McKinlay (1997) that swimming distance to each island is a significant predictive factor. Recent stoat incursions on islands have shown that the distance a stoat can swim is greatly in excess of these authors’ previous estimates of 1.5 km, and this is reflected in the model.
Unlike previous studies, the model produced a probability curve of stoat incursion over various swimming distances rather
42 New Zealand Journal of Ecology, Vol. 36, No. 1, 2012
than a swimming limit, and this is likely to be more biologically accurate. There is no clear limiting distance when it comes to island invasion; it is probable that even for the more distant islands on which stoat incursions have occurred, there remains some physiological and behavioural potential to go further. As distance to an island increases, the probability of a stoat choosing to swim the distance, and being able to successfully accomplish this swim, decreases. This probability decreases rapidly as the limits of stoat physiology are approached. The sigmoid decay curve of swimming distance versus stoat presence probability is very similar to that found by Elliot et al. (2010), who found that the frequency of incursion decreased as swimming distance increased. This is likely to be true over the longer distances assessed in this study, with the very long distances dispersed being increasingly rare.
The model used the minimum single swimming distance; however, this may not in fact be the true invasion route. It is likely that the recent (2010) stoat incursion on Rangitoto Island in the Hauraki Gulf (Veale et al. in press) was a direct swim from the mainland (3 km), rather than via Browns Island (two swims of 1.6 km and 2.6 km), given the location of the capture on the island. The multiple individual incursions recorded on Motukawanui Island, which is a large island with sandy beaches facing the mainland, are more likely to be a direct swim of 2.3 km to the island, rather than multiple swims between rocky islets. Shore morphology has been shown to strongly affect ship rat colonisation and gene flow (Fewster et al. 2011), with limited dispersal between islands separated by rocky cliffs, but regular dispersion between islands with sandy beaches. Such characteristics may similarly affect stoat incursion probability. It is also important to note that while we discuss the minimum swimming distance as calculated on a map, this is unlikely to be the true distance swum by an animal. Stoats are unlikely to search a coastline to locate the shortest distance to an island, but instead just set off from a point favourable to swimming. This minimum swimming distance also ignores water currents, which may increase or decrease the true distance swum.
Beyond focusing on the distance a stoat can swim, the interactions between Distance to Source, Area and Latitude reveal a number of important aspects of stoat invasion ecology.
Island sizeThere are a number of possible explanations for the significant positive relationship between island size and stoat presence, all of which may contribute to varying degrees. The variable Area was significant while biological habitat diversity was not, suggesting that it is the number of individuals, and associated probability of extinction, that limits stoat presence on small islands (Gotelli & Graves 1996). Stoats are apex predators that require large home ranges unless there is a very high concentration of food (Cuthbert & Sommer 2002). Given this, the dramatic decline in the probability of stoat presence for islands under 50 ha is likely to be primarily due to the low carrying capacity of these islands; they are too small for a resident stoat population to establish. This breakdown of relationship between area and distance for islands below 50 ha could be an example of the Small Island Theory (SIT) of biogeography (Lomolino & Weiser 2001), highlighting that for apex predators, the limiting minimum size for standard distance–area relationships can be quite large.
There are other factors beyond population size that may contribute to smaller islands having a lower probability of stoat presence. Firstly, stoats may actually visit larger islands more
often: either because they are more visible, more attractive, or simply because their larger coastline means that stoats are more likely to arrive there while swimming (Lomolino 1990). An increased opposing mainland coastline creates a greater contact zone across which stoats may swim, thereby increasing the effective propagule pressure for larger islands. Along with this there may be a monitoring bias, as larger islands are more likely to be monitored with greater frequency, and therefore have increased detection probability.
While small islands are less likely to have stoats present, stoats do swim to very small islands on occasion and have been recorded on 27 islands less than 30 ha. Indeed, some of the furthest islands that stoats have occurred on have been small (e.g. 20-ha Centre Island – 2.2 km). The smallest island on which stoats have been recorded was Motuotau Island (2.5 ha) off Mt Maunganui Beach, where a single male stoat swam 700 m to the island and, over a 2-month period before being trapped, killed at least 93 birds – mainly diving petrels (Clifford 1997). In this instance the high level of bird life probably increased the duration of occupation and the detection probability, as the bird population was being monitored.
Predicting island riskAs the model is able to discriminate stoat presence/absence accurately for islands over 50 ha, it is ideal for stoat incursion risk profiling of these islands (Atkinson & Taylor 1991). For islands under 50 ha in area, the model is confounded by differences in stoat detectability; therefore it is best to assume that in calmer conditions and sheltered environments there is the potential for stoats to swim out to at least 3 km. All islands of any size out to at least 1 km with reasonable monitoring effort have had stoats detected, so islands within this range are at extremely high risk.
For islands over 50 ha, basic risk assessment can be made using the graph presented here (Fig. 2). In this plot log odds of stoat presence were regressed onto Area and Distance in a logistic regression model. The log odds of stoat presence were then estimated for a range of island sizes and distances and these were then transformed back into probabilities of stoat presence using the logistic function and presented in a contour plot. Surprisingly, only three islands over 50 ha have a greater than 50% probability of having stoats detected, yet have not had any recorded detection. This highlights the discriminatory power of the model, and also suggests stoats have reached most locations they are naturally able to (notwithstanding islands from which they have then been eradicated). The fact that stoats have not been recorded on these islands implies that the invasion rate is likely to be low, and that a population has probably not established on them. Of the six islands with a greater than 10% probability of stoat presence, only Breaksea Island, Tiritiri Matangi and Motuihe have a long history of monitoring, and it is possible that for the other islands, stoat incursions have occurred at some point but remained undetected. For some of these islands, properties not accounted for in the model are likely to make them less likely to have stoat incursions. Breaksea Island is highly exposed to wave action, far more so than any other island in Fiordland, which probably explains the absence of stoats despite the predicted high probability of stoat presence.
It should be noted that the invasion probability for some of these islands is lower than predicted, due to the invasion pathway now being interrupted. For Tiritiri Matangi the closest mainland area is now a predator-free fenced sanctuary and so invasion probability will be greatly decreased. Similarly, for
43Veale et al.: Modelling island stoat distribution
Figure 2. Predicted probability of stoat presence for all islands from the logistic regression model (Latitude excluded).
Motuihe the model assumed stoat presence on Motutapu, which had all mammals eradicated in 2009. Invasion of Motuihe via Waiheke Island or the mainland is over a considerably longer distance and therefore invasion risk is greatly reduced.
Stoat island invasion rateOne difficulty in interpreting the results of this study is that probability is not time related – it is the probability of a stoat having ever been detected on each island. The predicted probability of stoat presence is likely to be correlated with invasion rate; however, the exact relationship between these two factors is unknown. The model does indicate that invasion rates predicted by Elliott and colleagues (2010) may be an underestimate of stoat invasion rates on larger islands – given that their assessments were made only on small islands, and island size affects stoat incursion (or detection) probability.
Improving the estimate for invasion rates on larger islands is very difficult for several reasons. Firstly, individual stoats may not enter traps immediately (or ever). Detection probability for stoats changes according to prey density (Alterio et al. 1999; King & White 2004); therefore when a stoat arrives on an island previously uninhabited by stoats, the high prey density decreases detection probability. There have been several cases where stoats have been known to be present on an island – through sightings, scat and footprints; however, they have avoided traps for a number of months – possibly years (Maud, Kapiti and Secretary islands) (Crouchley 1994; Pete McMurtrie, DOC Te Anau, pers. comm.). Secondly, capturing multiple stoats on an island, even a year apart, may not necessarily indicate multiple incursions. Female stoats are impregnated before leaving the nest and so are always able to found new populations (King & Moody 1982). Thirdly,
regular comprehensive (and expensive) trapping over long periods would be required be catch all stoats that do arrive on an island.
ImplicationsIn light of this model, we need to reconsider the stoat invasion probability for New Zealand’s islands, particularly those that are large and more distant from the mainland. Monitoring and management plans should be adjusted accordingly, acknowledging this increased understanding of invasion threat. Stoats are highly mobile, and pose a significant threat to most near-shore islands out to at least 3 km, with at least some risk out to 5.2 km given the recent incursion on Kapiti Island.
Alarmingly, current management plans for endangered species significantly underestimate the ability of stoats to swim between islands. In the DOC report assessing the suitability of islands as refuges for translocated kiwi, Colbourne (2005) states ‘some of the islands identified [for kiwi release] had stoats on them at the time of the survey, but were included because stoats could be eradicated permanently – the islands are outside stoat swimming distance’. All islands in New Zealand on which stoats have been recorded are believed to have been colonised naturally by swimming; therefore, any record of stoat occupation is indicative of that island’s invasibility by stoats.
For islands selected for ecological restoration or to be used as ecological sanctuaries, there are two management strategies to mitigate the effects of stoat reincursion: decreasing the invasion rate by trapping the land opposite, and ensuring stoat incursions are intercepted early by maintaining trapping on the island themselves (Russell et al. 2009). It is possible to maintain islands at zero stoat density for over a decade by using a vigilant trapping programme and intercepting
44 New Zealand Journal of Ecology, Vol. 36, No. 1, 2012
stoats before populations establish (as has been done on Maud, Chalky, Motukawanui and the islands of the western Coromandel region). This is necessary on any island where stoats are eradicated, as reinvasion is inevitable while stoats are present on the adjacent land. This has been highlighted recently with the incursion of individual stoats on Motuarohia and on Rangitoto Island within a year of eradication. The importance of ongoing biosecurity and trapping to protect vulnerable islands cannot be overstated, given the dramatic effects on native fauna of even a single female stoat incursion (Crouchley 1994).
Acknowledgements
We thank DOC staff Bill Cash, Rob Chappell, Pete McMurtrie and Kerri-Anne Edge for support and providing data on stoat distributions. We also thank Dianne Gleeson and Elaine Murphy for comments on the draft manuscript.
References
Alterio N, Moller H, Brown K 1999. Trappability and density of stoats (Mustela erminea) and ship rats (Rattus rattus) in a South Island Nothofagus forest, New Zealand. New Zealand Journal of Ecology 23: 95–100.
Atkinson IAE 1992. Major habitats on New Zealand islands. Report No. 92/39. Lower Hutt, DSIR Land Resources. [Held at Landcare Research library, Lincoln.] 96 p.
Atkinson IAE 2001. Introduced mammals and models for restoration. Biological Conservation 99: 81–96
Atkinson IAE, Taylor RH 1991. Distribution of alien mammals on New Zealand islands. Report No. 91/50. DSIR Land Resources, Lower Hutt. [Held at Landcare Research library, Lincoln.] 39 p.
Bell BD 1983. The challenge of the “stoat invasion” on Maud Island. Forest and Bird 14 (1): 12–14.
Bellingham PJ 1979. The birds of Ponui (Chamberlin’s) Island, Hauraki Gulf, August 1978. Tane 25: 17–21.
Bellingham PJ, Towns DR, Cameron EK, Davis JJ, Wardle DA, Wilmshurst JM, Mulder CPH 2010. New Zealand island restoration: seabirds, predators, and the importance of history New Zealand Journal of Ecology 34: 115–136.
Boyd JM 1958. Mole and stoat on Eilean Molach, Loch Ba, Argyll. Proceedings of the Zoological Society of London 131: 327–328.
Buckingham RP, Elliott GP 1979. D’Urville Island fauna survey December 1978 – January 1979. Nelson, DSIR Ecology Division file report 4/15/13. [Held at Landcare Research library, Lincoln.] 130 p.
Cheeseman TF 1888. Notes on the Three Kings Islands. Transactions and Proceedings of the New Zealand Institute 20 (1887): 141–150.
Choquenot D, Ruscoe WA, Murphy E 2001. Colonisation of new areas by stoats: time to establishment and requirements for detection. New Zealand Journal of Ecology 25(1): 83–88.
Clifford H 1997. Grey-faced petrel project. OSNZ News 82: 6.Clout MN, Russell JC 2008. The invasion ecology of mammals:
A global perspective. Wildlife Research 35: 180–184.Colbourne R 2005. Kiwi (Apteryx spp.) on offshore New
Zealand islands: populations, translocations and identification of potential release sites. DOC Research
& Development Series 208. Wellington, Department of Conservation. 24 p.
Crouchley D 1994. Stoat control on Maud Island 1982-1993. Ecological Management 2: 39–45.
Cuthbert R, Sommer E 2002. Home range, territorial behaviour and habitat use of stoats (Mustela erminea) in a colony of Hutton’s shearwater (Puffinus huttoni), New Zealand New Zealand Journal of Zoology 29: 149–160.
Edmonds HK 2006. Stoat trap servicing, Fiordland Coast, May 2006. Unpublished report. Department of Conservation Te Anau Area Office, PO Box 29, Te Anau 9640, New Zealand.
Elliott G, Willans M, Edmonds H, Crouchley D 2010. Stoat invasion, eradication and re-invasion of islands in Fiordland. New Zealand Journal of Zoology 37: 1–12.
Fewster RM, Miller SD, Ritchie J 2011. DNA profiling – a management tool for rat eradication. In: Veitch, CR, Clout MN, Towns DR eds Island invasives: eradication and management. Gland, Switzerland, IUCN. Pp. 426–431.
Fitzgerald BM 1978. A proposal for biological control. In: Dingwall PR, Atkinson IAE, Hay C eds The ecology and control of rodents in New Zealand nature reserves. Information series no. 4. Wellington, Department of Lands and Survey. Pp. 223–230.
Fleming CA 1979. The geological history of New Zealand and its life. Auckland, Auckland University Press. 141 p.
Fox J, Monette G 1992. Generalized collinearity diagnostics. Journal of the American Statistical Association 87: 178–183.
Gotelli NJ, Graves GR 1996. Null models in ecology. Washington, DC, Smithsonian Institution Press. 368 p.
Heikkilä J, Below A, Hanski I 1994. Synchronous dynamics of microtine rodent populations on islands in Lake Inari in northern Fennoscandia: evidence for regulation by mustelid predators. Oikos 70: 245–252.
Hill S, Hill J 1987. Richard Henry of Resolution Island. Dunedin, John McIndoe in association with the New Zealand Wildlife Service. 364 p.
Hitchmough RA, McCallum J 1980. The mammals, birds, reptiles and freshwater fish of the eastern island group of the Bay of Islands. Tane 26: 127–134.
Hosmer DW, Lemeshow S 2000. Applied logistic regression. 2nd edn. New York, Wiley. 373 p.
Ihaka R, Gentleman R 1996. R: A language for data analysis and graphics. Journal of Computational and Graphical Statistics 5: 299–314.
Innes J, Kelly D, Overton JMcC, Gillies C 2010. Predation and other factors currently limiting New Zealand forest birds. New Zealand Journal of Ecology 34: 86–114.
Kavermann M, Bowie M, Paterson A 2003. The eradication of mammalian predators from Quail Island, Banks Peninsula, Canterbury, New Zealand. Lincoln University Wildlife Management Report No. 29. Report prepared for the Quail Island Ecological Restoration Trust, and the Department of Conservation.
King CM ed. 2005. The handbook of New Zealand mammals. 2nd edn. Melbourne, Oxford University Press. 610 p.
King CM, Moody JE 1982. The biology of the stoat (Mustela erminea) in the National Parks of New Zealand IV. Reproduction. New Zealand Journal of Zoology 9: 103–118.
King CM, Moors PJ 1979. On co-existence, foraging strategy and the biogeography of weasels and stoats (Mustela nivalis and M. erminea) in Britain. Oecologia (Berl.) 39: 129–150.
45Veale et al.: Modelling island stoat distribution
King CM, Powell RA 2007. The natural history of weasels and stoats: ecology, behavior, and management. 2nd edn. New York, Oxford University Press. 446 p.
King CM, White PCL 2004. Decline in capture rate for stoats at high mouse densities in New Zealand Nothofagus forests. New Zealand Journal of Ecology 28: 251–258.
Lavers JL, Wilcox C, Donlan CJ 2010. Bird demographic responses to predator removal programs. Biological Invasions 12: 3839–3859.
Loh G 1993. Proposal to release mohua on Pigeon Island in Lake Wakatipu. New Zealand Department of Conservation Unpublished Report, Otago Conservancy Office, File BIR 5/3.
Lomolino MV 1990. The target area hypothesis: the influence of island area on immigration rates of non-volant mammals. Oikos 57: 297–300.
Lomolino MV, Weiser MD 2001. Towards a more general species–area relationship: diversity on all islands, great and small. Journal of Biogeography 28: 431–445.
Marshall WH 1963. The ecology of mustelids in New Zealand. DSIR Information Series 38. New Zealand Department of Scientific and Industrial Research. 32 p.
McArdle BH, Gaston KJ, Lawton JH 1990. Variation in the size of animal populations: patterns, problems and artefacts. Journal of Animal Ecology 59: 439–454.
McCullagh P, Nelder JA 1989. Generalized linear models. 2nd ed. London, Chapman & Hall.
McKinlay B 1997. The likelihood of arrival of stoats on islands. In: Sim J, Saunders A eds Predator workshop 1997: proceedings of a workshop held 21-24 April 1997 St. Arnaud, Nelson Lakes. Wellington, Department of Conservation. Pp. 51–53.
Miller CJ, Craig JL, Mitchell ND 1994. Ark 2020: A conservation vision for Rangitoto and Motutapu Islands. Journal of the Royal Society of New Zealand 24: 65–90.
Newhook FJ, Dickson EM, Bennett KJ 1971. A botanical survey of some offshore islands of the Coromandel Peninsula. Tane 17: 97-117.
Parkes J, Murphy E 2003. Management of introduced mammals in New Zealand. New Zealand Journal of Zoology 30: 335–359.
Richie J 2000. Matakohe/Limestone Island Scenic Reserve Restoration Plan (May 2000). Prepared for the Friends of Matakohe/Limestone Island Incorporated Society. Available at www.limestone.org.nz. 75 p.
Russell JC, Clout MN 2004. Modeling the distribution and interaction of introduced rodents on New Zealand offshore islands. Global Ecology and Biogeography 13: 497–507.
Russell JC, Mackay JWB, Abdelkrim J 2009. Insular pest control within a metapopulation context. Biological Conservation 142: 1404–1410.
Taylor RH, Tilley JAV 1984. Stoats (Mustela erminea) on Adele and Fisherman islands, Abel Tasman National Park, and other offshore islands in New Zealand. New Zealand Journal of Ecology 7: 139–145.
Thomson GM 1922. The naturalisation of animals and plants in New Zealand. Cambridge University Press.
Veale AJ, Clout MN, Gleeson DM In press. Genetic population assignment reveals a long-distance incursion to an island by a stoat (Mustela erminea). Biological Invasions. DOI 10.1007/s10530-011-0113-9.
Weihong J, Veith CR, Craig JL 1999. An evaluation of the efficiency of rodent trapping methods: the effect of trap arrangement, cover type, and bait. New Zealand Journal of Ecology 23: 45–51.
Wilks SS 1938. The large-sample distribution of the likelihood ratio for testing composite hypotheses. Annals of Mathematical Statistics 9: 60–62.
Willans M 2000. Unpublished file notes on the eradication of stoats from Chalky (Te kakahu O Tamatea), North Passage and South Passage Islands in Chalky Sound, Fiordland. Department of Conservation Te Anau Area Office, PO Box 29, Te Anau 9640, New Zealand.
Willans M 2002. Unpublished file notes on the eradication of stoats from Doubtful Islands and Erin Island in Middle Arm of Lake Te Anau, Fiordland. Department of Conservation Te Anau Area Office, PO Box 29, Te Anau 9640, New Zealand.
Wills DE, Murray J, Powlesland RG 2003. Impact of management on the breeding success of the northern New Zealand dotterel (Charadrius obscurus aquilonius) on Matakana Island, Bay of Plenty. Notornis 50: 1–10.
Wilson K-J 2004. Flight of the huia: ecology and conservation of New Zealand’s frogs, reptiles, birds and mammals. Christchurch, Canterbury University Press. 411 p.
Wodzicki KA, Bull PC 1951. The small mammals of the Caswell and George Sounds area. In: Poole AL comp. Preliminary reports of the New Zealand - American Fiordland Expedition: investigations in Fiordland, New Zealand, in 1949. DSIR Bulletin 103. Wellington, Government Printer. Pp. 62–69.
Worthy TH, Holdaway RN 2002. The lost world of the moa: prehistoric life of New Zealand. Christchurch, University of Canterbury Press. 718 p.
Editorial Board member: Jason TylianakisReceived 20 May 2011; accepted 10 October 2011
46 New Zealand Journal of Ecology, Vol. 36, No. 1, 2012
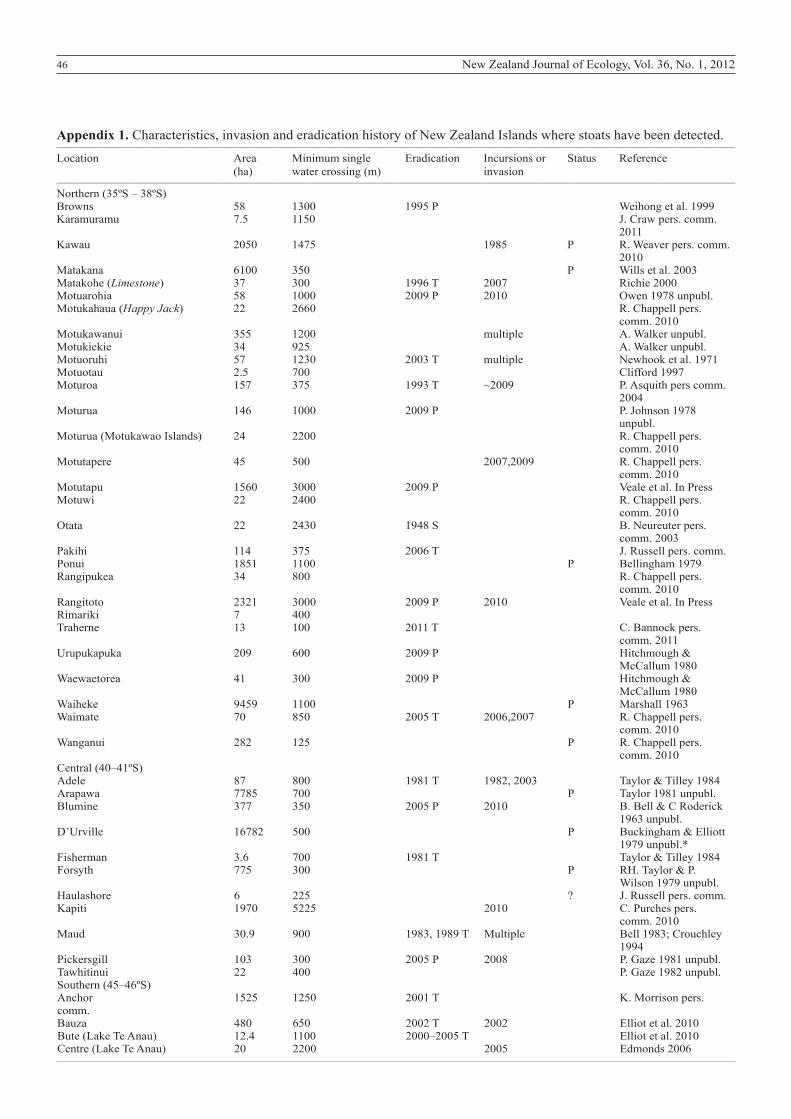
Appendix 1. Characteristics, invasion and eradication history of New Zealand Islands where stoats have been detected.__________________________________________________________________________________________________________________________________________________________________
Location Area Minimum single Eradication Incursions or Status Reference (ha) water crossing (m) invasion__________________________________________________________________________________________________________________________________________________________________
Northern (35ºS – 38ºS) Browns 58 1300 1995 P Weihong et al. 1999Karamuramu 7.5 1150 J. Craw pers. comm. 2011Kawau 2050 1475 1985 P R. Weaver pers. comm. 2010Matakana 6100 350 P Wills et al. 2003Matakohe (Limestone) 37 300 1996 T 2007 Richie 2000Motuarohia 58 1000 2009 P 2010 Owen 1978 unpubl.Motukahaua (Happy Jack) 22 2660 R. Chappell pers. comm. 2010Motukawanui 355 1200 multiple A. Walker unpubl.Motukiekie 34 925 A. Walker unpubl.Motuoruhi 57 1230 2003 T multiple Newhook et al. 1971Motuotau 2.5 700 Clifford 1997Moturoa 157 375 1993 T ~2009 P. Asquith pers comm. 2004Moturua 146 1000 2009 P P. Johnson 1978 unpubl.Moturua (Motukawao Islands) 24 2200 R. Chappell pers. comm. 2010Motutapere 45 500 2007,2009 R. Chappell pers. comm. 2010Motutapu 1560 3000 2009 P Veale et al. In PressMotuwi 22 2400 R. Chappell pers. comm. 2010Otata 22 2430 1948 S B. Neureuter pers. comm. 2003Pakihi 114 375 2006 T J. Russell pers. comm.Ponui 1851 1100 P Bellingham 1979Rangipukea 34 800 R. Chappell pers. comm. 2010Rangitoto 2321 3000 2009 P 2010 Veale et al. In PressRimariki 7 400 Traherne 13 100 2011 T C. Bannock pers. comm. 2011Urupukapuka 209 600 2009 P Hitchmough & McCallum 1980Waewaetorea 41 300 2009 P Hitchmough & McCallum 1980Waiheke 9459 1100 P Marshall 1963Waimate 70 850 2005 T 2006,2007 R. Chappell pers. comm. 2010Wanganui 282 125 P R. Chappell pers. comm. 2010Central (40–41ºS) Adele 87 800 1981 T 1982, 2003 Taylor & Tilley 1984Arapawa 7785 700 P Taylor 1981 unpubl.Blumine 377 350 2005 P 2010 B. Bell & C Roderick 1963 unpubl.D’Urville 16782 500 P Buckingham & Elliott 1979 unpubl.*Fisherman 3.6 700 1981 T Taylor & Tilley 1984Forsyth 775 300 P RH. Taylor & P. Wilson 1979 unpubl.Haulashore 6 225 ? J. Russell pers. comm.Kapiti 1970 5225 2010 C. Purches pers. comm. 2010Maud 30.9 900 1983, 1989 T Multiple Bell 1983; Crouchley 1994Pickersgill 103 300 2005 P 2008 P. Gaze 1981 unpubl.Tawhitinui 22 400 P. Gaze 1982 unpubl.Southern (45–46ºS) Anchor 1525 1250 2001 T K. Morrison pers. comm.Bauza 480 650 2002 T 2002 Elliot et al. 2010Bute (Lake Te Anau) 12.4 1100 2000–2005 T Elliot et al. 2010Centre (Lake Te Anau) 20 2200 2005 Edmonds 2006
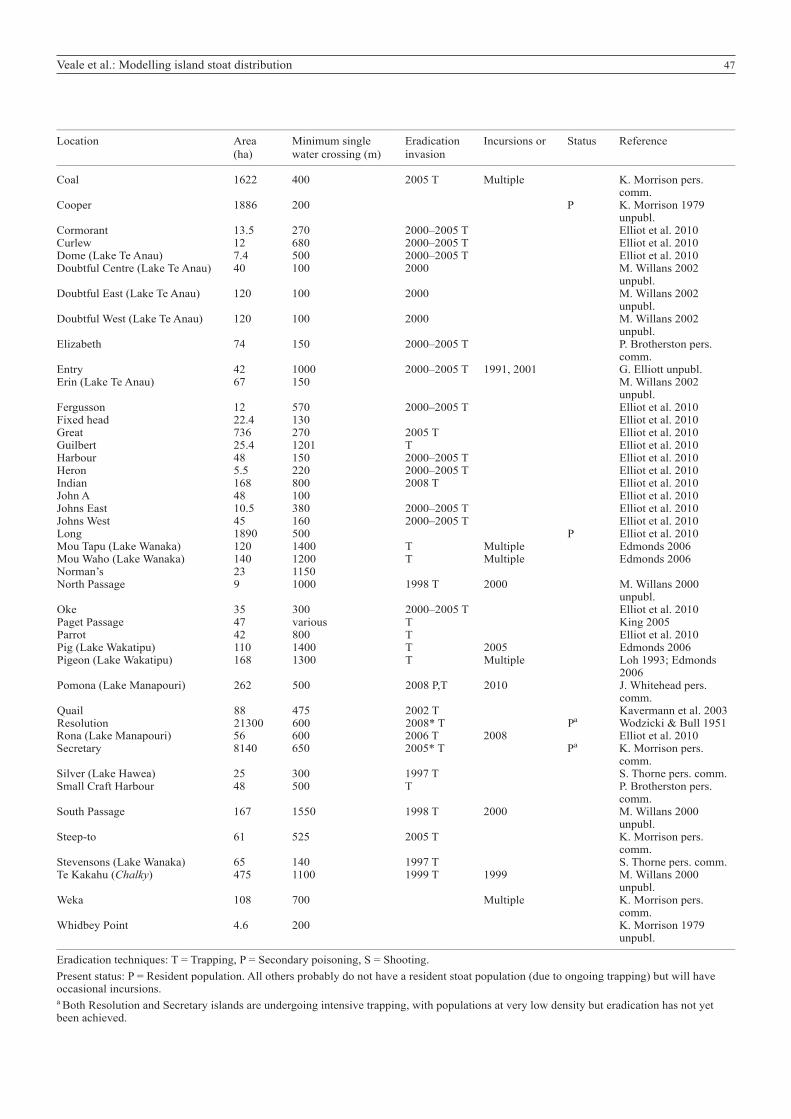
47Veale et al.: Modelling island stoat distribution
__________________________________________________________________________________________________________________________________________________________________
Location Area Minimum single Eradication Incursions or Status Reference (ha) water crossing (m) invasion__________________________________________________________________________________________________________________________________________________________________
Coal 1622 400 2005 T Multiple K. Morrison pers. comm.Cooper 1886 200 P K. Morrison 1979 unpubl.Cormorant 13.5 270 2000–2005 T Elliot et al. 2010Curlew 12 680 2000–2005 T Elliot et al. 2010Dome (Lake Te Anau) 7.4 500 2000–2005 T Elliot et al. 2010Doubtful Centre (Lake Te Anau) 40 100 2000 M. Willans 2002 unpubl.Doubtful East (Lake Te Anau) 120 100 2000 M. Willans 2002 unpubl.Doubtful West (Lake Te Anau) 120 100 2000 M. Willans 2002 unpubl.Elizabeth 74 150 2000–2005 T P. Brotherston pers. comm.Entry 42 1000 2000–2005 T 1991, 2001 G. Elliott unpubl.Erin (Lake Te Anau) 67 150 M. Willans 2002 unpubl.Fergusson 12 570 2000–2005 T Elliot et al. 2010Fixed head 22.4 130 Elliot et al. 2010Great 736 270 2005 T Elliot et al. 2010Guilbert 25.4 1201 T Elliot et al. 2010Harbour 48 150 2000–2005 T Elliot et al. 2010Heron 5.5 220 2000–2005 T Elliot et al. 2010Indian 168 800 2008 T Elliot et al. 2010John A 48 100 Elliot et al. 2010Johns East 10.5 380 2000–2005 T Elliot et al. 2010Johns West 45 160 2000–2005 T Elliot et al. 2010Long 1890 500 P Elliot et al. 2010Mou Tapu (Lake Wanaka) 120 1400 T Multiple Edmonds 2006 Mou Waho (Lake Wanaka) 140 1200 T Multiple Edmonds 2006 Norman’s 23 1150 North Passage 9 1000 1998 T 2000 M. Willans 2000 unpubl.Oke 35 300 2000–2005 T Elliot et al. 2010Paget Passage 47 various T King 2005Parrot 42 800 T Elliot et al. 2010Pig (Lake Wakatipu) 110 1400 T 2005 Edmonds 2006 Pigeon (Lake Wakatipu) 168 1300 T Multiple Loh 1993; Edmonds 2006 Pomona (Lake Manapouri) 262 500 2008 P,T 2010 J. Whitehead pers. comm.Quail 88 475 2002 T Kavermann et al. 2003Resolution 21300 600 2008* T Pa Wodzicki & Bull 1951Rona (Lake Manapouri) 56 600 2006 T 2008 Elliot et al. 2010Secretary 8140 650 2005* T Pa K. Morrison pers. comm.Silver (Lake Hawea) 25 300 1997 T S. Thorne pers. comm.Small Craft Harbour 48 500 T P. Brotherston pers. comm.South Passage 167 1550 1998 T 2000 M. Willans 2000 unpubl.Steep-to 61 525 2005 T K. Morrison pers. comm.Stevensons (Lake Wanaka) 65 140 1997 T S. Thorne pers. comm.Te Kakahu (Chalky) 475 1100 1999 T 1999 M. Willans 2000 unpubl.Weka 108 700 Multiple K. Morrison pers. comm.Whidbey Point 4.6 200 K. Morrison 1979 unpubl.__________________________________________________________________________________________________________________________________________________________________
Eradication techniques: T = Trapping, P = Secondary poisoning, S = Shooting.Present status: P = Resident population. All others probably do not have a resident stoat population (due to ongoing trapping) but will have occasional incursions.a Both Resolution and Secretary islands are undergoing intensive trapping, with populations at very low density but eradication has not yet been achieved.
Related Documents