Modelling the distribution of domestic ducks in Monsoon Asia Thomas P Van Boeckel 1,2 , Diann Prosser 3 , Gianluca Franceschini 4 , Chandra Biradar 5 , William Wint 6 , Tim Robinson 4 , and Marius Gilbert 1,2 1 Biological Control and Spatial Ecology, Université Libre de Bruxelles CP160/12, Av FD Roosevelt 50, B1050, Brussels, Belgium 2 Fonds National de la Recherche Scientifique, rue d’Egmont 5, B-1000 Brussels, Belgium 3 USGS Patuxent Wildlife Research Center, Baltimore Avenue 10300, MD 20705 Beltsville, and University of Maryland, College Park, USA 4 Food and Agriculture Organization of the United Nations (FAO), Viale delle Terme di Caracalla 00153, Rome, Italy 5 Department of Botany and Microbiology, Center for Spatial Analysis, University of Oklahoma, Norman, Oklahoma, 73019 USA 6 Environmental Research Group Oxford, P.O. Box 346, Oxford OX1 3QE, United Kingdom Abstract Domestic ducks are considered to be an important reservoir of highly pathogenic avian influenza (HPAI), as shown by a number of geospatial studies in which they have been identified as a significant risk factor associated with disease presence. Despite their importance in HPAI epidemiology, their large-scale distribution in monsoon Asia is poorly understood. In this study, we created a spatial database of domestic duck census data in Asia and used it to train statistical distribution models for domestic duck distributions at a spatial resolution of 1 km. The method was based on a modelling framework used by the Food and Agriculture Organisation to produce the Gridded Livestock of the World (GLW) database, and relies on stratified regression models between domestic duck densities and a set of agro-ecological explanatory variables. We evaluated different ways of stratifying the analysis and of combining the prediction to optimize the goodness of fit of the predictions. We found that domestic duck density could be predicted with reasonable accuracy (mean RMSE and correlation coefficient between log-transformed observed and predicted densities being 0.58 and 0.80, respectively), using a stratification based on livestock production systems. We tested the use of artificially degraded data on duck distributions in Thailand and Vietnam as training data, and compared the modelled outputs with the original high- resolution data. This showed, for these two countries at least, that these approaches could be used to accurately disaggregate provincial level (administrative level 1) statistical data to provide high resolution model distributions. © 2011 Elsevier B.V. All rights reserved. Corresponding author: Marius Gilbert, Biological Control and Spatial Ecology, Université Libre de Bruxelles CP160/12, Av FD Roosevelt 50, B1050, Brussels, Belgium, Tel +32 2 650 37 80, Fax + 32 2 650 24 45, [email protected]. Publisher's Disclaimer: This is a PDF file of an unedited manuscript that has been accepted for publication. As a service to our customers we are providing this early version of the manuscript. The manuscript will undergo copyediting, typesetting, and review of the resulting proof before it is published in its final citable form. Please note that during the production process errors may be discovered which could affect the content, and all legal disclaimers that apply to the journal pertain. NIH Public Access Author Manuscript Agric Ecosyst Environ. Author manuscript; available in PMC 2012 May 1. Published in final edited form as: Agric Ecosyst Environ. 2011 May 1; 141(3-4): 373–380. doi:10.1016/j.agee.2011.04.013. NIH-PA Author Manuscript NIH-PA Author Manuscript NIH-PA Author Manuscript

Welcome message from author
This document is posted to help you gain knowledge. Please leave a comment to let me know what you think about it! Share it to your friends and learn new things together.
Transcript

Modelling the distribution of domestic ducks in Monsoon Asia
Thomas P Van Boeckel1,2, Diann Prosser3, Gianluca Franceschini4, Chandra Biradar5,William Wint6, Tim Robinson4, and Marius Gilbert1,2
1 Biological Control and Spatial Ecology, Université Libre de Bruxelles CP160/12, Av FDRoosevelt 50, B1050, Brussels, Belgium2 Fonds National de la Recherche Scientifique, rue d’Egmont 5, B-1000 Brussels, Belgium3 USGS Patuxent Wildlife Research Center, Baltimore Avenue 10300, MD 20705 Beltsville, andUniversity of Maryland, College Park, USA4 Food and Agriculture Organization of the United Nations (FAO), Viale delle Terme di Caracalla00153, Rome, Italy5 Department of Botany and Microbiology, Center for Spatial Analysis, University of Oklahoma,Norman, Oklahoma, 73019 USA6 Environmental Research Group Oxford, P.O. Box 346, Oxford OX1 3QE, United Kingdom
AbstractDomestic ducks are considered to be an important reservoir of highly pathogenic avian influenza(HPAI), as shown by a number of geospatial studies in which they have been identified as asignificant risk factor associated with disease presence. Despite their importance in HPAIepidemiology, their large-scale distribution in monsoon Asia is poorly understood. In this study,we created a spatial database of domestic duck census data in Asia and used it to train statisticaldistribution models for domestic duck distributions at a spatial resolution of 1 km. The methodwas based on a modelling framework used by the Food and Agriculture Organisation to producethe Gridded Livestock of the World (GLW) database, and relies on stratified regression modelsbetween domestic duck densities and a set of agro-ecological explanatory variables. We evaluateddifferent ways of stratifying the analysis and of combining the prediction to optimize the goodnessof fit of the predictions. We found that domestic duck density could be predicted with reasonableaccuracy (mean RMSE and correlation coefficient between log-transformed observed andpredicted densities being 0.58 and 0.80, respectively), using a stratification based on livestockproduction systems. We tested the use of artificially degraded data on duck distributions inThailand and Vietnam as training data, and compared the modelled outputs with the original high-resolution data. This showed, for these two countries at least, that these approaches could be usedto accurately disaggregate provincial level (administrative level 1) statistical data to provide highresolution model distributions.
© 2011 Elsevier B.V. All rights reserved.Corresponding author: Marius Gilbert, Biological Control and Spatial Ecology, Université Libre de Bruxelles CP160/12, Av FDRoosevelt 50, B1050, Brussels, Belgium, Tel +32 2 650 37 80, Fax + 32 2 650 24 45, [email protected]'s Disclaimer: This is a PDF file of an unedited manuscript that has been accepted for publication. As a service to ourcustomers we are providing this early version of the manuscript. The manuscript will undergo copyediting, typesetting, and review ofthe resulting proof before it is published in its final citable form. Please note that during the production process errors may bediscovered which could affect the content, and all legal disclaimers that apply to the journal pertain.
NIH Public AccessAuthor ManuscriptAgric Ecosyst Environ. Author manuscript; available in PMC 2012 May 1.
Published in final edited form as:Agric Ecosyst Environ. 2011 May 1; 141(3-4): 373–380. doi:10.1016/j.agee.2011.04.013.
NIH
-PA Author Manuscript
NIH
-PA Author Manuscript
NIH
-PA Author Manuscript
KeywordsLivestock Mapping; Domestic ducks; Monsoon Asia; Regression models; Highly pathogenicavian influenza
1. IntroductionMaps of livestock distribution are a concise way to visualize and analyze large censusdatasets. They have a wide variety of applications such as assessing the risk of zoonoticdisease, food safety management, determination of the potential daily protein productioncapacity, monitoring of the land-use changes, assessment of the environmental riskassociated with animal production (Wint and Robinson, 2007).
The Highly Pathogenic Avian Influenza (HPAI) H5N1 virus that first appeared in southernChina in the late 1990’s (Li et al., 2004) is one of the most significant recent epizooticswhich has had dramatic consequences on smallholders’ livelihoods and poultry productionin many countries (Brown, 2010). To date, the human death toll of these events remainsmoderate despite the very high mortality rates observed in wild and domestic fowl (WorldHealth Organization, October 2010: 507 cases reported, 302 deaths confirmed).
Domestic ducks play a significant role in the epidemiology of HPAI H5N1 virus. First,experimental studies have demonstrated that they can be apparently healthy carriers of theHPAI H5N1 virus and have even been referred to as the “Trojan horse of the avian flu”(Kim et al., 2009). Domestic ducks have been shown to survive HPAI H5N1 virus infectionsand excrete large quantities of the virus without showing clinical signs of disease (Hulse-Post et al., 2005). As a result, domestic ducks may play a determinant role in thetransmission of the virus during the movement of flocks between different feeding locations.Studies have shown that the distribution of HPAI H5N1 virus in parts of Asia is heavilyinfluenced by the distribution of duck farming systems (Gilbert et al., 2007). Morespecifically, the density of ducks has been found to be a key variable for predicting of thepresence of HPAI H5N1 virus in Thailand (Gilbert et al., 2006), Vietnam (Pfeiffer et al.,2007), over the Mekong region (Gilbert et al., 2008), and even at the global scale(Hogerwerf et al., 2010).
However, despite the importance of ducks in HPAI H5N1 transmission, data on domesticduck populations derived from national censuses are often incomplete and vary considerablyin resolution between countries. Some countries such as Thailand and Vietnam that producelarge quantities of duck meat and eggs have undertaken massive survey campaigns (e.g. X-ray Survey in Thailand involving 400,000 inspectors) following the HPAI H5N1 virusepidemics of 2004 and have very high resolution data reported at administrative levels 3 and4 (e.g. Thailand: county and village level). In some other countries where HPAI H5N1 is ofconcern, however, data are available at best only at administrative levels 1 and or 2. Astriking example is China, which hosts more than 75% of the world’s domestic duckpopulation (FAOSTAT, 2010), yet species level duck data are available only at theprovincial level (administrative level 1). In the Chinese province of Xinjiang, for example,there is only one figure provided for the entire 600,000 square kilometres. At this timemodelers lack comprehensive and accurate information relative to the domestic duckpopulation density and location. Ideally such information could be modeled at fine spatialresolution by applying an appropriate disaggregation methodology to the existing data.Various disaggregation techniques have been explored and applied with relative success to awide range of livestock species (Wint and Robinson, 2007; Neumann et al., 2009; Gerber etal., 2005). To our knowledge, however, no previous attempts have focused on the
Van Boeckel et al. Page 2
Agric Ecosyst Environ. Author manuscript; available in PMC 2012 May 1.
NIH
-PA Author Manuscript
NIH
-PA Author Manuscript
NIH
-PA Author Manuscript

geographical distribution of domestic ducks specifically in Monsoon Asia, a region ofparticular concern for the persistence of HPAI H5N1 virus. In this study we present astatistical modelling procedure inspired by earlier efforts to map livestock distributions(Wint and Robinson, 2007) and specially adapted to the case of domestic ducks. Themethodology was applied to disaggregate reported domestic duck data to a 1 × 1 kmcontinuous population density surface across 14 countries.
The methodology relies on the use of agro-ecological predictors providing information onboth bioclimatic and anthropogenic factors which are assumed to affect the geographicaldistribution of duck farming. The central hypothesis is that robust statistical relationshipscan be established between domestic duck population density and these agro-environmentalpredictors, and that these relationships can be used to disaggregate the administrative leveldistribution of domestic duck data across Monsoon Asia.
2. Materials & MethodsWe aimed to obtain the most recent duck data at the finest possible administrative levelwithin Monsoon Asia. This required data to be compiled at different administrative levelsdepending on sources available. Table 1 provides details of the reported statistics used. Theabsolute numbers of ducks per reporting unit were converted into densities (birds km-2) bydividing the number of birds by the area of land considered suitable for duck production.This step was important to prevent densities from being underestimated in administrativeunits containing vast areas of land unsuitable for duck production (e.g. Xinjiang Province,China). The suitability mask for ducks was modified from the original GLW monogastriclivestock (pigs and poultry) mask (Wint and Robinson, 2007). We took a conservativeapproach in suitability masking by excluding only the most unsuitable areas for duckproduction (extreme high elevations, tundra, ice and deserts, for example, see Table S4 inProsser et al. this volume). The resulting dependent (y) variable data are referred to as‘training data’.
Two main groups of predictors were included. First, eco-climatic predictors derived fromFourier transformed MODIS Imagery (http://modis.gsfc.nasa.gov/) over the period 2001–2005 (Scharlemann et al., 2008) and second, anthropogenic variables.
The Global MODIS Imagery is a compilation of images of the surface of the earth takenevery 8 or 16 days for different channels of reflectance. These images are then compositedover a period of time to generate a time series for each channel. The different channels aresubject to atmospheric corrections and used in combination to define bioclimatic indicessuch as the Normalized Difference Vegetation Index (NDVI) or Land Surface Temperature(LST); variables that are expected to be of relevance in explaining the spatial distributions oflivestock species (Wint and Robinson 2007) and associated animal diseases (Hay et al.,2006; Sinka et al., 2010).
The Fast Fourier Transform (FFT) is a widespread ordination method used in ecology tosummarize the information contained in a time-series in a way that is directly subject tointerpretation (which is not always the case of other ordination methods such as the principalcomponent analysis). The resulting output of the FFT is an image with each pixel beingattributed the value the Fourier Coefficients (phase or amplitude) of the time series for thedifferent harmonics of the signal. In this study we used the values of the amplitude andphase of the first to third harmonic, describing respectively the amplitude and the delay ofthe annual, bi-annual and tri-annual biological cycles for the channels listed in Table 2.
Domestic livestock production is constrained by natural limitations such as food availability,temperature, aridity and access to water, which can be captured through statistical
Van Boeckel et al. Page 3
Agric Ecosyst Environ. Author manuscript; available in PMC 2012 May 1.
NIH
-PA Author Manuscript
NIH
-PA Author Manuscript
NIH
-PA Author Manuscript
relationships with the eco-climatic predictors. But production is also driven by humanactivities and related to factors such as population density, demand and access to productioninputs (feeds, services etc.) and output markets. As these factors are suspected to explain asubstantial share of the spatial variability of domestic duck distribution in specific areas, wealso used a set of anthropogenic predictor variables including human population density(Balk et al., 2006), distance to the nearest road (Dobson et al., 2000) and travel time tomajor cities (Nelson 2008; Table 2.)
The first step of the modelling procedure consisted of the spatial sampling of duck densitydata. However, because of the high heterogeneity in spatial resolution of the reportedtraining data from different countries, applying a sampling scheme of equal density was notideal. Applying a density related sampling scheme to take advantage of high resolutiontraining data in some countries would have resulted in a large proportion of data pointsbeing associated with the same, single duck density value reported within an administrativeunit. Conversely, using a low density of sampling points would not take full advantage ofthe higher resolution data available in other areas.
We therefore used a stratified sampling approach that included at least one point peradministrative unit with training data and, beyond that, an average of 20 points per decimaldegree across our analysis extent (Supplementary Information, Fig. S3). Twenty fiverandom sets of sample points were created in order to bootstrap the analysis - eachcontaining 75% of points used to train the statistical models (model set) and 25% for modelvalidation (test set).
A forward inclusion multiple regression approach was developed using log-transformedduck densities as the dependent variable (to normalize duck densities). This involved theiterative inclusion of each predictor, paired with its quadratic term to account for non-linearrelationships. Starting from a null-model, the algorithm searched for and included the pair ofpredictors that resulted in the best reduction in Akaike Information Criterion (AIC)(Burnham et Anderson, 2002; Whittingham et al., 2006). This process continued until theimprovement in AIC was less than 1% (Fig. 1). As a measure to prevent over-fitting, welimited the maximum number of pairs of predictors to one for every 15 sampling points fromdifferent administrative units. The coefficients of the model were then applied to theimagery to obtain the log-transformed predicted density of ducks for each pixel. A ceilingvalue 50% higher than the highest observed duck density in the census data was applied tothe predictions to remove any anomalous predictions.
The analysis was also stratified to allow for different quantitative relationships linking duckdensities to covariates in different agro-ecological systems. We considered two types ofstratification. The first was based on the distribution of livestock production systems (LPS)proposed by Seré and Steinfeld (1996) and mapped by Kruska et al. (2003). The second wasbased on 4 different levels of a data-driven ecozonation (EZ) comprising respectively 5, 12,25 and 50 clusters. Theses ecozones were obtained by an isodata unsupervised clustering ofTFA-processed MODIS channels for Middle Infra Red, day time Land Surface Temperature,night time Land Surface Temperature, Normalized Difference Vegetation Index, EnhancedVegetation Index and the Shuttle Radar Topography Mission (SRTM) digital elevationmodel (DEM). For each stratum within each stratification system (LPS, EZ5, EZ12, EZ25 &EZ50), a minimum of 15 points per variable pair with different duck densities were requiredto train a model. When this condition was not met, an unstratified regional model based onall points was used.
Wint and Robinson (2007) developed a method to combine predictions made under differentstratification schemes whereby the prediction from the stratification that resulted in a model
Van Boeckel et al. Page 4
Agric Ecosyst Environ. Author manuscript; available in PMC 2012 May 1.
NIH
-PA Author Manuscript
NIH
-PA Author Manuscript
NIH
-PA Author Manuscript

with the best R2 was selected for each pixel. We evaluated this method against alternativesand compared different ways of combining stratifications. Three combination methods werebased on the ecozone classifications at different levels (EZ5, EZ12, EZ25 and EZ50). In thefirst method (EZ.Finest), the algorithm selects for each pixel the value predicted by thefinest (most detailed) ecozonation. For example, if for a given pixel, a prediction wasavailable with EZ12 and EZ25 stratifications, but not EZ50 (because the EZ50 strata did nothave enough unique data points), the prediction of the EZ25 stratification would be selected.In the second and third combination methods; EZ.BestRSE and EZ.BestR2, predictions wereselected from the ecozone stratification scheme that resulted in a model with the lowestresidual squared error (RSE), or highest R2 value, respectively. Lastly, two methods used allstratifications (LPS, EZ5, EZ12, EZ25 and EZ50), and simply used for each pixel, theprediction from the stratification scheme which gave the lowest RSE (All.BestRSE) orhighest R2 (All.BestR2).
The goodness of fit of the resulting predictions were evaluated using the 25% of points thathad been withheld from the analyses, using two indices: the root mean squared difference(RMSE) and the correlation coefficient (COR) between the predicted and observed densities(in Log10-scale). Both RMSE and COR were estimated for each bootstrap. The meangeographical distribution of the predicted densities was obtained by averaging thedistributions predicted by each bootstrap, and the coefficient of variation of the predictionwas also estimated as an index of the variability in predictions. In order to standardize theresults to a single reference year the predicted values were adjusted such that the nationaltotals of ducks matched those provided by FAOSTAT for the year 2007 (FAOSTAT, 2010).RMSE and COR were compared for different stratification schemes, combination methodsand levels of detail in training data using one-way ANOVA followed by Tukey multiplecomparison tests.
A restricted set of analyses was carried out for Vietnam and Thailand, in order to assess thesensitivity of the mapping procedure to the resolution of the input data. Vietnam andThailand are the only countries where the reported duck data were fully available at the 3rd
administrative level. These high-resolution data were aggregated to administrative levels 2(district), 1 (province) and 0 (country) to produce artificially degraded training datasets fromwhich to derive regression models. In addition, we also evaluated a scenario in which nodata were available for Thailand and Vietnam so that predictions for these countries werebased on relationships established using data from other countries. For this specific set ofcomparisons, we used the LPS stratification system and predictions were evaluated againstthe original, high-resolution sub-district data (administrative level 3).
3. ResultsRMSE and correlation coefficient are illustrated in Fig. 2 for the five different stratificationsystems (LPS, EZ5, EZ12, EZ25 & EZ50) and five combination methods (EZ.Finest,EZ.BestRSE, EZ.BestR2, All.BestRSE, All.BestR2) tested in this study. The best goodnessof fit scores were produced by the LPS stratification scheme (RMSE = 0.58, correlationcoefficient = 0.80), and for the All.BestRSE combination method (RMSE = 0.57, correlationcoefficient = 0.81), each indicating good agreement between observed and predicted values.No significant difference was observed between the LPS stratification and Best RSEcombination method (Post-Hoc Tukey adj. p = 0.473), thus we chose the LPS system for thesensitivity analysis carried out on Vietnam and Thailand.
Figure 3 presents the map of observed duck density (top), the mean predicted density(middle) and it’s coefficient of variation (bottom) of the All.BestRSE method. Thegeographical distribution of the modelled duck density values correspond with the regions
Van Boeckel et al. Page 5
Agric Ecosyst Environ. Author manuscript; available in PMC 2012 May 1.
NIH
-PA Author Manuscript
NIH
-PA Author Manuscript
NIH
-PA Author Manuscript

known to be the main duck production areas in Monsoon Asia, (Fig. 3. top). These includeBangladesh; the deltas of the Mekong, Red, Irrawaddy, and Chao Phraya rivers; the Chineseprovince of Sichuan; the South and East coasts of China; and the Island of Java in Indonesia.Finer scale displays are provided as Supplementary Information Figure S4. The variability inthe predictions quantified by the coefficient of variation of the predicted duck density (Fig 3,bottom) was moderate in the main duck production areas, and high in regions with lowabsolute duck densities, such as the western side of the Indian sub-continent, Nepal, Bhutan,the north-eastern deserts of China, Borneo Island, and the Ridge of Papua New Guinea.
The mean RMSE and correlation coefficients for each of the 14 countries included in thestudy are presented in Fig. 4. Bhutan, Malaysia, and South-Korea Republic show the highestvariability in predicted goodness of fit; while China, Indonesia, Thailand and Vietnam arecharacterized by a relatively low variability of the error. The lowest RMSE values wereobserved for Laos, Myanmar, and Cambodia. The outputs of the predictions made forVietnam and Thailand using various administrative levels of training data showed that thequality of output maps and the goodness of fit metrics were highly dependent on the level ofdetail in the training data (Figs. 5 & 6). The goodness of fit indices worsened withdecreasing spatial resolution of training data: the correlation coefficient increased from 0.30for administrative level 0 training data; through 0.64 and 0.69 for administrative levels 1 and2, respectively, up to 0.71 when administrative level 3 training data were used. As expected,the best result for the predicted duck density was obtained with the finest spatial resolutionof training data as illustrated in Fig. 6. This figure also highlights that relatively poorpredictions were obtained when only one density for the entire country was used (admin.Level 0 input data). In those circumstances, improved outputs were obtained by basing thepredictions only on sampling points from adjacent countries (NoData).
4. DiscussionThe main objective of this study was to assess different disaggregation techniques based onspatial correlations between domestic duck densities and agro-ecological covariates. Thebroad-scale pattern of the predictions matches that of the observed densities, and highlightsregions with favourable agro-ecological conditions for duck production. These include areaswhere flood plain agriculture is practiced and in low altitude areas such as the large plains ofthe South Asian river deltas, which are known to be major areas for extensive duckproduction. The high duck densities predicted in these regions are supported by the multiplerice cropping cycles that provide a sustained food source for duck production, as suggestedin previous studies (Gilbert et al., 2007). Ducks are also raised in relatively high densities inNorth-Eastern areas of China, where market accessibility and demand for duck meat arehigh. The goodness of fit metrics RMSE and COR obtained using the best-performingmethods (All.BestRSE and LPS stratification) indicate that spatial correlations between duckdensities and agro-ecological covariates can be used to predict duck densities withreasonably good accuracy (Correlation coefficients are respectively 0.76 and 0.75 forAll.BestRSE and LPS). The more detailed analyses carried out for Thailand and Vietnamdemonstrate that the methodology developed in this study can be used to disaggregateartificially degraded training data to predict the pattern of duck densities that would beobtained from lower spatial resolution training data. Whilst improved predictive accuracy isevident using higher resolution training data, the analysis showed that reasonabledisaggregation results were also obtainable using training data from administrative levels 1or 2 (coefficients of correlation are respectively 0.64 and 0.69; Fig 6). This result isparticularly useful because it suggests that good predictions can be obtained even incountries where data are only available at relatively low resolution. For example, we onlyhave administrative level 1 data for Myanmar; a country that was struck by the HPAI H5N1epidemic. A second interesting result of this analysis based on Thailand and Vietnam is that
Van Boeckel et al. Page 6
Agric Ecosyst Environ. Author manuscript; available in PMC 2012 May 1.
NIH
-PA Author Manuscript
NIH
-PA Author Manuscript
NIH
-PA Author Manuscript

when only one figure is available for the entire country (Admin. Level 0), it is advisable notto use it to train the model, rather to train the model using exclusively values fromneighbouring countries (NoData) (provided that sufficient data are available there). Thissuggests that the techniques can be used to fill gaps - predicting duck densities for countrieswhere we have little or no information - provided that the models can be trained usinghigher accuracy data from other regions sharing similar agro-ecological conditions. This islikely to be less reliable when data are missing for very large countries with a wide range ofecological conditions, and this indeed seems to be the case for China (see Prosser et al., thisissue). One should note that the high spatial resolution of the output (1 km) does notnecessarily reflects ground truth at the same resolution, because disaggregation was onlyevaluated at the administrative level 3. Finer-scale evaluation of the output could only beachieved by the collection of validation data at an equivalent scale of 1 km.
Model uncertainty varied spatially and in relation to observed duck density. Coefficients ofvariation (expressed as a proportion of the predicted value) (Fig 3. bottom) was lowest inregions with the highest duck densities, and higher in areas with low duck densities. Thisindicates that low densities of ducks in peripheral regions are more difficult to modelreliably, but also that the main duck breeding areas are predicted with relatively lowuncertainty. Isolated peaks in COV were mainly found in the western part of the Indian sub-continent, with extreme values located in Bhutan. The high model uncertainty may be due toextremely low densities in the reported data and the small statistical weight of the Bhutan’sspecific ecosystems in the overall dataset. Goodness of fit assessed by country showedsignificant variability between countries (Fig. 4). The variability in goodness of fit relates tothe quality if of the training data with countries like Thailand or Vietnam showing the lowestvariability in goodness of fit, both countries having the most detailed input data. One couldalso note that countries with low intensity of duck production such as Myanmar, Cambodiaor Laos had relatively good accuracy metrics.
One aim of this study was to explore ways by which model accuracy could be improvedthrough the use of different stratification schemes and different ways of combining theresults thereof. The LPS performed best among the stratification schemes evaluated in thisstudy. The areas of high domestic duck densities can be associated with either extensive(e.g. Irrawaddy Delta) or intensive farming practices (e.g. Chinese peri-urban breeding).Naturally, these differences can potentially be more easily captured by a livestock-orientedstratification system than by unsupervised, data driven stratification systems. The LPSclasses associated with the highest domestic duck densities were the mixed irrigated humidsystems (MIH), with mean densities of 223 birds km-2, followed by the mixed irrigatedtemperate systems (MIT), which averaged 200 birds km-2, and the Urban systems, with 131birds km-2. Considering the lack of biological interpretability of the combined stratificationAll.BestRSE method and its more complex implementation, the use of the LPS layer assingle stratification scheme for modelling domestic duck densities appears as the bestapproach. Nevertheless, in conditions where a thorough study has not demonstrated thevalue of a particular stratification system, for example modelling a different species, or inmultiple areas with different environmental conditions, the appropriateness of alternativestratification schemes and combination methods should be evaluated.
In this study we showed that an improved version of previously developed methodology forlivestock disaggregation (Wint and Robinson, 2007) could be applied successfully to modelthe distribution of domestic duck in Monsoon Asia. In the general framework developed forthis purpose we used various stratifications and combination strategies. Among these, theLivestock Production System layer originally produce by Seré and Steinfeld (1996) comesout to be an essential mapping tool when applied to domestic ducks: first because itgenerates the best results in terms of statistical goodness of fit, second because of the
Van Boeckel et al. Page 7
Agric Ecosyst Environ. Author manuscript; available in PMC 2012 May 1.
NIH
-PA Author Manuscript
NIH
-PA Author Manuscript
NIH
-PA Author Manuscript

easiness of interpretation it offers in term of farming practices. All maps produced in thisstudy are made available through the FAO Gridded Livestock of the World database.
AcknowledgmentsThis work was partly supported by the National Institutes of Health Fogarty International Center through the NSF/NIH Ecology of Infectious Diseases program (7R01TW007869-04).
ReferencesBalk DL, Deichmann U, Yetman G, Pozzi F, Hay SI, Nelson A. Determining global population
distribution: methods, applications and data. Adv Parasit. 2006; 62:119–156.Brown IH. Summary of Avian Influenza Activity in Europe, Asia, and Africa, 2006–2009. Avian Dis.
2010; 54(s1):187–193. [PubMed: 20521631]Burnham, KP.; Anderson, DR. Model Selection and Multimodel Inference: a Practical Information—
Theoretic Approach. Springer; New York: 2002.Dobson JE, Bright EA, Coleman PR, Durfee RC, Worley BA. LandScan: a global population database
for estimating populations at risk. Photogram Eng Rem S. 2000; 66(7):849–857.Gerber P, Chilonda P, Franceschini G, Menzi H. Geographical determinants and environmental
implications of livestock production intensification in Asia. Bioresource Technol. 2005; 96(2):263–276.
FAOSTAT. [Accessed April 2011] FAOSTAT Production Data. 2006. Available online at:http://faostat.fao.org/
Gilbert M, Chaitaweesub P, Parakamawongsa T, Premashthira S, Tiensin T, Kalpravidh W, Wagner H,Slingenbergh J. Free-grazing ducks and highly pathogenic avian influenza, Thailand. Emerg InfectDis. 2006; 12(2):227–234. [PubMed: 16494747]
Gilbert M, Xiao X, Chaitaweesub P, Kalpravidh W, Premashthira S, Boles S, Slingenbergh J. Avianinfluenza, domestic ducks and rice agriculture in Thailand. Agr Ecosyst Environ. 2007; 119(3–4):409–415. [PubMed: 18418464]
Gilbert M, Xiao X, Pfeiffer DU, Epprecht M, Boles S, Czarnecki C, Chaitaweesub P, Kalpravidh W,Minh PQ, Otte MJ, Martin V, Slingenbergh J. Mapping H5N1 highly pathogenic avian influenzarisk in Southeast Asia. P Natl Acad Sci USA. 2008; 105(12):4769–4774.
Hay SI, Tatem AJ, Graham AJ, Goetz SJ, Rogers DJ. Global environmental data for mappinginfectious disease distribution. Adv Parasit. 2006; 62:37–77.
Hogerwerf L, Wallace RG, Ottaviani D, Slingenbergh J, Prosser D, Bergmann L, Gilbert M.Persistence of Highly Pathogenic Avian Influenza H5N1 Virus Defined by Agro-EcologicalNiche. EcoHealth. 2010; 7(2):213–225. [PubMed: 20585972]
Hulse-Post DJ, Sturm-Ramirez KM, Humberd J, Seiler P, Govorkova EA, Krauss S, Scholtissek C,Puthavathana P, Buranathai C, Nguyen TD, Long HT, Naipospos TSP, Chen H, Ellis TM, GuanY, Peiris JSM, Webster RG. Role of domestic ducks in the propagation and biological evolution ofhighly pathogenic H5N1 influenza viruses in Asia. P Natl Acad Sci USA. 2005; 102(30):10682–10687.
Kim J, Negovetich NJ, Forrest HL, Webster RG. Ducks: The “Trojan Horses” of H5N1 influenza.Influenza Other Respi Viruses. 2009; 3(4):121–128. [PubMed: 19627369]
Kruska RL, Reid RS, Thornton PK, Henninger N, Kristjanson PM. Mapping livestock orientedagricultural production systems for the developing world. Agr Syst. 2003; 77:39–63.
Li KS, Guan Y, Wang J, Smith GJD, Xu KM, Duan L, Rahardjo AP, Puthavathana P, Buranathai C,Nguyen TD, Estoepangestie ATS, Chaisingh A, Auewarakul P, Long HT, Hanh NTH, Webby RJ,Poon LLM, Chen H, Shortridge KF, Yuen KY, Webster RG, Peiris JSM. Genesis of a highlypathogenic and potentially pandemic H5N1 influenza virus in eastern Asia. Nature. 2004;430(6996):209–213. [PubMed: 15241415]
Nelson, A. Travel time to major cities: A global map of Accessibility. Office for Official Publicationsof the European Communities; Luxembourg: 2008.
Van Boeckel et al. Page 8
Agric Ecosyst Environ. Author manuscript; available in PMC 2012 May 1.
NIH
-PA Author Manuscript
NIH
-PA Author Manuscript
NIH
-PA Author Manuscript

Neumann K, Elbersen BS, Verburg PH, Staritsky I, Pérez-Soba M, Vries W, Rienks WA. Modellingthe spatial distribution of livestock in Europe. Landscape Ecol. 2009; 24(9):1207–1222.
Pfeiffer DU, Minh PQ, Martin V, Epprecht M, Otte MJ. An analysis of the spatial and temporalpatterns of highly pathogenic avian influenza occurrence in Vietnam using national surveillancedata. Vet J. 2007; 174(2):302–309. [PubMed: 17604193]
Seré, C.; Steinfeld, H.; Groenewold, J. World livestock production systems: current status, issues andtrends. International Livestock Research Institute; Nairobi: 1995.
Scharlemann JPW, Benz D, Hay SI, Purse BV, Tatem AJ, Wint GRW, Rogers DJ. Global Data forEcology and Epidemiology: A Novel Algorithm for Temporal Fourier Processing MODIS Data.PLoS ONE. 2008; 3(1):e1408. [PubMed: 18183289]
Sinka M, Rubio-Palis Y, Manguin S, Patil A, Temperley W, Gething P, Van Boeckel T, Kabaria C,Harbach R, Hay SI. The dominant Anopheles vectors of human malaria in the Americas:occurrence data, distribution maps and bionomic précis. Parasite Vector. 2010; 3(1):72.
Whittingham MJ, Stephens PA, Bradbury RB, Freckleton RP. Why do we still use stepwise modellingin ecology and behaviour? J Anim Ecol. 2006; 75(5):1182–1189. [PubMed: 16922854]
World Health Organization. [Accessed April 2011] Global Alert and Response. Available online at:http://www.who.int/csr/disease/avian_influenza/country/en/
Wint, W.; Robinson, T. Gridded Livestock of the World. Food and Agricultural Organisation; Rome:2007.
Van Boeckel et al. Page 9
Agric Ecosyst Environ. Author manuscript; available in PMC 2012 May 1.
NIH
-PA Author Manuscript
NIH
-PA Author Manuscript
NIH
-PA Author Manuscript
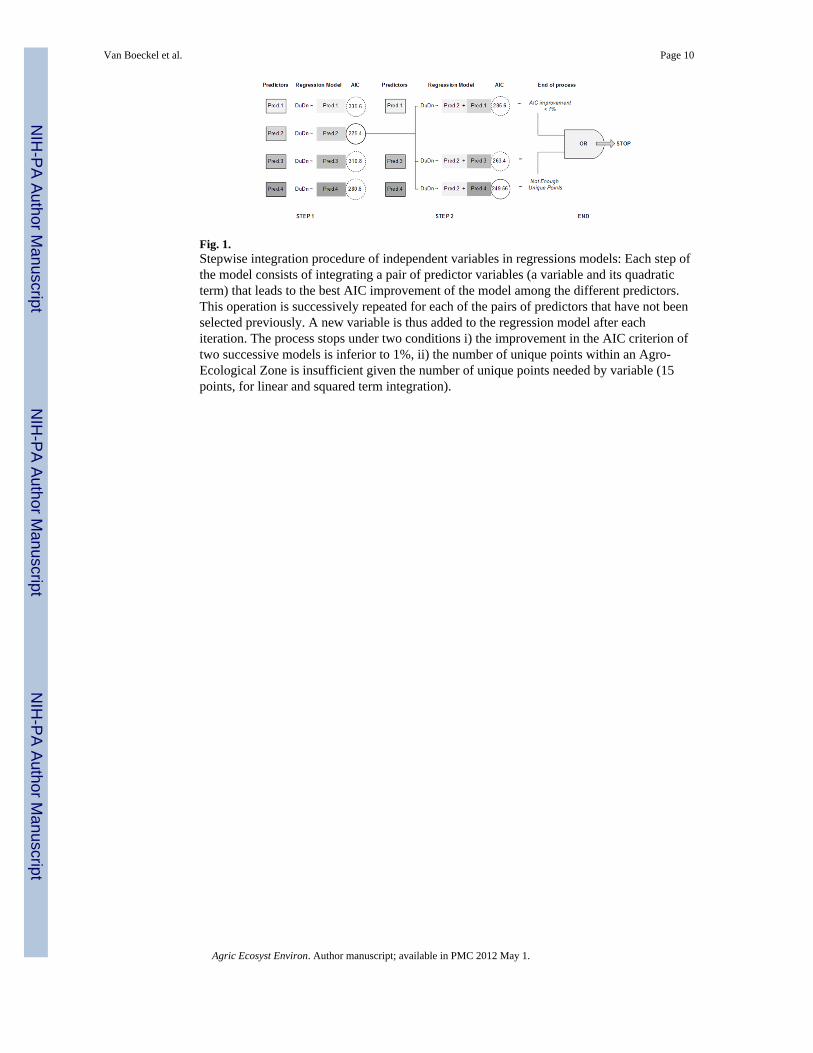
Fig. 1.Stepwise integration procedure of independent variables in regressions models: Each step ofthe model consists of integrating a pair of predictor variables (a variable and its quadraticterm) that leads to the best AIC improvement of the model among the different predictors.This operation is successively repeated for each of the pairs of predictors that have not beenselected previously. A new variable is thus added to the regression model after eachiteration. The process stops under two conditions i) the improvement in the AIC criterion oftwo successive models is inferior to 1%, ii) the number of unique points within an Agro-Ecological Zone is insufficient given the number of unique points needed by variable (15points, for linear and squared term integration).
Van Boeckel et al. Page 10
Agric Ecosyst Environ. Author manuscript; available in PMC 2012 May 1.
NIH
-PA Author Manuscript
NIH
-PA Author Manuscript
NIH
-PA Author Manuscript

Fig. 2.RMSE and correlation coefficients obtained with different stratifications (top left and right)and with the different methods for combining their predictions (bottom left and right).Different letters denote significantly different means at the p = 0.05 level (One-wayANOVA; RMSE: F10,264 = 308.8, p < 0.001; COR: F10,264 = 213.71, p < 0.001).
Van Boeckel et al. Page 11
Agric Ecosyst Environ. Author manuscript; available in PMC 2012 May 1.
NIH
-PA Author Manuscript
NIH
-PA Author Manuscript
NIH
-PA Author Manuscript

Fig. 3.Maps of observed duck density in data pooled from national statistics (top), predicted valuesusing the Livestock Production Systems as stratification layer (middle), and variability ofthe predictions expressed as coefficient of variation (bottom)
Van Boeckel et al. Page 12
Agric Ecosyst Environ. Author manuscript; available in PMC 2012 May 1.
NIH
-PA Author Manuscript
NIH
-PA Author Manuscript
NIH
-PA Author Manuscript

Fig. 4.RMSE and coefficient of correlation of predictions vs. observed data grouped by countryusing the Livestock Production Systems as stratification layer.
Van Boeckel et al. Page 13
Agric Ecosyst Environ. Author manuscript; available in PMC 2012 May 1.
NIH
-PA Author Manuscript
NIH
-PA Author Manuscript
NIH
-PA Author Manuscript
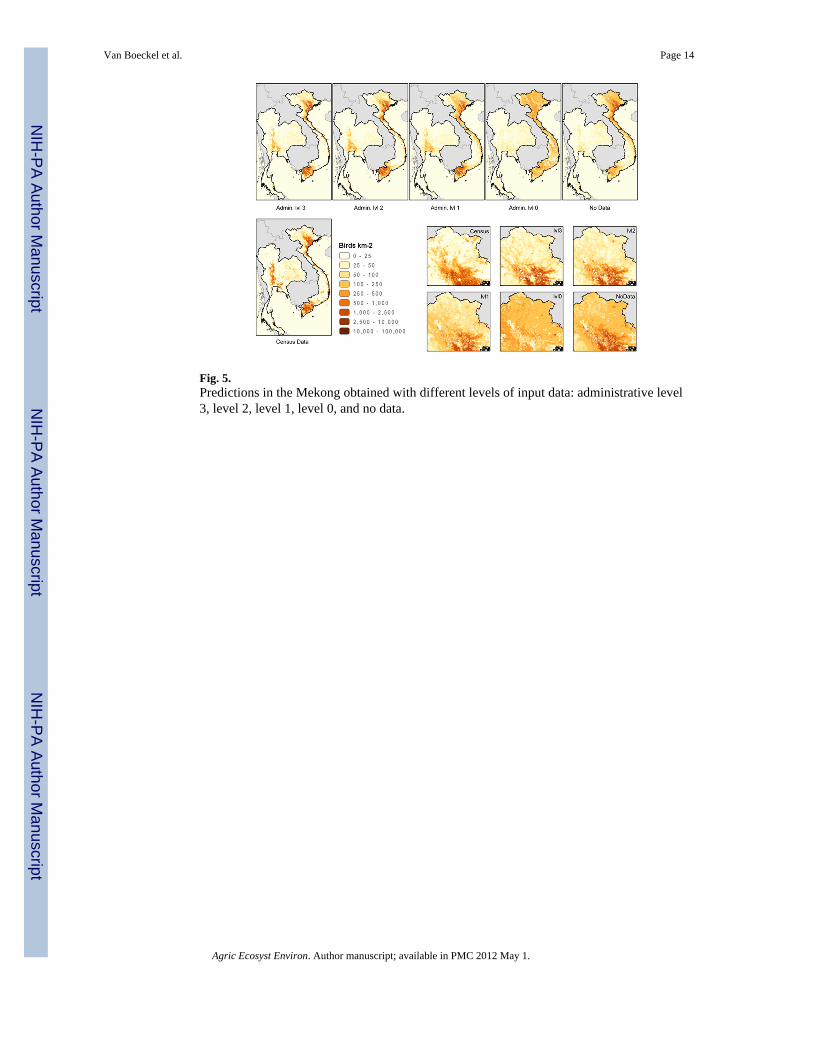
Fig. 5.Predictions in the Mekong obtained with different levels of input data: administrative level3, level 2, level 1, level 0, and no data.
Van Boeckel et al. Page 14
Agric Ecosyst Environ. Author manuscript; available in PMC 2012 May 1.
NIH
-PA Author Manuscript
NIH
-PA Author Manuscript
NIH
-PA Author Manuscript

Fig. 6.RMSE and Correlation coefficient in the Mekong, by administrative level of training data.
Van Boeckel et al. Page 15
Agric Ecosyst Environ. Author manuscript; available in PMC 2012 May 1.
NIH
-PA Author Manuscript
NIH
-PA Author Manuscript
NIH
-PA Author Manuscript

NIH
-PA Author Manuscript
NIH
-PA Author Manuscript
NIH
-PA Author Manuscript
Van Boeckel et al. Page 16
Tabl
e 1
Orig
inal
dat
a so
urce
and
reso
lutio
n fo
r dom
estic
duc
k po
pula
tion
dens
ity
Cou
ntry
Dat
eA
dmin
. Lev
elO
rigi
nal S
ourc
e
Chi
na20
05H
YB
RID
1–3
Ani
mal
hus
band
ry y
earb
ook
data
for C
hine
se p
rovi
nce
Cam
bodi
a20
021
Dep
artm
ent o
f Ani
mal
Hea
lth a
nd P
rote
ctio
n 20
03 C
ensu
s
Bhu
tan
-1
But
han
Min
istry
of A
gric
ultu
re
Thaï
land
2004
3D
epar
tmen
t of L
ives
tock
Dev
elop
men
t
Lao
1999
1M
inis
try o
f Agr
icul
ture
and
For
estry
Vie
tnam
2001
320
01 A
gric
ultu
ral C
ensu
s Dat
abas
e, M
inis
try o
f Agr
icul
ture
Mya
nmar
2006
2M
yanm
ar A
nim
al C
ensu
s
Ban
glad
esh
-3
Ban
glad
esh
Dep
artm
ent o
f Liv
esto
ck S
ervi
ces
Indi
a20
032
2003
Agr
icul
tura
l Cen
sus
Nep
al-
3D
epar
tmen
t of L
ives
tock
Ser
vice
s
Kor
ea20
041
Min
istry
of A
gric
ultu
re a
nd F
ores
try
Mal
aysi
a20
041
Dep
artm
ent o
f Vet
erin
ary
Serv
ices
Phili
ppin
es20
022
Phili
ppin
es 2
002
Agr
icul
tura
l Cen
sus
Indo
nesi
a20
05H
YB
RID
1–2
Stat
istik
Pet
erna
kan
2006
Agric Ecosyst Environ. Author manuscript; available in PMC 2012 May 1.

NIH
-PA Author Manuscript
NIH
-PA Author Manuscript
NIH
-PA Author Manuscript
Van Boeckel et al. Page 17
Tabl
e 2
Pred
icto
rs v
aria
bles
use
d in
the
step
wis
e m
ultip
le re
gres
sion
mod
elin
g pr
oced
ure
MO
DIS
Imag
ery
MO
DIS
Cha
nnel
sTF
A P
roce
ssed
Cha
nnel
s 03,
07,0
8,14
,15,
35: m
x, m
n, d
1, d
2, d
3, d
a, a
1, a
2, a
3, p
1, p
2, p
3, p
rodu
ced
by S
EEG
, Uni
vers
ity o
f Oxf
ord
Cov
aria
tes
CO
NT
INE
NT
AL
TIL
ES
OF
MO
DE
LL
ING
CO
VA
RIA
TE
S
1kgr
umpd
ens
Alp
ha v
ersi
on k
ilom
eter
reso
lutio
n hu
man
pop
ulat
ion
dens
ity fo
r 200
0 fr
om G
PW G
RU
MP,
at C
olum
bia
Uni
vers
ity
1kgr
umpd
ensb
Bet
a ve
rsio
n ki
lom
eter
reso
lutio
n hu
man
pop
ulat
ion
dens
ity fo
r 200
0 fr
om G
PW G
RU
MP
at C
olum
bia
Uni
vers
ity
gree
n030
1c1r
cM
OD
IS P
heno
logy
dat
aset
s, G
reen
up b
and
1, Ja
nuar
y 20
03, B
osto
n U
nive
rsity
, Dep
t Geo
grap
hy (s
ee te
xt)
gree
n030
1c2r
cM
OD
IS P
heno
logy
dat
aset
s, G
reen
up b
and
2, Ja
nuar
y 20
03, B
osto
n U
nive
rsity
, Dep
t Geo
grap
hy (s
ee te
xt)
sene
s030
1c1r
cM
OD
IS P
heno
logy
dat
aset
s, Se
nesc
ence
ban
d 1,
Janu
ary
2003
, Bos
ton
Uni
vers
ity, D
ept G
eogr
aphy
(see
text
)
wd1
kslp
Slop
e, G
TOPO
30 d
atas
et
1kag
lgpr
cLe
ngth
of G
row
ing
Perio
d, D
eriv
ed fr
om F
AO
LG
P la
yers
usi
ng st
atis
tical
mod
elin
g by
ER
GO
1kth
lgpr
cLe
ngth
of G
row
ing
Perio
d, D
eriv
ed fr
om L
GP
laye
rs p
rodu
ced
by T
horn
ton,
usi
ng st
atis
tical
mod
elin
g by
ER
GO
rmsu
itdeg
Dis
tanc
e in
Dec
imal
Deg
rees
to la
nd su
itabl
e fo
r Rum
inan
ts, d
eriv
ed b
y ER
GO
mgs
uitd
egD
ista
nce
in D
ecim
al D
egre
es to
land
suita
ble
for M
onog
astri
cs, d
eriv
ed b
y ER
GO
1krd
sdeg
Dis
tanc
e in
Dec
imal
Deg
rees
to M
ajor
Roa
ds -
usin
g La
ndsc
an R
oads
laye
r, de
rived
by
ERG
O
1kw
atde
gD
ista
nce
in D
ecim
al D
egre
es to
Sea
, Maj
or L
akes
and
Riv
ers,
Der
ived
by
ERG
O
glur
deg
Dis
tanc
e in
Dec
imal
Deg
rees
to G
RU
MP
alph
a ur
ban
area
s, D
eriv
ed b
y ER
GO
2kpr
ecyr
1kA
nnua
l Pre
cipi
tatio
n, sy
nopt
ic p
erio
d to
200
0, p
rodu
ced
by W
orld
clim
acc5
0kTr
avel
tim
e to
maj
or c
ities
(>50
.000
) Eur
opea
n C
omm
issi
on G
EM
V59
0ELC
MO
DIS
SR
TM E
leva
tion
prod
uct,
sea
leve
l cor
rect
ed
V59
0EL
MO
DIS
SR
TM E
leva
tion
prod
uct
Zon
emas
kZ
ON
ES
AN
D M
ASK
S FO
R M
OD
EL
LIN
G IM
PLE
ME
NT
AT
ION
1kar
eam
land
pix
el a
rea
in m
eter
s, Pr
oduc
ed b
y SD
RN
, FA
O
1km
gsui
tA
rea
Suita
ble
for m
onog
astri
cs
1kad
0cd
Cou
ntry
GA
UL
Adm
inis
trativ
e Le
vel Z
ero
code
s
Stra
tific
atio
n la
yers
AG
RO
-EC
OL
OG
ICA
L Z
ON
ES
FOR
MO
DE
LL
ING
ST
RA
TIF
ICA
TIO
N
3781
4151
4p1d
em50
Ecol
ogic
al Z
ones
, der
ived
by
unsu
perv
ised
cla
ssifi
catio
n by
ER
GO
from
MO
DIS
imag
ery
3781
4151
4p1d
em25
Ecol
ogic
al Z
ones
, der
ived
by
unsu
perv
ised
cla
ssifi
catio
n by
ER
GO
from
MO
DIS
imag
ery
Agric Ecosyst Environ. Author manuscript; available in PMC 2012 May 1.

NIH
-PA Author Manuscript
NIH
-PA Author Manuscript
NIH
-PA Author Manuscript
Van Boeckel et al. Page 18St
ratif
icat
ion
laye
rsA
GR
O-E
CO
LO
GIC
AL
ZO
NE
S FO
R M
OD
EL
LIN
G S
TR
AT
IFIC
AT
ION
3781
4151
4p1d
em12
Ecol
ogic
al Z
ones
, der
ived
by
unsu
perv
ised
cla
ssifi
catio
n by
ER
GO
from
MO
DIS
imag
ery
3781
4151
4p1d
em5
Ecol
ogic
al Z
ones
, der
ived
by
unsu
perv
ised
cla
ssifi
catio
n by
ER
GO
from
MO
DIS
imag
ery
Sand
SLi
vest
ock
Prod
uctio
n Sy
stem
s by
Seré
and
Ste
infe
ld
* GPW
GR
UM
P =
Grid
ded
Popu
latio
n of
the
Wor
ld G
loba
l Rur
al U
rban
Map
ping
Pro
ject
* ERG
O =
Env
ironm
enta
l Res
earc
h G
roup
, Oxf
ord
* SEEG
= S
patia
l Epi
dem
iolo
gy a
nd E
colo
gy G
roup
Agric Ecosyst Environ. Author manuscript; available in PMC 2012 May 1.
Related Documents