Optics 2020; 9(1): 1-7 http://www.sciencepublishinggroup.com/j/optics doi: 10.11648/j.optics.20200901.11 ISSN: 2328-7780 (Print); ISSN: 2328-7810 (Online) Modelling the Climate Change on Crop Estimation in the Semi-Arid Region of Pakistan Using Multispectral Remote Sensing Zeeshan Zafar 1 , Shoaib Farooq 2 , Muhammad Irfan Ahamad 1, * , Muhammad Sajid Mehmood 1 , Nasir Abbas 1 , Summar Abbas 3 1 College of Urban and Environmental Sciences, Northwest University, Xi’an, China 2 Institute of Geo-Information and Earth Observation, Pir Mehr Ali Shah Arid Agriculture University, Rawalpindi, Pakistan 3 Geological Survey of Pakistan (GSP), Quetta, Pakistan Email address: * Corresponding author To cite this article: Zeeshan Zafar, Shoaib Farooq, Muhammad Irfan Ahamad, Muhammad Sajid Mehmood, Nasir Abbas, Summar Abbas. Modelling the Climate Change on Crop Estimation in the Semi-Arid Region of Pakistan Using Multispectral Remote Sensing. Optics. Vol. 9, No. 1, 2020, pp. 1-7. doi: 10.11648/j.optics.20200901.11 Received: October 30, 2020; Accepted: November 23, 2020; Published: December 4, 2020 Abstract: Remote sensing (RS) is a tool in modern years for the monitoring of crops. Normalized Difference Vegetation Index (NDVI) derived from multi-temporal satellite imagery facilitates the analysis of vegetation growth stage, while comparing it with field/historical departmental yield data. Historical metrological data is also very useful in crop yield estimation especially in arid/semi-arid climatic zones. The metrological conditions including rainfall, humidity, sunshine, and temperature plays vital role in the growth and yield of crops; thus, the climatic conditions can adversely affect the crop yields if are not in accordance with growth requirement of a particular crop. Most of the agricultural land of Punjab province is in semi- arid climatic zone including Chakwal, Jhelum, Mianwali, Khushab, Sargodha, Mandi Bahauddin, Gujranwala, Hafizabad, Shiekhupura, Nankana Sahib, Lahore, Kasur, Faislabad and Chiniot districts. The study will investigate the impact of climate change on wheat crop yields of Chakwal district using advanced RS techniques from 1990 to 2015. Image classification to determine arable and non-arable lands; estimation of changes in temperature using thermal bands of satellite imagery, comparison of historical NDVI profiles; use of climatic data along with nonspatial departmental data for crop yield estimation and drawing its relationship with climatic variables. Keywords: Metrological Data, Remote Sensing, Crop Yield Estimation, Semi-arid, Chakwal 1. Introduction Increase in agricultural production improved annual income and has positive influence on food supply in the local market this contributes in agricultural sustainability by improving agricultural practice. Pakistan is basically an agricultural country, primarily economy of Pakistan depends upon agriculture although its economy has observed significant variations over the past few years. Agriculture is considered as one of the leading sectors contributing in country’s economy, 19.8% of the gross domestic product (GDP) came from agriculture and almost half of (42.5%) the rural population is associated with agriculture sector [1]. Over the past two decades, the population in Pakistan has increased exponentially, and, this rapid growth has caused two major problems among many others, that include increased demand for food, and decrease in land available for agriculture. Food production, both in terms of higher productivity and improved nutrient quality, has not kept pace with the needs of the expanding human population, leading to alarming levels of food insecurity. Extreme weather conditions, such as floods and droughts, associated with climate shifts across the globe are projected to cause even greater adverse effects on the food supply [2]. Wheat is the main agricultural product which is grown on

Welcome message from author
This document is posted to help you gain knowledge. Please leave a comment to let me know what you think about it! Share it to your friends and learn new things together.
Transcript

Optics 2020; 9(1): 1-7
http://www.sciencepublishinggroup.com/j/optics
doi: 10.11648/j.optics.20200901.11
ISSN: 2328-7780 (Print); ISSN: 2328-7810 (Online)
Modelling the Climate Change on Crop Estimation in the Semi-Arid Region of Pakistan Using Multispectral Remote Sensing
Zeeshan Zafar1, Shoaib Farooq
2, Muhammad Irfan Ahamad
1, *, Muhammad Sajid Mehmood
1,
Nasir Abbas1, Summar Abbas
3
1College of Urban and Environmental Sciences, Northwest University, Xi’an, China 2Institute of Geo-Information and Earth Observation, Pir Mehr Ali Shah Arid Agriculture University, Rawalpindi, Pakistan 3Geological Survey of Pakistan (GSP), Quetta, Pakistan
Email address:
*Corresponding author
To cite this article: Zeeshan Zafar, Shoaib Farooq, Muhammad Irfan Ahamad, Muhammad Sajid Mehmood, Nasir Abbas, Summar Abbas. Modelling the
Climate Change on Crop Estimation in the Semi-Arid Region of Pakistan Using Multispectral Remote Sensing. Optics.
Vol. 9, No. 1, 2020, pp. 1-7. doi: 10.11648/j.optics.20200901.11
Received: October 30, 2020; Accepted: November 23, 2020; Published: December 4, 2020
Abstract: Remote sensing (RS) is a tool in modern years for the monitoring of crops. Normalized Difference Vegetation
Index (NDVI) derived from multi-temporal satellite imagery facilitates the analysis of vegetation growth stage, while
comparing it with field/historical departmental yield data. Historical metrological data is also very useful in crop yield
estimation especially in arid/semi-arid climatic zones. The metrological conditions including rainfall, humidity, sunshine, and
temperature plays vital role in the growth and yield of crops; thus, the climatic conditions can adversely affect the crop yields if
are not in accordance with growth requirement of a particular crop. Most of the agricultural land of Punjab province is in semi-
arid climatic zone including Chakwal, Jhelum, Mianwali, Khushab, Sargodha, Mandi Bahauddin, Gujranwala, Hafizabad,
Shiekhupura, Nankana Sahib, Lahore, Kasur, Faislabad and Chiniot districts. The study will investigate the impact of climate
change on wheat crop yields of Chakwal district using advanced RS techniques from 1990 to 2015. Image classification to
determine arable and non-arable lands; estimation of changes in temperature using thermal bands of satellite imagery,
comparison of historical NDVI profiles; use of climatic data along with nonspatial departmental data for crop yield estimation
and drawing its relationship with climatic variables.
Keywords: Metrological Data, Remote Sensing, Crop Yield Estimation, Semi-arid, Chakwal
1. Introduction
Increase in agricultural production improved annual
income and has positive influence on food supply in the local
market this contributes in agricultural sustainability by
improving agricultural practice. Pakistan is basically an
agricultural country, primarily economy of Pakistan depends
upon agriculture although its economy has observed
significant variations over the past few years. Agriculture is
considered as one of the leading sectors contributing in
country’s economy, 19.8% of the gross domestic product
(GDP) came from agriculture and almost half of (42.5%) the
rural population is associated with agriculture sector [1].
Over the past two decades, the population in Pakistan has
increased exponentially, and, this rapid growth has caused
two major problems among many others, that include
increased demand for food, and decrease in land available for
agriculture. Food production, both in terms of higher
productivity and improved nutrient quality, has not kept pace
with the needs of the expanding human population, leading to
alarming levels of food insecurity. Extreme weather
conditions, such as floods and droughts, associated with
climate shifts across the globe are projected to cause even
greater adverse effects on the food supply [2].
Wheat is the main agricultural product which is grown on
2 Zeeshan Zafar et al.: Modelling the Climate Change on Crop Estimation in the Semi-Arid Region of
Pakistan Using Multispectral Remote Sensing
a large scale over a wide spectrum of climatic and soil
conditions. Wheat production comprises about 9.9% of the
total agricultural productivity and contributes 2.0% to GDP
[3]. Nearly 80% of the farmers are directly involved with the
wheat production and this crop covers 40% of the total
cropped area in Pakistan [5].
Although agriculture has greater role in food security and
economy, still the country is unable to realize that is real
agricultural production potential as it is much below the
production of most countries in the world [2]. There is also
an enormous gap between actual crop yield and possible
potential crop yield in Pakistan [11]. This obviously pointing
to lack of use of available technologies, if farmer start using
available technologies according to the recommendations this
can increase the agriculture production considerably [10].
Therefore, this is dire need of time to use of science and
latest technology in agriculture field. Remote sensing
techniques and remotely sensed data is highly reliable to
detect and predict the potential yield and effects of different
factors on the potential yield [2].
The traditional approach of measuring the crop yield is
based on ground visits or field surveys. This type of data is
crucial since it provides thorough information, and because it
embodies direct observations in a point of interest typically
associated with high quality measurements. On the other
hand, the modern approach is based on remotely sensed
satellite-based vegetation index observations. Both
approaches have their advantages and limitations, however,
the integration of these techniques could lead to the accurate
estimation of the crop yield. These two kinds of data
complement each other in several ways in the yield
estimation process. The evaluation of crop yield output often
depends on the traditional data gathering techniques, which,
while generally accurate at the point source, are time
intensive, and susceptible to bias errors [1].
In many countries, the limited or late access to the
available data inhibits the assertive actions that can be taken
to prevent potential food shortages. The traditional structure
operated by the provincial government for recording and
archiving agricultural output is reliant on manual and time-
consuming ground data surveying in randomly sampled
villages. The field survey observations from inaccessible
areas are also not likely recorded. Most of the data are
obtained from field surveys and enumeration methods, and
data synthesis and assimilation are finalized several months
after the harvest. Hence, the application of such data for
prompt decision-making and satisfactory planning for wheat
surplus or shortages is often limited [7]. This is especially
true if information and communication technology is not
sufficiently advanced to disseminate timely information for
decision makers [8]
In contrast to this, remotely sensed satellite data provide
timely coverage to large areas even to those regions where
the ground survey is not possible. The evolution in remote
sensing and the availability of real-time satellite imagery
have provided wide access to spatial variability of the earth
features [4]. Satellite data have the potential to identify not
only the crop types but also the crop yield estimates. Hence,
remote sensing can be used to monitor and detect crop
growth stages and to predict crop yield. The phonological
stages and the crop health can be identified through the
spectral responses of the crop by using multi-spectral data.
Impact of climatic change on crop growth and yield has
been a hot topic all over the world in current time due to
rapidly changing behavior of climate and food shortage all
over the world. Technically in natural science, there are two
methods to estimate the potential impacts of climate change
on agricultural systems:
1 Use crop simulation models (e.g., CERES-Wheat, C-
CAM, EPIC, and others) and climate change scenarios.
2 Use field experiments or artificial climate chamber
experiments.
Crop simulation modeling method is considered as most
used method and is frequently used with climate change
scenarios. Inputs like rainfall, soil, temperature, nutrition,
evapotranspiration, the economic environment, atmospheric
circulation, and carbon circulation plays an important role in
applying models which make the method to use labor and
increase the expense. In addition, uncertainties in parameter
values substantially increase the uncertainty estimates for
model projections. And researchers do not fully understand
the mechanisms driving crop growth, this lack of
understanding leads to prediction risk. Field experiments
require more time and a larger budget than other approaches,
but the results of field experiments are often more straight
forward.
2. Data and Methodology
2.1. Study Area
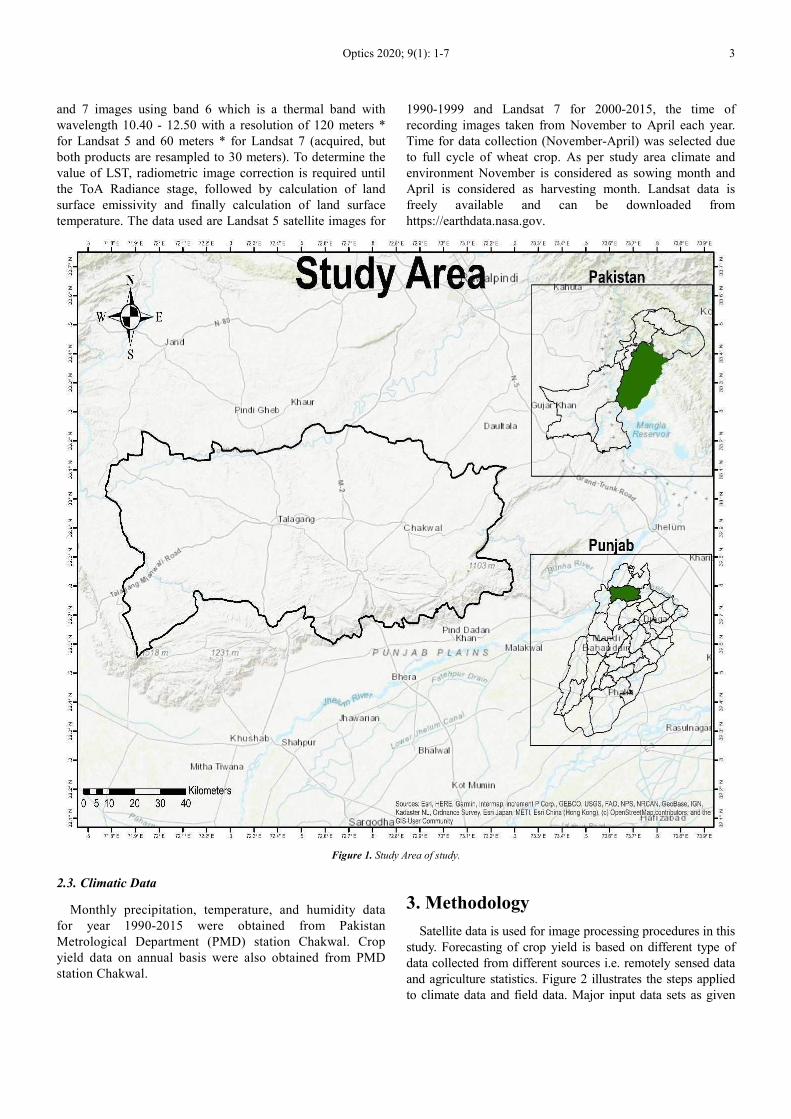
Chakwal is located in Potohar Plateau at 32°55′49″N
72°51′20″E and an altitude of 498m in Punjab province,
Pakistan, with a total area of about 6,524 km2. Agriculture in
Potohar region is largely dependent on weather conditions.
The reported average annual rainfall for Chakwal is about
880 mm. In summer weather is hot while in winter it is cold
and dry. The average temperature during winter is 8°C,
which rises to 42°C during summer. The major crops are
Wheat, Ground Nut, Sorghum, Rape/Mustard Seed, Millet
(Bajra) and Gram. Wheat is grown on most of the land,
which is then used for both commercial and personal
purposes (Figure 1).
2.2. Satellite Data
Landsat 5 TM satellite images contains 7 bands: 3 visible
bands, 2 NIR bands & 1 MIR band having 30 m spatial
resolution and 1 TIR band having 120 m spatial resolution.
Landsat 7 consist of 7 spectral bands with a spatial
resolution of 30 m for Bands 1-5, and 7. The resolution for
Band 8 (panchromatic) is 15 m while Band 6 collects both
low and high gain (Bands 61 and 62, respectively) having 60
m spatial resolution (resampled to 30 m) [6].
The land surface temperature is extracted using Landsat 5
Optics 2020; 9(1): 1-7 3
and 7 images using band 6 which is a thermal band with
wavelength 10.40 - 12.50 with a resolution of 120 meters *
for Landsat 5 and 60 meters * for Landsat 7 (acquired, but
both products are resampled to 30 meters). To determine the
value of LST, radiometric image correction is required until
the ToA Radiance stage, followed by calculation of land
surface emissivity and finally calculation of land surface
temperature. The data used are Landsat 5 satellite images for
1990-1999 and Landsat 7 for 2000-2015, the time of
recording images taken from November to April each year.
Time for data collection (November-April) was selected due
to full cycle of wheat crop. As per study area climate and
environment November is considered as sowing month and
April is considered as harvesting month. Landsat data is
freely available and can be downloaded from
https://earthdata.nasa.gov.
Figure 1. Study Area of study.
2.3. Climatic Data
Monthly precipitation, temperature, and humidity data
for year 1990-2015 were obtained from Pakistan
Metrological Department (PMD) station Chakwal. Crop
yield data on annual basis were also obtained from PMD
station Chakwal.
3. Methodology
Satellite data is used for image processing procedures in this
study. Forecasting of crop yield is based on different type of
data collected from different sources i.e. remotely sensed data
and agriculture statistics. Figure 2 illustrates the steps applied
to climate data and field data. Major input data sets as given

4 Zeeshan Zafar et al.: Modelling the Climate Change on Crop Estimation in the Semi-Arid Region of
Pakistan Using Multispectral Remote Sensing
below were gathered, compiled, and used.
Figure 2. Methodology used for this study.
3.1. Image Pre-Preprocessing
Satellite imagery may have some errors due to acquisition
by sensor or transmission to ground station which needs to be
rectified before applying any analysis. These errors may
include atmospheric, radiometric, and geometric calibrations
depending upon the data. In addition to error removal some
preprocessing of satellite data is necessary before performing
any analysis. Preprocessing involved image stacking,
mosaicking and subsetting the data as per study area.
Satellite sensor records the intensity of the ER for each pixel
as a DN value, which can be converted to more meaningful
real-world units like radiance or reflectance. Sensor specific
information is required to carry out this calibration. Landsat
Meta data file contains this information.
Atmospheric correction significantly improves the analysis
and use of a satellite image which involves removal of the
effects of atmosphere in the data and provide the surface
reflectance values. This is a complex process requires
knowledge of the atmospheric conditions and aerosol
properties at the time the image was acquired. Different
models are used to carry out atmospheric corrections, ENVI
provides a convenient and effective model/ tool for
atmospheric corrections “FLAASH”; which corrects
wavelengths in the visible through near-infrared and shortwave
infrared regions, up to 3 µm. Most of the parameters required
for processing are available in image metadata file “MTL”,
including Date and Time of image acquisition, sensor type etc.
Mean elevation of the image was provided using SRTM 30m
DEM. The atmospheric model for the study area is “Mid
Latitude Summer” whereas “Urban” aerosol model was
selected considering large urban settlements. Multispectral
settings include KT Upper Channel, KT Lower Channel and
Cirrus Channel.
3.2. Use of Landsat
Landsat 7 ETM+ imagery acquired after May 2003 has the
gap/ missing data, which required to be filled for RS & GIS
analysis. ENVI provides a tool “Landsat Gapfill” which can
perform gap filling in data based on two layers with one layer
having missing data and other having complete data. The tool
can also fill in the missing data values using triangulation
method on known values of the same single layer which was
applied in this research. Though the gaps in the image are filled
and remote sensing processes can be applied, however when the
study area is more towards the left or right edges of the Landsat
scene, the image has more of the interpolated values than of the
real values and increases the possibility errors in image
classification. Especially, Faisalabad district containing edges
from four Landsat scenes and Multan district containing edges
of the two Landsat scenes have larger gaps [7].
The land surface temperature is one of the important factors
in wheat agricultural, therefore this variable needs to be
included in the study regarding linear regression analysis that
will be made between LST and NDVI. The land surface
temperature is extracted using Landsat 5 and 7 images using
band 6 which is a thermal band with wavelength 10.40 - 12.50
with a resolution of 120 meters * for Landsat 5 and 60 meters
* for Landsat 7 (acquired, but both products are resampled to
30 meters). To determine the value of LST, radiometric image
correction is required until the ToA Radiance stage, followed
by calculation of land surface emissivity and finally
calculation of land surface temperature.
Multiband images for carrying out spatial analysis and band
math operations like image differencing and radioing requires

Optics 2020; 9(1): 1-7 5
to form a composite image by stacking the different layers/
spectral bands, it is compulsory that all the band images which
are to be stacked have the same spatial extent, projection and
spatial resolution. Shape file from survey of Pakistan were
used to crop the satellite imagery to study area extent [8].
4. LULC Classification
Supervised image classification technique was adopted to
classify preprocessed images of the study area. Five classes
(Agriculture Land, Bare land, Built-up areas, Grass land and
wetlands) were extracted from satellite imagery. For every
class fifteen (15) samples were collected and used as training
samples. Supervised classification tool generates classified
raster, these raster files were converted into classification
vector as a shape file and then in the end statistics of every
class has been calculated [9].
A widely used index is the normalized difference
vegetation index (NDVI) as stated in Eq. 1 computed from
the near infrared and red bands and proposed by Rouse
(Ogilvie et al. 2015) to detect vegetation in images. This
index can be used to detect water pixels, where it takes on
negative values. NDVI raster can be used for identification
and extraction different types of LULC:
NDVI = (NIR band - Red band) / (NIR band + Red band)
Value range for NDVI is between -1 to 1. According to
samples of study area the thresholds of NDVI for different
LULC were set as; negative values belongs to water bodies
and have range between -0.182 to -0.054, bare lands has both
positive and negative values and has a ranger between -0.082
to 0.138, built-up areas having values in the range of -0.172
to 0.079, vegetation only possess positive values and has a
range of 0.151 to 0.521 and thick vegetation/ dense
vegetation having values in the range of 0.293 to 0.615.
Normalized difference built up index (NDBI) is often
used to identify urban built-up areas. Near infrared (NIR)
and shortwave infrared (SWIR) bands are used to compute
NDBI as per given in eq. 2. Built-up areas gave higher
reflectance in SWIR bands while have lowest reflectance in
NIR band. Higher positive values of NDBI refers to build
up areas.
NDBI = (SWIR-NIR) / (SWIR+NIR)
Vegetation classes were separated after NDVI and NDBI
analysis for further extraction of wheat crop. Area for wheat
crop were extracted through supervised classification by field
samples and filed data of different years.
5. Accuracy Assessment
Accuracy assessment with an independent data set is the
only way to determine the reliability of performed analysis.
Different LULC can be easily distinguish by high resolution
historic imagery provided by Google. Random point
technique was used to assess the accuracy, separate random
points for each year was taken and respective LULC class
was assigned to each point according to classified raster
image of same year. These random points were the converted
to “KML”. The “KML” file was loaded into “Google Maps
Pro” and each point was compared with object / ground
feature on the Google Pro image.
Estimation of wheat production requires information about
planting area and rice productivity. Planting area in this study
was obtained from the interpretation of remote sensing
images. Wheat yield is obtained from the results of field
surveys. Wheat production is calculated as yield for each
pixel based on the model. Wheat yield result is the
production of one planting season. Estimated wheat
production in each pixel is added according to the area to
know the estimated production in that area. Estimated wheat
yield for the Chakwal region is calculated based on the total
the number of pixel value, where the pixel value is
containing yield estimation value. Meanwhile, the
comparison between estimated wheat yield from satellite
images and field survey are presented in Table 1.
Table 1. Accuracy Assessment Table.
Years Area Accuracy% Yeild Accuracy
Nov 1990- Apr 1991 98 87
Nov 1995-Apr 1996 95 98
Nov 2000-Apr 2001 85 93
Nov 2005-Apr 2006 80 86
Nov 2010-Apr 2011 78 85
Nov 2014-Apr 2015 77 85
6. Results and Discussion
This research applied remote sensing technology for
temperature change and crop estimation in Chakwal districts.
Remote sensing proved itself a very useful tool for the exact
estimation of crop area and crop yield. Study linked the
temperature and crop yield year by year. One of the goals of this
study is estimating wheat yields using satellite imagery and their
relationship with climate change. To achieve this goal, the data
used are Landsat 5 satellite images for 1990-1999 and Landsat 7
for 2000-2015, detail of data acquisition date, tile, sensor and
results from these images are given in Table 2.
Table 2. Table showing LST and crop estimation results.
Satellite (Sensor) Tile Acquisition Date Minimum Temperature (°C) Maximum Temperature (°C) Crop Estimation Area (Hec)
LT05_L1TP_150037 19/02/1990 -3.2 17.65 931
LT05_L1TP_150037 01/02/1995 -3 20 14491
LE07_L1TP_150037_ 07/02/2000 -2.62 17.81 24188
LE07_L1TP_150037 02/02/2010 -2.62 17.81 3796
LLE07_L1TP_150037 15/01/2015 -2.37 18.34 40901

6 Zeeshan Zafar et al.: Modelling the Climate Change on Crop Estimation in the Semi-Arid Region of
Pakistan Using Multispectral Remote Sensing
Figure 3. Figure Showing Crop area and LS T distribution for Chakwal.
LST from year 1990 to year 2010 were calculated from Landsat imagery. LST of 1990 showed the uprising

Optics 2020; 9(1): 1-7 7
temperature in the North western part of Chakwal. Highest
temperature for given date was 17.65 and the minimum was -
3.2. Wheat crop of district Chakwal has been calculated using
satellite imagery by using NDVI and classification technique.
Most of our study area consist of has agricultural land or
baren land. Total wheat crop of the area has been calculated
in hectares. Chakwal district has 931 hectares wheat crop
during year 1990. Tehsil Chakwal has high wheat crop area
and tehsil Talagang has lowest wheat crop area [10]. LST
distribution and wheat crop distribution for year 1990 was
shown in Figure 3A. LST of years 1995 with legend values
of temperature from high to low in district Chakwal. The
highest temperature is 20 C and lowest is -3. The lowest
temperature is in vegetated areas. Highest temperature was
recorded 20 in tehsil Talagang of district Chakwal which is
consist of desert. Total area for wheat in year 1995 of district
Chakwal was 14491 hectares. Tehsil Choa saidan shah has
highest area value during this year, lowest wheat crop area
has been analyzed in Tehsil Talagang. Tehsil Chakwal also
shows higher values (Figure 3B). LST for 2000 showed the
highest temperature is 17.81°C and lowest is -2.62°C. Total
wheat crop area for year 2000 of district Chakwal was
recorded as 24188 hectares. Tehsil Chakwal and Tehsil Choa
saidan shah have higher ratio while Tehsil Talagang remained
the lowest (Figure 3C). LST 2010 showed almost same
values as year 2000 with highest temperature is 17.814°C
and lowest is -2.628°C. Total wheat area in year 2010 of
district Chakwal has area 3796 hectares. This year tehsil
Talagang showed an improvement and significantly improve
in wheat crop area (Figure 3D). Figure 3E showing the LST
distribution for year 2015 with highest temperature is
18.342°C and lowest is -2.371°C. Total wheat crop area in
2015 of district Chakwal has area 40901 hectares. Tehsil
Chakwal, Tehsil Choa saidan shah and Tehsil Kallar Kahar
have higher yields while Tehsil Talagang has the lowest
yields.
7. Conclusion
Remote Sensing science is widely adopted technology all
over the world for crop yield estimation. In Pakistan, remote
sensing technology still has very limited use for crop yield
estimation and relation of climatic factors with crop yield. In
this study we tried the potential use of Landsat imageries of
different years for the identification of Wheat crop and LST
in District Chakwal. Atmospheric Correction (Geometric
Correction and Radiometric Calibration), NDVI for Wheat
crop had been performed. Wheat crop area in hectares also
calculated using raster to polygon and by calculates
geometry. Ground truthing had been performed in five tehsils
of District Chakwal during recent years which seems to be
85% to 90% accurate. Results accuracy proved the vital
importance of remote sensing in crop estimation. LST trends
has been also analyzed and relate with wheat crop area. LST
from Landsat imagery was compared with metrological
stations data. Comparison showed that LST can be used in
that specific area instead of filed station data. Yield
estimation analyzed from multiple imagery and LST shows
that an increase in LST can improve the wheat crop in
Chakwal. This methodology can be useful for the Agriculture
department for the food policy in Chakwal.
References
[1] Ahamad, M. I., Zafar, Z., Arsalan, M., Rehman, A., Sajid, M., Zulqarnain, R. M., Mehmood, M. S., Abdal, S., Aslam, M., 2020. Effects of Temperature and Pressure on Reservoir Fluids and Seismic Properties of Reservoir Rocks. Int. J. Pharm. Sci. Rev. Res. 63, 36–43.
[2] Ahamad, Song, Sun, Wang, Mehmood, Sajid, Su, Khan, 2020. Contamination Level, Ecological Risk, and Source Identification of Heavy Metals in the Hyporheic Zone of the Weihe River, China. Int. J. Environ. Res. Public Health 17, 1070. https://doi.org/10.3390/ijerph17031070
[3] Ahemad & Kibert 2014. Crop Phenological Phase based Wheat yield estimation using MODIS NDVI Product. PhD Thesis, Islamabad.
[4] Ahmad, W., Noor, M. A., Afzal, I., Bakhtavar, M. A., Nawaz, M. M., Sun, X., Zhou, B., Ma, M., Zhao, M., 2016. Improvement of Sorghum Crop through Exogenous Application of Natural Growth-Promoting Substances under a Changing Climate. Sustainability. 8, 1330; http://dx.doi.org/10.3390/su8121330
[5] Baig, M. B., Straquadine, G., 2011. ‘‘Sustainable agriculture ensures sustainable ruraldevelopment: a reality or a myth”. In: M. Behnassi et al. (Eds.), Global food insecurity: rethinking agricultural and rural development paradigm and policy, pp. 21–32. http://dx.doi.org/10.1007/978-94-007-0890-7_3, Springer Science +Business Media B. V.
[6] Government of Pakistan, 2015. Ministry of Finance. Pakistan economic survey 2015–16. pp. 5–8.
[7] Noor, M. A., Ahmad, W., Afzal, I., Salamh, A., Afzal, M., Ahmad, A., Ming, Z., Wei, M., 2016. Pea seed invigoration by priming with magnetized water and moringa leaf extract. Philipp. Agric. Sci 99, 171–175.
[8] Noor, M. A., Fiaz, S., Nawaz, A., Nawaz, M. M., 2018. The effects of cutting interval on agro-qualitative traits of different millet (Pennisetum americanum L.) cultivars. J. Saudi Soc. Agric. Sci. 17 (3), 317–322. http://dx.doi.org/10.1016/j.jssas.2016.07.002
[9] Reynolds, C. A., Yitayew, M., Slack, D. C., Hutchison, C. F., Huete, A., & Peteresen, M. S. (2000). Estimating crop yields and production by intergratingthe FAO crop specific Water Balance model with real-time satellite data and ground based ancilliary data. International Journal of Remote Sensing, 348='y 7-3508.
[10] Waqas, M. A., Khan, I., Akhter, M. J., Noor, M. A., Ashraf, U., 2017. Exogenous application of plant growth regulators (PGRs) induces chilling tolerance in short-duration hybrid maize. Environ. Sci. Pollut. Res. 24, 11459–11471.
[11] Zafar, S. A., Hameed, A., Khan, A. S., Ashraf, M., 2017. Heat shock induced morphophysiological response in indica rice (Oryza sativa L.) at early seedling stage. Pak. J. Bot. 49 (2), 453–463.
Related Documents