Modelling pig and poultry production systems: computational and conceptual challenges M. Gilbert (& T. Van Boeckel) Université Libre de Bruxelles http://lubies.ulb.ac.be/Spatepi.html T. Robinson International Livestock Research Institute

Modelling pig and poultry production systems: computational and conceptual challenges
Jul 28, 2015
Welcome message from author
This document is posted to help you gain knowledge. Please leave a comment to let me know what you think about it! Share it to your friends and learn new things together.
Transcript

Modelling pig and poultry production systems: computational and conceptual challenges
M. Gilbert (& T. Van Boeckel)Université Libre de Bruxelles http://lubies.ulb.ac.be/Spatepi.html
T. RobinsonInternational Livestock Research Institute
Livestock Human population Spatial epidemiology & invasion ecology
Catherine Linard
Yann Forget Jean Artois
Clément TisseuilGaëlle Nicolas
Weerapong Thanapongtharm
Postdocs
PhD
http://lubies.ulb.ac.be/Spatepi.html
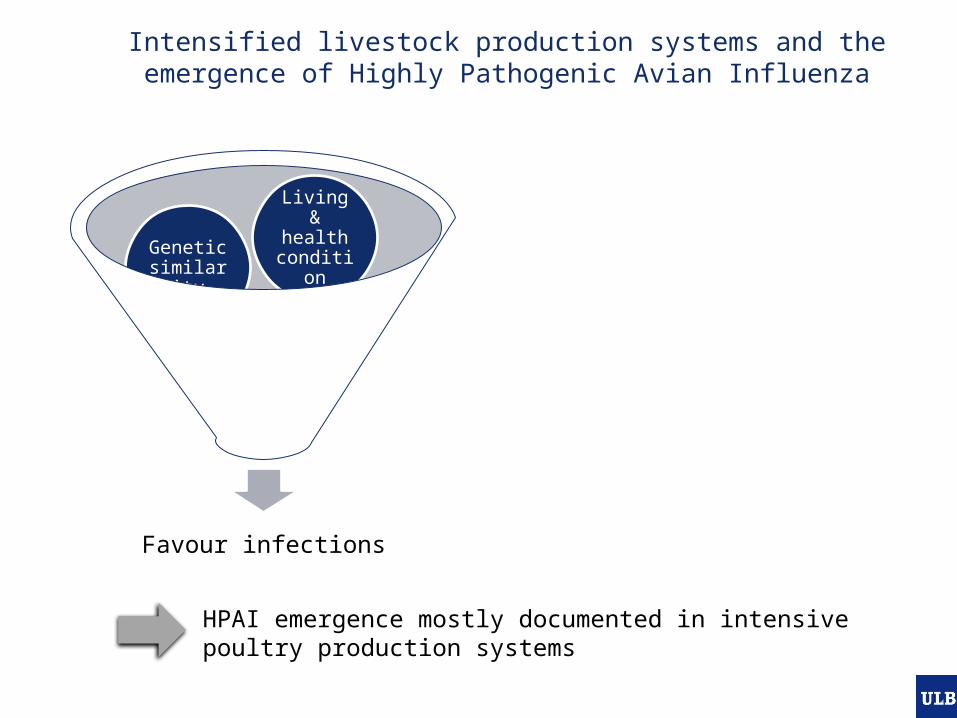
Intensified livestock production systems and the emergence of Highly Pathogenic Avian Influenza
Favour infections
High density & contacts
Genetic similarity
Living & health
condition
HPAI emergence mostly documented in intensive poultry production systems

Intensified livestock production systems and agricultural antimicrobial use
Favour infections
High density & contacts
Genetic similarity
Living & health
condition
Marginal gains due higher off-take rates do make a difference over large volume
(but see Graham et al. 2007)
Feed conversion
rate matters
Fast prod. cycles
High inputs /
high outputs
Higher use of antimicrobials in intensive systems (preventive, curative, feed additive)
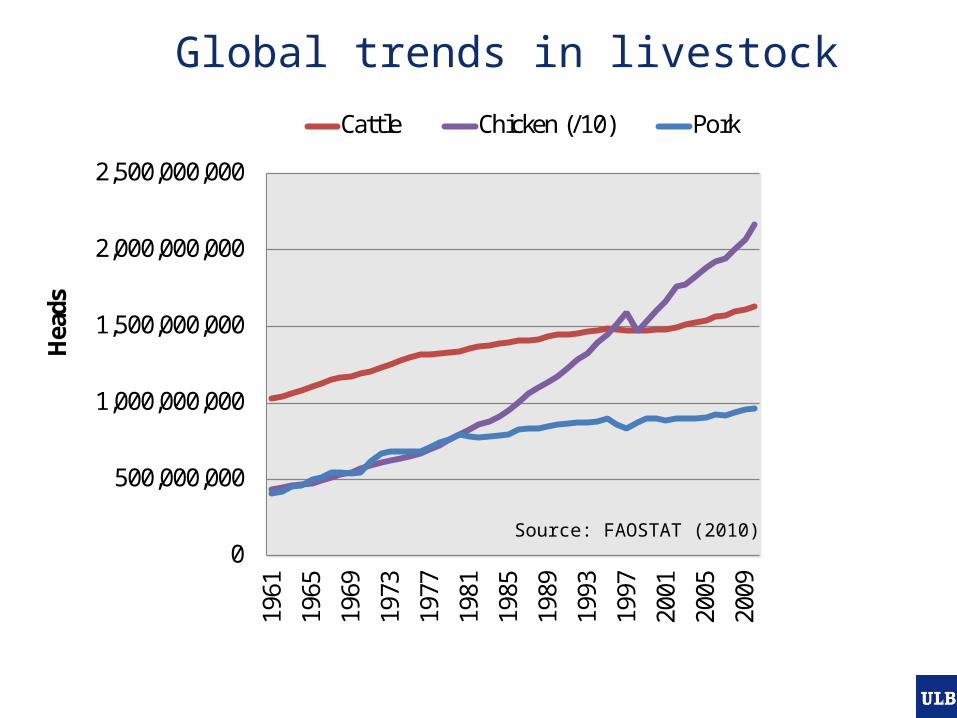
Global trends in livestock numbers
0
500,000,000
1,000,000,000
1,500,000,000
2,000,000,000
2,500,000,000
1961
1965
1969
1973
1977
1981
1985
1989
1993
1997
2001
2005
2009
Hea
ds
Cattle Chicken (/10) Pork
Source: FAOSTAT (2010)

Global trends in livestock productivity
90
110
130
150
170
190
210
230
250
1961
1965
1969
1973
1977
1981
1985
1989
1993
1997
2001
2005
2009
Rela
tive
incr
ease
in O
utpu
t/In
put
(kg
outp
uts
head
-1 y
ear-
1)
Cattle (331) Chicken (1.73) Pork (60.9)
Source: FAOSTAT (2010)

Outline
Context
• Intensification has taken place rapidly in the past• Strong projected changes in demand will lead to further
intensification• Changes are structured geographically
Objectives
• Better document the geographic distribution of intensive livestock production
• Develop tools for making projections
Method
s
• Mapping the global distribution of livestock• Disaggregating in production systems

Livestock distribution: Gridded Livestock of the World (GLW 1.0)
• General principle• Collection of sub-national livestock
census data• Many variables correlated to livestock
farming are mapped at high resolution (e.g. land cover).
• Statistical models are based on high resolution GIS predictors and applied to downscale census values by pixel (stratified multiple linear regressions)
• Previous developments• GLW 1.0 published by FAO in 2007,
mostly based on census data < 2005 (Wint & Robinson 2007)
• Global extent, 5 km resolution

Livestock distribution: Gridded Livestock of the World (GLW 2.0)
• Recent developments• More recent & higher resolution census data• Spatial modelling @ 1km resolution• Automation of the methodology in R• Disseminated through the Livestock GeoWiki
• http://www.livestock.geo-wiki.org/
• New species division• Cattle• Pig• Chicken• Duck• Sheep• Goat
Robinson, T., W. Wint, T, G. Conchedda, T. P. Van Boeckel, V. Ercoli, E. Palamara, G. Cinardi, L. D’Aietti, & M. Gilbert (2014) Mapping the Global Distribution of Livestock. PLoS ONE 9(5): e96084. doi:10.1371/journal.pone.0096084

Livestock distribution: Gridded Livestock of the World (GLW 3.0)
• In progress…• New machine learning algoritm (Random Forest)
• Systematic evaluation (years of CPU time in 4 months)• 180 models for Asia chicken and Africa cattle
• Processing on ILRI cluster (parrallelized)• Full integration of metadata• Spatial modelling & dissemination @ 1 km & 10 km resolution• Toward global runs instead of continental tiles• Revision of predictor variable to include more anthropogenic
factors

Livestock distribution: Gridded Livestock of the World (GLW 3.0)
RF (GLW 3.0) vs. Stratified regression (GLW 2.0) leave-out cross validation

Livestock distribution: Gridded Livestock of the World (GLW 3.0)
1 week / species
GLW 2.0 GLW 3.0
16h /species
1 month/ species
1-2 days / species

Outline
Context•Intensification has taken place rapidly in the past•Strong projected changes in demand will lead to further intensification•Changes are structured geographically
Objectives •Better document the geographic distribution of intensive livestock production•Develop tools for making projections
Methods •Mapping the global distribution of livestock•Disaggregating in production systems

Conceptual framework (1)

Conceptual framework (2)

Conceptual framework (3)
The % ext. chicken is predicted at national level by the GDP model
Ext. raised chicken are distributed equally across rural population
Intensively raised poultry is estimated by the difference with the total

Application to chicken

Extensively raised chicken

Intensively raised chicken

Validation: chicken extensive
Van Boeckel, T., W. Thanapongtharm, T. Robinson, L. D’Aietti & M. Gilbert (2012). Predicting the distribution of intensive poultry farming in Thailand. Agriculture, Ecosystem and Environment. Doi: 10.1016/j.agee.2011.12.019

Validation: chicken intensive
Van Boeckel, T., W. Thanapongtharm, T. Robinson, L. D’Aietti & M. Gilbert (2012). Predicting the distribution of intensive poultry farming in Thailand. Agriculture, Ecosystem and Environment. Doi: 10.1016/j.agee.2011.12.019

Application to pigs:extensive, semi-intensive, intensive

Application to pigs:extensive, semi-intensive, intensive

Pigs: extensive

Pig semi-intensive

Pig intensive

Disaggregating between extensive and intensive production systems
• Limitations• Uncertainty in the GDP model (& other important variables ?)• Ignore sub-national GDP variations• Assumption of equal number of Ext. Chicken / rural population

Validation: chicken extensive
Van Boeckel, T., W. Thanapongtharm, T. Robinson, L. D’Aietti & M. Gilbert (2012). Predicting the distribution of intensive poultry farming in Thailand. Agriculture, Ecosystem and Environment. Doi: 10.1016/j.agee.2011.12.019

Discussion (1)
People
• Number• Weatlh• Diet
Livestock
• Number• Production
systems
Impact
• Amonia pollution
• GHG emissions
• EIDs• Antimicrobial
resistance
Drivers of change in spatial distribution
Drivers of change in number
Demand
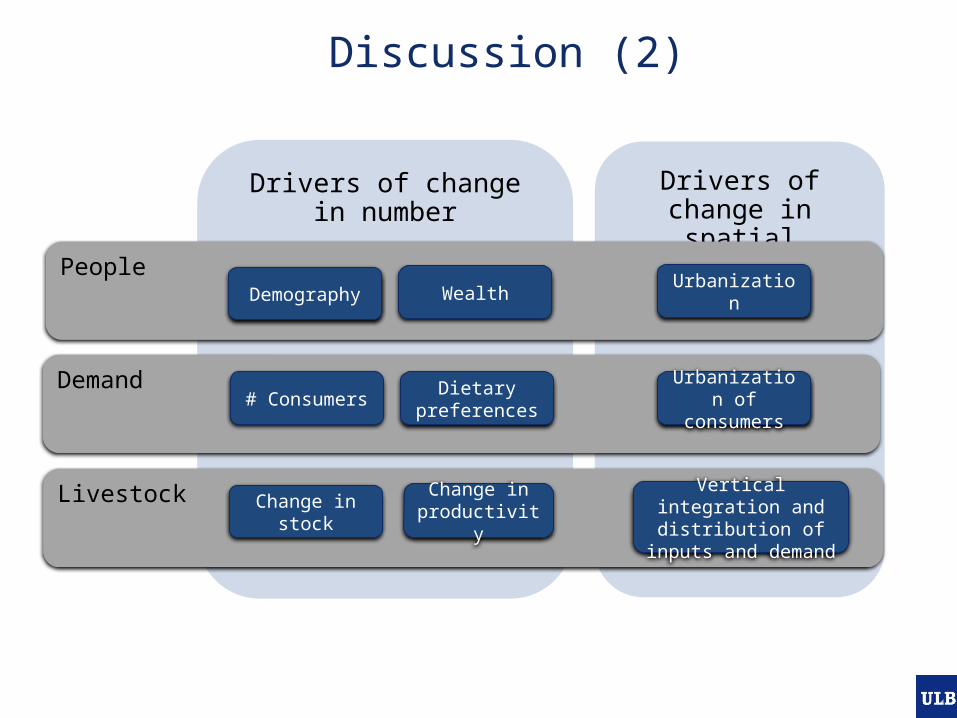
Discussion (2)
People
Livestock
Demography Wealth
# ConsumersDietary
preferencesUrbanization of
consumers
Change in stock
Change in productivity
Urbanization
Vertical integration and distribution of
inputs and demand

Future work (1)
Livestockproducts
Change in stock
Change in productivity
Vertical integration and concentration of
demand
• Methodological improvements• Using agricultural population• Using sub-national GDP where appropriate (e.g.
China, India)
• Forward and backward predictions

Future work (2)
2000log GDP per capita c. $ 2.9% extensive c. 83 %
2000
2030
2030log GDP per capita c. $ 3.8% extensive c. 18 %
Chicken production in China

Future work (3)
Livestockproducts
Change in stock
Change in productivity
Vertical integration and concentration of
demand
• Methodological improvements• Using agricultural population• Using sub-national GDP where appropriate (e.g.
China, India)
• Forward and backward predictions• GDP data & projections (national / sub-national)• Spatial concentrations (peri-urban, access to port,
founder effect)

Future work (4)
People
• Number• Weatlh• Diet
Livestock
• Number• Production
systems
Impact
• Amonia pollution
• GHG emissions
• EIDs• Antimicrobial
resistance
Related Documents