MODELLING OF WETLAND HABITAT AVAILABILITY AND DISTRIBUTION UNDER MANAGEMENT ALTERNATIVES A case study of the Fúquene Lake, Colombia MAUREEN IRINA MONTENEGRO-PAREDES March 2004

Welcome message from author
This document is posted to help you gain knowledge. Please leave a comment to let me know what you think about it! Share it to your friends and learn new things together.
Transcript

MODELLING OF WETLAND HABITAT AVAILABILITY AND DISTRIBUTION UNDER
MANAGEMENT ALTERNATIVES
A case study of the Fúquene Lake, Colombia
MAUREEN IRINA MONTENEGRO-PAREDES March 2004

MODELLING OF WETLAND HABITAT AVAILABILITY AND DISTRIBUTION UNDER MANAGEMENT ALTERNATIVES
A case study of the Fúquene Lake, Colombia
By
Maureen Irina Montenegro-Paredes Thesis submitted to the International Institute for Geoinformation Science and Earth Observation (ITC), in partial fulfilment of the requirements for the Award
of the degree of Masters of Science in Geo-information Science and Earth Observation, Environmental System Analyses and Management specialization.
Degree Assessment Board: CHAIRMAN: Dr. Ir. C.A.J.M. de Bie PRIMARY SUPERVISOR: Ihr. Fabio Corsi NRM, ITC CO-SUPERVISORS: Dr. Z. Vekerdy WRS, ITC
Dr. Ir. R. A. de By GFM, ITC INTERNAL EXAMINER: Ms. Dr. Ir. W. Bijker EXTERNAL EXAMINER: Prof. Dr. A. M. Cleef
INTERNATIONAL INSTITUTE FOR GEO-INFORMATION SCIENCE AND EARTH OBSERVATION (ITC)
ENSCHEDE, THE NETHERLANDS
I certify that although I may have conferred with others in preparing this assignment, and drawn upon a range of sources cited in this work, the content of this thesis report is my original work. Signed Disclaimer This document describes work undertaken as part of a programme of study at the International Institute for Geoinformation Science and Earth Observation. All views and opinions expressed therein remain the sole responsibility of the author, and do not necessarily represent those of the institute.
i
ABSTRACT
The Fúquene Lake located on the Andean mountains of Colombia, is considered one of the most important relicts for bird threatened species. Nevertheless, the lake is being affected by non-sustainable activities that are gradually deteriorating it. In fact, eutrophication, siltation and biodiversity loss represent some of the problems that faced this area. Currently, there is a regional interest to come up with management alternatives to restore and protect the lake. This research structured a spatial model to represent potential effects on wetland habitats by management alternatives to be adopted, through the use of remote sensing and geographical information systems. Hence, biological and eco-hydrological variables were identified and interactions among them were analyzed. Three threatened bird species were selected and their habitats types were described. They inhabit mainly prairies of rooted emergent plants (Habitat I) and prairies of floating plants (Habitat II). The habitat representation has increased between the years 1987 and 2002 on 190 ha and 309 ha for Habitat I and II, respectively. Water inflows and outflows represented by rainfall, water discharge and ground water level, are gradually decreasing. Nevertheless, the water level of the lake maintains constant on 2539 m.a.s.l. High concentrations of nutrients and sediments are being incorporated to the lake. However, siltation seemed to produce the higher effects on the availability and distribution of the wetland habitats. Management alternatives were modelled for a span of time of 16 years. The model of no additional management suggested the increase of Habitat II and I, the decrease of the transitional zone between them and the reduction of open water. The second management alternative modelled three different scenarios: an increase of water level of the lake on 0.5, 1 and 2 meters. According with the model, 0.5 meters was the best option to maintain representative areas of the two habitats as well as the transitional zone. A final management alternative require of a better understanding of the nutrients contribution to the lake. A general analysis of availability, limitations and requirements of data was also developed as additional contribution to further studies on the study area using remote sensing and geographical information systems.

ii
ACRONYMS AND ABBREVIATIONS CAR Regional Autonomous Corporation of Cundinamarca – Colombia COD Chemical Oxygen Demand DEM Digital Elevation Model GIS Geographical Information System ILWIS The Integrated Land and Water Information System (software) MEDWET Mediterranean Wetlands Initiative M.A.S.L Meters above sea level RAMSAR Ramsar Convention on Wetlands of International Importance
especially as Waterfowl Habitat Total n Total nitrogen concentration Total p Total phosphorus concentration

iii
AKNOWLEDGEMENTS I would like to express my gratitude to the following persons for their valuable contributions during this research. To Mr. Fabio Corsi, my primary supervisor, who offered me excellent guidance, encouragement, support and useful ideas. Also to Dr. Zoltan Vekerdy from the Department of Water Resources for his support on building the hydrological conceptual framework, and the constructive discussions during this research. To Dr. Ir. Rolf de By from the GFM Department (ITC), for his valuable expertise on bird ecology during my first steps on this research. The success of this study is attributed to your invaluable contribution. The logistic support on data provided by the Corporación Autónoma Regional de Cundinamarca (CAR) of Colombia, through his director Mr. Rafael Londono Gomez, as well as Mr. Jose Agustin Cortez, Director of the Chequa Project, and Mr. Fernando Useche. Additionally, the Ministry of Environment of Colombia, which also supported thhis study with source data, and especially to my friends and colleagues Maria Rivera, Fabian Acosta, Elmer Cardozo, Hilda Dugand and Maximo Rodriguez. Finally, the Foundation Humedales, and especially to Mr. German Andrade as well as Lorena Franco, Ines Elvira Lozano, and Andrea Morales for their invaluable contribution on source data, guidance and support during this study. To Ruben Vargas, Dr. David Rossiter, Dr. Jean de Leeuw, Iris van Duren, and Jelle Fewerda for the kind cooperation received during the data processing and analysis. Moreover of Mr. G. Reinink and Mr. Lepink, my friends Mr. Job Duim, Benno Masselink, and Ard Kosters, and Mrs. Grotenboer and the librarians of ITC for the willingness and kind technical support during the research. To Martha MVides, Rodrigo Sagardia and Graciela Peters-Guarin for their contribution with comments and corrections regarding english writing and logic sequence of the document. I will always appreciate your unconditional support with friendship and love on the moments where time seemed to be short. To my parents, who encouraged me with love to pursue my goals, and played a key role as the best remote field assistants. Dr. Michael Weir, Programme Director of Natural Resources Management Programme of ITC, the Netherlands Fellowship Programme, and the Colombian Institute of International Studies (ICETEX) from Colombia, who encouraged and trusted on me to start this master. To my Dutch, Colombian, Bolivian, Palestine, Latino and worldwide friends and classmates who provided me with a marvellous environment to work on this study. To all the divine and non-divine strengths of human spirit…
ABSTRACT .........................................................................................................................................i ACRONYMS AND ABBREVIATIONS .........................................................................................ii AKNOWLEDGEMENTS .................................................................................................................iii TABLE OF CONTENTS .................................................................................................................iv LIST OF FIGURES .........................................................................................................................vi LIST OF TABLES...........................................................................................................................vii LIST OF APPENDIXES ................................................................................................................vii
TABLE OF CONTENTS
1. INTRODUCTION ................................................................................................................1
1.1. CONCEPTUAL FRAMEWORK ..............................................................................................2 1.1.1. Ecological approach of the Fúquene Lake ..........................................................2 1.1.2. Overview of the problems in the Fúquene Lake ..............................................4 1.1.3. International and National Management framework .....................................5
1.2. AIM OF THE STUDY ...........................................................................................................8 1.2.1. Objectives and Research Questions .....................................................................8 1.2.2. General Assumptions..................................................................................................9
2. LITERATURE REVIEW....................................................................................................10
2.1. WETLAND HABITATS: DEFINITION AND CLASSIFICATION SYSTEMS .........................10 2.1.1. Biological variables....................................................................................................12
2.1.1.1. Bird species .....................................................................................................12 2.1.1.2. Wetland habitat types .................................................................................14
2.1.2. Environmental variables..........................................................................................16 2.1.2.1. Water balance ................................................................................................16 2.1.2.2. Nutrients and mineral compounds .........................................................17 2.1.2.3. Sediments ........................................................................................................19
2.2. WETLAND DYNAMIC AND DISTURBANCE EVENTS.........................................................20 2.3. MODELS AS A TOOL FOR CONSERVATION MANAGEMENT ............................................21
3. STUDY AREA.....................................................................................................................23
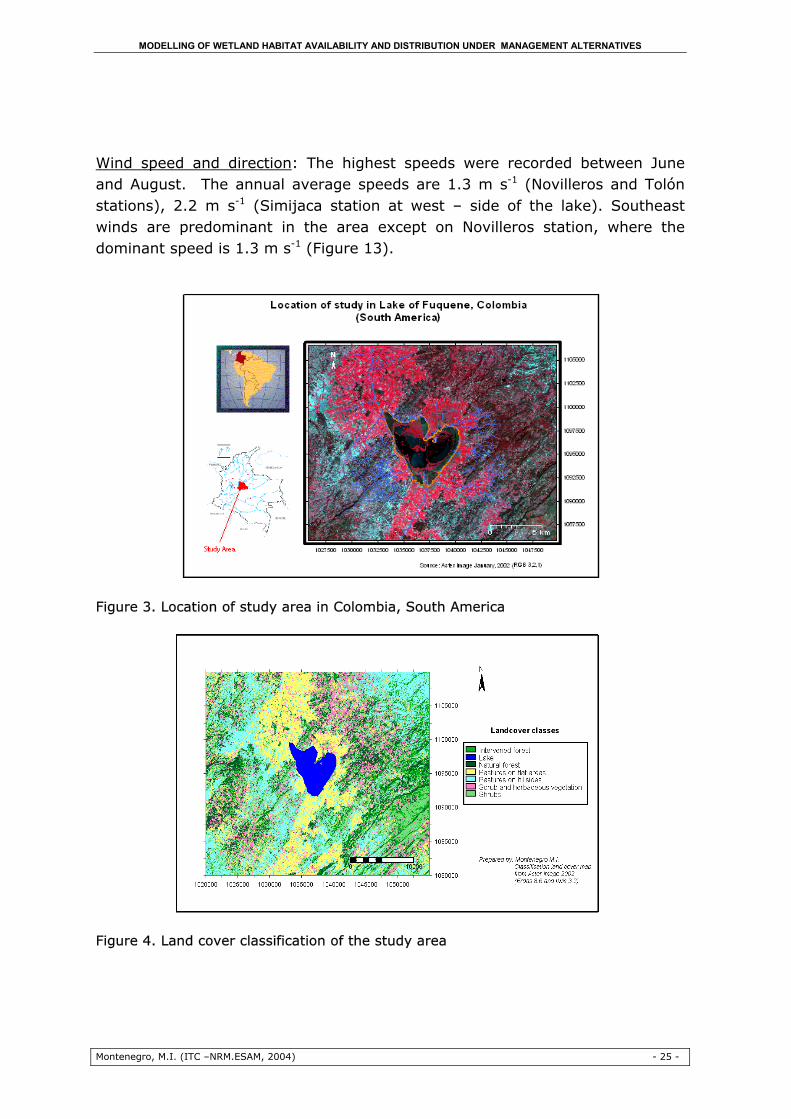
3.1. LOCATION ........................................................................................................................23 3.2. SOILS AND GEOLOGICAL FEATURES..............................................................................23 3.3. CLIMATE ...........................................................................................................................24 3.4. HYDROLOGICAL REGIME. ...............................................................................................27 3.5. FAUNA AND FLORA ..........................................................................................................28 3.6. LAND USE.........................................................................................................................29 3.7. CONSERVATION ...............................................................................................................30

v
4. EXPERIMENTAL DESIGN AND METHODS ..............................................................31
4.1. TOPIC SELECTION AND PROBLEM ANALYSIS.................................................................31 4.2. DATA GATHERING AND PROCESSING ............................................................................32
4.2.1. Processing of biological variables data sets ....................................................32 4.2.1.1. Bird data set analysis ..................................................................................33 4.2.1.2. Image processing and vegetation unit interpretation ....................37
4.2.2. Processing of eco-hydrological variables data set. .......................................39 4.3. MODELLING OF THE WETLAND HABITAT TYPES............................................................44 4.4. MODELLING OF MANAGEMENT ALTERNATIVES .............................................................46
5. RESULTS ............................................................................................................................48
5.1. ANALYSIS OF BIOLOGICAL AND ECO-HYDROLOGICAL VARIABLES .............................48 5.1.1. Distribution of the bird species on wetland habitats....................................48 5.1.2. Distribution and extent of the wetland habitat types ..................................53 5.1.3. Analysis of eco-hydrological variables ...............................................................57
5.1.3.1. Precipitation ....................................................................................................57 5.1.3.2. Water discharge ............................................................................................59 5.1.3.3. Ground water level .......................................................................................61 5.1.3.4. Water Level of the Fúquene Lake ...........................................................62 5.1.3.5. Sediments and nutrients of the Fúquene Lake .................................63 5.1.3.6. Sediments and nutrients of nearby water bodies ............................64 5.1.3.7. Change in depth of the Fúquene Lake (1984 – 1997) ...................65
5.2. MODEL OF THE WETLAND HABITATS TYPES..................................................................65 5.3. MODEL OF EFFECTS BY MANAGEMENT ALTERNATIVES ................................................69
6. DISCUSSION ....................................................................................................................72
6.1. WETLAND HABITATS FOR BIRD SPECIES ......................................................................72 6.2. ANALYSIS OF THE WETLAND HABITAT MODEL ............................................................74 6.3. ANALYSIS OF THE MANAGEMENT ALTERNATIVE MODEL.............................................77 6.4. ANALYSIS OF DATA AND FURTHER REQUIREMENTS OF DATA .....................................80
7. CONCLUSIONS AND RECOMMENDATIONS ..........................................................83
8. REFERENCES ....................................................................................................................88
9. APPENDIXES.....................................................................................................................92
vi
LIST OF FIGURES Figure 1. Conceptual framework of the Fúquene Lake’ case study ...........................3 Figure 2. Problem tree approach of the study area.........................................................6 Figure 3. Location of study area in Colombia, South America ..................................25 Figure 4. Land cover classification of the study area....................................................25 Figure 5. Digital elevation model of the study area ......................................................26 Figure 6. Monthly rainfall and evaporation recorded by Novilleros, Isla
Santuario, Simijaca and Tolon stations [23] ............................................................26 Figure 7. Historical changes on water level of the Fúquene Lake [23]..................28 Figure 8. General methodological approach .....................................................................31 Figure 9. Spatial and statistical processing of bird and habitat datasets .............32 Figure 10. Sampling points and transects of bird observations on the Fúquene
Lake..........................................................................................................................................34 Figure 11. Ground control points used on the accuracy assessment of the
vegetation classification ...................................................................................................34 Figure 12. Spatial and statistical processing of eco-hydrological variables data
sets ...........................................................................................................................................40 Figure 13. Location of measurement stations of rainfall and water discharge ...41 Figure 14. Location of measurement stations of ground water level .....................42 Figure 15. Location of measurement stations of nutrient and sediment
concentration ........................................................................................................................42 Figure 16. Modelling of possible effects by management alternatives ..................47 Figure 17. Distribution of bird presence per species.....................................................49 Figure 18. Distribution of bird presence per method ....................................................49 Figure 19. Distribution of bird presence per locality .....................................................50 Figure 20. Chi-square test for Rallus semiplumbeus presence vs. habitat types
...................................................................................................................................................51 Figure 21. Chi-square test for Gallinula melanops presence vs. habitat types ..51 Figure 22. Chi-square test for Cistothorus apolinari apolinari presence vs.
habitat types .........................................................................................................................52 Figure 23. The wetland habitats types and change on their area (ha) (1987,
1999, 2002) ..........................................................................................................................56 Figure 24. Scatter plot and regression analysis of rainfall from upstream
meteorological stations .....................................................................................................59 Figure 25. Scatter plot and regression analysis of rainfall from downstream
meteorological stations .....................................................................................................59 Figure 26. Scatter plot and regression analysis of water discharge from
upstream stations ...............................................................................................................60
vii
Figure 27.Scatter plot and regression analysis of water discharge from downstream stations..........................................................................................................61
Figure 28. Scatter plot and regression analysis of groundwater for La Albaida and Tichauribe stations.....................................................................................................62
Figure 29. Scatter plot and regression analysis of groundwater for La Maria and Esmeralda III stations .......................................................................................................62
Figure 30. Scatter plot and regression analysis of Fúquene’s water level ...........63 Figure 31. Change detection of water depth on the Fúquene Lake (1984 -
1997) .......................................................................................................................................66 Figure 32. Predicted change on water depth and wetland habitats distribution 67 Figure 33. Potential effects on wetland habitats distribution under different
scenarios of water level increase (2008 – 2012) ...................................................70
LIST OF TABLES
Table 1. List and general description of gathered data................................................35 Table 2. Characteristics of the Gauss Colombia – zone 2 Coordinate System ..38 Table 3. Wetland habitat types defined by the bird data set.....................................50 Table 4. Change on area (ha) of the wetland habitat types.....................................56 Table 5. Change of water volume (m3) of the Fúquene Lake (1984 - 1997) ......65 Table 6. Annual projection of variation on water depth of the Fúquene Lake
(2000 – 2016) ......................................................................................................................67 Table 7. Calculated area of the cover classes of the Fúquene Lake (1984 –
1997) .......................................................................................................................................68 Table 8. Predicted change on area (ha) of cover classes of the Fúquene Lake
(2000, 2004, 2008, 2012, 2016)..................................................................................68 Table 9. Predicted change on area (ha) of cover classes of the Fúquene Lake by
water level increase on different levels (2008 – 2012) .......................................69
LIST OF APPENDIXES
Appendix 1. Ecological overview of R.semiplumbeus, G. melanops bogotensis and C. apolinari apolinari (Family, genus and species) .......................................92
Appendix 2. The bird species of the Fúquene Lake .......................................................95 Appendix 3. Wetland habitats and other plant communities in the Fúquene
Lake ..........................................................................................................................................95 Appendix 4. Band comparison between Aster and Landsat images........................96 Appendix 5. Data set of the bird species presence/counts.........................................96

viii
Appendix 6. Accuracy assessment of 1987 Landsat and 2002 Aster images and 1999 thematic map ............................................................................................................97
Appendix 7. Scatter plots of rainfall from upstream stations ....................................98 Appendix 8. Scatter plot of rainfall from Simijaca station ..........................................99 Appendix 9. Scatter plot of water discharge from Puente La Balsa station .........99 Appendix 10. Scatter plot of rainfall data from Puente Peralonso station..........100 Appendix 11. Nutrients and sediments data set of the Fúquene Lake ................100 Appendix 12. Scatter plots of Sediments (Suspended solids [SS]) for stations
into the Fúquene Lake.....................................................................................................101 Appendix 13. Scatter plots of Chemical Oxygen Demand (COD) from stations of
the Fúquene Lake..............................................................................................................101 Appendix 14. Scatter plots of total nitrogen (total n) from stations of the
Fúquene Lake......................................................................................................................102 Appendix 15. Scatter plots of total phosphorus (total p) from stations of the
Fúquene Lake......................................................................................................................102 Appendix 16. Nutrients and sediments data set of nearby water bodies ...........103 Appendix 17. Scatter plots of sediments (suspended solids [SS]) from stations
of nearby water bodies ...................................................................................................103 Appendix 18. Scatter plots of Chemical Demand of Oxygen (COD) from stations
of nearby water bodies ...................................................................................................104 Appendix 19. Scatter plots of total nitrogen (total n) from stations of nearby
water bodies........................................................................................................................104 Appendix 20. Scatter plots of total phosphorus (total p) from stations of
nearby water bodies.........................................................................................................105

MODELLING OF WETLAND HABITAT AVAILABILITY AND DISTRIBUTION UNDER MANAGEMENT ALTERNATIVES
Montenegro, M.I. (ITC –NRM.ESAM, 2004) - 1 -
1. INTRODUCTION
Wetlands are rich ecosystems that provide refuge to high concentrations of fauna and flora species. In fact they are considered among the world’s most productive environments. The World Conservation Monitoring Centre has estimated that approximately 570 million ha – roughly 6% of the Earth surface corresponds to wetlands. These ecosystems have been defined by the Ramsar Convention as "areas of marsh, fen, peat land or water, whether natural or artificial, permanent or temporary, with water that is static or flowing, fresh, brackish or salt, including areas of marine water the depth of which at low tide does not exceed six meters". They also "may incorporate riparian and coastal zones adjacent to the wetlands, and islands or bodies of marine water deeper than six meters at low tide lying within the wetlands" [59]. These natural ecosystems concentrate a significant proportion of genetic and biological diversity, represented by migratory and native flora and fauna [50; 51]. For Colombia, these ecosystems represent 20 millions ha of the national territory, that giving shelter to recent declared species of wild fauna and flora as threatened [60]. In addition, wetlands provide environmental services for human communities that depend on them, such as water supply and storage; storm protection and flood mitigation [59]. However, wetlands are under disturbance events, leading to fragmentation or even disappearance. Non sustainable practices, poor planning processes, disarticulated and inconsistent policies are some of the reasons that have caused not only habitat disappearance, but also extinction of endemic and key species that depend totally on these ecosystems [50; 51]. Consequently, there is an urgent need to monitor current status of wetlands and come up with possible management alternatives for their recover. There are many methodological approaches to deal with wetland’s assessment and monitoring. Most of them are based on environmental variables that allow the recognition of wetland dynamics and structure. Aquatic vegetation has been considered as a main indicator of wetland habitats, due to its potential as forage, shelter, and nesting and reproductive sites [5-7; 14-16; 27; 34; 39; 43; 49; 60-62]. Besides, it can be used as indicator of environmental changes. Vegetation availability and distribution depend on particular conditions representing physical and biological variables such as weather, soil and water

MODELLING OF WETLAND HABITAT AVAILABILITY AND DISTRIBUTION UNDER MANAGEMENT ALTERNATIVES
Montenegro, M.I. (ITC –NRM.ESAM, 2004) - 2 -
that define different habitats types. Aquatic vegetation can be identified by remote sensors and represented on maps or through simulating models what facilitates their monitoring an establishing of current status. In brief, through monitoring aquatic vegetation, is possible to estimate current status of wetland habitats and then, select sound measures to protect them. Currently, a Colombian effort of different national institutions1 is carrying out inventories of the Colombian Andean wetlands. The Fúquene Lake in Colombia is an important relict of habitats for endemic species [23; 69] what makes it a fine case study for this initiative. In spite that this area offers many environmental services for the surrounding human population, is object of negative impacts that are causing its degradation. Consequently, this study analyses the relationship between wetland habitats and three bird species, and identify few eco-hydrological variables, which could estimate variation on their availability and distribution. Subsequently, simulating models were prepared in order to understand current status of wetland habitats, predict potential changes if current conditions continue and assess management alternatives. Use of Geographical Information Systems and Remote Sensing tools were essential during this study as supporting techniques for research and managerial purposes. Finally, recommendations about data requirements are done in order to suggest future improvements to the models or others that can be derived from the area.
1.1. Conceptual Framework
In the following, the overall conceptual framework presented herein is oriented to overview the problem since a general to local approach (Figure 1).
1.1.1. Ecological approach of the Fúquene Lake
According to the Mediterranean Wetlands Initiative (MedWet) [20], wetlands, such as lakes, are classified mainly based on two criteria: the kind of aquatic vegetation and substrate, which influence the distribution of wildlife species, such as birds and mammals. Ecological interactions inside the system can be
1 Fundación Humedales, Alexander von Humboldt Institute for Biological Resources Research, and the Environmental Studies School from Javeriana University

MODELLING OF WETLAND HABITAT AVAILABILITY AND DISTRIBUTION UNDER MANAGEMENT ALTERNATIVES
Montenegro, M.I. (ITC –NRM.ESAM, 2004) - 3 -
altered by external factors, such disturbances provoked by human activities, which modify normal functioning of the lake Food web dynamics, nutrients retaining and humic substance releasing processes, and secondary succession of riparian or wetland vegetation are some of the natural mechanisms that give wetlands their capacity to maintain water quality, fish productivity and in consequence the ecosystem’s ability to provide services to humans. Such mechanisms depend mainly on key components described for the wetland as a system, which are mainly riparian vegetation, game fish, and macrophytes [12].
Figure 1. Conceptual framework of the Fúquene Lake’ case study
The study area of this research involves the Fúquene Lake and nearby watersheds. The lake itself is a lacustrine system with two subsystems defined using a water depth criteria: Limnetic2 and Littoral3 subsystems [33]. Boundary between each other is 2 meters water depth, which represents the maximum depth to which emergent plants normally grow [20]. Four main land cover 2 The Limnetic subsystem includes all habitats lying deeper than 2 meters below low water within the Lacustrine System [33].
3 The Littoral subsystem includes all wetlands in the Lacustrine System extending from the shoreward boundary of the system to a depth of 2 meters below low water, or to the maximum extent
of Non-persistent Emergent if these grow at depth greater than 2 meters [33].

MODELLING OF WETLAND HABITAT AVAILABILITY AND DISTRIBUTION UNDER MANAGEMENT ALTERNATIVES
Montenegro, M.I. (ITC –NRM.ESAM, 2004) - 4 -
classes can be recognized on the lake: Open water, water and submerged vegetation, and prairie of floating plants located mainly in the Limnetic subsystem, and prairie of rooted emergent plants located in the Littoral subsystem. However, for the purposes of this thesis, the last two plant associations have been used as wetland habitats types. Figure 1 describes main biological and environmental variables recognized on this area and their relationships, as well as the impacts provoked by non-sustainable activities, which are deteriorating directly the lake. Management alternatives proposed by several environmental sectors, have been analyzed in order to model potential effects on wetland habitats.
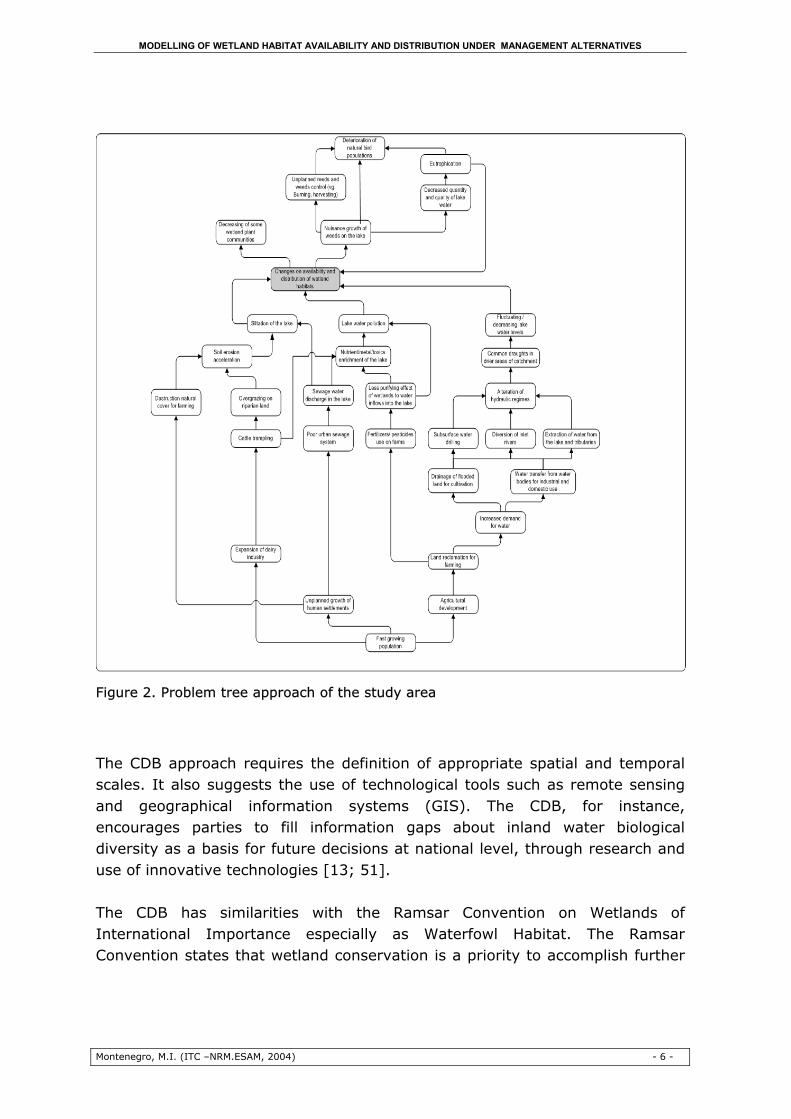
1.1.2. Overview of the problems in the Fúquene Lake
Wetland habitats availability influences the presence of certain wildlife species. When species are threatened by habitat deterioration, looking for significant habitats that can support populations of such species should become on a main priority of study. Many of disturbance events that affect wetland habitats are non-sustainable activities that alter the environmental conditions, which influence habitats availability and distribution. As the Ramsar Convention on Wetlands of International Importance especially as Waterfowl Habitat states “the loss of ecological functions and processes resulting from pollution, water deprivation, and the outright destruction of ecosystems has been a major contributing factor in the rapid decline in the "health" of the world's water resources” [59]. Effects of human impacts on wetlands depend on magnitude, intensity, and recurrence rate of each disturbance process, as well as the current system status and its resilient capacity. Some of the most relevant conflicts between use and conservation of wetlands are based on differences in magnitude [51]: Magnitude 1: Total transformation Conflicts: Farming expansion, alteration of hydraulic regimes, destruction of natural cover; introduction of invasive species; urban area expansion. Magnitude 2: Changes on environmental functions. Conflicts: Changes on hydrological, biogeochemical and biological attributes of wetlands; pollution; building of channels; building of urban areas; non- sustainable use of natural resources

MODELLING OF WETLAND HABITAT AVAILABILITY AND DISTRIBUTION UNDER MANAGEMENT ALTERNATIVES
Montenegro, M.I. (ITC –NRM.ESAM, 2004) - 5 -
Magnitude 3: Punctual disturbance Conflicts: Human disturbance as those described before, but on specific sectors of the wetlands. The Fúquene Lake has been managed as a water resource for irrigation purposes; however, human disturbances have bringing about the deterioration of the lake. Reported disturbances for the Fúquene Lake refer to drainage of marshes and farming expansion on the shores, and sediments and nutrients discharge in the lake, which derive on the increase of reed beds and floating plants [69]. According to the Ministry of Environment [51] the lake as well as other lakes and lagoons of the Andean region requires to adopt immediate measures to be protected. Figure 2 gives a general scheme of the problem in the study area. National and regional management alternatives to solve the current situation of the Fúquene Lake have been proposed. The general tendency is to try to manage the lake on a sustainable way in order to maintain its current role on the irrigation activities, without detriment of its natural functions [51]. Local alternatives propose to minimize current impacts, diminishing of punctual and non-punctual pollution sources, water level management, restoration of natural cover, and aquatic plant’s control [23; 69].
1.1.3. International and National Management framework
Wetlands conservation in Colombia, such the Fúquene Lake, is supported by international and national initiatives adopted by the country, which generally give elements for their restoration and maintenance under the understanding of biological and ecological dynamics. According to the Convention on Biological Diversity (CDB) monitoring, conservation and sustainable use measures should follow an ecosystem approach. This approach consists of a strategy for the integrated management of land, water and living resources and is based on the application of appropriate scientific methodologies focusing on different levels of biological organization. It also recognizes the role of people as an integral component of ecosystems [13].
MODELLING OF WETLAND HABITAT AVAILABILITY AND DISTRIBUTION UNDER MANAGEMENT ALTERNATIVES
Montenegro, M.I. (ITC –NRM.ESAM, 2004) - 6 -
Figure 2. Problem tree approach of the study area
The CDB approach requires the definition of appropriate spatial and temporal scales. It also suggests the use of technological tools such as remote sensing and geographical information systems (GIS). The CDB, for instance, encourages parties to fill information gaps about inland water biological diversity as a basis for future decisions at national level, through research and use of innovative technologies [13; 51]. The CDB has similarities with the Ramsar Convention on Wetlands of International Importance especially as Waterfowl Habitat. The Ramsar Convention states that wetland conservation is a priority to accomplish further
MODELLING OF WETLAND HABITAT AVAILABILITY AND DISTRIBUTION UNDER MANAGEMENT ALTERNATIVES
Montenegro, M.I. (ITC –NRM.ESAM, 2004) - 7 -
objectives established on other international agreements. In fact, on its third article, the Convention states “parties must prepare and apply wetland planning in order to promote conservation of those included on the list of wetlands of international importance”. This objective requires a scientific basis to support decision making based on inventories and monitoring, as well as political guidelines for their management [51; 59]. From the species-related perspective, the IUCN Species Survival Commission (SSC) gather databases on worldwide-threatened species, which consist of comprehensive inventories of the global conservation status of plant and animal species. The IUCN Red List aims to convey the urgency and scale of conservation problems to the public and policy makers, and to motivate the global community to try to reduce species extinction [42; 58]. The IUCN Red list uses a set of criteria4 to evaluate the extinction risk of thousands of species and subspecies through nine categories5 [41; 42]. Although some criteria refer to environmental requirements for habitats, Red lists may have limited value as indicators of changes in the state of the environment, because of the differences on accuracy and precision of the different methods employed in estimating their status [58]. Therefore, management actions require an integrated approach that gathers knowledge basis on species bio-ecology and their habitats, in order to restore threatened species populations. Colombia has confirmed its participation in the Convention of Biological Diversity, as well as the Ramsar Convention. The Fúquene Lake has been proposed as a wetland to be incorporated to the Ramsar list [50]. In addition, Colombia issued lists of national threatened species, where various endemic bird species from the Fúquene Lake are represented [60]. Therefore, regional efforts should be focused on analysing the local problems of the area, and come up with appropriate and sustainable solutions.
4 They are rate of decline, population size, area of geographic distribution, and degree of population and distribution fragmentation 5 Extinct, Extinct in the Wild, Critically Endangered, Endangered, Vulnerable, Near Threatened, Least Concern, Data Deficient, and Not Evaluated.

MODELLING OF WETLAND HABITAT AVAILABILITY AND DISTRIBUTION UNDER MANAGEMENT ALTERNATIVES
Montenegro, M.I. (ITC –NRM.ESAM, 2004) - 8 -
1.2. Aim of the Study
The aim of this research is to develop: A structured spatial model that allows the visualization and description of potential effects of management alternatives on the availability and distribution of wetland habitats used by the bird species Rallus semiplumbeus, Gallinula melanops bogotensis and Cistothorus apolinari apolinari on the Fúquene Lake, Colombia.
1.2.1. Objectives and Research Questions
OBJECTIVES RESEARCH QUESTIONS
Assess the relationship between wetland habitat types and the bird species
Which are the wetland habitats types to be modelled on the study area? What is their current availability and distribution’ status? Does the bird species’ presence differ among habitat types?
Model wetland habitat distribution and availability for the bird species on the study area as a function of eco-hydrological variables
Which environmental variables can determine availability and distribution of wetland habitats on the Fúquene Lake? Is there any trend in time of the eco-hydrological variables from which distribution and availability of wetland habitats can be influenced? What environmental variables can be represented in a model, which are essentially geographic (require spatial analysis) and can be replicable at a site?
Represent and assess the potential effects of management alternatives on habitat availability and distribution used by the bird species on study area.
What are the potential management alternatives proposed for improving the current status of wetland habitats degradation conditions on the study area? What effects in distribution and availability of wetland habitats does the model predict in case each management alternative is implemented? What would be the effect of these predicted changes on the bird species?
Evaluate and select the minimal data set to accomplish the aforementioned objectives.
Were all available data necessary to model potential effects of management alternatives on the study area? Was any data missing that was necessary for the creation of the model? Which additional data would most improve the accuracy of model predictions?

MODELLING OF WETLAND HABITAT AVAILABILITY AND DISTRIBUTION UNDER MANAGEMENT ALTERNATIVES
Montenegro, M.I. (ITC –NRM.ESAM, 2004) - 9 -
1.2.2. General Assumptions
Given that the model requires that the data collected from a small portion of the study area allow extrapolation, the following general assumptions have been adopted:
• The study area behaves as an area ecologically open to water and nutrient flows
• Therefore, distribution and extent of wetland habitats are well represented by the selected environmental variables’ behaviour and interdependency6
• Responses to variables not included in the study are correlated with the selected variables
• Variations of these relationships throughout the study area can be neglected
• The relationships among bird species, wetland habitats and selected environmental variables are invariant in space and time within the study area.
6 Assumption based on Corsi and colleagues [19]
MODELLING OF WETLAND HABITAT AVAILABILITY AND DISTRIBUTION UNDER MANAGEMENT ALTERNATIVES
Montenegro, M.I. (ITC –NRM.ESAM, 2004) - 10 -
2. LITERATURE REVIEW
2.1. Wetland habitats: Definition and classification systems
First at all, a clarification on the meaning of the terms wetland and habitat is needed in order to understand how wetland habitats are defined on this study. Habitat has been described as a place where organisms live independently with the capacity to satisfy their basic needs, such as food, shelter and adequate reproduction sites [19; 44]. In terms of modelling, habitat type has been defined as “an area, delineated by a biologist, that has consistent abiotic and biotic attributes such as dominant or subdominant vegetation” [19]. This definition seems more convenient to map habitats of individual species, since it assumes that environmental factors have a homogeneous and interdependent behaviour throughout the study area. Accordingly, tools such as geographical information systems (GIS) are of advantage for allowing the storage of data on several independent environmental variables that can subsequently, be integrated into a map. [19]. Since a geographical perspective, the Mediterranean Wetlands Initiative (MedWet), defines wetland habitats as “the minimal describing unit of wetland that is easily recognisable and allows recording detailed data of the wetland site”. Then, data recorded for wetland habitats is essential for site management and monitoring [20; 33]. This definition can be compared with the one given by Block and Brennan [44] in which macrohabitat refers to landscape-scale features such as serial stages or zones with specific vegetation associations. Indeed, attributes that allow describing habitats according to the MedWet methodology are hydrology, soil and vegetation. Furthermore, nutrients, water depth, and sediments may complement a better description of wetland habitats. MedWet also states that the specialization level of habitats depends mainly on vegetation types as well as its extent and distribution [33]. Now, wetland definition given by Cowardin [21] meets “lands transitional between terrestrial and aquatic systems where the water table is usually at or near the surface or the land is covered by shallow water”. This definition includes a higher range of possible habitats than other classification systems that use with two basic criteria: vegetation and soil [65]. Consequently,

MODELLING OF WETLAND HABITAT AVAILABILITY AND DISTRIBUTION UNDER MANAGEMENT ALTERNATIVES
Montenegro, M.I. (ITC –NRM.ESAM, 2004) - 11 -
MedWet adjusted and established the following criteria to define wetland habitats: i) Habitats where, at least periodically, land predominantly supports hydrophytes plants; ii). The substrate is predominantly undrained hydric soil; iii). The substrate is non-soil and is saturated with water, or covered by shallow water at some time during the growing season of each year [33]. At this point, the classification of wetland habitats is an important topic of wetland inventories in a systematic and hierarchical approach. Several international classification initiatives could be named that follows the adjusted basic structure of Cowardin’s classification (e.g. Ramsar Convention [59], CORINE project [32], UNESCO and the Mediterranean Wetland Initiative (MedWet) [20; 33]). The wetland classification proposed by Cowardin and colleagues [21] determines three main hierarchical categories, starting from Systems, as the highest level, followed by Subsystems and Classes. Minor subdivisions can be added if variables such as species dominance, substrate and environmental modifiers are incorporated as classification criteria, besides hydrological, geomorphologic, chemical and biological factors. In brief, it allows describing ecological units with homogeneous natural attributes and arranges them in a hierarchical system. Hence, inventories are becoming a support tool for characterizing and establishing priority sites for conservation or management of wetlands [21; 33]. Independently of the selected system for classifying wetlands, the scale of the study must be determined. The scale, according to Corsi and colleagues [19] is a central concept in developing species distribution models with GIS. Certainly, scale circumscribes the extent of the information and amount of data that can be shown. The scale not only determines the biological extent to which a distribution model can be applied, but also affects the use that can be made of any model. For purposes of wetland conservation, MedWet establishes three hierarchical levels: catchment’s area, site and wetland habitat [33]. Wetland inventories have been developed either from an ecosystem perspective [37] or a related-species perspective through species selected as indicators [46; 54; 73]. In this regard, some authors agree that bird assemblages often reflect land use conditions better than other organism groups [9; 36; 46; 48; 73]. Whatever approaches are being used to assess wetland habitats, managers barely count with reliable indicators, measurement standards, and proper scales for wetland monitoring [73]. As a result, some authors suggest wetlands should be considered as a system ecologically closed to water and nutrient flows [37]. This assumption allows minimizing the
MODELLING OF WETLAND HABITAT AVAILABILITY AND DISTRIBUTION UNDER MANAGEMENT ALTERNATIVES
Montenegro, M.I. (ITC –NRM.ESAM, 2004) - 12 -
external forces to the basin and also is broad enough to satisfy the home range and habitat requirements of target species. Other authors consider that political jurisdiction can help to establish the choice of boundaries [26]. Following the conceptual framework chart shown on Figure 1, two main categories of biological and eco-hydrological variables are incorporated into the modelling process. Firstly, biological variables that involve the composition of aquatic vegetation as a main indicator of wetland habitats’ behaviour, and the bird species that inhabit in the area. Secondly environmental variables that determine water balance (e.g. water in and outflow on the surface, evapotranspiration, direct rainfall and infiltration) as well as nutrient and sediment inflows and outflows.
2.1.1. Biological variables
This study selected three bird species and wetland habitats as the biological variables to be affected by management alternatives. Herein, a general description of these variables is made.
2.1.1.1. Bird species
Diversity, richness, and rarity of plants and animals are parameters that are often used to evaluate the ecological quality of an ecosystem and its value for nature conservation. Biological parameters can also be used as indicators of the current status of an ecosystem and for the monitoring the change of environmental conditions [25]. Commonly used indicator species groups for wetland fauna are birds, fish, and aquatic macroinvertebrates. In this study three focal bird species Rallus semiplumbeus (rails), Cistothorus apolinari apolinari (wrens) and Gallinula melanops bogotensis (gallinules) are considered in order to determine their relation with potential effects of human interaction on their wetland habitats based on simulated management alternatives. They are endemic species of this region and were declared as threatened species in 2001 by the Ministry of Environment [35]. All of them require urgent measures of protection.

MODELLING OF WETLAND HABITAT AVAILABILITY AND DISTRIBUTION UNDER MANAGEMENT ALTERNATIVES
Montenegro, M.I. (ITC –NRM.ESAM, 2004) - 13 -
A detailed literature review about taxonomic, biological and ecological characteristics of each species is provided in Appendix 1. However, a brief overview of all three species will be made in this section. Rallus semiplumbeus P. L. Sclater, 1856 and Gallinula melanops bogotensis Chapman, 1914, belong to the family RALLIDAE (GRUIFORMES), which meet cosmopolitan species that usually inhabit all types of terrestrial, estuarine and littoral wetland habitats (Appendix 1). The structure of the vegetation and the nature of the substrate may be the most important factors that determines their distribution [27]. Both species are endemic of the wetland complex on East Andes of Colombia [5; 27; 34; 60], and due to their very secretive habits, R. semiplumbeus require heterogeneous habitat with floating vegetation areas mixed with tall and dense vegetation areas, that provide them with refuge, feeding and nesting areas [60]. Whereas, G. melanops bogotensis inhabit ponds, ditches, marshes, lagoons and lake margins with often extensive floating -leaved vegetation [5; 27; 34; 60]. Both species are territorial and usually find living in pairs. Their reproductive habits are not well documented, but it seems they prefer reeds and other marginal tall vegetation to build their nests [27; 34; 60]. R. semiplumbeus feeds primarily on aquatic invertebrates and insect larvae, but also worms, mollusks, dead fish, frogs, tadpoles and plant material [5; 27]. G. melanops bogotensis, usually feeds mostly by swimming, picking food from floating vegetation or sometimes from water; seldom walks on marsh vegetation or on land [27]. Both species are basically threatened by habitat deterioration. All major wetlands habitats on the region are seriously threatened mainly by drainage of marshes but also by agricultural encroachment, erosion, pollution, hunting, cattle trampling, burning, and harvesting of reeds, [5; 27]. Among others, these species have suffered enormous habitat loss and only few suitable characteristically vegetated marshes remain [27; 60] R. semiplumbeus has been declared as Endangered species at global and national level [27; 60]. Scientists estimate that 88% of their habitat has disappeared. Gallinula melanops bogotensis has been declared as Critically Endangered species by the Colombian Government due to an estimated reduction of 95% of its original habitat (1988-1998) [60].

MODELLING OF WETLAND HABITAT AVAILABILITY AND DISTRIBUTION UNDER MANAGEMENT ALTERNATIVES
Montenegro, M.I. (ITC –NRM.ESAM, 2004) - 14 -
The third species is Cistothorus apolinari apolinari, Chapman, 1914, which belongs to the family Troglodytidae (Order Passeriformes) [5; 60; 67] (Appendix 1). This species is also endemic from the East Andes of Colombia (Boyacá, Cundinamarca), found between 2450 - 2700 m.a.s.l, and is a fairly common species of the Fúquene Lake [5; 34; 60; 61; 67]. C. apolinari apolinari inhabits in areas with tall marsh vegetation, principally confined to bulrush (Scirpus californicus) and cattails (Typha latifolia) in marshes [34], [60; 61; 67]. It is described as a resident and territorial species, [60] which has secretive habits. [5], [34; 61; 67]. Its foraging behaviour appears highly stereotyped and adapted to exploiting the bulrush substrate [5; 34; 67] Its natural population is being threatened by habitat deterioration. The same causes as for the aforementioned species (i.e. drainage of marshes, burning of wetlands for agriculture, cattle trampling, erosion, pollution) affect their distribution across the area. [5; 60; 61; 67]. It has been declared as an Endangered species at global and national level [5; 60]
2.1.1.2. Wetland habitat types
Distribution of wetland habitats depends not only on their hydrological regime, but also on the composition and structure of vegetation. In particular, a vegetation type influences distribution of certain fauna and flora species. Also, it can respond differently to disturbance events [25]. Hence, different vegetation types also represent a range of habitats for different species. Plant species can be used as indicators of environmental conditions. Plants, as primary producers, have an important effect on the ecosystem functioning in wetlands. Because of this, detection of the spatial distribution and temporal change of plant communities can provide important information about the effects of environmental factors relevant to a certain wetland [25]. In addition, water table position in wetland soils undoubtedly exerts a major influence upon the distribution and performance of plant species and vegetation composition [72]. As has been noted, wetland classification systems are mainly based on the distinction of vegetation types. External appearance of plants is a result of

MODELLING OF WETLAND HABITAT AVAILABILITY AND DISTRIBUTION UNDER MANAGEMENT ALTERNATIVES
Montenegro, M.I. (ITC –NRM.ESAM, 2004) - 15 -
structural components such as biomass, biological and floristic typology, which altogether determine their physiognomy [64]. According to Schmidt [64], aquatic vegetation can be classified on physiognomic units known as formations. A Plant formation is defined by UNESCO [1] as “an ecological grouping of vegetation units based on broadly defined environmental factors such as elevation and hydrologic regime, and additional structural factors such as crown shape” Beard [63] states that formation is an “ecological grouping of plant associations dominated by biotypes7 and physiotypes8”, which indicate similarity to the “essential habitat”. Each formation describes the bio-typological structure of a certain plant community as an expression of its environment. In other words, a plant formation is defined by differences and similarities on morphologic and ecological attributes among species [63; 65]. Although it is not the intention here to deepen on systematic plant classification, the adopted definition for wetland habitats concerned by this study is based on two main approaches: ecological factors that influence distribution and availability of wetland habitats, and morphologic and physiognomic characteristics of plants. Based on Cowardin [21], MedWet [33] and Schmidt [65], the Fúquene Lake is a lacustrine system, given that it includes wetland habitats situated in a topographic depression, and its area exceeds 8 ha and has aquatic vegetation [33; 65]. Basically two main plant formations are identified in this study. These group the following plant communities. The first formation is the Prairies of Rooted Emergent Plants, which is dominated by small herbs (i.e. Rumex conglomeratus, Polygonum hydropiperoides, Bidens laevis); medium grasses (Typha latifolia); and rushes (Scirpus californicus). The second one is the Prairies of Floating Plants, which is composed by nomadic plants without roots or floating roots, dominated mainly by Eichhornia crassipes. [65]. This classification system for aquatic vegetation allows visualizing the relation between both approaches (i.e. ecological & structural approaches), and facilitates the understanding of the distribution of plant communities. However, Schmidt stated that this physiognomy – based classification requires detailed in situ floristic studies at smaller scales. Moreover, wetland vegetation
7 Biotype refers to plants that have similar morphological and biological structure, as well as, similarities on their way to adapt to ecological environments [63] 8 Physiotype refers to growing systems of plants. It depends on their spatial structures and particular shapes of their biological components [63].
MODELLING OF WETLAND HABITAT AVAILABILITY AND DISTRIBUTION UNDER MANAGEMENT ALTERNATIVES
Montenegro, M.I. (ITC –NRM.ESAM, 2004) - 16 -
classification remains difficult due to seasonal variations and uncertainty in the distinction of plant biotypes [64]
2.1.2. Environmental variables
2.1.2.1. Water balance
The structure, metabolism and biogeochemistry of a lake are strongly linked to the balance of water inflows and outflows. A lake reflects current conditions of nearby watersheds that drain into it. External factors that define water, nutrient and sediment inflows and outflows, as well as the ecological dynamic in the lake (i.e. nutrient cycling, food web) define the particular behaviour for each lake. [71]. In other words, biota of a wetland is highly affected by water and nutrient dynamics [25]. The balance of inflow and outflow determines the water stage, consequently the water depth. The spatial variability of the water depth and its temporal change are the main factors influencing wetland habitat types, hence diversity of the flora and fauna. Therefore, for the evaluation of the habitat quality, data on the temporal variability of the water depth should be a priority [25]. The water balance of a lake can be summarized by the following formula [25; 71]
dV/dt = (R + P + Gi) – (D + E + Go) Where dV = Rate of change of the lake volume (V) dt = Rate of change of time R = Surface runoff from the drainage basin P = Precipitation directly on the lake surface Gi = Groundwater seepage below the surface of the lake and groundwater entering
lake as discrete springs D = Flow through surface outlet E = Evaporation from the lake surface and evapotranspiration (from emergent and
floating-leaved aquatic macrophytes) Go = Loss to groundwater
MODELLING OF WETLAND HABITAT AVAILABILITY AND DISTRIBUTION UNDER MANAGEMENT ALTERNATIVES
Montenegro, M.I. (ITC –NRM.ESAM, 2004) - 17 -
In other words, water balance is expressed as the difference between the water inflow and outflow rates and the change of the lake volume (V) through time (t) [71]. As it was mentioned before, the selection of an adequate spatial and temporal scale is important. Then, catchment and subcatchment areas are distinguished in order to identify the origin of the inflowing water, flow paths in the landscape and the destination of the water leaving the wetland [25]. The stratification and hydrological mixing patterns of the water column affect the distribution and availability of nutrients, which in consequence turn affect the levels of productivity of the lake ecosystems [71]. Wide amplitude fluctuations are particularly associated with some lake shoreline and river margin environments and can have considerable repercussions on vegetation composition and zonations, and sometimes even species richness [72].
2.1.2.2. Nutrients and mineral compounds
In many wetlands, the inflowing water provides a major mechanism for the import of chemical elements. Variation in the chemical composition of water sources controls species distribution and vegetation composition in wetlands, and thus, water quality can be of equal ecological importance than water quantity. [72]. Allochthonous inputs are largely transported to the lake in particulated and specific water-soluble compounds. Other inputs are those entering form atmospheric surface-water sources. These compounds, particularly nutrients, influence the autochthonous development and productivity of micro- and macro-vegetation within the lake [71]. Nutrients inputs and losses occur as consequence of the interaction of geological, meteorological and biological vectors. The cycling or exchange of nutrients (i.e. nutrients from living and dead organic matter) is influenced by water movements within the lake basin [71]. According to Davidson and colleagues [26], the mass balance is used to evaluate wetland performance. It is described for the formula:
Σ(Qin * Cin) – Σ(Qout * Cout) Where

MODELLING OF WETLAND HABITAT AVAILABILITY AND DISTRIBUTION UNDER MANAGEMENT ALTERNATIVES
Montenegro, M.I. (ITC –NRM.ESAM, 2004) - 18 -
Qin = water inflows (including groundwater inflow and precipitation) Cin = water inflow concentrations Qout = water outflows (including infiltration, groundwater outflow and evapotranspiration)) Cout = water outflow concentration The difference between import and export represents the amount of the substance that is removed, trapped or retained in the wetland [25]. Specifically talking about nutrients, studies suggest that the limited availability of nitrogen (N), phosphorus (P) and potassium (K) restrict plant growth in wetlands, although K limitation seems to be the least common [72]. Wetland management, then, should consider taking detailed measurements of these nutrients in order to describe its particular performance. For instance, total nitrogen removal represents the overall efficiency of nitrogen removal of the wetland, including sedimentation of particulated nitrogen. In diffuse nitrogen pollution from agriculture, nitrogen exists in the form of nitrate. This is a preferable form, since it is readily denitrified under anaerobic conditions where an utilisable carbon source is present. It can also be retained in wetlands by uptake from plants. A nitrate balance, then, indicates if denitrification is an important nitrogen sink in the wetland. Ammonium can be significant if the inflow is polluted from wastewater, or agricultural animal production. It can also be produced from mineralization of organic matter. Nitrite is a poisonous nitrogen compound, not found in high concentrations in wetlands [25]. Wetlands play an important role in the nitrogen cycle. The main process to reduce nitrate to nitrogen gas is called denitrification. However it is not the only process and an important portion of nitrate can be untaken by plants and microbes. In addition, aerobic and anaerobic microbial processes can transform ammonium to nitrate and vice versa, in order to recycle nitrogen within the same system [25]. Furthermore, the amount, production rate and quality of the organic carbon source in a wetland are crucial for the sustainability of denitrification. Denitrifying bacteria need carbon from organic matter in the soil. Therefore a carbon balance can help to evaluate the long-term performance of the wetland.

MODELLING OF WETLAND HABITAT AVAILABILITY AND DISTRIBUTION UNDER MANAGEMENT ALTERNATIVES
Montenegro, M.I. (ITC –NRM.ESAM, 2004) - 19 -
Other nutrient that calls for revision is phosphorous, a limitant nutrient, that is pH and reduction-oxidation sensitive and hence very critical for the retention performance of the wetland [26]. Phosphorus loadings vary greatly with patterns of land use, geology and morphology of the drainage basin, soil productivity, and in relation to contamination of surface and groundwaters from human activities. [71]. Then, some indicator elements of nutrient dynamics, such oxygen concentration and reduction-oxidation (redox) potential, affect also phosphorous sorption. Temperature influences microbial processes, and may explain seasonal differences in removal efficiency. The pH and conductivity measures as well as the observation for smell of sulphide and bubble formation can, if interpreted correctly, provide additional information about processes and water flow paths [25]. Water movement can have a significant effect on the character of wetland environments and the composition of wetland vegetation. Several studies have shown that zones of moving water within wetlands tend to have higher redox potentials, which may be associated with a lower availability of phytotoxins with redox-related solubilities (Fe2
+, Mn2+, S-); otherwise reducing conditions found in wetland soils can increase the availability of these elements [72].
2.1.2.3. Sediments
Greater productivity of small shallow lakes is directly correlated with higher water-sediment interface area per water volume [71]. In wetlands the characterization of soils and sediments is necessary to understand wetland dynamics and nutrient cycles. Deposits allow rapid colonization and expansion of emergent macrophytes in a lakeward direction in an accelerating manner over periods of years. Deeper littoral areas (i.e. < 1-2 m) are often colonized by submerged vascular plants and are less influenced by surface-water currents, which tend to remove residues. In some lakes, submerged macrophytes growing in shallow areas can accelerate sediment accretion. Development of emergent and floating-leave rooted macrophytes is further enhanced by the presence of nutrients (C, N, P, CO3
-2), in the sediments. Littoral sediment includes a surficial store of slowly remineralised phosphorus that sustains the rooted macro-vegetation [71]. A balance of suspended solids in the lake is made by measuring the concentration of particles in water inflow and outflow [25].

MODELLING OF WETLAND HABITAT AVAILABILITY AND DISTRIBUTION UNDER MANAGEMENT ALTERNATIVES
Montenegro, M.I. (ITC –NRM.ESAM, 2004) - 20 -
2.2. Wetland dynamic and disturbance events
Natural processes allow wetland dynamic to be resilient in the faces of disturbance. Disturbances produce hydrological and chemical fluctuations driven for instance by weather, routine fluctuations of interacting populations, or fires among others. There are natural mechanisms that act against these disturbances, such as food web dynamics (e.g. plant remediation, plant untaken), nutrients retaining and humic substance releasing processes, and secondary succession of riparian or wetland vegetation. They altogether give the wetland capacity to maintain water quality, fish productivity and other ecological functions. Such mechanisms depend mainly on key components such as riparian vegetation, game fish, and macrophytes [12] [25]. On the other hand, processes such evapotranspiration and successional development of wetlands are influenced by vegetation in great extent [71]. Meanwhile hydrological events such as flooding episodes and change on water depth can determine species distributions. Water regime tolerances of some wetland plants may be partly determined by the nutrient status of the substratum in which they grow. Very high concentrations of nutrients may be directly detrimental to the metabolism and growth of some wetland species; however, the identification of exact chemical limits for particular plant species or communities has generally proved elusive [72]. Another example, related with the nutrients cycle, refers to the structural and physiological adaptations of emergent plants, that not only allow them to tolerate the hostile anaerobic sediments, but to also take advantage of the relatively abundant nutrient and water conditions of their habitats. Nutrients imported with influent water to the zone of emergent macrophytes are assimilated largely by the microflora, which occur on and among the sediments and detrital particles of organic matter. These nutrients are recycled within the microflora associated with particulate organic detritus, largely from aquatic plant, and are re-assimilated by the emergent macrophytes through their rooting tissues [71]. Unfortunately, these natural processes that determine the normal dynamics of wetlands are threatened by human activities, owing mainly to ongoing drainage of marshes, farm expansion, pollution, and over-exploitation of their resources [12; 51; 59]

MODELLING OF WETLAND HABITAT AVAILABILITY AND DISTRIBUTION UNDER MANAGEMENT ALTERNATIVES
Montenegro, M.I. (ITC –NRM.ESAM, 2004) - 21 -
If the normal dynamics of a wetland, such as a lake, is altered, many of the processes defined previously, will also be affected. For instance, pollutants from agriculture or urban development are considered the most common causes of lake degradation. Pollutants discharge produces eutrophication, which along other non-sustainable activities (e.g. over fishing, riparian vegetation clearance), alter the food web and the ecological processes. Resilient mechanisms of the wetland can mitigate the effects of distribution, however, if the control processes were broken down, disturbances would be translated on persistent eutrophication [12; 25].
2.3. Models as a tool for conservation management
Ecological models, understood as simplified representations of the reality, allows researchers to have a better understanding of the species biology, assess their geographic distribution and to come up with specific management actions. Therefore, even tough conservation will depend on the objectives of each particular research, its main aim deals with minimize reduction of population distribution of a certain species [19]. As expressed by Colson and Bruyn [17], many decision support methods integrate models in order to help decision makers to select or reject options on the basis of evaluation according to several criteria. With the appearance of geographical information systems (GIS) and Remote Sensing (RS) tools it has become possible to handle large amounts of spatial data, making analysis of spatial relationships possible. These tools increased the number of variables that can be considered in an analysis and the spatial extent to which the analysis can be carried out [19]. The GIS-based models based on species distribution distinguish two approaches. The deductive approach uses known species’ ecological requirements to extrapolate suitable areas from a combination of environmental variables expressed on a GIS database. The inductive approach is applied when the species - environment relationships are not known a priori, so it implies the derivation of the ecological requirements of the species from locations in which the species occurs [19] Both inductive and deductive models can be further classified based on criteria to describe the species – environment relationship. For instance, descriptive models generally are based on very few environmental variable layers. They tend to describe presence and absence in a deterministic way, but they neither define the relative importance of one variable over another nor state the
MODELLING OF WETLAND HABITAT AVAILABILITY AND DISTRIBUTION UNDER MANAGEMENT ALTERNATIVES
Montenegro, M.I. (ITC –NRM.ESAM, 2004) - 22 -
degree of association among variables. Whereas, analytical models tend to estimate the relative importance of the different environmental layers considered in the analysis, hence moving toward and objective combination of environmental variable layers [19] From the objective-oriented perspective, different approaches have been developed to tackle conservation objectives based on a better representation of species. Hess and Terry [38] established that focal species collectively represent a variety of landscape characteristics that will encompass the needs of many other species [58]. Paoletti [57] used indicator species for predicting changes on environment. Other studies have been focused on modelling population dynamics [30; 41]. For instance, Population Viability Analysis (PVA), as a quantitative analysis technique, includes models that simulate the dynamics of a population or metapopulation9 [3; 22; 30; 47]. However, deficiencies on these approaches appear when data is non-updated, restricted, fragmented or non-replicable [2; 10]. Through a combination between decision analyses and simulation models, it is possible to compare management alternatives under ecological uncertainty. For instance, Dreschler [30] identified the effects of management actions by using combined techniques with just the available data. Other studies have worked on extent of occurrence10 or area of occupancy (AO)11 [47], whose variables and parameters are modelled under different scenarios. Model design can be based on expert knowledge or algorithms that feed them through a combination of environmental variables [10; 22]. Additional studies have used a combination between mathematical and conceptual approaches, and multicriteria methods. However, this new approach requires of a gradual process of identifying and involving the stakeholders in order that models can be closer to the real situation [2; 22; 28; 66]
9 Subpopulations are geographically or otherwise distinct groups in the population between which there is little demographic or genetic exchange (typically one successful migrant individual or gamete per year or less). The collection of these subpopulations is called metapopulation [2; 41] 10 Extent of occurrence is defined as the area contained within the shortest continuous imaginary boundary, which can be drawn to encompass all the known, inferred or projected sites of present occurrence of a taxon, excluding cases of vagrancy. [41] 11 Area of occupancy is the area within its ‘extent of occurrence’ that is occupied by a taxon, excluding cases of vagrancy. It is the smallest area essential at any stage to the survival of existing populations of a taxon [41]

MODELLING OF WETLAND HABITAT AVAILABILITY AND DISTRIBUTION UNDER MANAGEMENT ALTERNATIVES
Montenegro, M.I. (ITC –NRM.ESAM, 2004) - 23 -
3. STUDY AREA
3.1. Location
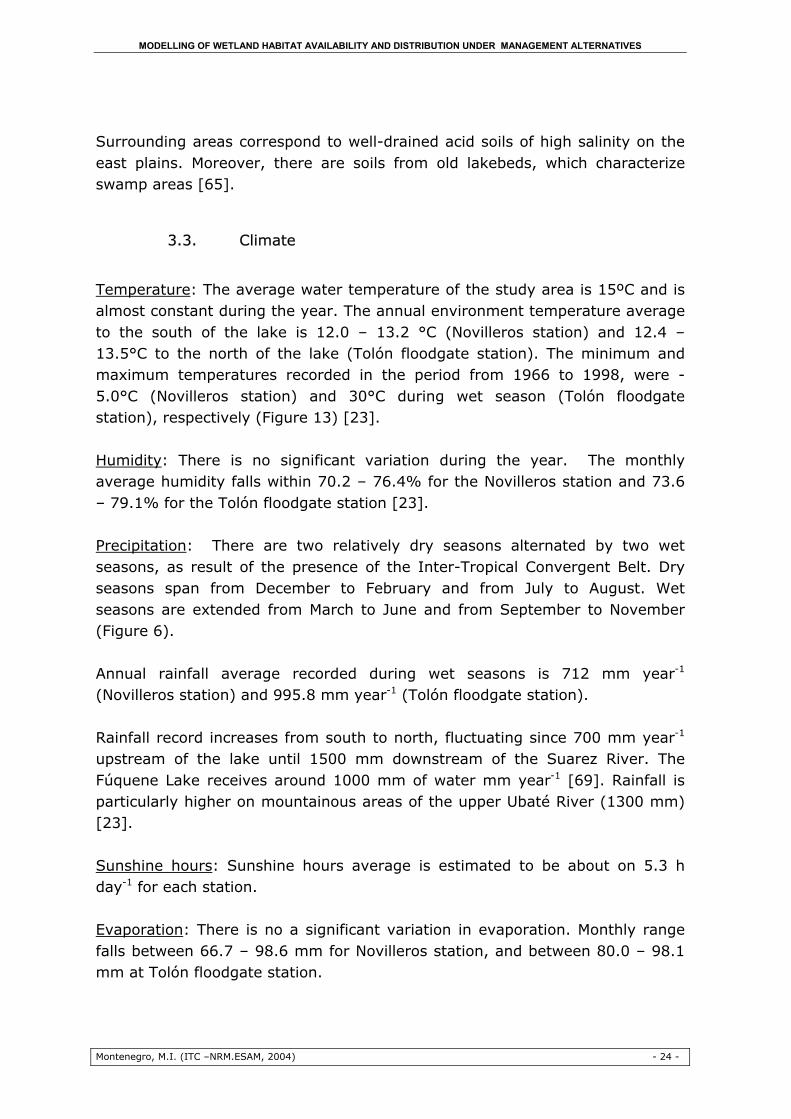
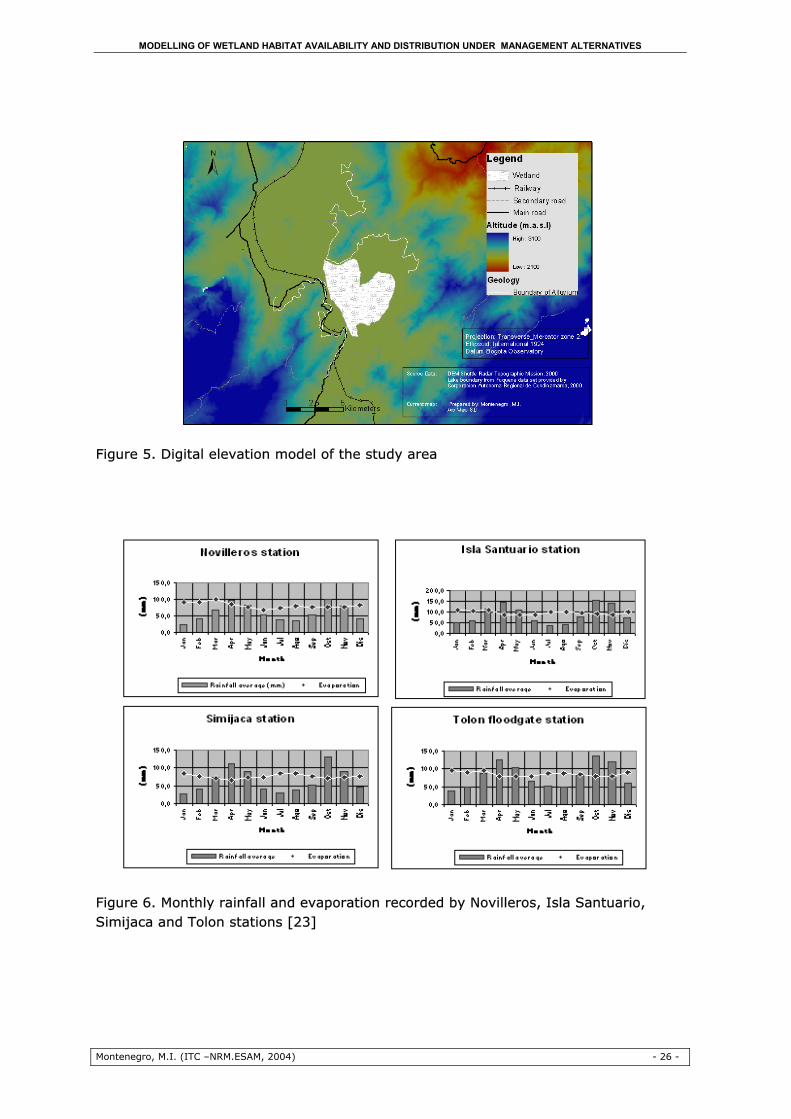
The study area is represented for the Fúquene Lake and nearby watersheds with a boundary that is extended between 5°35’37.29’’ N 73°54’02.86’’W and 5°19’24.30’’ N 73°35’07.88’’W (Figure 3). The Fúquene Lake is one of the biggest wetlands on the Cundinamarca and Boyacá high plains of Colombia. It has 3260 ha and an average water depth of 1.5 m (Figure 5). It belongs to the basins of the Ubaté and Suárez rivers and is located in the Colombian Eastern Cordillera at 2539 m.a.s.l and 100 km north of the capital city of Colombia, Bogotá [11].
3.2. Soils and geological features
This area has sedimentary rocks from the Cretaceous Age with syncline and anticline formations oriented since Northeast to Southwest. The geological formations described for this area are [69]: Simití formation (Kis). Shales and black siltstones with sandstones alternate with thin shale layers. This formation is associated with the generation of acid soils on mountainous landscapes surrounding the lake. Chiquinquirá formation (Kichi). Sandstone layers of fine-grained and black shales. This formation is associated with acid soils characterized by their low fertility and texture that ranges from fine to medium, located to the west side of the lake. Surface soils, well-drained and low permeability. In general, they are soils prone to erosion. Alluvium and Colluvium (Qal): Lacustrine and riverside siltstone clay, conformed by glacial deposits and terraces of non – consolidated material surrounding the lake.
MODELLING OF WETLAND HABITAT AVAILABILITY AND DISTRIBUTION UNDER MANAGEMENT ALTERNATIVES
Montenegro, M.I. (ITC –NRM.ESAM, 2004) - 24 -
Surrounding areas correspond to well-drained acid soils of high salinity on the east plains. Moreover, there are soils from old lakebeds, which characterize swamp areas [65].
3.3. Climate
Temperature: The average water temperature of the study area is 15ºC and is almost constant during the year. The annual environment temperature average to the south of the lake is 12.0 – 13.2 °C (Novilleros station) and 12.4 – 13.5°C to the north of the lake (Tolón floodgate station). The minimum and maximum temperatures recorded in the period from 1966 to 1998, were -5.0°C (Novilleros station) and 30°C during wet season (Tolón floodgate station), respectively (Figure 13) [23]. Humidity: There is no significant variation during the year. The monthly average humidity falls within 70.2 – 76.4% for the Novilleros station and 73.6 – 79.1% for the Tolón floodgate station [23]. Precipitation: There are two relatively dry seasons alternated by two wet seasons, as result of the presence of the Inter-Tropical Convergent Belt. Dry seasons span from December to February and from July to August. Wet seasons are extended from March to June and from September to November (Figure 6). Annual rainfall average recorded during wet seasons is 712 mm year-1 (Novilleros station) and 995.8 mm year-1 (Tolón floodgate station). Rainfall record increases from south to north, fluctuating since 700 mm year-1 upstream of the lake until 1500 mm downstream of the Suarez River. The Fúquene Lake receives around 1000 mm of water mm year-1 [69]. Rainfall is particularly higher on mountainous areas of the upper Ubaté River (1300 mm) [23]. Sunshine hours: Sunshine hours average is estimated to be about on 5.3 h day-1 for each station. Evaporation: There is no a significant variation in evaporation. Monthly range falls between 66.7 – 98.6 mm for Novilleros station, and between 80.0 – 98.1 mm at Tolón floodgate station.
MODELLING OF WETLAND HABITAT AVAILABILITY AND DISTRIBUTION UNDER MANAGEMENT ALTERNATIVES
Montenegro, M.I. (ITC –NRM.ESAM, 2004) - 25 -
Wind speed and direction: The highest speeds were recorded between June and August. The annual average speeds are 1.3 m s-1 (Novilleros and Tolón stations), 2.2 m s-1 (Simijaca station at west – side of the lake). Southeast winds are predominant in the area except on Novilleros station, where the dominant speed is 1.3 m s-1 (Figure 13).
Figure 3. Location of study area in Colombia, South America
Figure 4. Land cover classification of the study area
MODELLING OF WETLAND HABITAT AVAILABILITY AND DISTRIBUTION UNDER MANAGEMENT ALTERNATIVES
Montenegro, M.I. (ITC –NRM.ESAM, 2004) - 26 -
Figure 5. Digital elevation model of the study area
Figure 6. Monthly rainfall and evaporation recorded by Novilleros, Isla Santuario, Simijaca and Tolon stations [23]

MODELLING OF WETLAND HABITAT AVAILABILITY AND DISTRIBUTION UNDER MANAGEMENT ALTERNATIVES
Montenegro, M.I. (ITC –NRM.ESAM, 2004) - 27 -
3.4. Hydrological regime.
The Fúquene Lake is located on the central part of the Ubaté - Chiquinquirá Valley at 2540 m.a.s.l. The lake covers an area of 3260 ha, and has just has one outlet river: the Suarez river. The lake gathers water from the Ubaté and Fúquene Watersheds (270 km2), in addition to the watersheds of the Upper Ubaté, Suta, Cucunubá and Lenguazaque Rivers, covering a total drainage area of 993 km2. The Fúquene Lake drains into the Suarez River, which is also fed by the Susa and Simijaca Rivers. The Tolón floodgate controls the water level, which is located at 18 km downstream [23] Other rivers which drain directly into the lake are the Honda, Tagua, and Simiento streams, which get into the lake independently from the east side, while the Fúquene river drains from the west side. Rivers usually reach their maximum discharge on May and November, dropping to their lowest values on February and August. The calculated annual average discharge for the Ubaté River is 3.9 m3 s-1 (Colorado station) and 10.2 m3 s-1 to the north of Tolón floodgate. However, the water level of the Fúquene Lake tends to remain constant due to the hydro-morphology of the first portion of the Suarez River [23](Figure 5). Runoff: The runoff coefficient of the Ubaté River is 0.4, which is higher than the runoff coefficient of the Suta and Lenguazaque watersheds (0.2). Water flow: During wet seasons, the average discharge is 6.21 m3 s-1 at Colorado station and 16.12 m3 s-1 to the north of Tolón station. On dry seasons the calculated values were 2.27 m3 s-1 and 4.90 m3 s-1, respectively. Water level: The Fúquene Lake has maintained an average water level of 2539 m.a.s.l from 1968 to 1998. The highest reported value was 2540.5 m.a.s.l and the lowest reported value was 2538.0 m.a.s.l. The water stage fluctuation is between 15 and 40 cm (Figure 7).

MODELLING OF WETLAND HABITAT AVAILABILITY AND DISTRIBUTION UNDER MANAGEMENT ALTERNATIVES
Montenegro, M.I. (ITC –NRM.ESAM, 2004) - 28 -
3.5. Fauna and Flora
The lake is surrounded by a high Andean sub-xerophytic enclave, which that brings shelter to 249 species of fauna and flora registered so far. Several endemic species inhabit the area, comprising 25 species of migratory birds [50; 69] According to Schmidt [65], 16 plant formations can be identified for the Fúquene Lake. Even though, the lake represents 40% of known plant richness on the Bogotá Savannah and Ubaté River plains, just seven plant formations from the 16 mentioned above, are considered as frequents or abundant formations. The Fúquene Lake is a lacustrine system characterized by a limnetic subsystem with non-consolidated soils, aquatic beds or prairies of submerged vegetation (Egeria densa and Potamogeton illinoensis). Moreover, there are nomadic prairies of Eichhornia crassipes associated with Bidens laevis and Hydrocotyle ranunculoides. The littoral subsystem has non-consolidated soils, aquatic beds and swamps of emergent vegetation. It is also possible to find emergent nomadic prairies with E. crassipes, and submerged vegetation (E. densa). Tall reeds are usually located on the littoral subsystem and are composed by plant associations of grasses (i.e. dominated by Typha latifolia), rushes (i.e. dominated by Scirpus californicus) and herbs (i.e. dominated by plants from the Cyperaceae family).
Figure 7. Historical changes on water level of the Fúquene Lake [23]
Two species were introduced in this area: Eichhornia crassipes and Egeria densa. Eichhornia crassipes seems to have established recently on the area, but that can be attributed to scarce availability of inventories. Egeria densa
MODELLING OF WETLAND HABITAT AVAILABILITY AND DISTRIBUTION UNDER MANAGEMENT ALTERNATIVES
Montenegro, M.I. (ITC –NRM.ESAM, 2004) - 29 -
represent another introduced species, which has invaded many water bodies on Cundinamarca and Boyacá plains [65].
3.6. Land use
The lake surroundings are used for economic activities, such as agriculture and dairy farming. Fishing, handicraft manufacturing and hunting are other economic activities taking place but at smaller scale. However, inadequate management activities such as cattle overstocking, drainage of marshes for agricultural production, urban development, pollution, and introduction of alien species have severely degraded the lake and its adjacent areas [29; 68]. Dairy cattle rising are the main socio-economic activity in the area. It has been calculated that the irrigated area currently supports 50,000 livestock heads (2.7 heads/ha pasture). Plant production is less important in the area, but it represents another important income for the settlements; some of the products are potatoes, corn, wheat, and peas. Other activities such as mining are developed in the area as well, but they are not significant for the regional economy [23]. Although the economic income of the region in terms of farming activities does not seem to be significant, this area contributes with 7% of the Gross National Product of Colombia (GNP). Most of the area is irrigated by the CAR irrigation system12, which extends on the plains surrounding the lake. It covers 20 millions ha and is divided on 15 irrigation blocks, which just irrigate a total area of 22 thousand ha. The surroundings of The Fúquene Lake belong to an irrigation block, whose main water sources are the nearby watersheds and the lake itself. Five additional irrigation blocks are adjacent to the Fúquene irrigation block (i.e. Cap –2; Marino-Ubaté; Honda; Susa, Suárez) (Figure 14). The most common land cover of the study area corresponds to flat areas pastures; however it is possible to observe pastures on hillsides, shrubs, scrub and herbaceous vegetation and forest on steep areas near to the lake. There is a gradual erosion process on the area that is currently studied and management by the regional authority (Figure 4).
12 System elaborated by the Regional Autonomous Corporation of Cundinamarca
MODELLING OF WETLAND HABITAT AVAILABILITY AND DISTRIBUTION UNDER MANAGEMENT ALTERNATIVES
Montenegro, M.I. (ITC –NRM.ESAM, 2004) - 30 -
3.7. Conservation
A few national and regional measures have been proposed by the Government in order to protect this area. At international level, the Fúquene Lake has been proposed as a Ramsar13 site [50]. At national level, the Ministry of Environment, Housing and Zoning Development in Colombia issued the National Policy for Continental Wetlands on 2001, which recognizes the wetlands’ importance as a fundamental component of hydrological cycles and national economic development [50; 51]. In addition, many bird species that inhabit the area have been declared as threatened species by the National Government [35; 60]. At regional level, the Regional Autonomous Corporation of Cundinamarca (CAR) is encouraging studies in order to come up with a regional action plan for this area [23; 70].
13 Convention on wetlands Ramsar
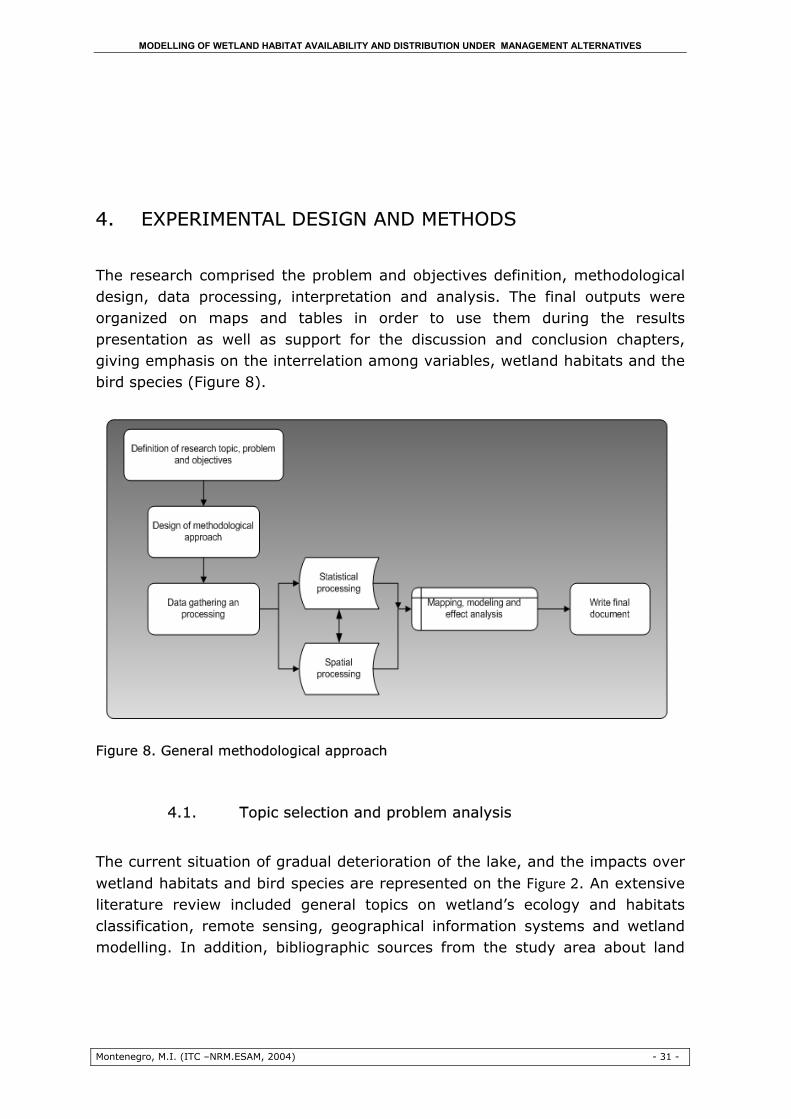
MODELLING OF WETLAND HABITAT AVAILABILITY AND DISTRIBUTION UNDER MANAGEMENT ALTERNATIVES
Montenegro, M.I. (ITC –NRM.ESAM, 2004) - 31 -
4. EXPERIMENTAL DESIGN AND METHODS
The research comprised the problem and objectives definition, methodological design, data processing, interpretation and analysis. The final outputs were organized on maps and tables in order to use them during the results presentation as well as support for the discussion and conclusion chapters, giving emphasis on the interrelation among variables, wetland habitats and the bird species (Figure 8).
Figure 8. General methodological approach
4.1. Topic selection and problem analysis
The current situation of gradual deterioration of the lake, and the impacts over wetland habitats and bird species are represented on the Figure 2. An extensive literature review included general topics on wetland’s ecology and habitats classification, remote sensing, geographical information systems and wetland modelling. In addition, bibliographic sources from the study area about land

MODELLING OF WETLAND HABITAT AVAILABILITY AND DISTRIBUTION UNDER MANAGEMENT ALTERNATIVES
Montenegro, M.I. (ITC –NRM.ESAM, 2004) - 32 -
cover, land use, hydrological regime, nutrients, sediments, climatology, biodiversity, among others, were analyzed.
4.2. Data gathering and processing
The research used thematic and spatial data sets as well as secondary literature of the study area provided mainly by the Regional Autonomous Corporation of Cundinamarca, the Ministry of Environment, Housing and Zoning Development in Colombia and the Foundation Humedales This data was arranged and processed as is described by the following sections.
4.2.1. Processing of biological variables data sets
With the purpose of identify possible relationships between wetland habitats types and the birds (Figure 9), spatial and attribute data from the study area was gathered and analyzed in terms of quality, date of production, and accessibility on digital formats. Table 1 shows the total collected data available during this study.
Figure 9. Spatial and statistical processing of bird and habitat datasets

MODELLING OF WETLAND HABITAT AVAILABILITY AND DISTRIBUTION UNDER MANAGEMENT ALTERNATIVES
Montenegro, M.I. (ITC –NRM.ESAM, 2004) - 33 -
4.2.1.1. Bird data set analysis
A bird data set was provided by researchers from the Fundación Humedales [53]. They divided the Fúquene Lake in three main localities, where specimens of Rallus semiplumbeus, Gallinula melanops bogotensis and Cistothorus apolinari apolinari, were observed and counted during February to June 2002 (Appendix 2). Bird records of three habitat types were obtained from three different methodological approaches: bird observation from a fixed point, by walking transects and by boat transects (Appendix 5). This data set was used under the assumption that each record of presence reflects the species distribution [19]. Then, data was arranged in Excel spreadsheets according to the methods and sampled locations and normalized per unit effort. The spatial data set consists mainly of transect’ starting and finishing points established during observations fieldwork, which were digitized on a raster point map in Ilwis 3.2®. As a means to explore the data, mean and standard deviation per each item were calculated via Excel. Data were imported into SPPS® statistical software to assess distribution and prepare scatter box plots. They were later prepared to graphically visualize their relations. Then, non-parametric tests were selected to test significant differences between variables [8; 18; 56]. A Kruskal-Wallis test was used in order to find trends of presence within species, methods and locations. This test allows the comparison of the means and medians of k random samples from k populations from independent samples of each population. The Kruskal-Wallis test also detects differences that are non-significant according to a t- or Welch test. The reason is that, by replacing the raw data by ranks, it reduces the importance of values further away from the sample mean [8; 18]. This test has the following assumptions [18]: o all samples are random samples from their respective populations o in addition to independence within each sample, there is mutual
independence among the various samples o the measurement scale is at least ordinal
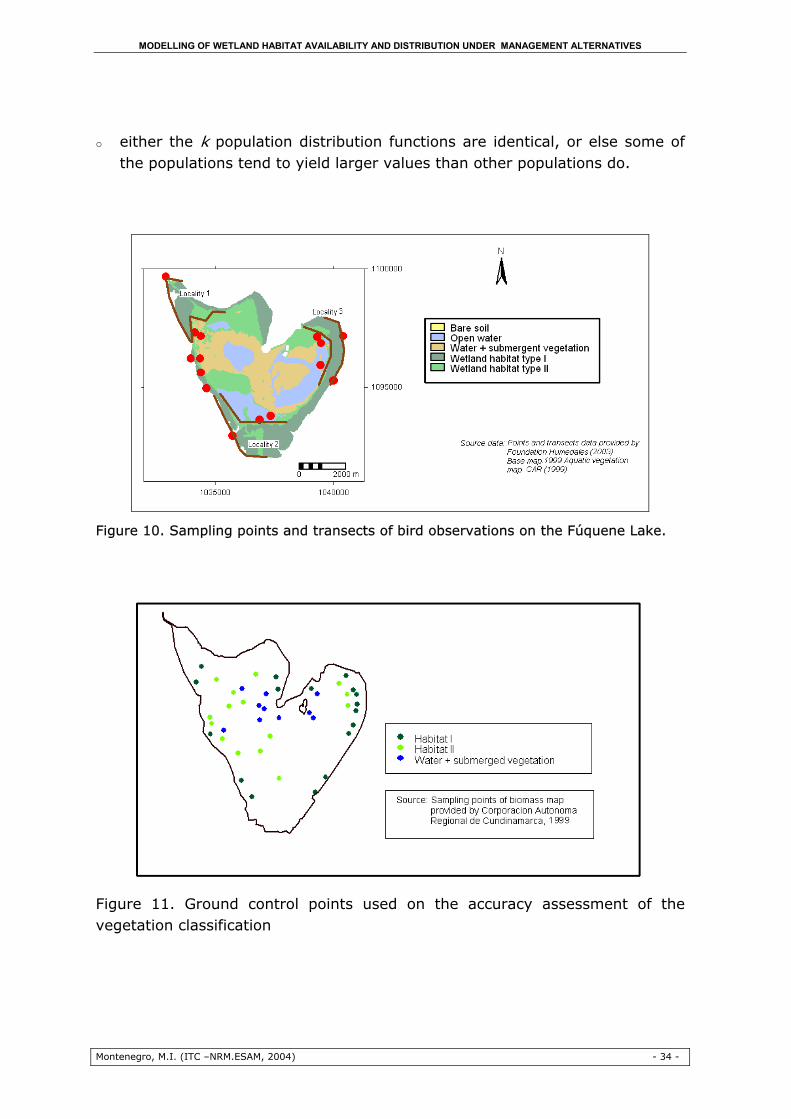
MODELLING OF WETLAND HABITAT AVAILABILITY AND DISTRIBUTION UNDER MANAGEMENT ALTERNATIVES
Montenegro, M.I. (ITC –NRM.ESAM, 2004) - 34 -
o either the k population distribution functions are identical, or else some of the populations tend to yield larger values than other populations do.
Figure 10. Sampling points and transects of bird observations on the Fúquene Lake.
Figure 11. Ground control points used on the accuracy assessment of the vegetation classification

MODELLING OF WETLAND HABITAT AVAILABILITY AND DISTRIBUTION UNDER MANAGEMENT ALTERNATIVES
Montenegro, M.I. (ITC –NRM.ESAM, 2004) - 35 -
Table 1. List and general description of gathered data
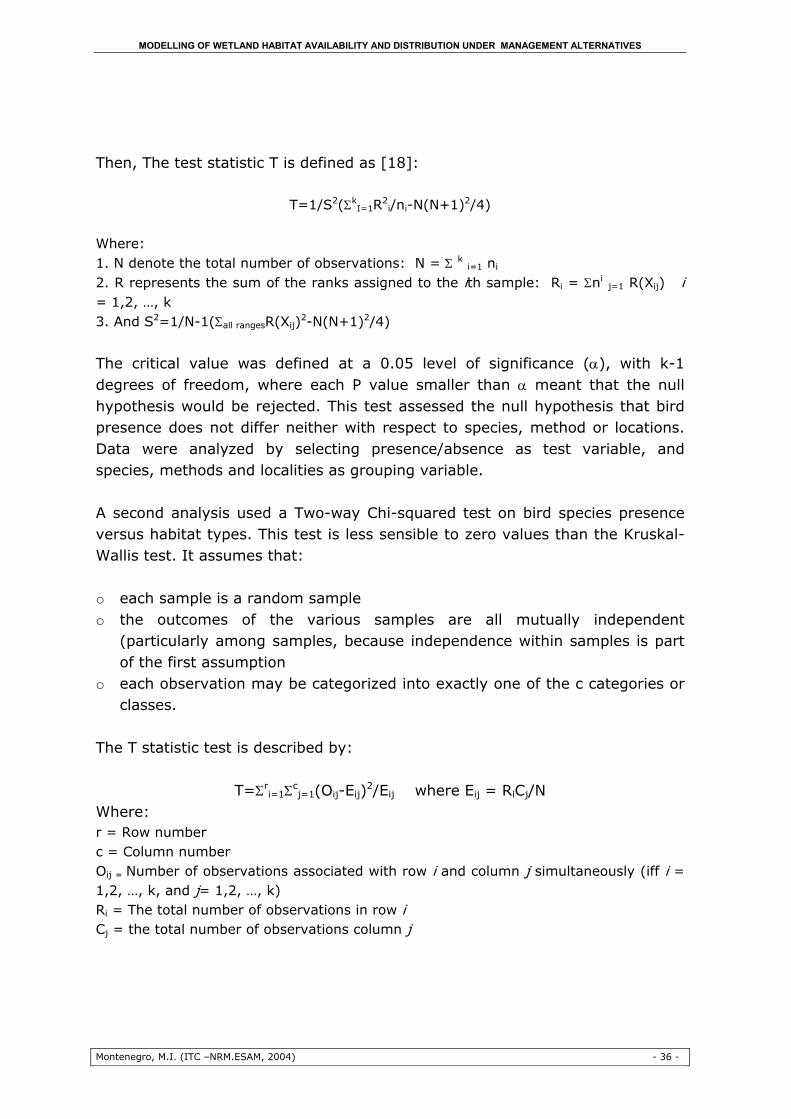
MODELLING OF WETLAND HABITAT AVAILABILITY AND DISTRIBUTION UNDER MANAGEMENT ALTERNATIVES
Montenegro, M.I. (ITC –NRM.ESAM, 2004) - 36 -
Then, The test statistic T is defined as [18]:
T=1/S2(ΣkI=1R2
i/ni-N(N+1)2/4) Where: 1. N denote the total number of observations: N = Σ k i=1 ni 2. R represents the sum of the ranks assigned to the ith sample: Ri = Σni j=1 R(Xij) i = 1,2, …, k 3. And S2=1/N-1(Σall rangesR(Xij)2-N(N+1)2/4) The critical value was defined at a 0.05 level of significance (α), with k-1 degrees of freedom, where each P value smaller than α meant that the null hypothesis would be rejected. This test assessed the null hypothesis that bird presence does not differ neither with respect to species, method or locations. Data were analyzed by selecting presence/absence as test variable, and species, methods and localities as grouping variable. A second analysis used a Two-way Chi-squared test on bird species presence versus habitat types. This test is less sensible to zero values than the Kruskal-Wallis test. It assumes that: o each sample is a random sample o the outcomes of the various samples are all mutually independent
(particularly among samples, because independence within samples is part of the first assumption
o each observation may be categorized into exactly one of the c categories or classes.
The T statistic test is described by:
T=Σri=1Σc
j=1(Oij-Eij)2/Eij where Eij = RiCj/N Where: r = Row number c = Column number Oij = Number of observations associated with row i and column j simultaneously (iff i = 1,2, …, k, and j= 1,2, …, k) Ri = The total number of observations in row i Cj = the total number of observations column j
MODELLING OF WETLAND HABITAT AVAILABILITY AND DISTRIBUTION UNDER MANAGEMENT ALTERNATIVES
Montenegro, M.I. (ITC –NRM.ESAM, 2004) - 37 -
Critical values were 0.05 and 0.1 level of significance (α), with (r-1)(c-1) degrees of freedom, where each P value smaller than α meant the null hypothesis would be rejected. This test assessed the null hypothesis that bird species presence does not differ among habitats. Data were analyzed by selecting presence/absence per species as test variable and habitats as grouping variable.
4.2.1.2. Image processing and vegetation unit interpretation
As it was mentioned on the third chapter, this study described wetland habitats mainly by characteristics that can be easily recognizable during the spatial data processing. Hence, aquatic vegetation was selected as the main criterion to define the wetland habitats to be modelled. Consequently, two satellite images from December 1987 and January 2002 were processed, as well as a 1999 thematic map of aquatic vegetation provided by the regional environmental authority [23]. Wetland habitats types were selected, then, according with two basic criteria. If there were evidence of any preference by the bird species for each of the
selected habitat types, recorded whether from previous analysis on the bird data set [23], or by secondary sources [24; 63; 64]. If vegetation units could be easily recognizable (e.g. particular spectral
responses, ecological and physiognomic characteristics) from the image interpretation.
In order to process all digital and analogue data on the same geographical context, a coordinate system called Gauss-Colombia zone 2 was created (Table 2). This coordinate system was delimited by boundaries extracted from a 1981 topographic map of the study area (1:25.000) that served as a base map. This map was previously scanned at 200 dpi resolution, and a “tie points” georeference was created, which was also used as a base reference for all maps.

MODELLING OF WETLAND HABITAT AVAILABILITY AND DISTRIBUTION UNDER MANAGEMENT ALTERNATIVES
Montenegro, M.I. (ITC –NRM.ESAM, 2004) - 38 -
Table 2. Characteristics of the Gauss Colombia – zone 2 Coordinate System
A January 2002 L1B Aster image with 14 bands (i.e. visible and thermal infrared, visible radiance, reflected infrared) and 15 meters of resolution for near-infrared portion was obtained via USGS mission [31] (Appendix 4). This satellite image of the study area uses the Universal Transverse Mercator projection (UTM), and has system radiometric corrections and geometric calibration coefficients to the level 1A data. A displacement of 500 meters towards the East was detected during the importation of the image to Ilwis 3.2®. Thus, the image was transformed by a “tie points” georeference in order to adjust it to the coordinate system used by former maps. This displacement would be attributed to differences between both coordinate systems and errors added by the initial georeference derived of distortions of the 1981_topographic map. Combining very near infrared (VNIR) bands 3, 2, and 1, to corresponds to red, green and blue, a false colour composite of the Aster image was produced in Ilwis 3.2 ® software. The image was enhanced through the comparison and adjustment of its pixel values on each band into a histogram. A similar procedure was applied on a 30-meter resolution Landsat Image from December 1987 with 7 bands (i.e. visible and thermal infrared, visible radiance, reflected infrared) that was obtained via Landsat organization [45] (Appendix 4) Following, the vegetation of the lake and surroundings was classified as part of image interpretation. In order to avoid similar spectral responses during the classification of the different land units, masks were created for the lake and surrounding areas as to separate them. Given that ERDAS 8.6® [40] has better tools for classification, this part of the analysis used that software. ERDAS® provides many possibilities to improve classification through a previous use of a unsupervised classification, which allows for an increased

MODELLING OF WETLAND HABITAT AVAILABILITY AND DISTRIBUTION UNDER MANAGEMENT ALTERNATIVES
Montenegro, M.I. (ITC –NRM.ESAM, 2004) - 39 -
number of classes and iterations that make possible to better differentiate classes according to spectral responses. Afterward, through a supervised classification, land cover units were merged according to criteria previously established. This method allowed for an increase in accuracy during classification because of the combination of data analysis operators from GIS tools and knowledge of the study area. To give the map a smoother appearance in the boundaries between the classes, a majority filter was applied on both raster maps (1987 and 2002). This procedure facilitated the comparison between both images and a 1999 thematic map of aquatic vegetation [23]. The overall accuracy of the satellite images classification was tested using as ground control points those drawn on the biomass map provided by the regional authority ([23]). However, this map was produced in 1999, and given the fast growth rate of aquatic vegetation according to the regional authority [23], a low overall accuracy between the biomass map and the satellite images classifications was expected. Besides the identification of land cover classes, additional calculations of area per habitat were made among years (i.e. 1987, 1999 and 2002), as well as the increased and decreased area for Habitat I and II.
4.2.2. Processing of eco-hydrological variables data set.
The main objective of these analyses was to identify possible eco-hydrological variables that could influence distribution and availability of wetland habitats. Therefore, a regression analysis was applied on each eco-hydrological variable to test the hypothesis that there were trends in time for each selected variable. If this hypothesis could be confirmed, variation on eco-hydrological variables could be related with variation on distribution and availability of wetland habitats. Likewise, nutrients and sediments data set were assessed in order to find possible trends in time. Rainfall, water discharge, ground water level, nutrients, sediments, water level and depth of the study area were considered as main variables to be used during modelling, whose data was obtained by secondary sources [23] (Figure 12).

MODELLING OF WETLAND HABITAT AVAILABILITY AND DISTRIBUTION UNDER MANAGEMENT ALTERNATIVES
Montenegro, M.I. (ITC –NRM.ESAM, 2004) - 40 -
Analysis ofhydrological regime
Data setprocessing
Imageprocessing
Digitizing of bathymetrymaps (1:21.000).Generation of DEM of depthin the Fuquene LakeChange_detection between1984 and 1997Generation and evaluationof DEMs from surroundingareas.
Change_ detection map ofdepth between 1984 - 1997.Calculated silted anderoded areasDEMs (depth andsurrounding areas)
Generation of linearmodel to simulatedepth changes andeffects on wetlandhabitats
Maps of measurementstationsTables and scatter plotsof variables per stationversus yearsOutput tables ofregression analysis
Spatialmodeling of
habitats types
Analysis of nutrients
Analysis ofsediments
Variable data set organizationon spreadsheets.Edition ofAutoCAD_environmentalvariables data set on Arc ViewRegression analyses ofenvironmental variables
PRODUCTS
Depth andwetland habitats
models
Objetive 2: Modelof wetland habitats Process
Varia
ble
anal
yses
Figure 12. Spatial and statistical processing of eco-hydrological variables data sets
• Thematic data processing and analysis
Hard copies of maps, tables and figures of the study area about vegetation, historical propagation of aquatic vegetation, and bathymetry provided by the CAR were digitized and raster maps [23]. Data was scanned and arranged on spreadsheets by stations, years and eco-hydrological variables. A selection of measurement stations was done as to represent variables in, upstream and downstream of the lake: Precipitation data was collected by three measurement stations located upstream of the lake on the mountainous surroundings (i.e. El Espino, Monserrate and Zarzal stations), and one station located on the flat area (Novilleros station), besides, three downstream stations (i.e. Simijaca, Los Arrayanes and Tolón floodgate) (Figure 13). Water discharge data was collected by three measurement stations located upstream on the mountainous surroundings (i.e. La Boyera, Puente Barcelona, and Puente la Balsa stations); and one station located before the Fúquene Lake on the Ubaté River (Puente Colorado station). Beside of this, data from three

MODELLING OF WETLAND HABITAT AVAILABILITY AND DISTRIBUTION UNDER MANAGEMENT ALTERNATIVES
Montenegro, M.I. (ITC –NRM.ESAM, 2004) - 41 -
downstream stations (i.e. Puente Peralonso, Puente Guzman and La Balsa stations) were also considered during the analysis. (Figure 13). Ground water level data were collected by four measurement stations: two stations located on the upstream flat area of the Fúquene Lake (i.e. La Albaida and La Maria stations); another station was located on the mountainous region to the Eastern side of the lake (i.e. Tichauribe station) and the last one was located downstream on the mountainous surroundings of Suarez River (i.e. Esmeralda III station) (Figure 14). Sediments and nutrients measurements were taken from four stations located in the Fúquene Lake (Figure 15). Individual samples were collected during the years 1996, 1997 and 1998 whether it was dry or wet season. Four samples were taken for 1999 during the dry and wet season (Appendix 11). Finally, nutrient and sediment data for tributaries were taken for five stations during 1996, 1997 and 1999 (Figure 15) (Appendix 16). Data was collected on different seasons but no replicas were made preventing any pattern identification
Figure 13. Location of measurement stations of rainfall and water discharge

MODELLING OF WETLAND HABITAT AVAILABILITY AND DISTRIBUTION UNDER MANAGEMENT ALTERNATIVES
Montenegro, M.I. (ITC –NRM.ESAM, 2004) - 42 -
Figure 14. Location of measurement stations of ground water level
Figure 15. Location of measurement stations of nutrient and sediment concentration

MODELLING OF WETLAND HABITAT AVAILABILITY AND DISTRIBUTION UNDER MANAGEMENT ALTERNATIVES
Montenegro, M.I. (ITC –NRM.ESAM, 2004) - 43 -
Given that most of the data was obtained from the period that goes from 1966 to 1998, a linear regression analysis was applied for each variable to detect possible trends in time. Assumptions for this analysis were [18]:
o the sample is a random sample. o the relation of Y on X is linear.
The statistical model is expressed as [52]:
Yi = β0+β1χi+εI
Yi = observed response xi = value of explanatory variable βo = Intercept of the population regression line β1 = Slope of the population regression line εI = Residual of i Critical values were considered at 0.05 and 0.1 level of significance (α), where each P value smaller than α meant that the null hypothesis would be rejected. This test intended to assess the null hypothesis that each environmental variable has trends in time. Finally, a spatial data set of the study area was provided by CAR (Table 1). Its original format was Auto CAD, and the use of ArcView 8® software was necessary in order to make this data compatible with previous information in terms of spatial data format. A specific geodatabase of selected data was created in ArcCatalog®. After an extensive process of editing on ArcView 8®, feature classes were selected in order to prepare maps of rainfall, water discharge, sediments, and nutrients stations.
• Digital Elevation Model An elevation model was required as a support on the analysis of the eco-hydrological variable in order to visualize possible patterns regarding with altitude. Thus, two main sources were used. The first DEM was generated in ILWIS 3.2® from digitizing contour lines obtained from a 1981 topographic map at 1:25.000 scale, that was previously scanned at 200 dpi and georeferenced. Digitized contour lines representing
MODELLING OF WETLAND HABITAT AVAILABILITY AND DISTRIBUTION UNDER MANAGEMENT ALTERNATIVES
Montenegro, M.I. (ITC –NRM.ESAM, 2004) - 44 -
altitudes ranging from 2400 to 3100 m.a.s.l. (i.e. at intervals each 25 and 50 m) were interpolated to derive this DEM. Additional control points were incorporated to the DEM in order to improve it, by using logical operators. The final output model had a pixel size of 10 m. However, this DEM showed some problems that made its use difficult. First, the topographic map was not of good quality and its contour lines were not easy to recognize adding errors on the digitizing process and in consequence to the final output. Second, the DEM was affected by the limited extent of the topographic map, which did not cover all the study area, especially the upper and lower sectors of the catchment area. Third, flat areas were not well represented because there were not enough elevation points available across them. To overcome these limitations, an additional DEM was required in order for improvement the model. Additional information was obtained making use of the Shuttle Radar Topographic Mission data set. This dataset came from a collaborative effort made by the National Aeronautics and Space Administration (NASA) and the National Imagery and Mapping Agency (NIMA), along with the German and Italian space agencies that generated a near-global digital elevation model (DEM) of the Earth using radar interferometry [55]. Files from the study area with a pixel size of 90 m were initially imported into Ilwis 3.2®, and then exported as shape files in ArcView 8®. This last software package has a 3D analysis function, which allows the creation of contour lines from shape files. Once the two DEMs were compared, the decision was to adopt the last one, because it minimizes the aforementioned problems.
4.3. Modelling of the wetland habitat types
First, DEMs of the lake bottom were created primarily for the purposes of change detection and modeling (Figure 12). Thus, contour lines from bathymetry maps 1984 and 1997 (1:21.000) [23] were digitized. This study assigned 0-meter threshold of water level that is equivalent to 2539 m.a.s.l. Given that 0 to 1 meter contour lines were not represented on the 1997 bathymetry map, the 1-meter water depth contour line from 1984 bathymetry map was included on the 1997 bathymetry map as an additional contour line so as to improve its final DEM. This process assumed that the 1-meter water depth contour line from 1984 bathymetry is closer to the real water depth zonation of the lake

MODELLING OF WETLAND HABITAT AVAILABILITY AND DISTRIBUTION UNDER MANAGEMENT ALTERNATIVES
Montenegro, M.I. (ITC –NRM.ESAM, 2004) - 45 -
and therefore, allowed simulating smoother terrain changes on the lake’s bottom. A sub area compatible between two maps was selected for further calculations. Contour lines for each segment map were interpolated and both final DEMs of the lake bottom were crossed in Ilwis 3.2®, in order to calculate a change – detection map. Final outputs included water depth variation between 1984 and 1997, and calculations of eroded and silted area during this span of time. Subsequently, a linear model was interpolated from the 1984 and 1997 bathymetry maps to predict future changes on water depth in the Fúquene Lake for five projected years (i.e. 2000, 2004, 2008, 2012 and 2016). The assumption of this model was that a linear relation could explain trends in time for changes on the water depth in the lake. So, that the same linear relation can be used to model the evolution of aquatic vegetation distribution and extent in relation to water depth. The derived formula was:
Vx = V1+(V2-V1)(Y-1984)/(1997-1984) Where
Vx= Water depth (m) of modelled year V1= Water depth (m) for 1984 V2= Water depth (m) for 1997 Y= Modelled year
As is was mentioned, this model also simulates a relationship between water depths and susceptible areas in the Fúquene Lake to be occupied by the wetland habitats for the same projected years. Thus, depth preferences per the dominant species of the wetland Habitats I and II were estimated from literature review [23; 53] as is follows: Habitat I is mainly dominated by Scirpus californicus, which is mostly found in areas shallower than 2 meters water depth. Likewise, floating plants (Habitat II) inhabit areas deeper than 2 meters, but apparently no deeper than 4 meters. In order to incorporate an additional element, which allows the simulation of successional process in vegetation, a transitional zone was added to the model. This area varies between 2 meters and 2.6 meters water depth, and would be representing a combination between emergent (Habitat I) and floating plants (Habitat II).

MODELLING OF WETLAND HABITAT AVAILABILITY AND DISTRIBUTION UNDER MANAGEMENT ALTERNATIVES
Montenegro, M.I. (ITC –NRM.ESAM, 2004) - 46 -
4.4. Modelling of management alternatives
Three management alternatives to fulfil the third objective of this study were selected (Figure 16). Alternatives and methods are explained as is follows: No additional management:[23] It simulates how the wetland habitats will behave in terms of their availability and distribution, in the case that no additional management alternative were adopted. This alternative was modelled using the linear model explained on the previous section. Water level increase: Three additional water levels were added to the linear formula (i.e. 0.5 m, 1 m, and 2 m) in order to model water level increases. Van der Hammen [69] suggested to increase the water level of the lake on 1 meter at least, to recover 30,000 millions m3 of water and hence, recover part of the land drained for agricultural purposes. C.T.I. Engineering International Co. [23; 69] simulated an increase of 0.5 m water depth as a proposal to optimize the current hydraulic operation rule for the Fúquene Lake. Finally an extreme case of two meters was selected in order to see, as the others, potential effects on the wetland habitats. Two years were selected (i.e. 2008 and 2012) on this model, estimating a hypothetic period required for the adoption of one of the three alternatives by the local authorities (i.e. construction of new facilities). Control of nutrients and sediments [69]: This alternative has been proposed to minimize in a future sources of eutrophication. Although this alternative intends to control punctual and non-punctual sources of pollution from nutrients and sediments discharges, limitation on data made it difficult to develop a spatial model. The discussion about available data generated some recommendations in order to consider this possibility in the future.

MODELLING OF WETLAND HABITAT AVAILABILITY AND DISTRIBUTION UNDER MANAGEMENT ALTERNATIVES
Montenegro, M.I. (ITC –NRM.ESAM, 2004) - 47 -
Figure 16. Modelling of possible effects by management alternatives

MODELLING OF WETLAND HABITAT AVAILABILITY AND DISTRIBUTION UNDER MANAGEMENT ALTERNATIVES
Montenegro, M.I. (ITC –NRM.ESAM, 2004) - 48 -
5. RESULTS
5.1. Analysis of biological and eco-hydrological variables
This section describes the main obtained results with the purpose to find relationships between the three bird species and the wetland habitats.
5.1.1. Distribution of the bird species on wetland habitats
Preliminarily, the data was observed in order to identify possible trends influenced among species, methods and localities. However, the bird count distributions did not follow a normal distribution pattern, possibly because many counts included outliers and zero values. This pattern influenced the statistical analysis in such way, that the counts median was equal to zero. Zero values could be the result of deficiencies on some of the methods to observe a specific habitat and therefore, some of the bird species. Besides a small population size, these bird species have secretive habits that make their observation difficult. In addition, there were not enough replicas of data, which turns out in small counts for the different species. Thus, in order to reduce the dispersion of data given by the reasons mentioned above, presence/absence of each species were used instead of their individual counts. First, presence values by species were compared in order to identify if the sampling size of observations per species could affect further analysis on their distribution per habitat. Although counts of C. apolinari were higher than for the other two species (n=321) (Appendix 5), results obtained by the Kruskal-Wallis test showed that there were not significant differences at 10% of significance level among species14 in terms of presence/absence (Figure 17). In other words, each individual range of observations taken by species did not influence bird distribution on different habitat types. Higher counts on C. apolinari would be explained as a result of the high data dispersion given by many outliers identified on its data set.
14 Kruskal – Wallis test, N = 243, d.f. (2), H= 1.32, p> 0,1
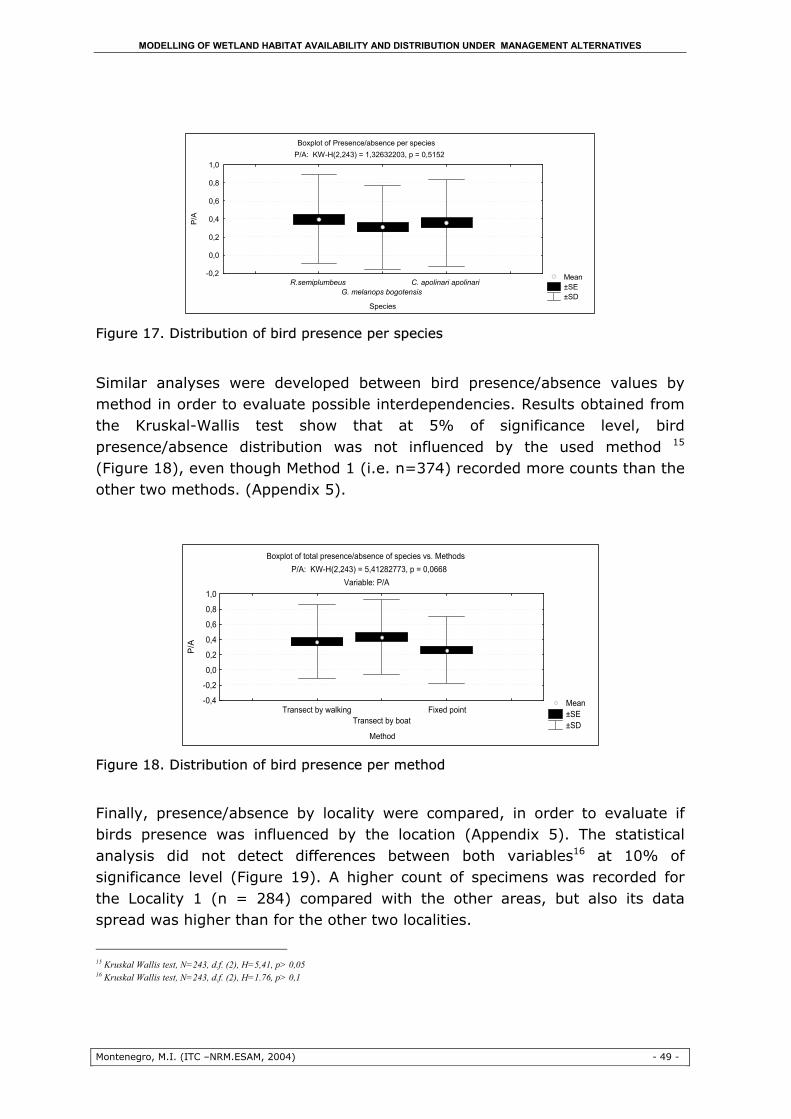
MODELLING OF WETLAND HABITAT AVAILABILITY AND DISTRIBUTION UNDER MANAGEMENT ALTERNATIVES
Montenegro, M.I. (ITC –NRM.ESAM, 2004) - 49 -
Boxplot of Presence/absence per species P/A: KW-H(2,243) = 1,32632203, p = 0,5152
Mean ±SE ±SD
R.semiplumbeusG. melanops bogotensis
C. apolinari apolinari
Species
-0,2
0,0
0,2
0,4
0,6
0,8
1,0
P/A
Figure 17. Distribution of bird presence per species Similar analyses were developed between bird presence/absence values by method in order to evaluate possible interdependencies. Results obtained from the Kruskal-Wallis test show that at 5% of significance level, bird presence/absence distribution was not influenced by the used method 15 (Figure 18), even though Method 1 (i.e. n=374) recorded more counts than the other two methods. (Appendix 5).
Boxplot of total presence/absence of species vs. Methods P/A: KW-H(2,243) = 5,41282773, p = 0,0668
Variable: P/A
Mean ±SE ±SD
Transect by walkingTransect by boat
Fixed point
Method
-0,4
-0,2
0,0
0,2
0,4
0,6
0,8
1,0
P/A
Figure 18. Distribution of bird presence per method
Finally, presence/absence by locality were compared, in order to evaluate if birds presence was influenced by the location (Appendix 5). The statistical analysis did not detect differences between both variables16 at 10% of significance level (Figure 19). A higher count of specimens was recorded for the Locality 1 (n = 284) compared with the other areas, but also its data spread was higher than for the other two localities.
15 Kruskal Wallis test, N=243, d.f. (2), H=5,41, p> 0,05 16 Kruskal Wallis test, N=243, d.f. (2), H=1.76, p> 0,1

MODELLING OF WETLAND HABITAT AVAILABILITY AND DISTRIBUTION UNDER MANAGEMENT ALTERNATIVES
Montenegro, M.I. (ITC –NRM.ESAM, 2004) - 50 -
Given that bird presence did not differ by species, method and locality, the analyses were then focused to test the hypothesis that bird presence of each species differs among wetland habitats. Specifically for this data set, the researchers from the Fundación Humedales described three wetland habitats during fieldwork (Table 3) [53]
Table 3. Wetland habitat types defined by the bird data set
Boxplot of bird presence/absence vs. localities P/A: KW-H(2,243) = 1,75648052, p = 0,4155
Variable: P/A
Mean ±SE ±SD
Northwest of the LakeSouth of the lake
East of the lake
Location
-0,4
-0,2
0,0
0,2
0,4
0,6
0,8
1,0
P/A
Figure 19. Distribution of bird presence per locality
Presence of Rallus semiplumbeus differs among habitat types17. From 32 records of R.semiplumbeus presence, 21 records belong to Habitat 2. 7 records to habitat 1 and 4 records belong to Habitat 3. This pattern allows concluding that R.semiplumbeus presence differs among habitats, but it was more frequently observed on Habitat 2 (Figure 20). This result is also compatible with ecological descriptions of this species, which pointed out its preferences by tall and dense reeds (Appendix 1).
17 Chi-square test, N=81, d.f. (2,1), χ2=25,51, p<0,05
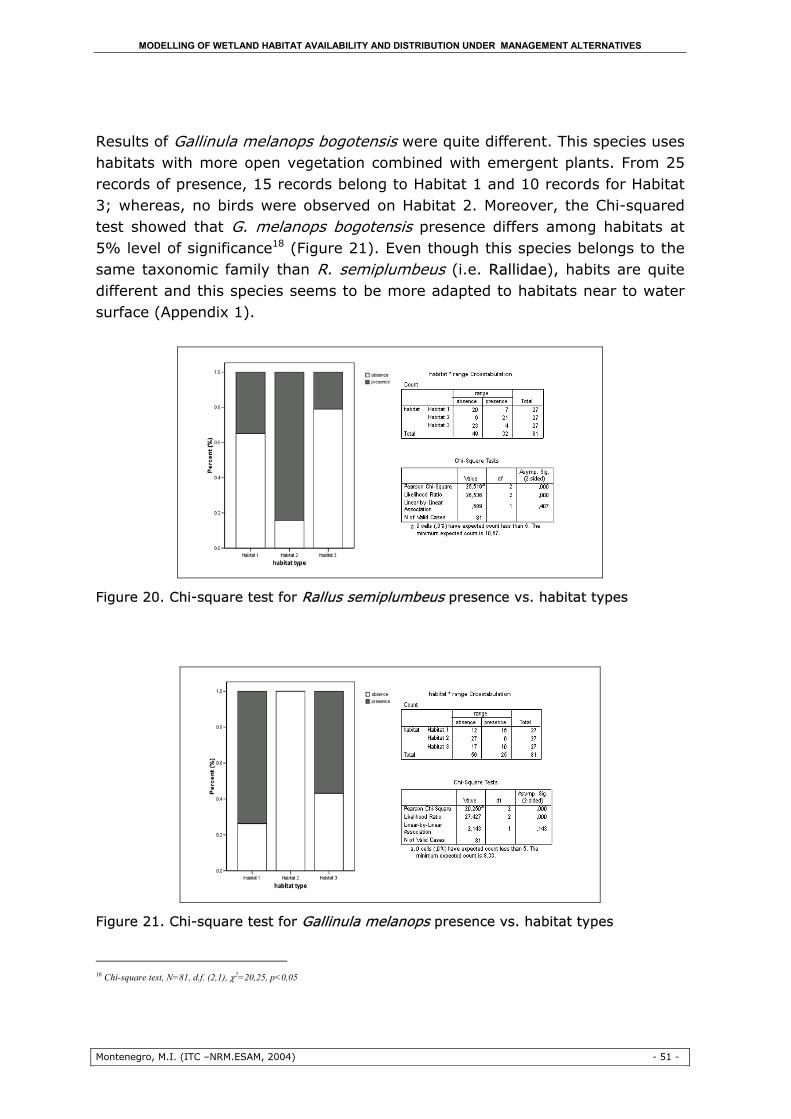
MODELLING OF WETLAND HABITAT AVAILABILITY AND DISTRIBUTION UNDER MANAGEMENT ALTERNATIVES
Montenegro, M.I. (ITC –NRM.ESAM, 2004) - 51 -
Results of Gallinula melanops bogotensis were quite different. This species uses habitats with more open vegetation combined with emergent plants. From 25 records of presence, 15 records belong to Habitat 1 and 10 records for Habitat 3; whereas, no birds were observed on Habitat 2. Moreover, the Chi-squared test showed that G. melanops bogotensis presence differs among habitats at 5% level of significance18 (Figure 21). Even though this species belongs to the same taxonomic family than R. semiplumbeus (i.e. Rallidae), habits are quite different and this species seems to be more adapted to habitats near to water surface (Appendix 1).
Figure 20. Chi-square test for Rallus semiplumbeus presence vs. habitat types
Figure 21. Chi-square test for Gallinula melanops presence vs. habitat types
18 Chi-square test, N=81, d.f. (2,1), χ2=20,25, p<0,05
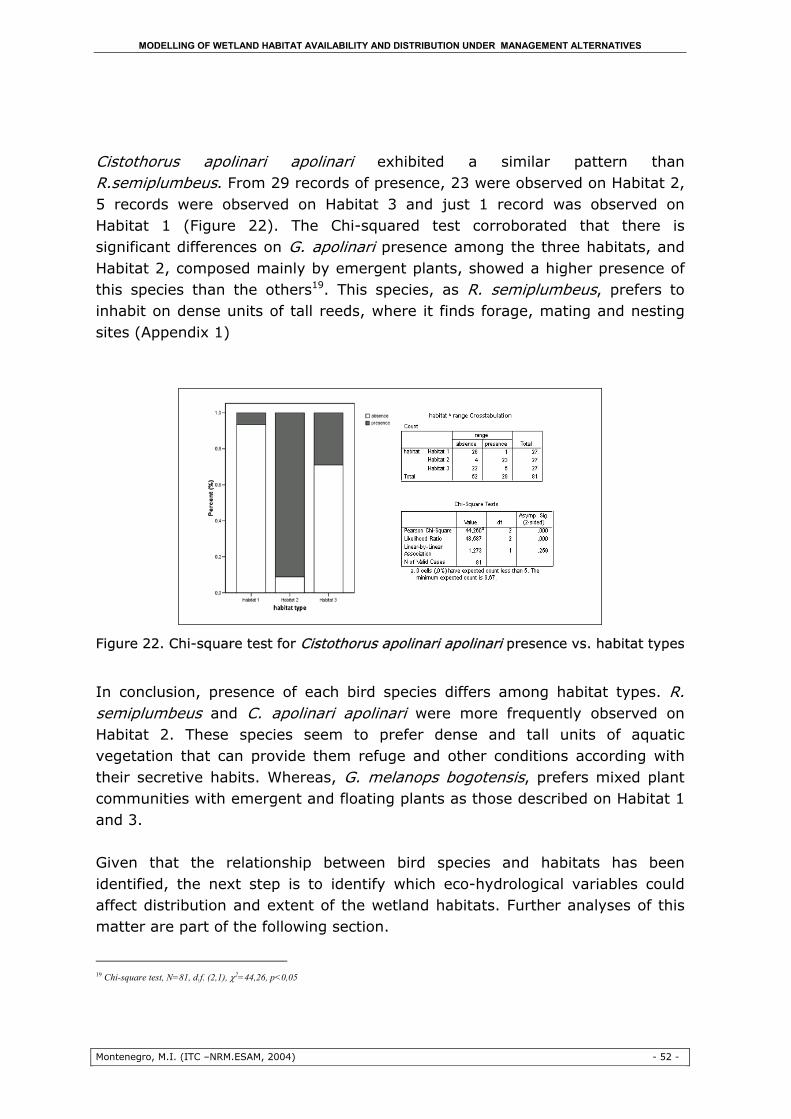
MODELLING OF WETLAND HABITAT AVAILABILITY AND DISTRIBUTION UNDER MANAGEMENT ALTERNATIVES
Montenegro, M.I. (ITC –NRM.ESAM, 2004) - 52 -
Cistothorus apolinari apolinari exhibited a similar pattern than R.semiplumbeus. From 29 records of presence, 23 were observed on Habitat 2, 5 records were observed on Habitat 3 and just 1 record was observed on Habitat 1 (Figure 22). The Chi-squared test corroborated that there is significant differences on G. apolinari presence among the three habitats, and Habitat 2, composed mainly by emergent plants, showed a higher presence of this species than the others19. This species, as R. semiplumbeus, prefers to inhabit on dense units of tall reeds, where it finds forage, mating and nesting sites (Appendix 1)
Figure 22. Chi-square test for Cistothorus apolinari apolinari presence vs. habitat types
In conclusion, presence of each bird species differs among habitat types. R. semiplumbeus and C. apolinari apolinari were more frequently observed on Habitat 2. These species seem to prefer dense and tall units of aquatic vegetation that can provide them refuge and other conditions according with their secretive habits. Whereas, G. melanops bogotensis, prefers mixed plant communities with emergent and floating plants as those described on Habitat 1 and 3. Given that the relationship between bird species and habitats has been identified, the next step is to identify which eco-hydrological variables could affect distribution and extent of the wetland habitats. Further analyses of this matter are part of the following section.
19 Chi-square test, N=81, d.f. (2,1), χ2=44,26, p<0,05
MODELLING OF WETLAND HABITAT AVAILABILITY AND DISTRIBUTION UNDER MANAGEMENT ALTERNATIVES
Montenegro, M.I. (ITC –NRM.ESAM, 2004) - 53 -
5.1.2. Distribution and extent of the wetland habitat types
As a result of the image processing, a new classification of wetland habitats had to be done, instead of using the categories used by Foundation Humedales. The reasons were that spectral responses of Habitat 2 and 3 described by Foundation Humedales [53] were almost similar, and therefore, it was difficult to distinguish them from the satellite images (Appendix 4); additionally, two main communities of emergent and floating plants composed habitat 1, which can be easily misclassified as habitat 2 or 3 (Table 3). Given that the image interpretation allows distinguishing emergent plants and floating plants, two habitat types were defined and former wetland habitat types used by Foundation Humedales were merged. An additional criterion of water depth was included during the identification and description of each wetland habitat type. Then, the wetland habitats used during the modelling were classified as follows: Wetland habitat type I: Prairie of Rooted Emergent Plants. It consists on littoral vegetation located between 0.30 to 2 meters water depth. Emergent herbs, grasses and rushes describe this habitat. Dense units of Scirpus californicus mainly dominate this ecological unit, which coexists with Hydrocotile ranunculoides, Myriophillum elatinoides and Polygonum hispidon [65]. There are also Cyperus acuminatus, Polygonum hydopyperoides and Pennisetum clandestinum near to the channels (Morales & Lozano;) [23] (Appendix 3) Wetland habitat type II: Prairie of Floating plants: Mainly composed by nomadic emergent and free-floating species. These nomadic plant communities dominated by Eichhornia crassipes grows aggressively on almost all water surface, channels and ditches. It coexists with Lemna spp, and Azolla filiculoides [24; 53; 65], and extend on the limnetic and littoral subsystems (Appendix 3). Two additional categories were described, but did not belong to the strict description of the wetland habitats to be modeled because of reasons explained as follows. The first category is a transitional zone between the two habitats (Appendix 3). It is located in places ranged between 2 until 2.6 meters water depth between littoral and limnetic subsystems. Typha latifolia can be identified as the
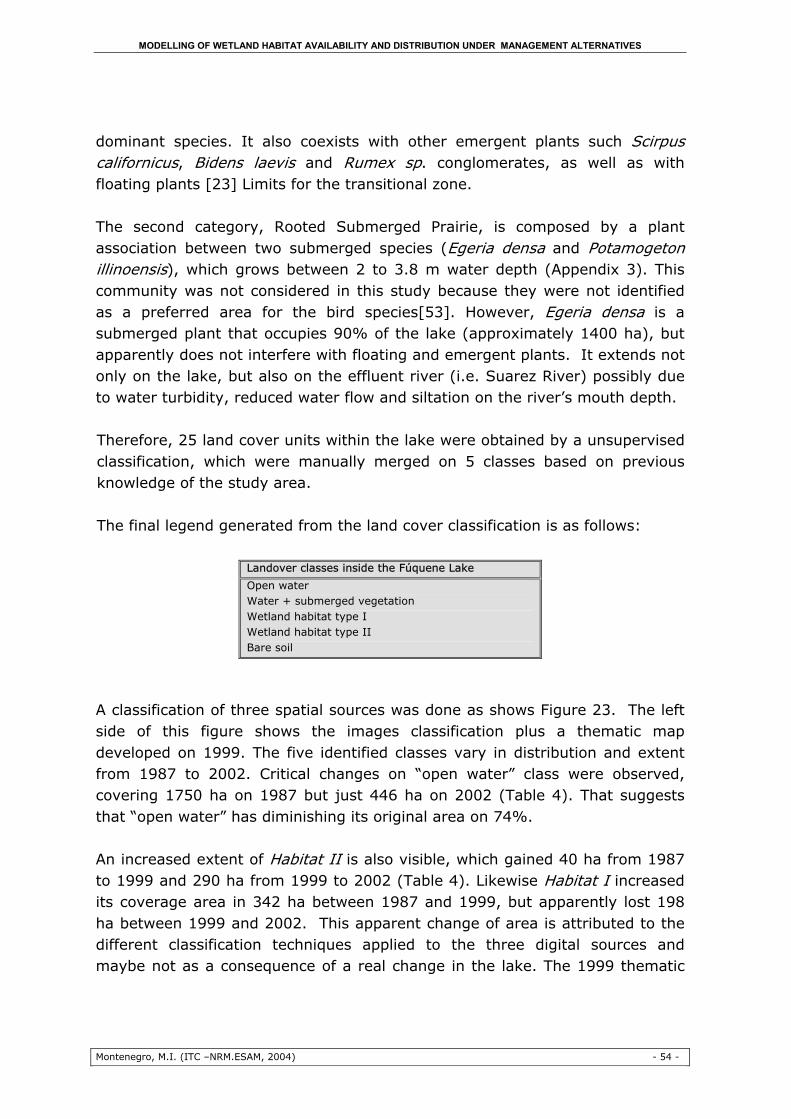
MODELLING OF WETLAND HABITAT AVAILABILITY AND DISTRIBUTION UNDER MANAGEMENT ALTERNATIVES
Montenegro, M.I. (ITC –NRM.ESAM, 2004) - 54 -
dominant species. It also coexists with other emergent plants such Scirpus californicus, Bidens laevis and Rumex sp. conglomerates, as well as with floating plants [23] Limits for the transitional zone. The second category, Rooted Submerged Prairie, is composed by a plant association between two submerged species (Egeria densa and Potamogeton illinoensis), which grows between 2 to 3.8 m water depth (Appendix 3). This community was not considered in this study because they were not identified as a preferred area for the bird species[53]. However, Egeria densa is a submerged plant that occupies 90% of the lake (approximately 1400 ha), but apparently does not interfere with floating and emergent plants. It extends not only on the lake, but also on the effluent river (i.e. Suarez River) possibly due to water turbidity, reduced water flow and siltation on the river’s mouth depth. Therefore, 25 land cover units within the lake were obtained by a unsupervised classification, which were manually merged on 5 classes based on previous knowledge of the study area. The final legend generated from the land cover classification is as follows:
Landover classes inside the Fúquene Lake
Open water Water + submerged vegetation Wetland habitat type I Wetland habitat type II Bare soil
A classification of three spatial sources was done as shows Figure 23. The left side of this figure shows the images classification plus a thematic map developed on 1999. The five identified classes vary in distribution and extent from 1987 to 2002. Critical changes on “open water” class were observed, covering 1750 ha on 1987 but just 446 ha on 2002 (Table 4). That suggests that “open water” has diminishing its original area on 74%. An increased extent of Habitat II is also visible, which gained 40 ha from 1987 to 1999 and 290 ha from 1999 to 2002 (Table 4). Likewise Habitat I increased its coverage area in 342 ha between 1987 and 1999, but apparently lost 198 ha between 1999 and 2002. This apparent change of area is attributed to the different classification techniques applied to the three digital sources and maybe not as a consequence of a real change in the lake. The 1999 thematic
MODELLING OF WETLAND HABITAT AVAILABILITY AND DISTRIBUTION UNDER MANAGEMENT ALTERNATIVES
Montenegro, M.I. (ITC –NRM.ESAM, 2004) - 55 -
map was made from aerial photograph interpretation, and generalized the polygons of Habitat I and II; hence, it seems that Habitat I is perfectly differentiated from Habitat II and it is more densely distributed on the lake border. However, classified maps from the satellite images showed a mixed distribution between the two habitats with preferences on shallower regions for Habitat I and deeper areas for Habitat II. The right side of Figure 23 shows a calculated variation of Habitat I and Habitat II during 15 years (1987 – 2002). Habitat I increased its coverage on 190 ha during this period and just was replaced for other classes on 40 ha. Habitat II increased its coverage on 309 ha during 1987 and 2002, but was replaced for other classes, included Habitat I, on 11.5 ha. Another class, bare soil, was identified during the classification of the 2002 Aster image. Although its representation is currently small (12 ha), it could increase in future years given due to local activities of vegetation cutting and burning. Finally, the “water + submerged vegetation”, dominated by Egeria densa, extends on an important proportion of the lake (from 157 ha in 1987 to 975 ha in 2002), even though this vegetation is periodically extracted by cutting machines [23]. Validation of images classification Ground control points from a biomass map of 1999 provided by CAR were used in order to assess classification accuracy [23]. Results showed a low accuracy of the classification from 1987 Landsat image (i.e. overall accuracy = 28.6%) and 2002 Aster image (i.e. overall accuracy = 45.2%). Additionally, the overall accuracy was assessed on the 1999 thematic map, which was prepared by the same team group who prepared the biomass map [23], giving a value of 54.76% (Appendix 6). These results were attributed to the following possible causes.

MODELLING OF WETLAND HABITAT AVAILABILITY AND DISTRIBUTION UNDER MANAGEMENT ALTERNATIVES
Montenegro, M.I. (ITC –NRM.ESAM, 2004) - 56 -
Figure 23. The wetland habitats types and change on their area (ha) (1987, 1999, 2002)
Table 4. Change on area (ha) of the wetland habitat types
“Water” and “water + submerged vegetation” were classes not easy to distinguish during the classification, because there were not represented ground control points for the “open water” class in the biomass map. Thus, the 1999 thematic map differentiated both classes, whereas the biomass map did assign all pixels to the “water + submerged vegetation” class.
MODELLING OF WETLAND HABITAT AVAILABILITY AND DISTRIBUTION UNDER MANAGEMENT ALTERNATIVES
Montenegro, M.I. (ITC –NRM.ESAM, 2004) - 57 -
Furthermore, the change rate for aquatic vegetation was estimated on 25 ha year-1 (i.e. between 1940 and 1989) and 50.5 ha year-1 (i.e. between 1990 and 1999) [23]. Therefore, it is not expected that the classes identified by ground control points maintain themselves through the years. For instance, the classified map from the 1987 Landsat image assigned pixels to the “open water” class, which initially were identified into the “water + submerged vegetation” class by the ground control points due to in 1987 submerged vegetation was not invaded the lake as in the year 1999. Thus, the reliability value for open water from the 1987 image compared with “water + submerged vegetation class” from the ground control points was low [65]. Finally, the classified map from the 2002 Aster image assigned different classes to those areas identified as “wetland habitat type II” by the ground control points. Particularly, floating and nomadic plants compose this habitat, which have a high growth rate, and also move themselves freely over the water surface.
5.1.3. Analysis of eco-hydrological variables
This section describes the results from the analyses of potential trends in time by eco-hydrological variable and their effects on the wetland habitat distribution and availability.
5.1.3.1. Precipitation
Monthly rainfall data for four stations (i.e. Novilleros, Isla Santuario, Simijaca, and Tolón floodgate) confirms that there are two rainy periods alternated by two relatively dry periods every year: the wet season extending from March to June and September to November. The dry seasons are extended from December to February and from July to August (Figure 6). The analysis of annual rainfall data showed trends in time according to the location of stations. A negative trend in time was identified for El Espino, Monserrate and Zarzal stations, where the water contribution from rainfall decreased between 200 and 400 mm year –1 during 33 years of sampling. Univariate tests of significance were found to be significant at 5% for El Espino

MODELLING OF WETLAND HABITAT AVAILABILITY AND DISTRIBUTION UNDER MANAGEMENT ALTERNATIVES
Montenegro, M.I. (ITC –NRM.ESAM, 2004) - 58 -
station, and at 10% for Monserrate and Zarzal stations20. For the first two stations the annual rainfall average were 701.2 and 986 mm, respectively; On the other hand, El Zarzal recorded higher rainfall values with an annual average of 1097 mm year-1 (Figure 24). However, there is no trend in rainfall over time recorded neither by the Novilleros station21 or the Isla Santuario station, which is the only station located on the lake itself22 (Appendix 7). Their annual rainfall averages were 712 and 1059 mm year-1, respectively. Negative trends in time were identified for the downstream Los Arrayanes and Tolón floodgate stations23 at 5% and 10% of significance level, respectively (Figure 25). The annual average recorded were 1250 mm year-1 for Los Arrayanes station and 969.1 mm year-1 for the Tolón floodgate station. Rainfall contribution recorded by these stations decreased between 250 and 550 mm year –1 during 33 years of sampling However, rainfall recorded by the Simijaca station its annual average was 772 mm year-1 and did not show any trend24 (Appendix 8).
20 El Espino: Univariate test of significance, N=22, d.f. (1,20), F=4,89, p<0,05; Monserrate: Univariate test of significance, N=30, d.f. (1,28), F=2,96, p<0,1; Zarzal: Univariate test of significance, N=29, d.f. (1,27), F=2,92, p<0,1 21 Univariate test of significance, N=33, d.f. (1,31), F=0,55, p>0,1 22 Isla Santuario: Univariate test of significance, N=28, d.f. (1,26), F=0,1, p>0,1 23 Los Arrayanes: Univariate test of significance, N=33, d.f. (1,31), F=10,19, p<0,05; Tolón floodgate: Univariate test of significance, N=33, d.f. (1,31), F=3,24, p<0,1 24 Simijaca: Univariate test of significance, N=16, d.f. (1,14), F=1,05, p>0,1
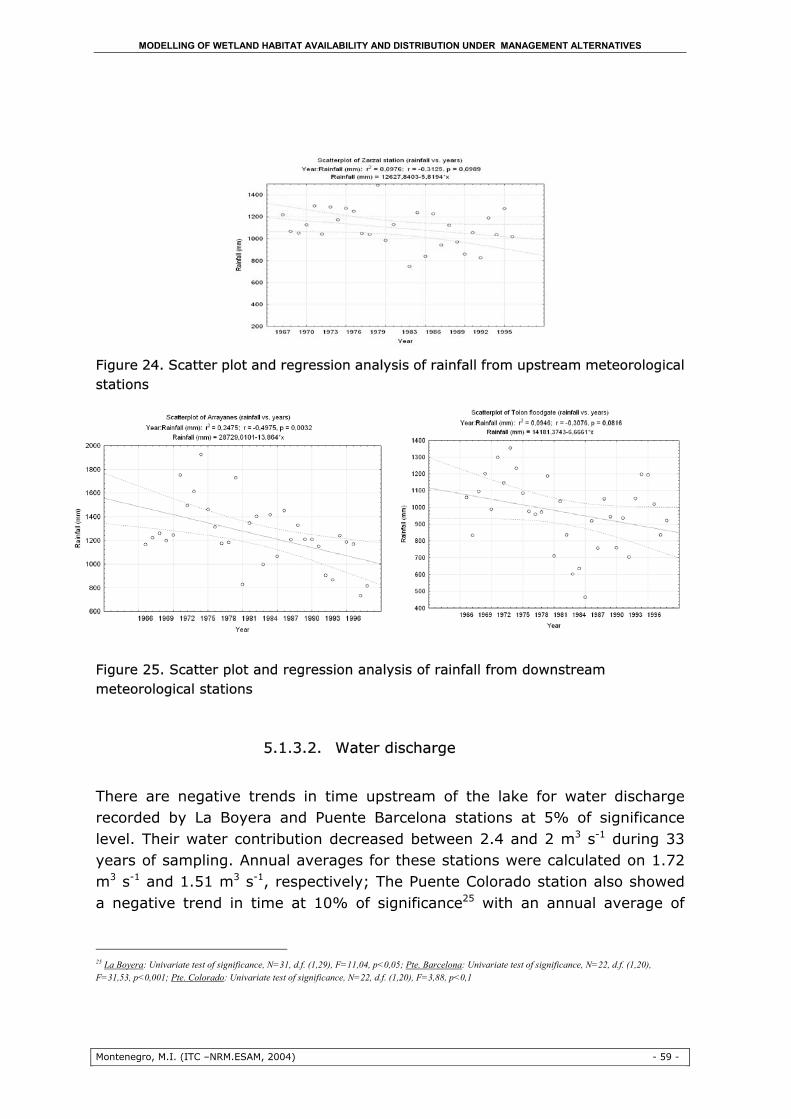
MODELLING OF WETLAND HABITAT AVAILABILITY AND DISTRIBUTION UNDER MANAGEMENT ALTERNATIVES
Montenegro, M.I. (ITC –NRM.ESAM, 2004) - 59 -
Figure 24. Scatter plot and regression analysis of rainfall from upstream meteorological stations
Figure 25. Scatter plot and regression analysis of rainfall from downstream meteorological stations
5.1.3.2. Water discharge
There are negative trends in time upstream of the lake for water discharge recorded by La Boyera and Puente Barcelona stations at 5% of significance level. Their water contribution decreased between 2.4 and 2 m3 s-1 during 33 years of sampling. Annual averages for these stations were calculated on 1.72 m3 s-1 and 1.51 m3 s-1, respectively; The Puente Colorado station also showed a negative trend in time at 10% of significance25 with an annual average of
25 La Boyera: Univariate test of significance, N=31, d.f. (1,29), F=11,04, p<0,05; Pte. Barcelona: Univariate test of significance, N=22, d.f. (1,20), F=31,53, p<0,001; Pte. Colorado: Univariate test of significance, N=22, d.f. (1,20), F=3,88, p<0,1

MODELLING OF WETLAND HABITAT AVAILABILITY AND DISTRIBUTION UNDER MANAGEMENT ALTERNATIVES
Montenegro, M.I. (ITC –NRM.ESAM, 2004) - 60 -
4.03 m3 s-1 (Figure 26). However, it is not possible to predict a trend in time of water discharge at Puente La Balsa station26 (Appendix 9). La Balsa and Puente Guzman recorded negative trends in time for water discharge27 at 5% and 10% of significance level, respectively; whose contribution decreased between 0.5 and 7.2 m3 s-1 during 33 years of sampling. Averages for these stations were 6.3 and 0.89 m3 s-1, respectively (Figure 27). However, water discharge data from Puente Peralonso station did not show any trend through the years28 (Appendix 10).
Figure 26. Scatter plot and regression analysis of water discharge from upstream stations
26 Puente la Balsa: Univariate test of significance, N=10, d.f. (1,10), F=0,37, p>0,1 27 La Balsa: Univariate test of significance, N=22, d.f. (1,25), F=7,28, p<0,05; Pte. Guzman: Univariate test of significance, N=22, d.f. (1,22), F=3,82, p<0,1 28 La Balsa: Univariate test of significance, N=24, d.f. (1,22), F=1,28, p>0,1

MODELLING OF WETLAND HABITAT AVAILABILITY AND DISTRIBUTION UNDER MANAGEMENT ALTERNATIVES
Montenegro, M.I. (ITC –NRM.ESAM, 2004) - 61 -
Figure 27.Scatter plot and regression analysis of water discharge from downstream stations
5.1.3.3. Ground water level
All ground water measurements evidence trends in time. The results showed negative trends in time of water discharge recorded by La Albaida and Tichauribe stations at 5% of significance level29 (Figure 28). The groundwater level decreased 0.5 and 0.3 m for La Albaida and Tichauribe stations, respectively. Nevertheless, results showed positive trends in time of ground water level recorded by La Maria and Esmeralda III stations at 5% of significance level30. Ground water level for these stations has increased 0.1 and 0.8 m, respectively (Figure 29).
29 La Albaida: Univariate test of significance, N=13, d.f. (1,11), F=9,49, p<0,05) (Tichauribe: Univariate test of significance, N=37, d.f. (1,35), F=19,3, p<0,001 30 La Maria: Univariate test of significance, N=13, d.f. (1,11), F=7,77, p<0,05; Esmeralda III: Univariate test of significance, N=34, d.f. (1,32), F=8,8, p<0,05

MODELLING OF WETLAND HABITAT AVAILABILITY AND DISTRIBUTION UNDER MANAGEMENT ALTERNATIVES
Montenegro, M.I. (ITC –NRM.ESAM, 2004) - 62 -
Figure 28. Scatter plot and regression analysis of groundwater for La Albaida and Tichauribe stations
Figure 29. Scatter plot and regression analysis of groundwater for La Maria and Esmeralda III stations
5.1.3.4. Water Level of the Fúquene Lake
The results showed that is not possible to identify any trend in time in the water level of the lake31 (Figure 30). The water level falls in a range between 2540 m.a.s.l and 2538 m.a.s.l. (Figure 6), but there is not a particular trend in time that can explain periodic variations
31 Univariate test, N=33, d.f. (1,31), F=0,001, p>0,1

MODELLING OF WETLAND HABITAT AVAILABILITY AND DISTRIBUTION UNDER MANAGEMENT ALTERNATIVES
Montenegro, M.I. (ITC –NRM.ESAM, 2004) - 63 -
Figure 30. Scatter plot and regression analysis of Fúquene’s water level
5.1.3.5. Sediments and nutrients of the Fúquene Lake
Sediments and nutrients concentrations were collected during local campaigns developed when local communities were alerted by non-normal conditions of water. Taking this into consideration, the concentrations can be overestimated, except for specific cases, as one sample taken in 1997 and three samples taken in 1999 when regular samplings were made. Therefore, the data is not reliable to predict potential trends of sediments and nutrients in the lake over time, but it was used as a reference point to identify possible concentrations ranges. Sediments seemed to be more concentrated on the inlet and outlet rivers than on the other two stations32,33. The QL4 station located on the mouth of Suarez River recorded a maximum of 37 mg l-1 of suspended solids, and QL1 located on the mouth of Ubaté River recorded a maximum of 23 mg l-1 of suspended solids (Appendix 12). Chemical Oxygen Demand (COD) did not change among stations ranging between 30 mg l-1 to 25 mg l-1 (Appendix 13). Total nitrogen fell between 1.8 and 2 mg l-1 (Appendix 14). Total phosphorus data ranged between 0.06 and 0.1 mg l-1(34) (Appendix 15).
32 QL1: Univariate test of significance, N=8, d.f. (1,6), F=1.64, p>0,1) (QL2: Univariate test of significance, N=4, d.f. (1,2), F=1.64, p>0,1) (QL3: Univariate test of significance, N=5, d.f. (1,3), F=0,4, p>0,3) (QL4: Univariate test of significance, N=9, d.f. (1,7), F=0,78, p>0,1 33 Average for QL1 station = 10 mg/l; average for QL4 station= 10,57 mg/l) 34 QL1: Univariate test of significance, N=5, d.f. (1,3), F=0,53, p>0,1) (QL2: Univariate test of significance, N=4, d.f. (1,2), F=0,09, p>0,1) (QL3: Univariate test of significance, N=5, d.f. (1,3), F=1.11, p>0,1) (QL4: Univariate test of significance, N=7, d.f. (1,5), F=0,38, p>0,1
MODELLING OF WETLAND HABITAT AVAILABILITY AND DISTRIBUTION UNDER MANAGEMENT ALTERNATIVES
Montenegro, M.I. (ITC –NRM.ESAM, 2004) - 64 -
Negative trends in time were found from the QL3 station at 5% of significance level35 for COD and at 10% of significance level36 for total nitrogen; however, this result will require further analysis due to the fact that nutrients data were collected under subnormal conditions.
5.1.3.6. Sediments and nutrients of nearby water bodies
Higher values of sediments were recorded by QR3 station (21.6 mg l-1) and QR6 station (22.8 mg l-1), which are located on main rivers (the Ubaté and Suarez rivers, respectively) on flat areas (Appendix 17). The Q3 station (40.2 mg l-1) and Q6 station (50.6 mg l-1) that are located on inlet and outlet rivers respectively, showed the higher COD concentration37 (Appendix 18). Moreover, The QR3 station recorded the highest value for total nitrogen (3.93 mg l-1) (Appendix 19) and total phosphorus (0.35 mg l-1) (Appendix 20). Some trends on time were found for a few stations. The QR6 station showed a negative trend in time for sediments at 5% of significance level38 . A positive trend in time for total nitrogen was found from the AD8 station at 5% of significance level39. Finally, total phosphorus showed a positive trend in time for the QR3, AD9 and AD10 stations at 10% of significance level40. As it was mentioned before, these trends should be analyse carefully based on periodic analysis of the sampling points in order to corroborate them. As a summary, even thought the water inflow (i.e. rainfall, water discharge and ground water level) is gradually decreasing on the study area, they do not seem to influence the water level of the lake. Eutrophication and siltation processes reported previously in the area [23], and supported by the available nutrient and sediment data suggest that the lake is being silted, which represent changes on its water depth. Besides the high sediment discharge that flows into the lake, an Alluvium located to the Northwest side of the lake is 35 QL3: Univariate test of significance, N=5, d.f. (1,3), F=36,42, p<0,05). No additional stations showed trends 36 QL3: Univariate test of significance, N=5, d.f. (1,3), F=7,83, p<0,1 37 QR3: Univariate test of significance, N=6, d.f. (1,4), F=0,14, p>0,1) (AD9: Univariate test of significance, N=4, d.f. (1,2), F=0,72, p>0,1) (AD8: Univariate test of significance, N=4, d.f. (1,2), F=0,17, p>0,1) (AD10: Univariate test of significance, N=4, d.f. (1,2), F=2,61, p>0,1) (QR6: Univariate test of significance, N=7, d.f. (1,5), F=0,0074, p>0,1 38 QR6: Univariate test of significance, N=9, d.f. (1,7), F=11.3, p<0,05 39 AD8: Univariate test of significance, N=4, d.f. (1,2), F=517,46, p<0,05 40 QR3: Univariate test of significance, N=9, d.f. (1,7), F=4,95, p<0,1). No additional stations showed trends) (AD9: Univariate test of significance, N=4, d.f. (1,2), F=13,43, p<0,1

MODELLING OF WETLAND HABITAT AVAILABILITY AND DISTRIBUTION UNDER MANAGEMENT ALTERNATIVES
Montenegro, M.I. (ITC –NRM.ESAM, 2004) - 65 -
reducing the normal flow of water, and thus, maintaining constant the current water level. (Figure 5)
5.1.3.7. Change in depth of the Fúquene Lake (1984 – 1997)
According to the analysis, there is decrease of the water depth of the lake, probably caused by siltation (Figure 31). An estimation of the water balance41 reached a volume of 2’082,000 m3; with a total water volume loss of 3’061,000 m3 for a period of 13 years Table 5. In addition, changes on water depth (Figure 31) shows on red colour that erosion is concentrated especially on the Northwest side of the lake. The total gain of volume in water was calculated as 979,700 m3. This analysis suggests that a siltation process is bringing about important modification on the lake bottom, and hence on the biological components that are supported on the lake, such as wetland habitats distribution and extent.
Table 5. Change of water volume (m3) of the Fúquene Lake (1984 - 1997)
5.2. Model of the wetland habitats types
The model of water depth suggests that it will continue reducing between 0.1 to more than 2 meters within the projected period of 16 years. However there are small areas on the lake’s bottom that will continue with an erosive process,
41 Water balance is equivalent to the difference between water volume gain and water volume loss during compared years.
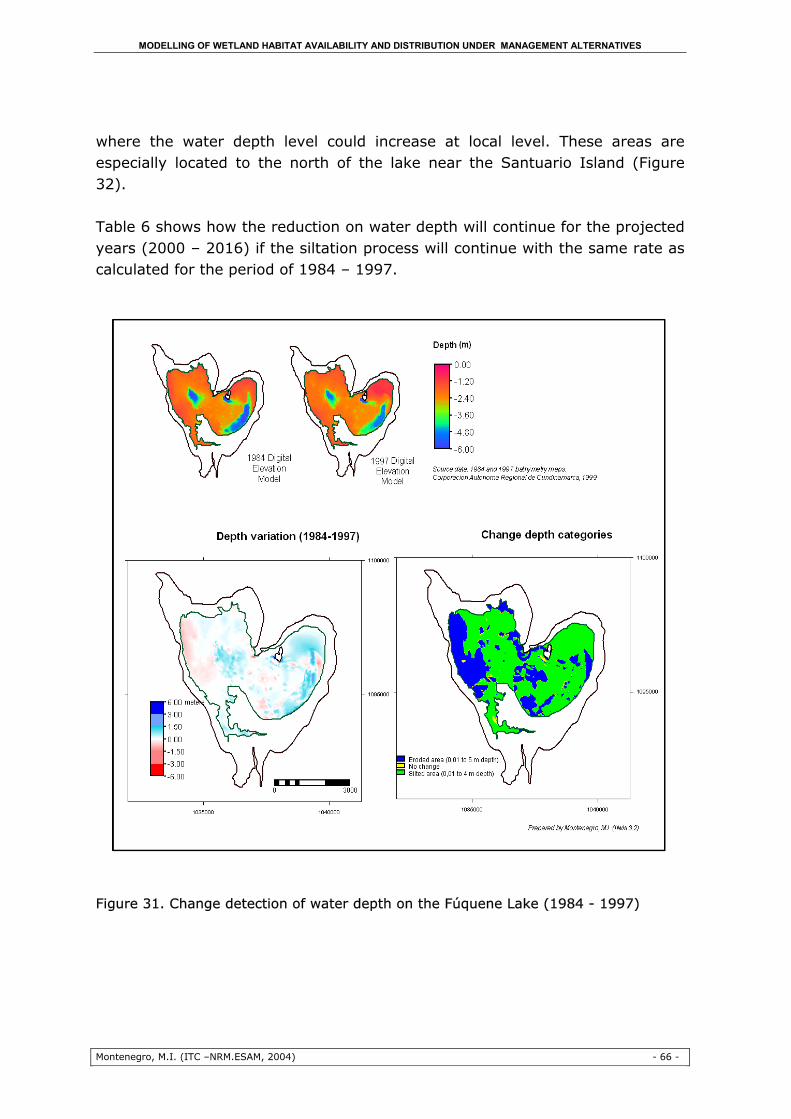
MODELLING OF WETLAND HABITAT AVAILABILITY AND DISTRIBUTION UNDER MANAGEMENT ALTERNATIVES
Montenegro, M.I. (ITC –NRM.ESAM, 2004) - 66 -
where the water depth level could increase at local level. These areas are especially located to the north of the lake near the Santuario Island (Figure 32). Table 6 shows how the reduction on water depth will continue for the projected years (2000 – 2016) if the siltation process will continue with the same rate as calculated for the period of 1984 – 1997.
Figure 31. Change detection of water depth on the Fúquene Lake (1984 - 1997)

MODELLING OF WETLAND HABITAT AVAILABILITY AND DISTRIBUTION UNDER MANAGEMENT ALTERNATIVES
Montenegro, M.I. (ITC –NRM.ESAM, 2004) - 67 -
Figure 32. Predicted change on water depth and wetland habitats distribution
The water volume gain will vary from 1’204,000 m3 in the year 2000 to 2’410,000 m3 in the year 2016. An increase of 23% of water volume gain was calculated for the starting year (2000) with respect to the year 1984 (Table 6). Whereas, a reduction of the water depth will bring about a water loss of about 3’766.675 m3 on the year 2000 to 7’534,538 m3 on the year 2016 with respect to the year 1997.
Table 6. Annual projection of variation on water depth of the Fúquene Lake (2000 – 2016)

MODELLING OF WETLAND HABITAT AVAILABILITY AND DISTRIBUTION UNDER MANAGEMENT ALTERNATIVES
Montenegro, M.I. (ITC –NRM.ESAM, 2004) - 68 -
On the other hand, the calculated area for Habitat I in the year 1984 was 696.4 ha and 691.2 ha in the year 1997. Whereas, Habitat II, with an area of 149.7 ha in the year 1984 and 108.3 ha in the year 1997, was possibly underestimated when some pixels values during the image classification were assigned to the “transitional zone” class.
Table 7. Calculated area of the cover classes of the Fúquene Lake (1984 – 1997)
The model of changes of the wetland habitat area, predicted an increase of the susceptible area to be occupied by Habitat I through the years, which would cover important portions of the south and north of the lake. The area of Habitat I, (Figure 32) will increase from 693 ha in the year 2000 to 734 ha in the year 2016. The transitional zone, which will cover an area of 641 ha in the year 2000, will decrease and be replaced for occupied areas either by Habitat I or Habitat II in the year 2016 (Table 8). Habitat II with a smaller area than Habitat II (105 ha), will also increase to 185 ha during this span time, according to the model. Finally, open water will be colonized by vegetation and will decrease its surface from 157 ha for the year 2002 to 116 ha for the year 2016.
Table 8. Predicted change on area (ha) of cover classes of the Fúquene Lake (2000, 2004, 2008, 2012, 2016)
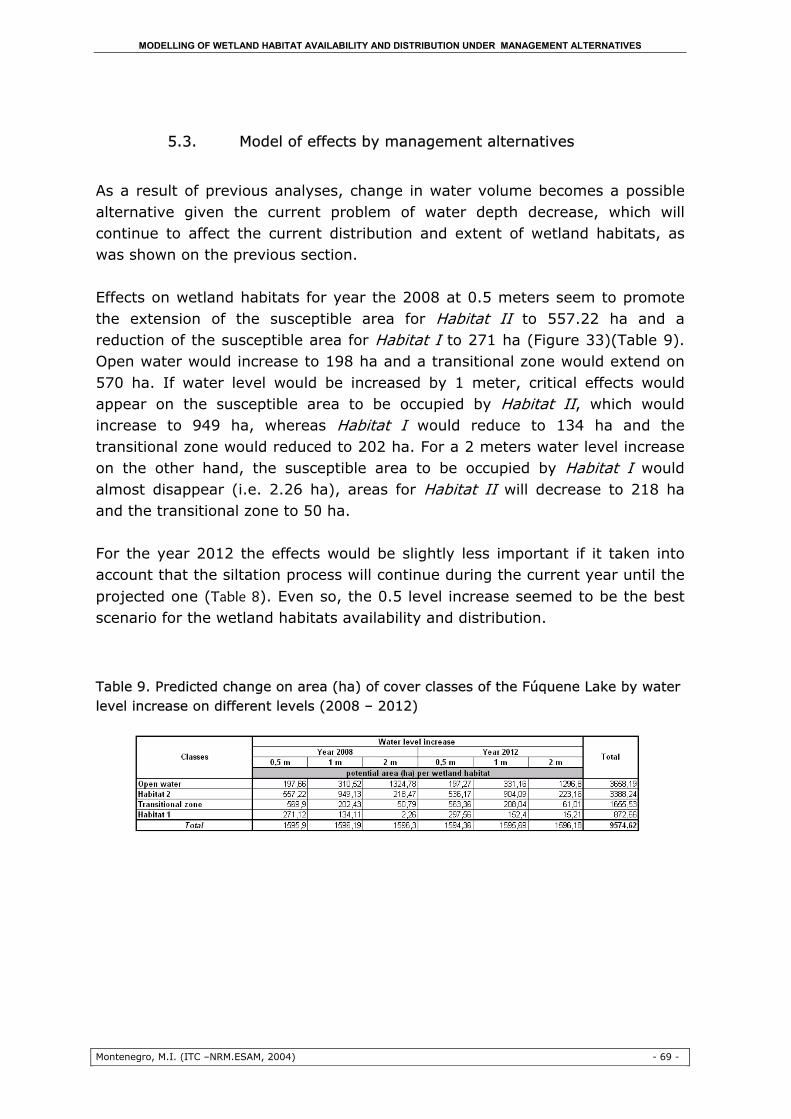
MODELLING OF WETLAND HABITAT AVAILABILITY AND DISTRIBUTION UNDER MANAGEMENT ALTERNATIVES
Montenegro, M.I. (ITC –NRM.ESAM, 2004) - 69 -
5.3. Model of effects by management alternatives
As a result of previous analyses, change in water volume becomes a possible alternative given the current problem of water depth decrease, which will continue to affect the current distribution and extent of wetland habitats, as was shown on the previous section. Effects on wetland habitats for year the 2008 at 0.5 meters seem to promote the extension of the susceptible area for Habitat II to 557.22 ha and a reduction of the susceptible area for Habitat I to 271 ha (Figure 33)(Table 9). Open water would increase to 198 ha and a transitional zone would extend on 570 ha. If water level would be increased by 1 meter, critical effects would appear on the susceptible area to be occupied by Habitat II, which would increase to 949 ha, whereas Habitat I would reduce to 134 ha and the transitional zone would reduced to 202 ha. For a 2 meters water level increase on the other hand, the susceptible area to be occupied by Habitat I would almost disappear (i.e. 2.26 ha), areas for Habitat II will decrease to 218 ha and the transitional zone to 50 ha. For the year 2012 the effects would be slightly less important if it taken into account that the siltation process will continue during the current year until the projected one (Table 8). Even so, the 0.5 level increase seemed to be the best scenario for the wetland habitats availability and distribution.
Table 9. Predicted change on area (ha) of cover classes of the Fúquene Lake by water level increase on different levels (2008 – 2012)
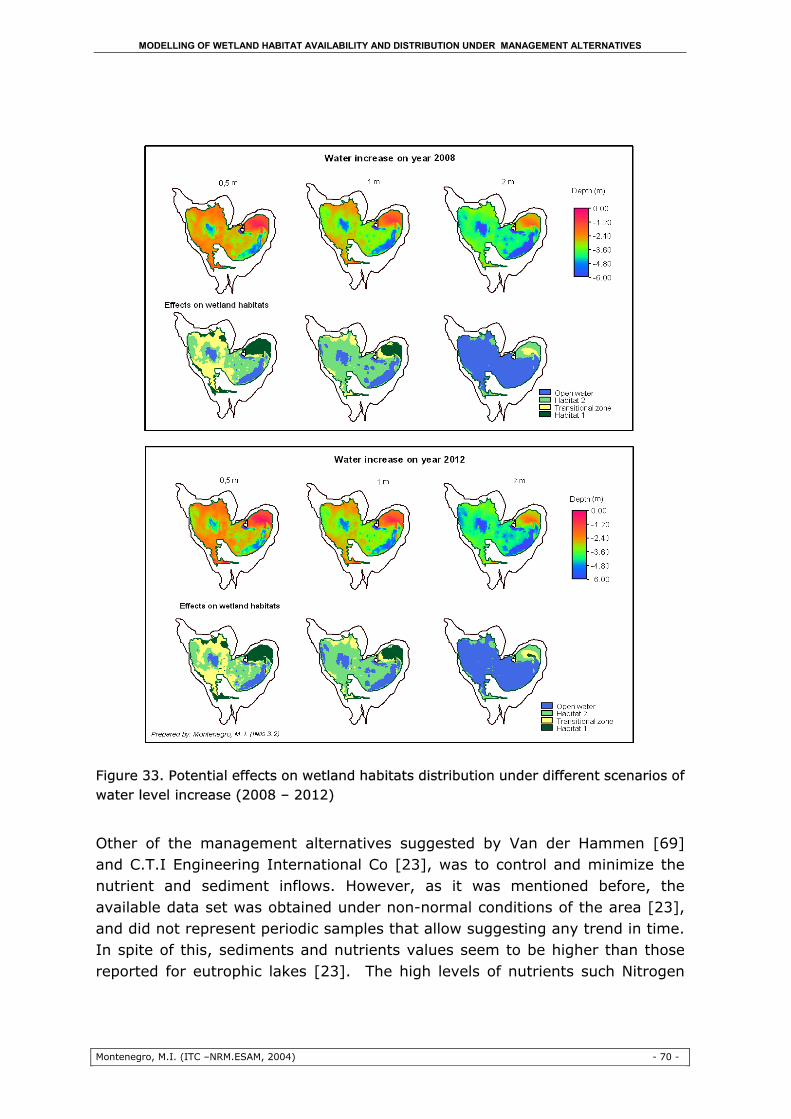
MODELLING OF WETLAND HABITAT AVAILABILITY AND DISTRIBUTION UNDER MANAGEMENT ALTERNATIVES
Montenegro, M.I. (ITC –NRM.ESAM, 2004) - 70 -
Figure 33. Potential effects on wetland habitats distribution under different scenarios of water level increase (2008 – 2012)
Other of the management alternatives suggested by Van der Hammen [69] and C.T.I Engineering International Co [23], was to control and minimize the nutrient and sediment inflows. However, as it was mentioned before, the available data set was obtained under non-normal conditions of the area [23], and did not represent periodic samples that allow suggesting any trend in time. In spite of this, sediments and nutrients values seem to be higher than those reported for eutrophic lakes [23]. The high levels of nutrients such Nitrogen

MODELLING OF WETLAND HABITAT AVAILABILITY AND DISTRIBUTION UNDER MANAGEMENT ALTERNATIVES
Montenegro, M.I. (ITC –NRM.ESAM, 2004) - 71 -
and Phosphorus compounds alter the normal nutrient cycle, by stimulating more bacteria production for their absorption for higher levels on the food web. Most of these nutrients are incorporated as detritus on the lake’s bottom and modify the conditions of its soil in such way that can influence distribution of certain species of plants. However, there is not enough information to model spatially the behaviour of nutrients and sediments of the Fúquene Lake, and therefore to establish their effects on the wetland habitats. Therefore this alternative will require of a further improvement of the current data set through the periodic sampling of nutrients and sediments during the wet and dry seasons, with a precise identification of the geographical position of sampling points, with purposes of modelling.

MODELLING OF WETLAND HABITAT AVAILABILITY AND DISTRIBUTION UNDER MANAGEMENT ALTERNATIVES
Montenegro, M.I. (ITC –NRM.ESAM, 2004) - 72 -
6. DISCUSSION
6.1. Wetland habitats for bird species
The use of remote sensing and geographical information systems on conservation matters requires that biological attributes of species or ecosystems for instance, can be easily recognized and represented on spatial formats [19]. Such attributes should also be susceptible to environmental changes that can be measured in order to assess the current status of the biological variable otherwise, predict potential changes influenced by external or internal factors. This is the case of the Fúquene Lake. The lake is inhabited by threatened species that have found areas there to establish themselves. The indicator of such wetland habitats is aquatic vegetation, which as Davidson and colleagues states [19], is susceptible to changes on climatic, hydrological and ecological conditions that can be measured. Furthermore, aquatic vegetation plays an important role in the food web by connecting inorganic strata with the biotic community [65]. In addition, bird species presence is linked to the availability of certain type of vegetation. Under normal conditions, the two wetland habitats identified in the Fúquene Lake should be subject to natural successional process that determines their distribution and availability on the lake. This process starts with the colonization of surface water by prairies of floating herbs or nomadic rooted herbs, which later are replaced by rooted emergent plants. Littoral areas between 0 and 2 m water depth are often colonised by submerged vascular plants that are less subject to surface-water currents, which tend to remove residues [72]. Natural mechanisms, such as competition, control the distribution of the wetland habitats through the establishment of plant association that increase the biomass of certain types of plant formations [26]. According with the regional environmental authority, 20 years is the estimated rate of change from prairies of herbs to rooted emergent plants [23]. However, the wetland habitats of the Fúquene Lake are being undergone by non-sustainable management, which is changing the natural distribution and
MODELLING OF WETLAND HABITAT AVAILABILITY AND DISTRIBUTION UNDER MANAGEMENT ALTERNATIVES
Montenegro, M.I. (ITC –NRM.ESAM, 2004) - 73 -
availability of the wetland habitats. In fact, high nutrient concentrations in the lake produces an increase of certain habitat type due to its ability to survive under enriched nutrient conditions [69] ([72]. Indeed, as Wheeler documented, the more increase of macrophytes growing in shallow areas the faster sediment accretion [72]. According to the analysis the wetland habitats (Habitat I and II) are increasing, and the surface water is diminishing. The surface water represented as the “open water class” in the analysis covered 56% of the lake surface in 1987, but just reached 19% of the total area of the lake in 1999. Whereas, the Habitat I and II have increased on 190 ha and 309 ha respectively, from 1987 and 2002. This study calculated the growth rate of the wetland habitats on 32.5 ha year-1
from 1987 to 2002. This value can be compared with the growth rate of aquatic vegetation estimated by regional environmental authority [23], which varies from 24.5 ha year-1 between 1940 and 1988 to 50.4 ha year-1 between 1989 and 1999. It is important to take into account that the analysis on habitat area from the satellite images compared with the 1999 thematic map is influenced by factors such as season when the image or map was produced, and the boundaries of the lake established by the three sources. About this, the 1987 and 2002 satellite images were taken during the dry seasons; hence it assumes that changes on classes for seasonality are neglected. However, the seasonal period represented by 1999 vegetation map is unknown. In addition, even though the three spatial sources used the same boundary to delineate calculations of habitat areas, the 1999 map represented 171.92 ha less than 1987 land cover map. Now, the analysis suggested that there is a trend per bird species of inhabiting certain habitats. These species are characterized for small populations, endemism pattern, and secretive habits, which makes difficult their observations [33]. At this point, Rallus semiplumbeus inhabits mainly reedy marshes [27]. Therefore, tall and dense vegetation are its preferable habitat because offered it refuge, feeding and nesting areas [5; 27; 60]. This study corroborated this trend and also found that floating vegetation (Habitat II), is also inhabited as part of their ability to live in heterogeneous habitats. Likewise, Cistothorus apolinari apolinari, which belongs to distant family of R. semiplumbeus (i.e. Troglodytidae), prefers inhabit areas with tall grasses near water [61]. This bird species is associated with bulrush (Scirpus californicus)
MODELLING OF WETLAND HABITAT AVAILABILITY AND DISTRIBUTION UNDER MANAGEMENT ALTERNATIVES
Montenegro, M.I. (ITC –NRM.ESAM, 2004) - 74 -
and cattails (Typha latifolia) in marshes, as it was suggested by the analysis of the results of this study [34; 60; 61; 67] . Finally, Gallinula melanops bogotensis, prefers heterogeneous habitats, such reeds and floating vegetation, but is more adapted to habitats with floating vegetation than rails, given its lobed toes. This anatomic adaptation allow it to swim better than R.semiplumbeus, when looks for food [27]. In brief, the analysis of this study corroborates a relationship between the bird species and the wetland habitats. Consequently, whatever measures can be implemented on the wetland habitats will affect the distribution of the bird species. Thus, an understanding of the ecological and hydrological factors that influence the distribution and availability of wetland habitats became on a priority in order to simulate the potential effects of management alternatives.
6.2. Analysis of the Wetland Habitat Model
Some authors have pointed out that eco-hydrological variables influence the availability and distribution of wetland habitats [26; 71] [64]. Most of them determine the hydrological regime of a certain wetland in terms of water inflows and outflows. An expected dynamic of the hydrological regime for this area would be reflected by a relation between rainfall, water discharge and ground water level as water inflows, and evaporation and infiltration as water outflows. Rainfall diminished compared to the one observed 30 years ago. In addition, the relation precipitation and evaporation has been modified, in terms that the water demand has increased and more crops release water by evapotranspiration [71]. Likewise, the water discharge of surface water has diminished as result of a decrease on rainfall, and possibly infiltration and evaporation, even though these last factors were partially analyzed in this study. In addition, surface water is mainly used on the area for irrigated purposes, as well as industrial and domestic use [23]. Now, groundwater level also showed a decrease especially on the mountainous area, due to deforestation [23; 69]. In other words, scarce land cover minimises the water infiltration and also the retention capacity of land to absorb water. However, a different situation was observed on the groundwater stations located on flat areas, whose levels tend to
MODELLING OF WETLAND HABITAT AVAILABILITY AND DISTRIBUTION UNDER MANAGEMENT ALTERNATIVES
Montenegro, M.I. (ITC –NRM.ESAM, 2004) - 75 -
increase. Main reasons for this behaviour are related with conveyance loss of the irrigation canals and the losses from surface water irrigation [23]. Theoretically, the effects of water inflows and outflows could be measured on the water level of the lake, which might indicate any change in the surface water storage as an which an important parameter in the water balance [26]. At the study area, water level seemed not to change. According to the regional environmental authority [23] the downstream Tolón floodgate controls the water level of the lake. Moreover a natural barrier plays the same role: An Alluvium surrounding the lake that crosses the Suarez River mouth (Figure 5). The sediment and nutrient contribution to the lake constitutes an additional set of ecological variables that affect the lake dynamics. In this matter, aquatic vegetation develops an important role during the elimination of nutrients and absorption from sediments. Vegetation produces oxygen and support the elimination of toxic substance [33]; and even the conditions could be extreme, vegetation reacts in terms of availability and distribution. Sediments, for instance, are highly concentrated on the inlet and outlet rivers of the lake, even though water discharge is gradually decreasing. The possible causes refer to deforestation, which cause an increase on the runoff due to the land cover incapacity to retain water. Then, erosion increases and the land material is transported and deposited in the riverbed and then, the lake. The sediments in the lake cause decreasing on the water depth, as it was analyzed by the results of this study. Sediments are deposited on different sectors in the lake possibly by water currents. Some authors stated that sediments are mainly deposited on the littoral sectors when the sedimentation carrying capacity is higher than the rest of the lake [71]. The process is reinforcing in a way that such as more sediments reach the photic zone, the productivity of higher aquatic plants accelerates. For instance, it has been reported Scirpus sp. plays a role in the drought process of the Fúquene Lake, because its roots ties each other permanently and its stems accelerate organic and inorganic matter deposition [23]. This study did not develop any analysis about water currents because of lack of information about this issue, but is highly recommended to deep on the understanding of their dynamics. According to CAR [23] sedimentation rate is high, specially near to the Ubaté mouth. The annual average contribution of sediments is 16,068 m3, with an

MODELLING OF WETLAND HABITAT AVAILABILITY AND DISTRIBUTION UNDER MANAGEMENT ALTERNATIVES
Montenegro, M.I. (ITC –NRM.ESAM, 2004) - 76 -
annual average of sediment deposition on the lake bottom of 1.6 mm on a silted area of 3000 ha. In spite of the sampling antecedents of nutrient and sediment collection explained in the Chapter 4, concentrations of total nitrogen and total phosphorus in the lake have been reported as described from eutrophic lakes [23], whose concentrations are higher than 0.2 mg l-1 and 0.02 mg l-1, respectively. Likewise, nutrient concentrations recorded from nearby watersheds are higher than the standard values considered for lakes [23]. Nutrients concentrations are higher on the main rivers (i.e. Ubaté River (QR3 station) and Suarez River (QR6 station), than in other stations located nearby mountainous areas, possibly because they accumulates the total nutrient discharges from their tributaries. The nutrient contribution is causing the eutrophication of the lake. According to Wetzel [71], phosphorus and nitrogen loadings to lakes also vary greatly with patterns of land use, geology and morphology of the drainage basin and soil productivity. CAR identified point pollution sources (i.e. residual waters from sewer systems, slaughterhouses, and industries in the urban area) and non-point pollution sources (i.e. residual waters from cattle dairy, agriculture, and domestic use on rural areas) that discharge in the lake. This regional authority stated that there is no change on water quality through 2 km before Ubaté River goes into the Fúquene Lake [23]. Now, changes in the proportionate contribution of nutrients may be expected to affect the floristic composition of wetlands, even when there is no change in water levels [71]. About this, Schmidt suggests for instance, that excessive nutrients on water bodies of overall region produce a considerable growing of floating plants, and especially of emergent nomadic prairies constituted by Eichhornia crassipes [65] A deeper understanding of the problems of relating plant species and the water table behaviour could be influenced for other environmental and biotic variables that can modify the interrelationships between plants and water conditions. In fact, species distributions within a given water regime are in a state of change, or because inertia against change permits the persistence of some species in sub-optimal conditions [72].

MODELLING OF WETLAND HABITAT AVAILABILITY AND DISTRIBUTION UNDER MANAGEMENT ALTERNATIVES
Montenegro, M.I. (ITC –NRM.ESAM, 2004) - 77 -
6.3. Analysis of the Management Alternative Model
The decrease of the water depth in the lake represents an indicator of the siltation process that is affecting the lake. As it was mentioned before, plant growth is increasing on area where the sedimentation carrying capacity is higher [71]. The total area of aquatic vegetation has increased to 474.3 ha during 15 years (1987 – 2002), as response of variation on water depth. According to CAR [23] and Van der Hammen [69], the current problems that face the lake are:
• Reduction of water inflows. • Reduction of water storage capacity of the lake, because of water
removal by aquatic plants and siltation • Deterioration of water quality caused by excessive nutrient inflows from
agricultural activities • Reduction of normal water flow in the lake’s inlet and outlet due to
excessive growth of aquatic plants Different approaches have been established in order to manage wetlands in Colombia that deal with their environmental conservation, as recreational and aesthetic places and producers of renewable resources [65]. Objectives in order to accomplished each approach have been proposed for the National Policy of Andean wetlands issued by the Ministry of Environment in Colombia [51]. Studies previously developed on this area, have suggested adopting any of few proposed management alternatives [23; 69]. This study selected three potential alternatives based on literature review, in order to model possible effects on wetland habitats distribution and availability. No additional management. The first alternative is maintaining the current conditions of management. Currently the lake is managed as a water reservoir for irrigation purposes, whose water level is controlled by the Hato Dam located upstream of the lake, and the Tolón floodgate located downstream of the lake [23]. The model derived from this study is a simplified extrapolation from the 1984 and 1997 bathymetry maps that allows predicts trends in area variation for the different

MODELLING OF WETLAND HABITAT AVAILABILITY AND DISTRIBUTION UNDER MANAGEMENT ALTERNATIVES
Montenegro, M.I. (ITC –NRM.ESAM, 2004) - 78 -
water depths. Accordingly, the water loss caused by sedimentation will vary 3’766.675 m3 on the year 2000 to 7’534,538 m3 on the year 2016, whereas the water gain on some areas in the lake will vary from 1’204,000 m3 in the year 2000 to 2’410,000 m3 in the year 2016. The variation depth also implies changes on the suitable areas to be occupied by the wetland habitats, where Habitat I and II would count with more suitable areas in terms of depth, but the transitional zone could be replaced for either one or both habitats. However, the spatial distribution of sedimentation and erosion predicted by the model is not a hundred percent accurate, because the hydrodynamic behaviour of water currents influences the erosion and deposition of sediments in the lake. Certainly, the spatial prediction of water depth will depend on the sediment carrying capacity and the water current speed; in other words, a linear prediction of the spatial distribution of sediments in the lake is not necessarily on a pixel by pixel, but a interaction between sediment carrying capacity and water current speed to determine the specific place to deposit or erode sediments. An illustration of this is given by the modelling of the transitional zone. The model represents the variation on water depth by pixel in such a way that deepen areas will become deepener and shallow areas will become shallower through the years (i.e. projected period of 16 years). Then, the slope between both areas will also increase, which is reflected as a narrower transitional zone. In this case, the decrease of the transitional zone is less evident do to different zonation between silted and eroded areas on the model. In spite of this, the model suggested that the decrease of water level would continue under this management alternative, possibly as a product of a siltation process. The siltation process is apparently favoured by the Alluvium that crosses the Suarez River mouth at the west side of the lake, and that becomes on a local eroded threshold, which facilitates the sediment accumulation on the outlet of the lake. Changes on water depth will alter current distribution of wetland habitats and therefore, presence of associated species such the threatened bird species considered on this study. Regarding to the spatial distribution of wetland habitats, the model is able to simulate the potential areas to be occupied by the habitat types, taking into consideration the limitations mentioned above, and additional biological variables that influence distribution and availability of plants. In spite of this, the model showed an increase on habitat I, as part of the expected
MODELLING OF WETLAND HABITAT AVAILABILITY AND DISTRIBUTION UNDER MANAGEMENT ALTERNATIVES
Montenegro, M.I. (ITC –NRM.ESAM, 2004) - 79 -
consequences by siltation. The bird species, in this case apparently would not be affected by the wetland habitats distribution and availability, even though there is no information about the habitat quality According to CAR, the current irrigated system could be increased on flat areas in the year 2010 in order to solve water deficits of some irrigation blocks [23]. Thus, it is expected the total area will be increased additionally on 3246 ha for the year 2010, which implies an increase of 15% of current area. In the case this alternative was chosen, strict calculations should be adopted in order to improve the current operation rule for the Fúquene Lake and avoid additional problems for increased on water demand. Increase water level of the Fúquene Lake Increasing water level seems to be a good alternative to restore the normal dynamic of the lake and maintain the wetland habitats. This management alternative could be implemented either by dredging the lake bed [23] or building a floodgate on the Suarez River mouth taking advantage of the geological threshold. However, each different scenario in terms of the water level to be increased should be analysed carefully in order to avoid the fragmentation of disappearance of the wetland habitats, hence the bird populations. The CAR is analysing the optimization of the current operation rule for the Fúquene Lake [23]. The Hato Dam located upstream of the lake, stores water during the wet season and use it during the dry season. It contributes to maintain the water level of the Fúquene Lake, either to prevent flooding or drought. Two possible scenarios recommended by CAR were increase of water depth of the lake on 15 cm and 25 cm. The model simulates three different scenarios of water depth increase. According with the analysis, the 0,5 m increase scenario seemed to be the best option given that it shows a better representation of the wetland habitats. Whatever method to increase current water level, should be analysed on a way that representation of wetland habitats can be maintained. Further studies about habitat requirements should also developed in order to determine minimal area for these species. Reduce nutrients intake.
MODELLING OF WETLAND HABITAT AVAILABILITY AND DISTRIBUTION UNDER MANAGEMENT ALTERNATIVES
Montenegro, M.I. (ITC –NRM.ESAM, 2004) - 80 -
Nutrient and sediment concentrations seemed to be higher on the lake with respect to values obtained from eutrophic lakes [23]. Unfortunately, a spatial modelling of effects by management alternatives will require of periodic data collected from point and non-point sources. Therefore, whatever measure to be taken would be better supported under the understanding of nutrient cycle in the study area and their effects on the wetland habitats. Moreover is important to take into account some of the disadvantages attributed by CAR to this management alternative without the enough scientific elements of understanding: 1) Most of the nutrient contribution is provided by non –point sources (i.e. cattle rising, crops, domestic use). 2) The control of point sources would be expensive 3) There is a nutrient reservoir on the lake bottom could maintain even if the siltation was minimised. 4) Aquatic plants also grow on oligotrophic lakes [23]
6.4. Analysis of data and further requirements of data
Even though all the available data sets of biological and ecological variables were reviewed on this study, spatial data was preferred as main input for the model design. In addition, records of the eco-hydrological data with additional geographical data were used during the analysis of possible trends. Except for the nutrient and sediment data set, most of the data was useful even though was previously checked and processed before incorporating into the analysis.
The development of the models to simulate current conditions or predicts potential changes required of assumptions about how the biological and eco-hydrological environmental variables behave in order to represent their interactions. For instance, the relationship between the bird species and habitats handled two main assumptions. First, it was assumed that bird observations reflect distribution. That means each record represents a real occurrence of each species in that habitat. However, it also means that each no record of a particular species should be assumed just as a record of absence, but not as a statement of absence of the species on this specific habitat [19]. Secondly, it was assumed that observations reflect the environmental selection of the species [19]. In this case, results on bird distribution tend to describe only the deterministic components that drive a species’ distribution pattern, but not the stochastic events. Even though the bird data sets do not provide

MODELLING OF WETLAND HABITAT AVAILABILITY AND DISTRIBUTION UNDER MANAGEMENT ALTERNATIVES
Montenegro, M.I. (ITC –NRM.ESAM, 2004) - 81 -
complete certainty about bird distribution, literature review supported some of the identified relationships. Additionally, the relationship between wetland habitats and the eco-hydrological variables was analysed under the assumption that “there is a correlation between its basic needs and the environmental variables used”. It means that species occur on certain ranges of variables allows identifying relationships. Then, the model is basically focused to develop an adequate description of the cause – effect relationship between the species and environmental variables [19]. Now, some aspects had to take into account during this study, regarding to characteristics of the data. 1. Data format: The original format of most of the data sets could add errors that influence final outputs. For instance, geometric and radiometric errors given by the satellite images could modify the results obtained by the classification process [19]. This study used an Aster satellite image that was previously processed in order to correct those errors; however, possible errors can be added by the Landsat image not only in terms of geometric and radiometric errors, but also in terms of different resolution (i.e. 30 m). In addition, data provided on hard copies, introduced errors associated with the distortion on topographic and thematic maps. 2. Data processing: Additional errors can be summed during data processing through georeferencing, digitising, and classifying. Thus, ways to measure reliability of final outputs should be of support for overall accuracy assessment and sensitivity tests [19]. The overall accuracy of vegetation classification was assessed in this study; however the obtained percentage was lower than 60%. Some of the reasons could be related to differences on the year when the satellite images and the thematic maps were produced. Another cause could be related with the method used to elaborate the 1999 thematic map. This map was obtained from aerial photograph interpretation and many of the polygons were excessively generalized, as each vegetation class appears independent of others. These characteristics influenced the accuracy assessment, and therefore comparison among final maps. Further fieldwork analysis can improve the accuracy of the model. 3. Wetland classification systems: Wetlands and their habitats have being studied by different international institutions and researchers. Different

MODELLING OF WETLAND HABITAT AVAILABILITY AND DISTRIBUTION UNDER MANAGEMENT ALTERNATIVES
Montenegro, M.I. (ITC –NRM.ESAM, 2004) - 82 -
classification systems have been prepared to facilitate a better understanding of the wetland components and their interactions [65]. Even though most of these classification systems follow the same principles, many criteria or parameters cannot be extrapolated to specific areas. A classification approach should be adopted for the study area; taking elements from some recognized systems but adjusted to the local conditions. Ecological and biological criteria should be selected in order to come up with a classification that can be used on whatever wetland on the Andean region. In addition, the classification system should allow the spatial representation of the wetland habitats; therefore, data should be collected in such way that allows the use of remote sensing and geographical information system techniques. 4. Model scale: The scale of the study also deserves special attention. Eco-hydrological models are often highly scale-specific. Models constructed at one scale are not always transferable to a higher or lower temporal/spatial resolution. In GIS distribution models, temporal and spatial scales are generally broadened so that stochastic events can average to a null component and thus be ignored [19]. Available data was developed on different scales, which could be used to model regional or local patterns of the analyzed variables. However, particularly differences on temporal scales reduced the possibility to incorporate some variables to the model, such as nutrients and sediments. In addition, factors vary according to scale, meaning that factors that are important at one scale level can lose their importance, or at least much of it, at others [19] [26]. The model of water depth was useful to visualize potential changes generated by variations on water depth, however, as was explained before, additional factors, such as the hydrodynamic behaviour of the lake, suggests that the model is not a hundred percent accurate in terms of the spatial distribution of silted and eroded areas, and therefore, the wetland habitat distribution. Moreover, the accuracy of the model can be improved if additional ecological variables are identified and incorporated in the model, in order to understand better the lake dynamics. As a summary, models developed on this study could improve in terms of accuracy, if detailed data were gathered about nutrient and sediment concentrations, hydrodynamic patterns, hydraulic behaviour of water currents, habitat stratification, bird population ecology, among others.
MODELLING OF WETLAND HABITAT AVAILABILITY AND DISTRIBUTION UNDER MANAGEMENT ALTERNATIVES
Montenegro, M.I. (ITC –NRM.ESAM, 2004) - 83 -
7. CONCLUSIONS AND RECOMMENDATIONS
Through the integration of remote sensing and geographical information system techniques, models of wetland habitats were prepared to visualize their current conditions in the Fúquene Lake and simulate potential effects under management alternatives. Four major processes were undertaken: land cover mapping, monitoring and modelling, resulting of:
• The definition of relationships between the three species (i.e. Rallus semiplumbeus, Gallinula melanops bogotensis and Cistothorus apolinari apolinari) and the wetland habitats in the Fúquene Lake.
• The establishment of the spatial and temporal distribution of the wetland habitats and other land cover types in the Fúquene Lake
• The identification of environmental variables that influence the hydrological regime and nutrient cycle of the lake, and therefore, affect distribution and extent of the wetland habitats
• The modelling of potential effects on the wetland habitats by management alternatives.
Particular conclusions are presented by objective as follows: Objective 1. Assess the relationship between wetland habitat types and the three bird species Two wetland habitats were identified as areas where the three bird species have been observed. The Habitat I in the year 2002, with an area of 975.26 ha represents mainly emergent herbs, grasses and rushes. Whereas, the Habitat II, with an area of 1039 ha in 2002 represents mainly floating plants associated with a few emergent plants. Their distribution is influenced by variation on water depth: thus, floating vegetation tends to extend over the lake no deeper than 4 meters, and emergent plants are usually observed on the marginal areas of the lake no deeper than 2 meters. The selected three bird species by this study have populations that inhabit the Fúquene Lake. The analysis suggests a relationship between each bird species and certain wetland habitat, which provide them of some conditions (i.e. forage, mating and nesting sites, refuge) to live. Species occurrence tends to

MODELLING OF WETLAND HABITAT AVAILABILITY AND DISTRIBUTION UNDER MANAGEMENT ALTERNATIVES
Montenegro, M.I. (ITC –NRM.ESAM, 2004) - 84 -
be linked to the availability of certain type of vegetation. For instance, R. semiplumbeus and Cistothorus apolinari apolinari prefer habitats with tall and dense vegetation as Habitat I represents, whereas, Gallinula melanops bogotensis seem to be more adapted to areas with a combination of tall reeds and floating plants as Habitat II represents. The relationship between these species and their habitats is strong; in fact, habitat fragmentation has been identified as one of the main threats over their natural populations. Therefore, any effort to protect them will be represent benefit for these species. Objective 2. Model wetland habitat distribution and availability used by the bird species on the study area The distribution of the wetland habitats is influenced by variations on the eco-hydrological variables. Rainfall contribution decreased between 200 and 550 mm during an analyzed period of 33 years (i.e. 1966 to 1999). Water discharge reduced on 2.4 m3 s-1 and ground water level decreased on 0.4 to 2.1 m. In spite of this, it seems they do not influence the water level of the lake, possibly due to the high levels of sediments that are contributed into the lake, which tends to accumulate them on the mouth of Suarez River: Maximum contributions of 23 and 37 mg l-1 of suspended solids have been reported for the Fúquene Lake. Finally, Nutrients, such as nitrogen and phosphorus, reach high concentrations especially for some sampled rivers and streams that flow to the lake. According to the regional authority, these levels are higher even from standard levels of eutrophic lakes. Based on these results, the siltation process was identified as the most relevant environmental factor that affect the current lake’s dynamic. In addition, bathymetric data of the lake was available to simulate spatially effects produced by siltation. The water depth model suggests that the lake’s water depth decreased between 1984 and 1997 and affect distribution and extent of wetland habitats of the study area: 3’061,589 m3 of water were displaced, possibly by sediments, which are mainly concentrated on the northwest side of the lake. The susceptible areas to be occupied by Habitat I in the year 1984 was 696.4 ha and 149.7 ha by Habitat II. A possible reason of the lower area of Habitat II in 1984 compared to the area estimated in the year 1987 (i.e. 709.6 ha); is that 1984-area could be underestimated because of the assignation of pixel values to the class “transitional zone” during the image classification. In case that Habitat II and transitional zone were merged,
MODELLING OF WETLAND HABITAT AVAILABILITY AND DISTRIBUTION UNDER MANAGEMENT ALTERNATIVES
Montenegro, M.I. (ITC –NRM.ESAM, 2004) - 85 -
the change rate of Habitat II increase is calculated on 3.0 ha year-1 during 1984 and 1997 Objective 3. Represent and assess the potential effects of management alternatives on habitat availability and distribution used by the bird species on study area. Three management alternatives were chosen from literature sources to be analyzed. They were selected according to the potential effects they can produce on the wetland habitats. The first alternative proposes to continue with the current management without any additional measures. A linear model was able to simulate changes on water depth for five projected years (i.e. 2002, 2004, 2008, 2012, 2016). The model predicted that erosive processes will vary from 1’204,000 m3 in the year 2000 to 2’410,000 m3 in the year 2016. Such differences on water depth were related with distribution and extent of the wetland habitats. Then, for the projected year of 2000 a Habitat I area will increase from 693 ha to 737 ha in the year 2016. The model also predicts an increase of the Habitat II from 105 ha in the year 2000 to 185 ha in the year 2016. In principle, the area of the wetland habitats will gradually increase, without represent any risk on the natural population of the bird species, at least on terms of their availability. However, the “open water” class is reduced on this span of time. Loss of water volume plus other ecological factors can influence quality of the wetland habitats, which will affect the natural population of the bird species. The second alternative refers to the increase of the lake’s water level. Considering the modelled increases on 0.5 m, 1 m and 2 m water depth affected, the first one become the best alternative, due to the better representation of the two habitats (i.e. Habitat I will increase to 271 ha and Habitat II will increase to 557 ha). This alternative will be on advantage of the distribution of the three bird species. The other alternatives showed specially an increase of the water surface, but a smaller representation of habitats especially of the Habitat I. Finally, the third alternative that implied reducing nutrients inputs in the lake could not be spatially modelled because limitations on the data collection methods. However, the analysis allows suggest that nutrient concentrations

MODELLING OF WETLAND HABITAT AVAILABILITY AND DISTRIBUTION UNDER MANAGEMENT ALTERNATIVES
Montenegro, M.I. (ITC –NRM.ESAM, 2004) - 86 -
are contributing to the current eutrophication process that is nowadays affecting the lake. Even though there is not specific evident of impact caused by nutrient concentrations on the wetland habitats analyzed on this study, there are bibliographic sources that support general effects on aquatic vegetation by variation on nutrient inputs. Objective 4. Evaluate and select the minimal data set to accomplish the aforementioned objectives; and formulate recommendations to improve them. A selection of spatial data was needed in order to handle the better sources to identify relationship between biological components (i.e. wetland habitats and species) and trends in time. Therefore, satellite images were preferred over other spatial sources. However, most of the spatial data provided by the regional authority was previously elaborated and thematic maps on hard copies were supplied, which contributes to add errors during processing (i.e. digitizing and creating “tie point” georeference). The model could predict changes on depth water and wetland habitat area but has a limitation on the representation of the spatial distribution of such variables. First, because it requires of additional inputs on the hydrodynamic of the lake, and second because is able to simulate susceptible areas to be occupied by wetland habitats in terms of water depth, but it could not simulate their distribution in terms of other bio - ecological variables, such as nutrients, sediments contribution or natural succession. In addition, field observations are needed in order to develop in situ sampling methods on variables that can be easily modelled. To this end, gathering of geographical data should be incorporated to ecological studies about the bird species and the wetland habitats. Field data is also required as the main source of comparable data for validation of models. Additional data that this study recommends to gather in order to improve the accuracy of model predictions, is as follows:
• A higher representation of bird count samples taken from the study with geographical records of their occurrence
• Ecological studies about habitat preferences and minimal area suitable by the bird species
MODELLING OF WETLAND HABITAT AVAILABILITY AND DISTRIBUTION UNDER MANAGEMENT ALTERNATIVES
Montenegro, M.I. (ITC –NRM.ESAM, 2004) - 87 -
• Detailed studies on wetland habitats in order to distinguish different types based on ecological characteristics and spectral responses by remote sensing techniques.
• The design of a dynamic hydraulic modelling of the sedimentation, with a 2D hydraulic model in order to predict better the sedimentation process
• Periodic records of nutrient and sediment contribution to the Fúquene Lake
• Once an improved data set on nutrient and sediment will be available, studies on mass balance can be useful to evaluate the lake performance.
• Periodic records of point and non-points pollution sources. Additionally, referring to the effects produced by the management alternatives, this study recommend to consider the proposed alternative 0.5 meters water depth as one of the best scenarios to improve current conditions of the Fúquene Lake. In addition, it is important to point out on the development of detailed studies on nutrient and sediment concentrations in order to determine measures to diminish their contribution in the Fúquene Lake.
MODELLING OF WETLAND HABITAT AVAILABILITY AND DISTRIBUTION UNDER MANAGEMENT ALTERNATIVES
Montenegro, M.I. (ITC –NRM.ESAM, 2004) - 88 -
8. REFERENCES
1. -. (2000). USGS - NPS Vegetation Mapping Program. US Geological Service. Retrieved 01-12, 2003, http://biology.usgs.gov/npsveg/classification/sect5.html
2. Akcakaya, H. R. (2000). Conservation and management for multiple species: Integrating field research and modelling into management decisions. Environmental Management, 26(1), S75-S83.
3. Akçakaya, H. R., M. A. Burgman, & Ginzburg., L. R. (1997). Applied population ecology: using RAMAS EcoLab 1.0. Setauket, New York: Applied Biomathematics.255 p.
4. APIRS. (2003). Aquatic and wetland plants and invasive plants. Center for Aquatic and Invasive Plants, University of Florida. Retrieved, 19-02-2004, http://aquat1.ifas.ufl.edu/allplants.html
5. BirdLife International. (2000). Threatened birds of the world. Barcelona and Cambridge: UK: Lynx Edicions and Birdlife International.851 p
6. Blake, E. R. (1959). New and rare Colombian birds. Lozania, 11, 1 - 10. 7. Blake, E. R. (1977). Manual of Neotropical Birds. (Vol. 1 Spheniscidae (Penguins) to Laridae
(Gulls and Allies)). Chicago & London: The University of Chicago Press 8. Brown, D., & Rothery, P. (1994). Models in Biology: Mathematics, Statistics and Computing.
Sussex, England: John Wiley & Sons Ltd. 688 p. 9. Brown, M., & Dinsmore, J. J. (1986). Implications of marsh size and isolation for marsh bird
management. J. Wildl. Manage., 50, 392±397. 10. Cabeza, M., & Moilanen, A. (2001). Design of reserve networks and the persistence of
biodiversity. Trends in Ecology & Evolution, 16(5), 242-248. 11. Canevari, P., Davidson, I., Blanco, D., Castro, G., & (eds)., B. E. (1998). Los Humedales de
America del Sur. Una agenda para la conservation de la biodiversidad y las politicas de Desarrollo. Wetlands International. Retrieved 30-07, 2003, http://www.wetlands.org/inventory&/SAA/Intro/[email protected]
12. Carpenter, S. R., & Cottingham., K. L. (1997). Resilience and Restoration of Lakes. Retrieved (1):2, 1, http://www.consecol.org/vol1/iss1/art2
13. CDB. (2002). Decision VI/12. Ecosystem approach. Secretariat of the Convention on Biological Diversity. Retrieved 22-12, 2003, http://www.biodiv.org/decisions/default.aspx?m=COP-06&id=7186&lg=0
14. Collar, N. J., & Andrew, P. (1988). Birds to Watch. The ICBP World Checklist of Threatened Birds. Cambridge: Technical Publication 8
15. Collar, N. J., Crosby, M. J., & A.J., S. (1994). Birds to Watch 2. The ICBP World Checklist of Threatened Birds. Cambridge: BirdLife International
16. Collar, N. J., Gonzaga, L. P., Krabbe, N., Madroño Nieto, A., Naranjo, L. G., Parker, T. A., & Wege, D. C. (1992). Threatened Birds of the Americas. The ICBP/IUCN Red Data Book. Part 2. Cambridge: ICBP
17. Colson, G., & Bruyn, C. d. (1989). Models and methods in multiple objectives decision making. Mathematical Computer Modelling, 12(10 -11), 1201-1211.
18. Conover, W. J. (1999). Practical Nonparametric Statistics (Third Edition ed.). United States of America: John Wiley & Sons ltd.584 p.
19. Corsi, F., Leeuw, J. d., & Skidmore, A. (2000). Modelling species distribution with GIS. In T. K. Fuller (Ed.), Research Techniques in Animal Ecology. Controversies and Consequences. (pp. 389 - 434). New York: Columbia University Press.
20. Costa, L. T., Farinha, J. C., Hecker, N., & Tomas Vives, P. (1996). Mediterranean Wetland Inventory: A reference Manual (Vol. I): MedWet/ Instituto da Conservacao da Natureza (ICN) / Wetlands International / Greek Biotope / Wetland Centre (EKBY) Publication.55 p
21. Cowardin, L. M., & et. al. (1979). Classification of wetlands and deep water habitats of the United States. Washington, D.C: US Fish and Wildlife Service. 45 p
MODELLING OF WETLAND HABITAT AVAILABILITY AND DISTRIBUTION UNDER MANAGEMENT ALTERNATIVES
Montenegro, M.I. (ITC –NRM.ESAM, 2004) - 89 -
22. Cowling, R. M., Pressey, R. L., Rouget, M., & Lombard, A. T. (2003). A conservation plan for a global biodiversity hotspot--the Cape Floristic Region, South Africa. Biological Conservation, 112(1-2), 191-216.
23. CTI Engineering International Co. (1999). El estudio sobre Plan de Mejoramiento Ambiental Regional para la cuenca de la Laguna de Fúquene. Bogotá, Colombia: Agencia de Cooperación Internacional del Japón (JICA) & Corporación Autónoma Regional de Cundinamarca (CAR).200 p
24. DAMA. (2003). Aquatic Vegetation Cover. (In spanish). Strategic Ecosystems of Bogota Savannah. Departamento Tecnico Administrativo del Medio Ambiente. Retrieved 4-12-2003, http://200.110.105.66./ecosi/hum/his72.htm
25. Davidson, T. K., Khiel, C., & Hoffman, C. (2000). Guidelines for monitoring of wetland functioning. Ecosys Bd., 2000, 5 - 50.
26. Davidson, T. K., Khiel, C., & Hoffman, C. (2000). Guidelines for monitoring of wetland functioning. Ecosys Bd, 5 - 50.
27. Del Hoyo, J., Elliot, A., & Sargatal, J. (1996). Handbook of the Birds of the World. (Vol. 3. Hoatzin to Auks). Barcelona: Lynx Edicions
28. Diamond, D., & Massam, B. H. (2002). Progress in planning - has there been any?, Progress in Planning (Vol. 57). S.I.: Pergamon.
29. DNP. (2002). Informacion Basica Departamental. Cundinamarca. Bogota, Colombia: Departamento Nacional de Planeacion. Republica de Colombia.85 p.
30. Drechsler, M. (2000). A model-based decision aid for species protection under uncertainty. Biological conservation, Vol. 94(No. 1), p. 23-30.
31. EOS Data Gateway. (2002). Data Granule Attributes of Aster satellite image SC: AST_L1B.003:2005893990. NASA. Retrieved (13-02-2004), 2004, http://edcimswww.cr.usgs.gov/ims-bin/pub/nph-ims.cgi/u684904
32. European Union. (2003). CORINE. Land Cover Classification. Eurostat, European Comission and Europa on line. Retrieved 22-10-2003, 2003, http://europa.eu.int/comm/eurostat/ramon/corine/corine_en.html
33. Farinha, J. C., Costa, L. T., Zalidis, G., Mantzavelas, A., Fitoka, E., Hecker, N., & Tomas Vives, P. (Eds.). (1996). Mediterranean Wetland Inventory: A Reference Manual. (Vol. III): MedWet / Instituto da Conservacao da Natureza / Wetlands International Publication.
34. Fjeldsa, J., & Krabbe, N. (1990). Birds of the high Andes. Copenhagen: Apollo Books. 876 p. 35. Ministry of Environment. 2002. Resolution No. 0584. For which are declared wildlife species
as threatened into the national territory and are adopted other measures. 26th of June, 2002. Colombia. 5 p.
36. Galotwitsch, S. M., & van der Valk, A. G. (1994). Restoring Prairie Wetlands: An Ecological Approach. Ames, IA: Iowa State University
Press.244 pp 37. Gosselink, J. G., G.P. Shaffer, L.C. Lee, D.M. Burdik, D.L. Childers, N.C. Leibowitz, S.C.
Hamilton, R. Boumans, D. Cushman, S. Fields, Koch, M., & ., J. M. V. (1990.). Landscape Conservation in a Forested Wetland Watershed. Can we manage cumulative impacts? BioScience, 40(8), 588-600.
38. Hess, G. R., & King, T. J. (2002). Planning open spaces for wildlife: I. Selecting focal species using a Delphi survey approach. Landscape and Urban Planning, 58(1), 25-40.
39. Hilty, S. L., & Brown, W. L. (1986). A Guide to the Birds of Colombia. Princeton, New Jersey: Princeton University Press.1000 - 1012 p.
40. ITC. (2001). Ilwis 3.0 Academic. User's Gyide. Enschede, The Netherlands: International Institute for Aerospace Survey and Earth Sciences (ITC).530 p.
41. IUCN. (2001). IUCN Red List Categories and Criteria: Version 3.1. I.UCN. Switzerland and Cambridge, UK.ii + 30 pp.
42. IUCN. (2002). The 2002 IUCn Red List of Threatened Species. The IUCN Species Survival Commision. Retrieved 3-07-03, 2003, http://www.iucn.org/themes/ssc/redlist2002/rl_background.htm
43. King, W. B. e. (1978/79). Endangered Birds of the World. The ICBP Bird Red Data Book. (2 ed. Vol. 2. Aves). Morges, Switzerland: IUCN

MODELLING OF WETLAND HABITAT AVAILABILITY AND DISTRIBUTION UNDER MANAGEMENT ALTERNATIVES
Montenegro, M.I. (ITC –NRM.ESAM, 2004) - 90 -
44. Krausman, P. R. (1999). Some basic principles of habitat use. In K. L. Launcbaugh & et. al. (Eds.), Grazing Behavior of Livestock and Wildlife. Idaho Forest, Wildlife & Range Exp. Sta. Bull No. 70: Univ. of Idaho, Moscow ID.
45. Landsat org. (1987). Landsat Image Scene ID:t0080561217872. Landsat org. Retrieved (13-02-2004), 2004, http://www.landsat.org/cgi-bin/access5g/access5g.pl
46. Lindegarth, M., & M.G. Chapman. (2001). Testing hypotheses about management to enhance habitat for feeding birds in a freshwater wetland. Journal of Environmental Management, 62(4), 375-388 p.
47. Maiorano, L. (1998). Modello di idoneita ambientali di alcuni ungulate in Itali e nell'arco alpino. Unpublished Tesi di Laurea., Universita' Degli Studi di Roma., Roma, 145 p.
48. Mensing, D. M., Galatowitsch, S. G., & Tester, J. R. (1998). Anthropogenic effects on the biodiversity of riparian wetlands of a northern temperate landscape. J. Environ. Manage, 53, 349±377.
49. Meyer de Schauensee, R. (1982). A Guide to the Birds of South America. Wynnewood, Pennsylvania: Livingston Publishing Company for the Academy of Natural Sciences of Philadelphia (reprinted with addenda by ICBP Pan - American Section)
50. Ministry of the Environment. (2001, 2002). Humedales: Fuentes de vida en recuperación. Retrieved 30th of june., 2003, http://www.minambiente.gov.co/plantilla1.asp?pag_id=848&pub_id=176&cat_id=544
51. Ministry of the Environment. (2001). Política Nacional para Humedales Interiores de Colombia. Bogotá, Colombia.54 p.
52. Moore, D. S., & McCabe, G. P. (2003). Introduction to the Practice of Statistics (Fourth ed.). New York: W. H. Freeman and Company.828 p.
53. Morales, A., & Lozano, I. E. (2003). Bird counts data set of the Fuquene Lake. Bogota, Colombia: Fundacion Humedales. Not published
54. Musacchio, L. R., & Coulson, R. N. (2001). Landscape ecological planning process for wetland, waterfowl, and farmland conservation. Landscape and Urban Planning, 56(3-4), p. 125-147.
55. NASA. (2000). Shuttle Radar Mission. Digital Elevation Model. NASA & NIMA. Retrieved 14-02-2004, 2000, http://www.jpl.nasa.gov/srtm/cbandataproduct.html
56. Northwestern University Medical School. (2003, 17-09-2003). Prophet Statguide: Glossary [HTML Document]. Retrieved 10-10-2003, 2003, http://www.basic.nwu.edu/statguidefiles/sg_glos.html#null%20hypothesis
57. Paoletti, M. G. (1999). Using bioindicators based on biodiversity to assess landscape sustainability. Agriculture, Ecosystems and Environment, Vol. 74(1-3), p. 1-18.
58. Possingham, H. P., Andelman, S. J., Burgman, M. A., Medellin, R. A., Master, L. L., & Keith, D. A. (2002). Limits to the use of threatened species lists. Trends in Ecology & Evolution, 17(11), 503-507.
59. Ramsar. (2003). Convention on Wetlands (Ramsar, Iran, 1971). Ramsar secretariat. Retrieved 7-07-03, 2003, http://www.ramsar.org/
60. Renjifo, L. M., A. M. Franco-Maya, J. D. Amaya-Espinel, G. H. Kattan y B. López-Lanús (eds.). (2002). Libro rojo de aves de Colombia. Bogotá, Colombia: Instituto de Investigación de Recursos Biológicos Alexander von Humboldt y Ministerio del Medio Ambiente.562 p.
61. Ridgely, R. S., & Tudor, G. (1989). The Birds of South America.The Oscine Passerines. (Vol. 1). Oxford: Oxford University Press.516 p
62. Ripley, S. D. (1977). Rails of the World. Godine, Boston 63. Schmidt-Mumm, U. (1988). Notes about aquatic vegetation of Colombia I. Structure
(contents in spanish; abstract in english). Revista Facultad de Ciencias de la Universidad Javeriana, 1(2), 107 - 122 p.
64. Schmidt-Mumm, U. (1988). Notes about aquatic vegetation of Colombia II. Phisiognomy. Revista Facultad de Ciencias de la Universidad Javeriana, 1(3), 85 - 119 p.
65. Schmidt-Mumm, U. (1998). Vegetation acuatica y palustre de la Sabana de Bogota y Plano del Rio Ubate: Ecologia y Taxonomia de la Flora Acuatica y Semiacuatica. Unpublished MSc Thesis, Universidad Nacional de Colombia, Bogota, 183 p.
66. Sharifi, A., & Van Herwijnen, M. (2003). Spatial Decision Support Systems: International Institute for Geo-Information Science and Earth Observation.64 p.

MODELLING OF WETLAND HABITAT AVAILABILITY AND DISTRIBUTION UNDER MANAGEMENT ALTERNATIVES
Montenegro, M.I. (ITC –NRM.ESAM, 2004) - 91 -
67. Styles, F. G., & Caycedo, P. (2002). A new subspecies of Apolinar's wren (Cistothorus apolinari, Aves: Troglodytidae), and endangered Colombian endemic. Caldasia, 24(1), 191-199 p.
68. Valderrama, M. (2003). Laguna Fuquene. Livinglakes and Global Nature Foundation. Retrieved 13-06-03, 2003, http://www.livinglakes.org/fuquene/
69. Van der Hammen, T. (1998). Bases para el plan de manejo ambiental de la cuenca hidrografica de la laguna de Fúquene. Bogotá, Colombia: Corporación Autónoma Regional de Cundinamarca.16 p.
70. Van der Hammen, T., & Andrade, G. I. (2002). The main ecological structure for Colombia. Bogota: IDEAM. Draft report.14
71. Wetzel, R. G. (1999). Plants and water in and adjacent to lakes. In A. J. Baird & R. L. Wilby (Eds.), Eco-Hydrology. Plants and water in terrestrial and aquatic environments (pp. 269 - 299). London and New York: Routledge. Taylor & Francis Group.
72. Wheeler, B. D. (1999). Water and plants in freshwater wetlands. In A. J. Baird & R. L. Wilby (Eds.), Eco-Hydrology. Plants and water in terrestrial and aquatic environments (pp. 127 - 180). London and New York: Routledge. Taylor & Francis Group.
73. Whited, D., & et. al. (2000). The importance of local and regional factors in predicting effective conservation: Planning strategies for wetland bird communities in agricultural and urban landscapes. Landscape and Urban Planning, 49(1-2), p. 49-65.

MODELLING OF WETLAND HABITAT AVAILABILITY AND DISTRIBUTION UNDER MANAGEMENT ALTERNATIVES
Montenegro, M.I. (ITC –NRM.ESAM, 2004) - 92 -
9. APPENDIXES
Appendix 1. Ecological overview of R.semiplumbeus, G. melanops bogotensis and C. apolinari apolinari (Family, genus and species)

MODELLING OF WETLAND HABITAT AVAILABILITY AND DISTRIBUTION UNDER MANAGEMENT ALTERNATIVES
Montenegro, M.I. (ITC –NRM.ESAM, 2004) - 93 -

MODELLING OF WETLAND HABITAT AVAILABILITY AND DISTRIBUTION UNDER MANAGEMENT ALTERNATIVES
Montenegro, M.I. (ITC –NRM.ESAM, 2004) - 94 -
Sources: [5; 27; 34; 60; 61; 67]

MODELLING OF WETLAND HABITAT AVAILABILITY AND DISTRIBUTION UNDER POTENTIAL MANAGEMENT ALTERNATIVES
Montenegro, M.I. (ITC –NRM.ESAM, 2004) - 95 -
Appendix 2. The bird species of the Fúquene Lake
a) Rallus semiplumbeus b) Gallinula melanops bogotensis c) Cistothorus apolinari apolinari (Source: Drawings taken from [60])
Appendix 3. Wetland habitats and other plant communities in the Fúquene Lake
a) Habitat I. Prairie of Scirpus californicus b) Habitat II. Prairie of Eichhornia crassipes
c) Transitional zone. Emergent and floating plants d) Egeria densa Source (Pictures a, b and c taken from [65]. Picture d, taken from [4]
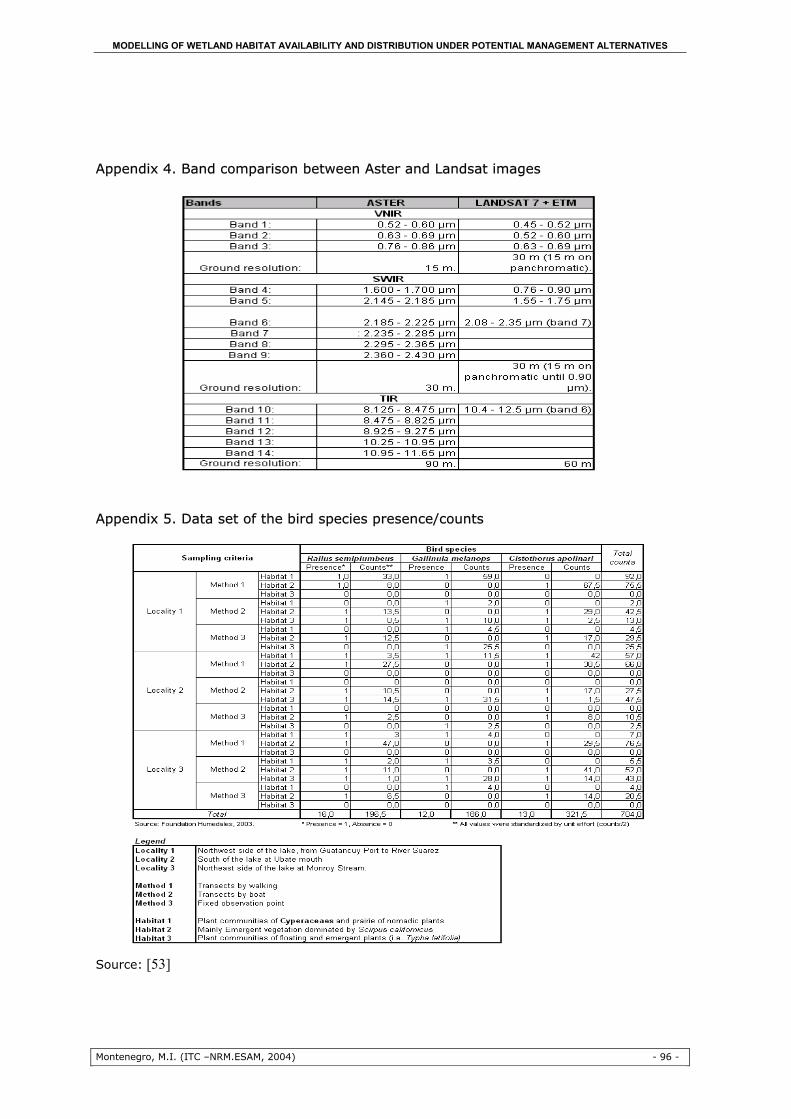
MODELLING OF WETLAND HABITAT AVAILABILITY AND DISTRIBUTION UNDER POTENTIAL MANAGEMENT ALTERNATIVES
Montenegro, M.I. (ITC –NRM.ESAM, 2004) - 96 -
Appendix 4. Band comparison between Aster and Landsat images
Appendix 5. Data set of the bird species presence/counts
Source: [53]

MODELLING OF WETLAND HABITAT AVAILABILITY AND DISTRIBUTION UNDER POTENTIAL MANAGEMENT ALTERNATIVES
Montenegro, M.I. (ITC –NRM.ESAM, 2004) - 97 -
Appendix 6. Accuracy assessment of 1987 Landsat and 2002 Aster images and 1999 thematic map
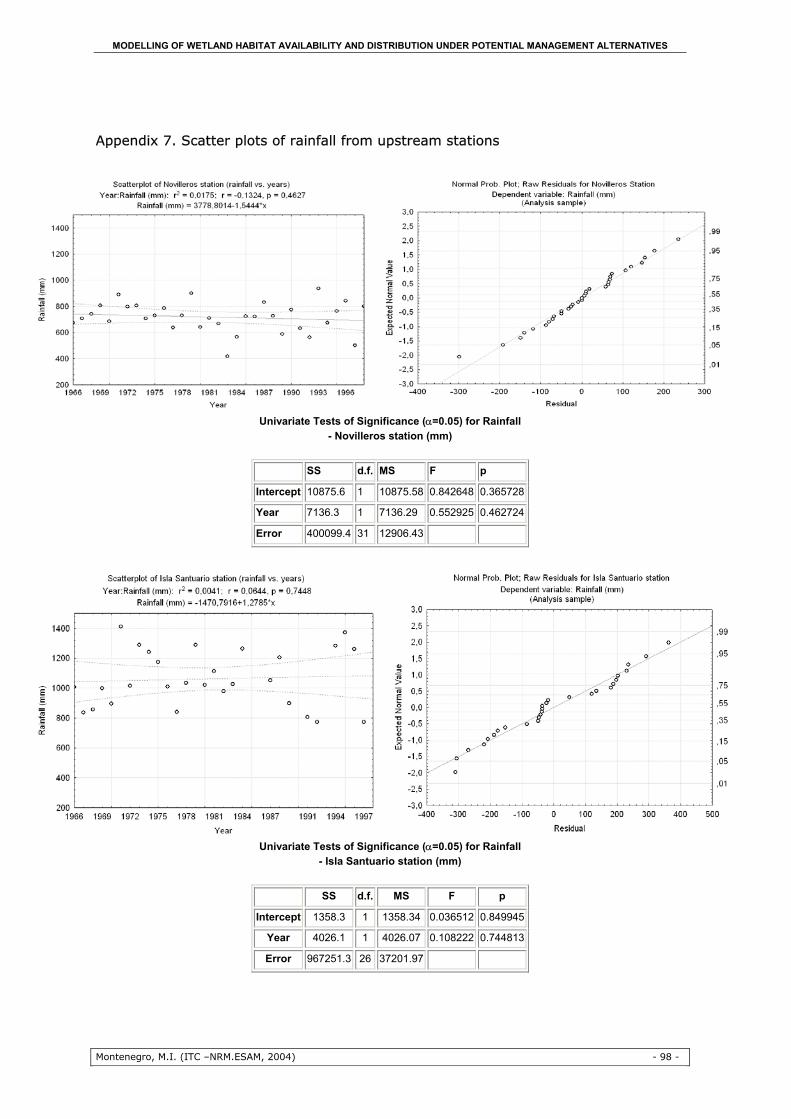
MODELLING OF WETLAND HABITAT AVAILABILITY AND DISTRIBUTION UNDER POTENTIAL MANAGEMENT ALTERNATIVES
Montenegro, M.I. (ITC –NRM.ESAM, 2004) - 98 -
Appendix 7. Scatter plots of rainfall from upstream stations
Univariate Tests of Significance (α=0.05) for Rainfall
- Novilleros station (mm)
SS d.f. MS F p
Intercept 10875.6 1 10875.58 0.842648 0.365728
Year 7136.3 1 7136.29 0.552925 0.462724
Error 400099.4 31 12906.43
Univariate Tests of Significance (α=0.05) for Rainfall
- Isla Santuario station (mm)
SS d.f. MS F p
Intercept 1358.3 1 1358.34 0.036512 0.849945
Year 4026.1 1 4026.07 0.108222 0.744813
Error 967251.3 26 37201.97
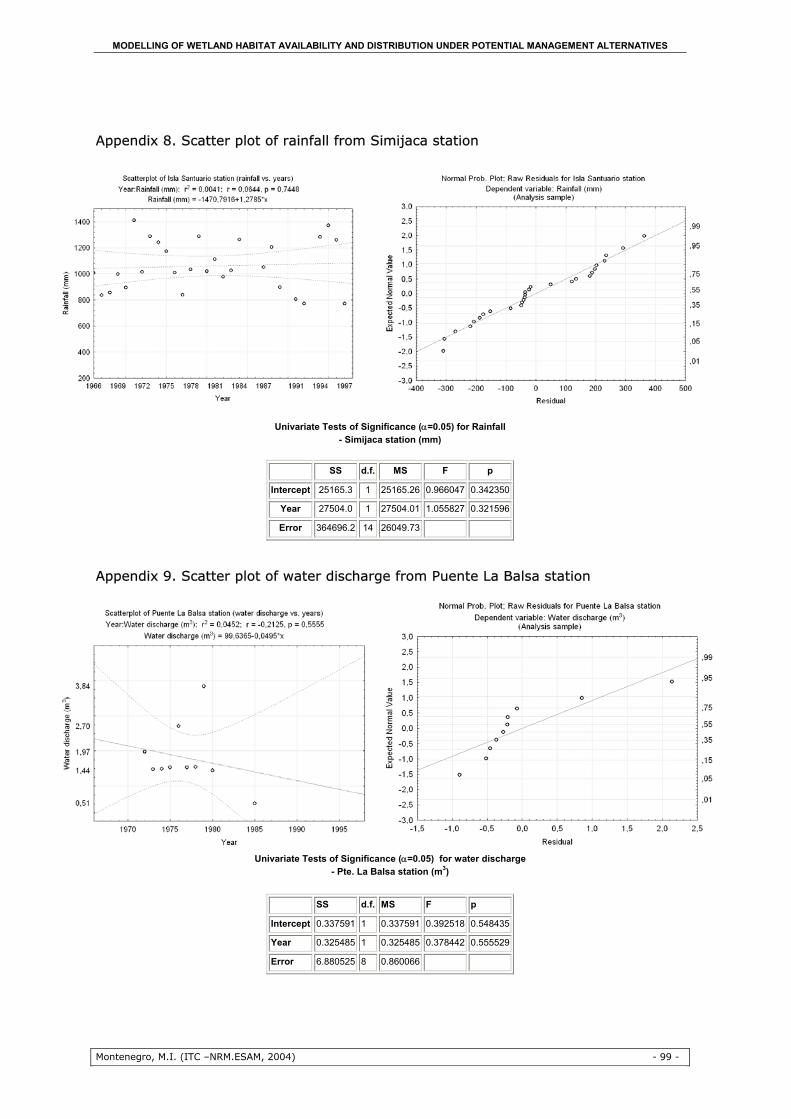
MODELLING OF WETLAND HABITAT AVAILABILITY AND DISTRIBUTION UNDER POTENTIAL MANAGEMENT ALTERNATIVES
Montenegro, M.I. (ITC –NRM.ESAM, 2004) - 99 -
Appendix 8. Scatter plot of rainfall from Simijaca station
Univariate Tests of Significance (α=0.05) for Rainfall
- Simijaca station (mm)
SS d.f. MS F p
Intercept 25165.3 1 25165.26 0.966047 0.342350
Year 27504.0 1 27504.01 1.055827 0.321596
Error 364696.2 14 26049.73
Appendix 9. Scatter plot of water discharge from Puente La Balsa station
Univariate Tests of Significance (α=0.05) for water discharge
- Pte. La Balsa station (m3)
SS d.f. MS F p
Intercept 0.337591 1 0.337591 0.392518 0.548435
Year 0.325485 1 0.325485 0.378442 0.555529
Error 6.880525 8 0.860066

MODELLING OF WETLAND HABITAT AVAILABILITY AND DISTRIBUTION UNDER POTENTIAL MANAGEMENT ALTERNATIVES
Montenegro, M.I. (ITC –NRM.ESAM, 2004) - 100 -
Appendix 10. Scatter plot of rainfall data from Puente Peralonso station
Univariate Tests of Significance (α=0.05) for water discharge - Pte. Peralonso station (m3)
SS d.f. MS F p
Intercept 0.070854 1 0.070854 1.358846 0.256221
Year 0.067215 1 0.067215 1.289042 0.268443
Error 1.147148 22 0.052143
Appendix 11. Nutrients and sediments data set of the Fúquene Lake
Source: [23]
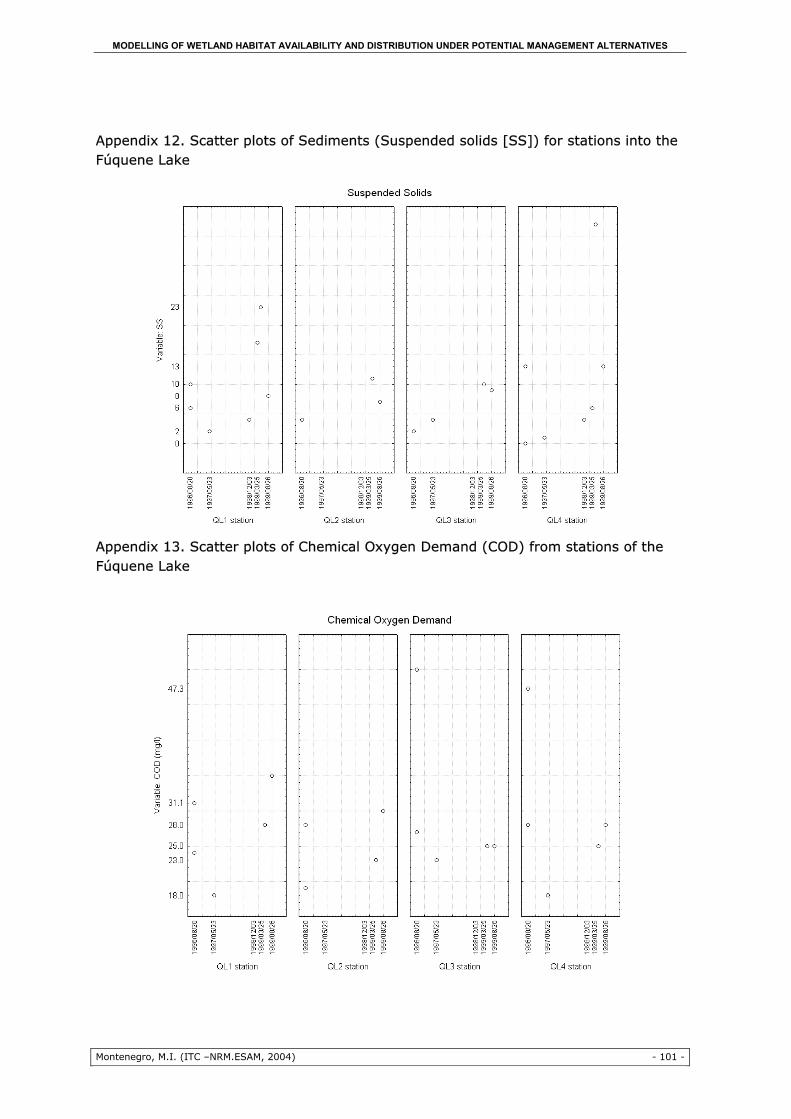
MODELLING OF WETLAND HABITAT AVAILABILITY AND DISTRIBUTION UNDER POTENTIAL MANAGEMENT ALTERNATIVES
Montenegro, M.I. (ITC –NRM.ESAM, 2004) - 101 -
Appendix 12. Scatter plots of Sediments (Suspended solids [SS]) for stations into the Fúquene Lake
Appendix 13. Scatter plots of Chemical Oxygen Demand (COD) from stations of the Fúquene Lake

MODELLING OF WETLAND HABITAT AVAILABILITY AND DISTRIBUTION UNDER POTENTIAL MANAGEMENT ALTERNATIVES
Montenegro, M.I. (ITC –NRM.ESAM, 2004) - 102 -
Appendix 14. Scatter plots of total nitrogen (total n) from stations of the Fúquene Lake
Appendix 15. Scatter plots of total phosphorus (total p) from stations of the Fúquene Lake

MODELLING OF WETLAND HABITAT AVAILABILITY AND DISTRIBUTION UNDER POTENTIAL MANAGEMENT ALTERNATIVES
Montenegro, M.I. (ITC –NRM.ESAM, 2004) - 103 -
Appendix 16. Nutrients and sediments data set of nearby water bodies
Source: [23]
Appendix 17. Scatter plots of sediments (suspended solids [SS]) from stations of nearby water bodies

MODELLING OF WETLAND HABITAT AVAILABILITY AND DISTRIBUTION UNDER POTENTIAL MANAGEMENT ALTERNATIVES
Montenegro, M.I. (ITC –NRM.ESAM, 2004) - 104 -
Appendix 18. Scatter plots of Chemical Demand of Oxygen (COD) from stations of nearby water bodies
Appendix 19. Scatter plots of total nitrogen (total n) from stations of nearby water bodies

MODELLING OF WETLAND HABITAT AVAILABILITY AND DISTRIBUTION UNDER POTENTIAL MANAGEMENT ALTERNATIVES
Montenegro, M.I. (ITC –NRM.ESAM, 2004) - 105 -
Appendix 20. Scatter plots of total phosphorus (total p) from stations of nearby water bodies
Related Documents