ELSEVIER Murine and Petroleum Geology, Vol. 13, No. 5, pp. 581-589, 1996 Copyright c 1996 Elsevier Science Ltd Printed in Great Britain. All rights reserved 0264-8172/96 $15.00+0.00 0264-6172(95)00099-2 Modelling of simulated reservoir sandstones clay precipitation within G. Peter Matthews* and Cathy J. Ridgway Department of Environmental Sciences, University of Plymouth, Drake Circus, Plymouth, UK Joe S. Small Department of Geology, The University, Oxford Road, Manchester UK Received 16 March 1995; accepted in revised form I December 1995 The purpose of this study was to investigate whether a previously developed computer model, named Pore-Cor, could simulate the subtle changes in void space dimensions which occur during the artificial deposition of small amounts of illite and kaolinite within Fontainebleau sandstone. Clay precipitation was carried out by placing a sandstone plug in a gold capsule, with an alu- minosilicate gel, and treating the plug hydrothermally with potassium hydroxide solution. Using experimental conditions of 350°C and 1.0 kbar (100 MPa), illite, illite-smectite and kaolinite were precipitated in parts of the sandstone void space with morphologies similar to those of authigenic clay minerals in sandstone petroleum reservoirs. Mercury intrusion curves were then measured for the untreated and clay precipitated sandstones. The Pore-Cor package simulated these intrusion curves, and generated void space models of the correct porosity. By this means, subtle changes in void space dimensions and connectivity could be identified, which give rise to large changes in permeability. Copyright 0 1996 Elsevier Science Ltd. Keywords: sandstone; porosity; permeability; mercury intrusion; porosimetry; void space; computer simu- lation; clay precipitation; illite; smectite; kaolinite; formation damage; tortuosity; formation factor Introduction Authigenic clay minerals have a major effect on the res- ervoir properties of sandstones (Wilson and Pittman, 1977). For example, they have been shown to cause a 20- fold reduction in water permeability in reservoirs such as the Magnus oil reservoir and West Sole gas reservoir (McHardy et al., 1982; Pallatt et al., 1984). As a conse- quence, an understanding of the effect of clay inclusions in sandstones is of great interest to oil and gas reservoir engineers. However, because of the complex nature of the void space in sandstones, researchers and engineers have had few theories with which to interpret their measurements of the extent to which clay inclusions affect permeability, and to interpret their studies of formation damage, i.e. the alteration and destruction of these inclusions. Furthermore, it has been difficult to dis- criminate the effects of authigenic clay on pore-level properties such as permeability, from the effects of the framework sand grains and non-clay cements (quartz, feldspar and carbonates). In an attempt to address these problems, experimental methods have recently been developed whereby clay min- erals can be artificially precipitated within the pore space of sandstones (Small et al., 1992a, b). Illite, illite-smectite and kaolinite formed by these methods have chemical compositions and crystal morphologies indistinguishable ____ *To whom correspondence should be addressed. from clay inclusions in reservoir sandstones. Thus a direct evaluation of the effect of authigenic clays on reservoir properties can be made by comparing the pore-level properties of clay-free sandstones with the properties of equivalent samples in which clay minerals have been arti- ficially precipitated. The effect of the precipitated min- erals on the mercury intrusion curves of the samples can then be related back to changes in the void structure by means of a newly developed computer model known as Pore-Cor (Pore-level properties Correlator) (Matthews rt al., 1995b). In this paper we compare the mercury intrusion curve of an untreated plug of Fontainebleau sandstone with that of a similar plug in which small amounts of illite and kaolinite have been precipitated. The Pore-Cor model is used to generate void space structures from these intrusion curves and the sample porosities, and then to generate and analyse the differences in tortuosity (Spearing and Matthews, 199 la) and permeability (Mat- thews et al., 1993) between the untreated and clay pre- cipitated plugs. A review of void space modelling The Pore-Cor model has previously been used to model a wide range of properties (Spearing and Matthews, 199la, b; Matthews and Spearing, 1992; Matthews et al., 1993, 1995a, b; Kettle and Matthews, 1993). The model uses a percolation algorithm which incorporates the Marine and Petroleum Geology 1996 Volume 13 Number 5 581

Welcome message from author
This document is posted to help you gain knowledge. Please leave a comment to let me know what you think about it! Share it to your friends and learn new things together.
Transcript

ELSEVIER
Murine and Petroleum Geology, Vol. 13, No. 5, pp. 581-589, 1996 Copyright c 1996 Elsevier Science Ltd
Printed in Great Britain. All rights reserved 0264-8172/96 $15.00+0.00
0264-6172(95)00099-2
Modelling of simulated reservoir sandstones
clay precipitation within
G. Peter Matthews* and Cathy J. Ridgway Department of Environmental Sciences, University of Plymouth, Drake Circus, Plymouth, UK
Joe S. Small Department of Geology, The University, Oxford Road, Manchester UK
Received 16 March 1995; accepted in revised form I December 1995
The purpose of this study was to investigate whether a previously developed computer model, named Pore-Cor, could simulate the subtle changes in void space dimensions which occur during the artificial deposition of small amounts of illite and kaolinite within Fontainebleau sandstone. Clay precipitation was carried out by placing a sandstone plug in a gold capsule, with an alu- minosilicate gel, and treating the plug hydrothermally with potassium hydroxide solution. Using experimental conditions of 350°C and 1.0 kbar (100 MPa), illite, illite-smectite and kaolinite were precipitated in parts of the sandstone void space with morphologies similar to those of authigenic clay minerals in sandstone petroleum reservoirs. Mercury intrusion curves were then measured for the untreated and clay precipitated sandstones. The Pore-Cor package simulated these intrusion curves, and generated void space models of the correct porosity. By this means, subtle changes in void space dimensions and connectivity could be identified, which give rise to large changes in permeability. Copyright 0 1996 Elsevier Science Ltd.
Keywords: sandstone; porosity; permeability; mercury intrusion; porosimetry; void space; computer simu- lation; clay precipitation; illite; smectite; kaolinite; formation damage; tortuosity; formation factor
Introduction
Authigenic clay minerals have a major effect on the res- ervoir properties of sandstones (Wilson and Pittman, 1977). For example, they have been shown to cause a 20- fold reduction in water permeability in reservoirs such as the Magnus oil reservoir and West Sole gas reservoir (McHardy et al., 1982; Pallatt et al., 1984). As a conse- quence, an understanding of the effect of clay inclusions in sandstones is of great interest to oil and gas reservoir engineers. However, because of the complex nature of the void space in sandstones, researchers and engineers have had few theories with which to interpret their measurements of the extent to which clay inclusions affect permeability, and to interpret their studies of formation damage, i.e. the alteration and destruction of these inclusions. Furthermore, it has been difficult to dis- criminate the effects of authigenic clay on pore-level properties such as permeability, from the effects of the framework sand grains and non-clay cements (quartz, feldspar and carbonates).
In an attempt to address these problems, experimental methods have recently been developed whereby clay min- erals can be artificially precipitated within the pore space of sandstones (Small et al., 1992a, b). Illite, illite-smectite and kaolinite formed by these methods have chemical compositions and crystal morphologies indistinguishable
____ *To whom correspondence should be addressed.
from clay inclusions in reservoir sandstones. Thus a direct evaluation of the effect of authigenic clays on reservoir properties can be made by comparing the pore-level properties of clay-free sandstones with the properties of equivalent samples in which clay minerals have been arti- ficially precipitated. The effect of the precipitated min- erals on the mercury intrusion curves of the samples can then be related back to changes in the void structure by means of a newly developed computer model known as Pore-Cor (Pore-level properties Correlator) (Matthews rt al., 1995b).
In this paper we compare the mercury intrusion curve of an untreated plug of Fontainebleau sandstone with that of a similar plug in which small amounts of illite and kaolinite have been precipitated. The Pore-Cor model is used to generate void space structures from these intrusion curves and the sample porosities, and then to generate and analyse the differences in tortuosity (Spearing and Matthews, 199 la) and permeability (Mat- thews et al., 1993) between the untreated and clay pre- cipitated plugs.
A review of void space modelling The Pore-Cor model has previously been used to model a wide range of properties (Spearing and Matthews, 199la, b; Matthews and Spearing, 1992; Matthews et al., 1993, 1995a, b; Kettle and Matthews, 1993). The model uses a percolation algorithm which incorporates the
Marine and Petroleum Geology 1996 Volume 13 Number 5 581
Modeling of simulated clay precipitation within reservoir sandstones: G. P. Matthews et al.
Washburn/Laplace equation. The equation has many limitations, which have been described previously (Spear- ing and Matthews, 1991a), and which have also been reviewed by Van Brake1 et al. (1981).
fitting parameters are real properties related to the geometry of the unit cell; and (iii) the same network with precisely the same geometry can be used to model a wide range of properties, (Figure 2).
The two main limitations of using a percolation algo- rithm based on the Washburn equation are pointed out by Garboczi (1991). They are (i) that the throats are all considered to be cylindrical, and (ii) that the mapping of the effective network derived from the mercury poro- simetry curve is not necessarily the same as the real network. Mason et al. (1988) investigated specific shapes of pores and also modelled the intrusion and extrusion of mercury in an array of packed spheres by using the Haines in-sphere approximation to model the void spaces between them (Mason and Mellor, 1991; Haines, 1927). Using a range of rod- and plate-like structures, Conner et al. (1988a) have shown that there is a relationship between shape of pores and throats, and the shapes of the intrusion and extrusion mercury hysteresis curves. Yanuka et al. (1986) have also used different void shapes, in the form of a three-dimensional network of intersecting ellipsoids, for their simulation of percolation processes, and Kloubek (1994) uses a pore with a conical termin- ation. Garboczi (199 l), however, showed that a range of pores and throats of different shapes and sizes could be adequately represented by a random network of inter- connecting elliptical cylinders ranging from circular (major and minor axes equal) through to cracks (minor axis negligible). As will be demonstrated, the mercury intrusion curve can be simulated using only throat diam- eter distribution, pore size: throat diameter correlation, and connectivity. The resulting sizes incorporate the effect of the shapes of the void spaces (Cebeci, 1980). The close fit to experiment which can be generated by very simple pore and throat geometries suggests that the dis- crepancy between other workers’ simple models and experiment does not necessarily arise from pore and throat shape and formation damage.
The void space within a porous solid can be regarded as a network of void volumes (pores) connected by a network of smaller void channels (throats). The Pore- Cor network comprises a three-dimensional cubic unit cell which repeats infinitely in each direction, each cell containing 1000 nodes on a regular 10 x 10 x 10 matrix. Figure 1 shows the two outermost layers of pores and throats in a unit cell representing the void space of the untreated Fontainebleau sandstone. As can be seen, the nodes are positioned using Cartesian co-ordinates x, 4’ and z, although, since the sample is isotropic, the allo- cation of these axes is arbitrary. The origin of the axes is at the corner of the unit cell adjacent to the first node. The void volume in the unit cell comprises up to 1000 cubic pores centred on the nodes. Connected to each pore are up to six cylindrical throats along the line of the arcs in the positive and negative x, y and z directions. We refer to the number of throats connected to a particular pore as the pore co-ordination number, and the arith- metic mean of this quantity over the whole unit cell as the connectivity. Individual pore co-ordination numbers may range from 0 to 6, while the connectivity of sand- stone is around 3 (Yanuka et al., 1986; Conner et al., 1988a).
Van Brake1 et al. (1981) have given a survey of net- works used by other workers up to 1975, ranging from bundles of capillary tubes through to three-dimensional interconnecting networks. The network presented here is based on actual samples, although not on any form of tomography (Lymberopoulos and Payatakes, 1992) and so is closer to an actual representation of void volume than it is to a mathematical network. Several other wor- kers have developed and investigated both two-dimen- sional and three-dimensional network models (Chatzis ef al., 1985; Lenormand et al., 1988; Conner and Horowitz, 1988b; Lenormand, 1989; Blunt and King, 1990; Li and Wardlaw, 1990; Blunt and King, 1991). These models differ in the network size array, co-ordination number, pore and throat size distribution, and pore and throat volumes. Payatakes and co-workers (Constantinides and Payatakes, 1989; Tsakiroglou and Payatakes, 1992) have used an invasion percolation algorithm effectively the same as that used in this work, for the simulation of mercury intrusion and extrusion curves for 20 x 20 x 20 and 30 x 30 x 2 networks. However, they also included resistance effects due to pore shape (Tsakiroglou and Payatakes, 1990).
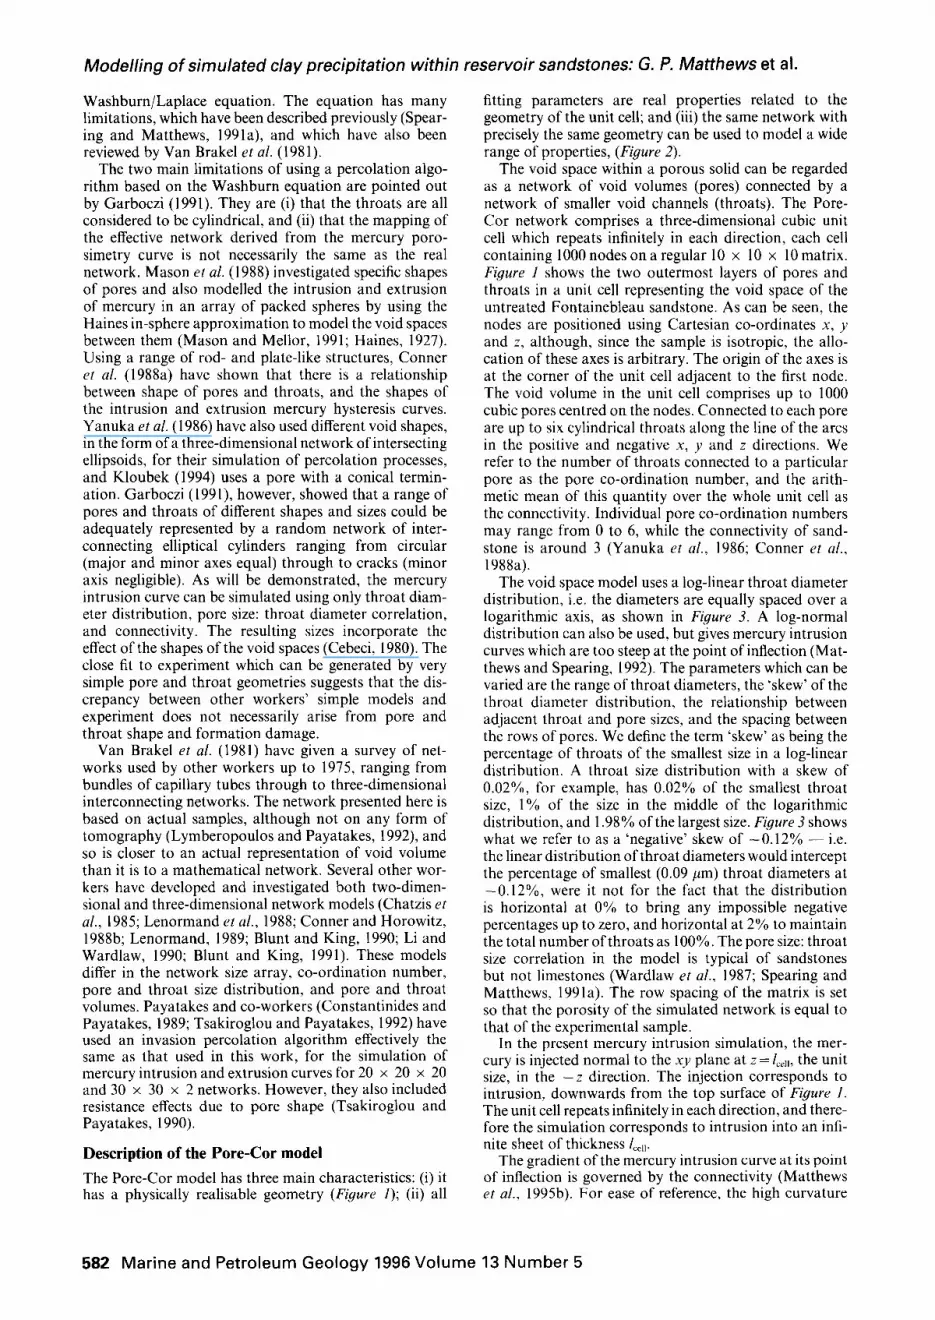
The void space model uses a log-linear throat diameter distribution, i.e. the diameters are equally spaced over a logarithmic axis, as shown in Figure 3. A log-normal distribution can also be used, but gives mercury intrusion curves which are too steep at the point of inflection (Mat- thews and Spearing, 1992). The parameters which can be varied are the range of throat diameters, the ‘skew’ of the throat diameter distribution, the relationship between adjacent throat and pore sizes, and the spacing between the rows of pores. We define the term ‘skew’ as being the percentage of throats of the smallest size in a log-linear distribution. A throat size distribution with a skew of 0.02%, for example, has 0.02% of the smallest throat size, 1% of the size in the middle of the logarithmic distribution, and 1.98% of the largest size. Figure 3 shows what we refer to as a ‘negative’ skew of -0.12% - i.e. the linear distribution of throat diameters would intercept the percentage of smallest (0.09 ,nm) throat diameters at -0.12%, were it not for the fact that the distribution is horizontal at 0% to bring any impossible negative percentages up to zero, and horizontal at 2% to maintain the total number of throats as 100%. The pore size: throat size correlation in the model is typical of sandstones but not limestones (Wardlaw et al., 1987; Spearing and Matthews, 1991a). The row spacing of the matrix is set so that the porosity of the simulated network is equal to that of the experimental sample.
Description of the Pore-Cor model
The Pore-Cor model has three main characteristics: (i) it has a physically realisable geometry (Figure 1); (ii) all
In the present mercury intrusion simulation, the mer- cury is injected normal to the x,! plane at z = Icell, the unit size, in the -z direction. The injection corresponds to intrusion, downwards from the top surface of Figure I. The unit cell repeats infinitely in each direction, and there- fore the simulation corresponds to intrusion into an infi- nite sheet of thickness lo,,.
The gradient of the mercury intrusion curve at its point of inflection is governed by the connectivity (Matthews et al., 1995b). For ease of reference, the high curvature
582 Marine and Petroleum Geology 1996 Volume 13 Number 5

Modelling of simulated clay precipitation within reservoir sandstones: G. P. Matthews et al.
Figure 1 Two outermost layers of the unit cell for Fontainebleau starting material sample
(pore:throat size,correlation 1 , 1 1 IP &F distn graph 11 1
1 Experimental mercury intrusion curve k!Pore and throat size distribution
2-dimensional model
3-dimensional model
ico2 or steam injection EOR
mure 2 Scope and data flow of Pore-Car: solid boxes show work to date; dashed boxes show future work; bold arrows show route of manual and automatic calculation methods
Marine and Petroleum Geology 1996 Volume 13 Number 5 583
Modeling of simulated clay precipitation within reservoir sandstones: G. P. Matthews et al.
6.0
O.fl9O.lC 0.30 0.60 LOS 3 .03 6.99 L'7.00 30.00 50.00 100.00 2OO.OI, 463.7:
Throat diameter or pore size / microns
Figure 3 Negative skewed (-0.12%) throat diameter distribution (dashed) with pore size distribution (solid) for untreated sample
regions of the experimental and simulated intrusion curves at pore volumes above and below the point of inflection will be referred to respectively as the upper and lower shoulders of the curve.
Modelling the mercury intrusion cuwe The simulated .mercury intrusion curve can be made to converge on the experimental curve automatically. Three alternative criteria for closeness of fit have been described in the previous publication (Matthews rf al., 1995b); they are: (i) that the curves should cross at 50% pore volume (‘50% fit’), (ii) that the rms deviation of simulated from experimental throat diameters should be a minimum (‘lin- ear fit’), and (iii) that the rms deviation of the logarithms of simulated from experimental throat diameters should be a minimum (‘logarithmic fit’). The deviations in (ii) and (iii) are measured at experimental and interpolated points.
Using criterion (i), only one point on the experimental and simulated is compared, and thus much valuable information is ignored. However, the preceding dis- cussion indicates that criteria (ii) and (iii), based on fits to the entire intrusion curve, are not suitable for small samples due to edge effects. These comparatively large effects rise from large cavities on the cut surfaces of the sample. One approach to this problem (Matthews et ul., 1995b), is to carry out a straightening and truncation of the intrusion curve below the point of inflection, but the changing of the experimental curve involves a con- siderable degree of subjectivity and cannot account for subtle internal void-space effects in the presence of large edge effects. Therefore an additional criterion of fit has been developed, the ‘linear top fit’, based on the linear rms deviation between the experimental and interpolated points above the median point in the equal-spaced exper- imental curve.
Artificial clay precipitation
Clay minerals were precipitated in the void space of a 12.5 mm diameter core of Fontainebleau sandstone using
a method based on that of Small et al. (1992a, b). Fon- tainebleau sandstone is an exceptionally pure quartzite from the Eocene of the Paris Basin. The sandstone is cemented exclusively by quartz overgrowths and has vir- tually no clay content (Thiry and Millot, 1986).
A 75 mm long plug of the sandstone was ground on a diamond lap to fit closely a 12.5 mm diameter gold capsule, the latter incorporating a cup-shaped cap with a 2 mm diameter gold tube welded in the centre. One 25 mm length of the plug was cut for the clay precipitation experiment, while the remainder was retained for mercury intrusion and scanning electron microscopy (SEM) of the untreated sandstone. One end of the gold capsule was crimped and welded with a DC arc, and 0.3 g of an amorphous gel of composition A1,0,.2SiO, was placed in the bottom of the capsule. The sandstone plug was then placed on top of the gel. One millilitre of 0. I molar potassium hydroxide solution was added through the small tube in the cap, which was then welded without boiling the solution. The scaled capsule was placed in a 15 mm diameter hydrothermal pressure vessel, and maintained at 350°C and 1 kbar for 23 days.
Following hydrothermal treatment the capsule was opened and the crystallised gel and the sandstone plug recovered. X-ray diffraction (XRD) showed that the gel itself had crystallised into mainly kaolinite, but with some weak intensity at 1 &I .2 nm attributed to illiteesmectite or illite. The outside surface of the sandstone plug was coated in a deposit; XRD identified kaolinite, but with more intense 1.0-l .2 nm illite-smectite intensity than the gel sample. The plug was sectioned longitudinally and laterally. SEM was then used to check the extent and nature of the clay precipitation in the various segments. Plutr 1 shows the clean quartz grains of the untreated Fontainebleau sandstone sample. Plute 2 shows the clay- precipitated sample from the end 2 mm of the plug. Kao- linite was identified with the aid of energy dispersive X- ray spectra as forming blocky sized grains a few mic- rometres (pm) wide, whereas the finer-grained lath- shaped crystals are illite or illite-smectite. Clay pre-
584 Marine and Petroleum Geology 1996 Volume 13 Number 5

Modelling of simulated clay precipitation within reservoir sandstones: G. P. Matthews et al.
Plate 1 Clean quartz grains of the untreated Fontainebleau sandstone sample
Plate 3 Clay precipitated sample used for the mercury intrusion
Plate2 Clay precipitated sample from the end 2 mm of the plug
cipitation is much less well developed away from the outer surface of the plug (Plate 3), where only a few illite and kaolinite particles are observed. Plate 3 is, however, representative of the sandstone sample used for mercury intrusion.
0.G90.10 0.30 0.60 1.00 3.00 6.00 10.00 30.00 60.00 100.00 200.00 463.75
.
Mercury intrusion results
Mercury intrusion experiments were carried out on both an untreated sample and a clay precipitated sample. Fig- ure 4 shows the resulting mercury intrusion curves for the untreated sample and for the clay precipitated sample. The top shoulder of the mercury intrusion curve for the clay precipitated sample is less pronounced than that for the starting material. The equivalent throat diameter at 50% pore volume intruded is also reduced. These differ- ences are typical of clay precipitation or ‘formation damage’.
The experimental porosities of these samples were cal- culated from measurements of the volume of mercury intruded into the sample and the volume of the sample itself. The measurements were corrected for mercury compression and also for the expansion of the pen- etrometer (Gane et al., 1996). Both samples were found to have a porosity of 17%, and thus any porosity vari- ation due to clay precipitation was less than the precision of the porosity measurement.
Throat diameter / microns
Figure 4 Mercury intrusion curve for untreated (dashed) and clay precipitated (solid) samples of Fontainebleau sandstone
Marine and Petroleum Geology 1996 Volume 13 Number 5 585
i0G.C . .
3.0 * i u ‘-.*
.__ . P
0. 119”. ICI 0.30 0.60 l.OCJ 3.00 6 S ') i r) 3 3 30.00 60.00 100.00 200.00 463.75
Modelling of simulated clay precipitation within reservoir sandstones: G. P. Matthews et al.
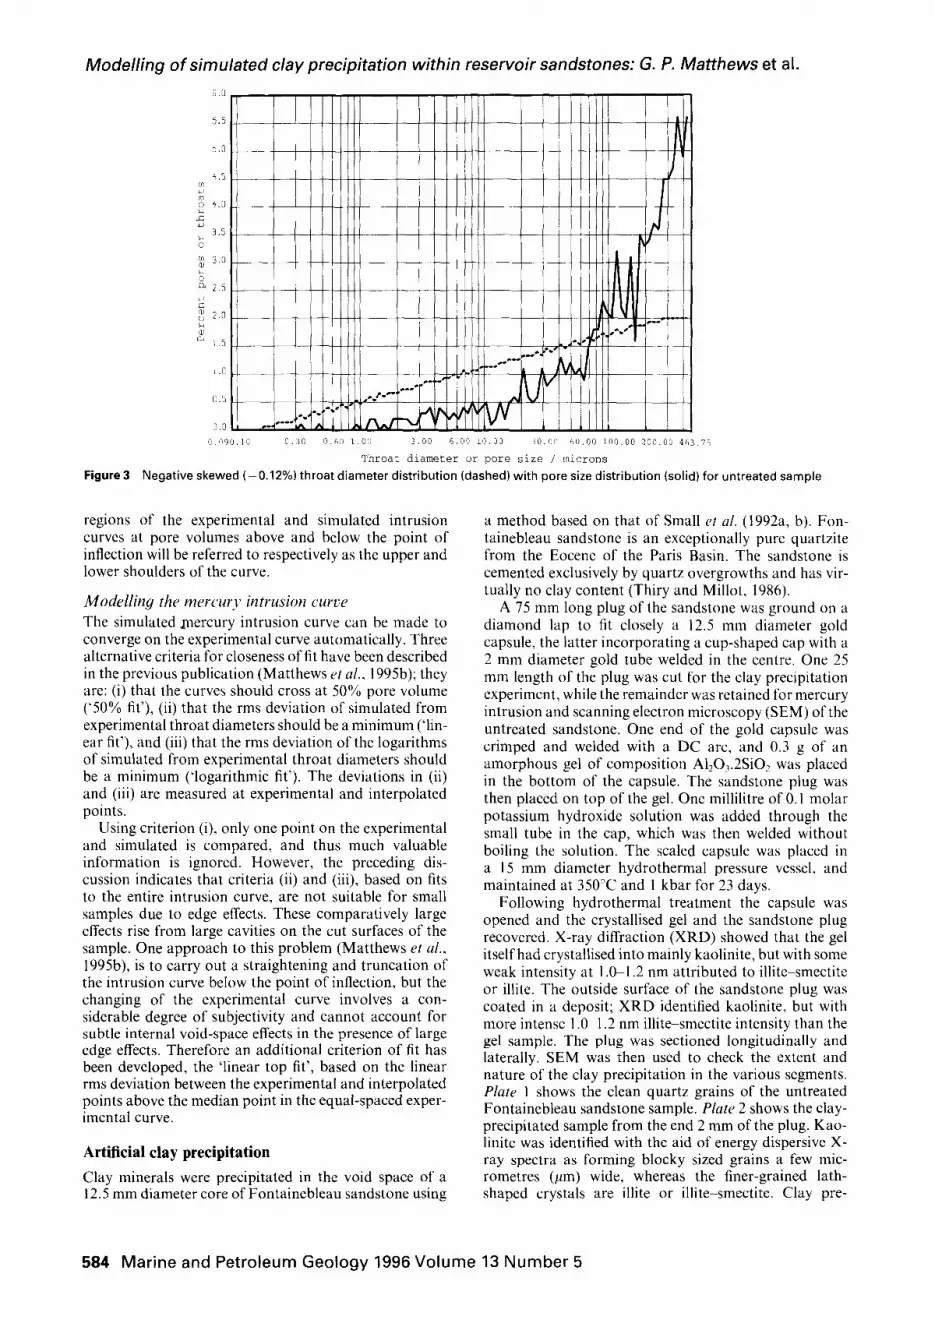
Throat diameter / microns Figure 5 Mercury intrusion curves for untreated sample: experimental (solid) and simulated (dashed)
L L,
0.30 0.60 I.00 3.00 6.OC 10.00 30.00 60.00 100.00 200.00 463.75
Throat diameter i microns Figure 6 Mercury intrusion curves for clay precipitated sample: experimental (solid) and simulated (dashed)
Modelling of Fontainebleau sandstone samples
The experimental mercury intrusion curves for these two samples were modelled by Pore-Cor using the linear top fit method, and the resulting simulated and experimental curves are shown in Figures 5 and 6. The least-squares deviations between the throat diameters of the upper, fitted regions of the experimental and simulated intrusion curves are shown in Table 1. The pore and throat size distributions which generate the simulated curves in Fig- ures 5 and 6 are shown in Figures 3 and 7, respectively. The porosity is correctly modelled to within the exper- imental precision of 1%) as confirmed in Table 1.
It can be seen in Table 1 that the skew of the simulated throat size distribution has increased between the un- treated and precipitated sample simulations. An increase in skew corresponds to an increase in the number of small
pores and throats and hence a reduction in large pores and throats. The connectivity of the precipitated sample simulation is slightly lower than for the untreated sample. These two differences are what might be expected from clay precipitation.
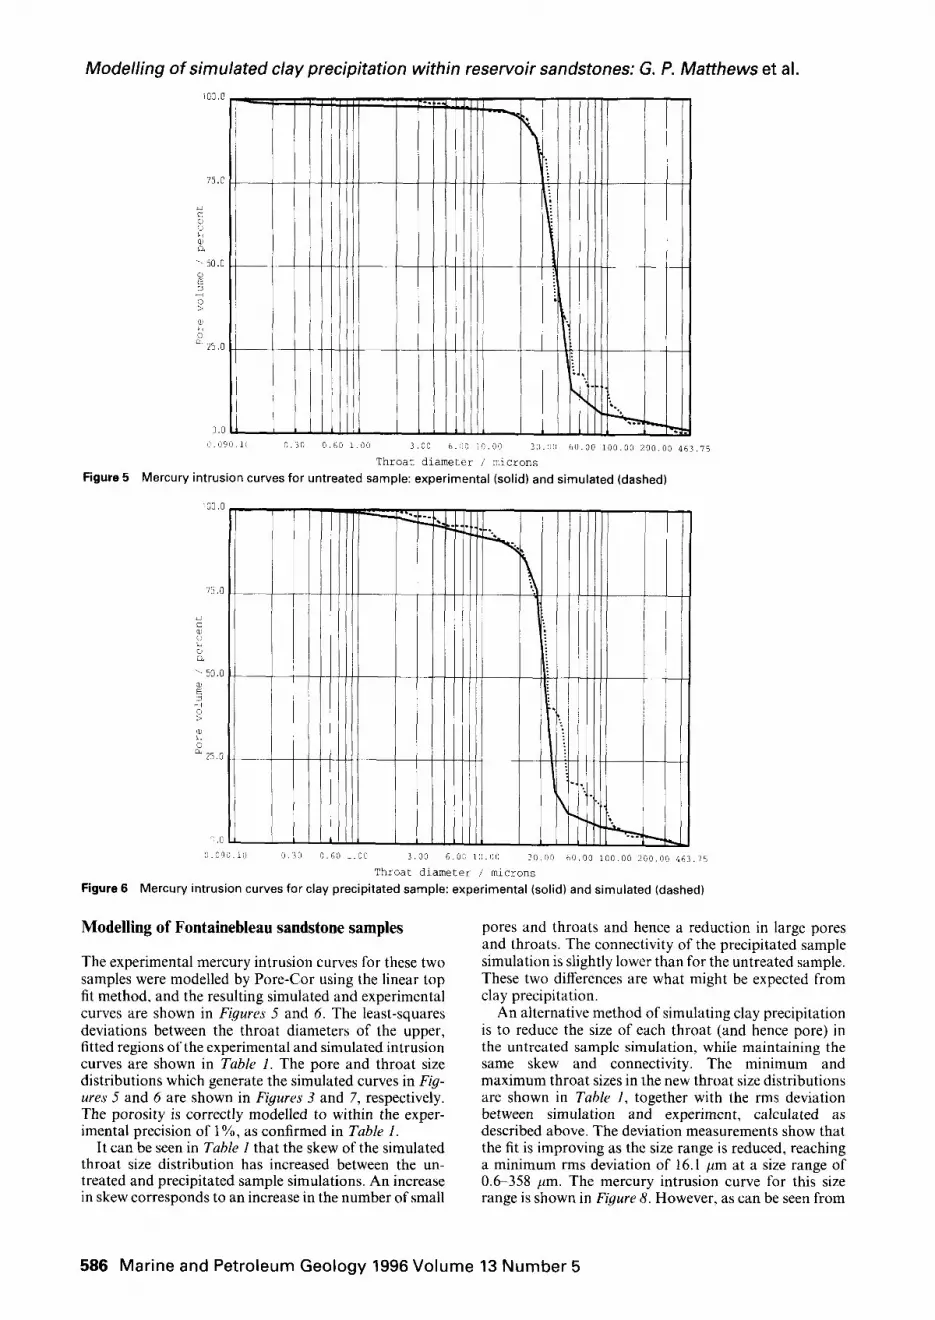
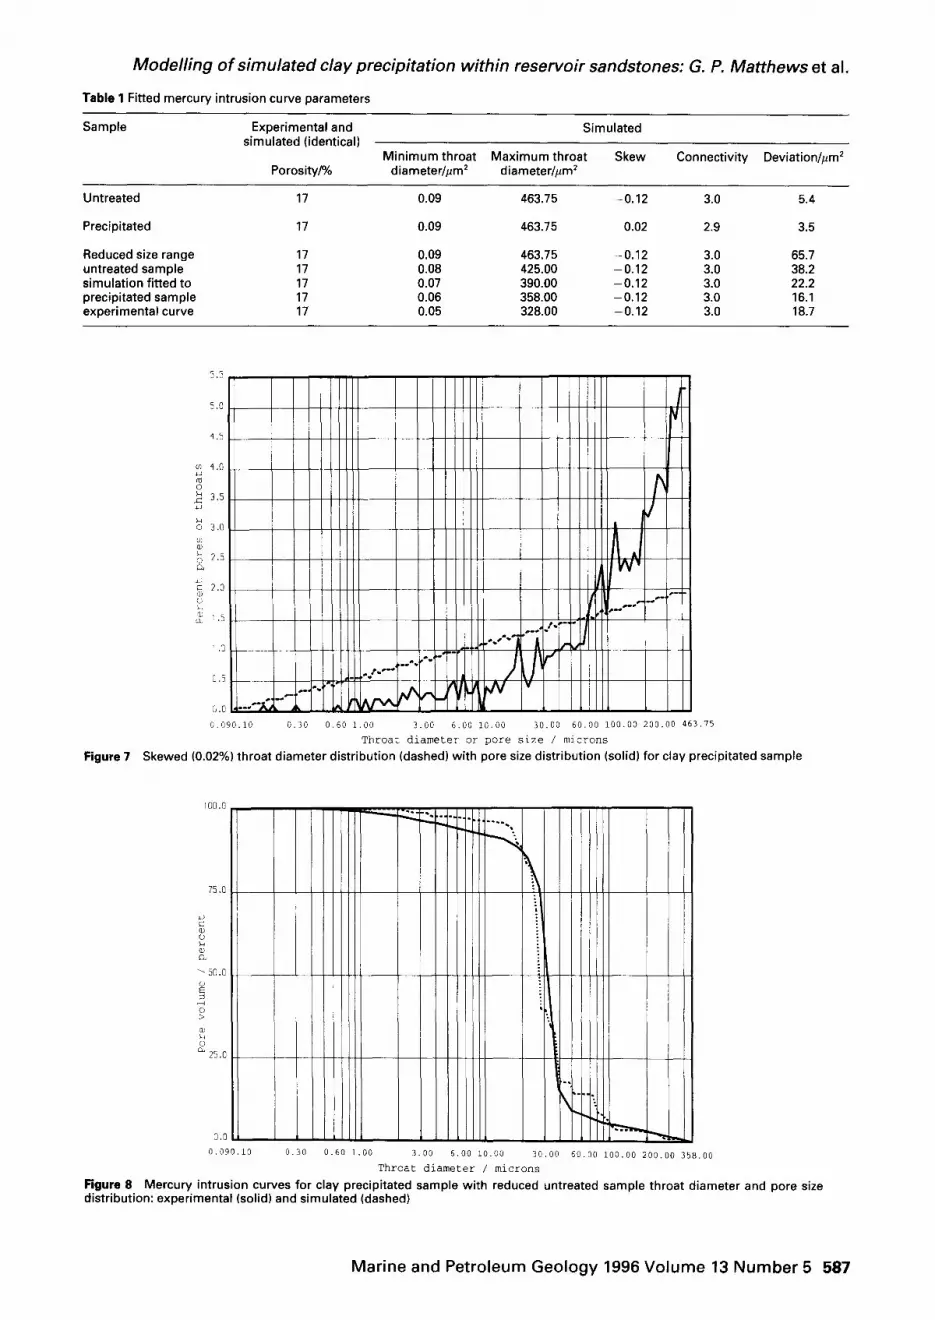
An alternative method of simulating clay precipitation is to reduce the size of each throat (and hence pore) in the untreated sample simulation, while maintaining the same skew and connectivity. The minimum and maximum throat sizes in the new throat size distributions are shown in Table 1, together with the rms deviation between simulation and experiment, calculated as described above. The deviation measurements show that the fit is improving as the size range is reduced, reaching a minimum rms deviation of 16.1 pm at a size range of 0.6358 pm. The mercury intrusion curve for this size range is shown in Figure 8. However, as can be seen from
586 Marine and Petroleum Geology 1996 Volume 13 Number 5
Modelling of simulated clay precipitation within reservoir sandstones: G. P. Matthews et al.
Table 1 Fitted mercury intrusion curve parameters
Sample Experimental and Simulated simulated (identical)
Minimum throat Maximum throat Skew Connectivity Deviation/pm* Porosity/% diameter/pm’ diameter/pm2
Untreated 17 0.09 463.75 -0.12 3.0 5.4
Precipitated 17 0.09 463.75 0.02 2.9 3.5
Reduced size range 17 0.09 463.75 -0.12 3.0 65.7 untreated sample 17 0.08 425.00 -0.12 3.0 38.2 simulation fitted to 17 0.07 390.00 -0.12 3.0 22.2 precipitated sample 17 0.06 358.00 -0.12 3.0 16.1 experimental curve 17 0.05 328.00 -0.12 3.0 18.7
0.090.10 0.30 0.60 1.00 3.00 6.00 10.00 30.00 60.03 100.00 200.00 463.75
Throat diameter or pore size / microns
Figure 7 Skewed (0.02%) throat diameter distribution (dashed) with pore size distribution (solid) for clay precipitated sample
I 0.30 0.60 1.00
‘4 .
$
3.00 6.00 10.00 30.00 60.00 100.00 200.00 358.00 Throat diameter / microns
Figure 8 Mercury intrusion curves for clay precipitated sample with reduced untreated sample throat diameter and pore size distribution: experimental (solid) and simulated (dashed)
Marine and Petroleum Geology 1996 Volume 13 Number 5 587
Modeling of simulated clay precipitation within reservoir sandstones: G. P. Matthews et al.
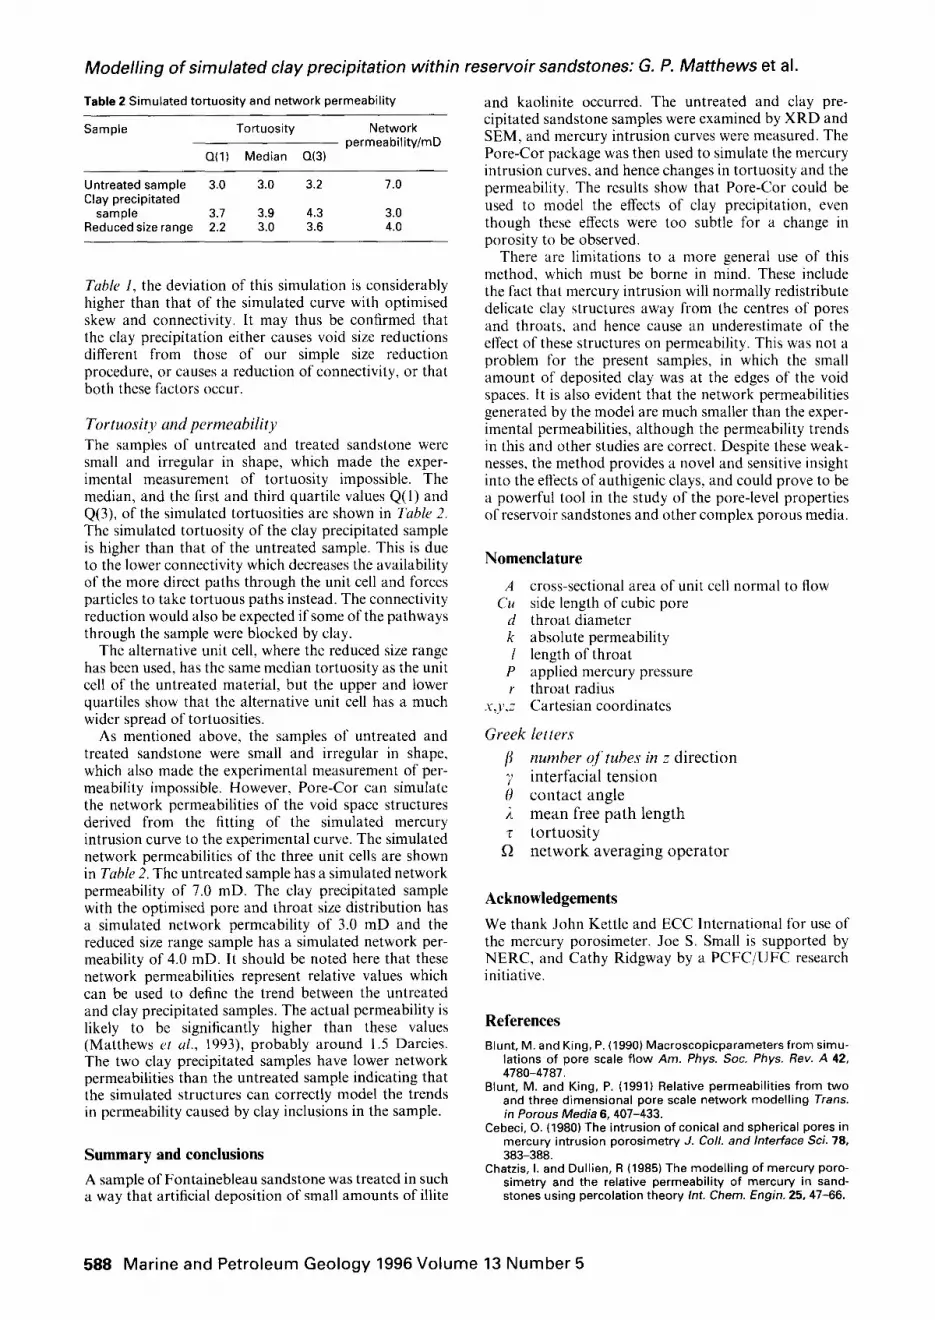
Table 2 Simulated tortuosity and network permeability
Sample Tortuosity Network permeabilitv/mD
Q(1) Median Q(3)
Untreated sample 3.0 3.0 3.2 1.0 Clay precipitated
sample 3.7 3.9 4.3 3.0 Reduced size range 2.2 3.0 3.6 4.0
Tuble I, the deviation of this simulation is considerably higher than that of the simulated curve with optimised skew and connectivity. It may thus be confirmed that the clay precipitation either causes void size reductions different from those of our simple size reduction procedure, or causes a reduction of connectivity, or that both these factors occur.
Tortuosity und permeability The samples of untreated and treated sandstone were small and irregular in shape, which made the exper- imental measurement of tortuosity impossible. The median, and the first and third quartile values Q(1) and Q(3), of the simulated tortuosities are shown in Table 2. The simulated tortuosity of the clay precipitated sample is higher than that of the untreated sample. This is due to the lower connectivity which decreases the availability of the more direct paths through the unit cell and forces particles to take tortuous paths instead. The connectivity reduction would also be expected if some of the pathways through the sample were blocked by clay.
The alternative unit cell, where the reduced size range has been used, has the same median tortuosity as the unit cell of the untreated material, but the upper and lower quartiles show that the alternative unit cell has a much wider spread of tortuosities.
As mentioned above, the samples of untreated and treated sandstone were small and irregular in shape, which also made the experimental measurement of per- meability impossible. However, Pore-Cor can simulate the network permeabilities of the void space structures derived from the fitting of the simulated mercury intrusion curve to the experimental curve. The simulated network permeabilities of the three unit cells are shown in Tublr 2. The untreated sample has a simulated network permeability of 7.0 mD. The clay precipitated sample with the optimised pore and throat size distribution has a simulated network permeability of 3.0 mD and the reduced size range sample has a simulated network per- meability of 4.0 mD. It should be noted here that these network permeabilities represent relative values which can be used to define the trend between the untreated and clay precipitated samples. The actual permeability is likely to be significantly higher than these values (Matthews ef al., 1993), probably around 1.5 Darcies. The two clay precipitated samples have lower network permeabilities than the untreated sample indicating that the simulated structures can correctly model the trends in permeability caused by clay inclusions in the sample.
Summary and conclusions
A sample of Fontainebleau sandstone was treated in such a way that artificial deposition of small amounts of illite
and kaolinite occurred. The untreated and clay pre- cipitated sandstone samples were examined by XRD and SEM, and mercury intrusion curves were measured. The Pore-Cor package was then used to simulate the mercury intrusion curves, and hence changes in tortuosity and the permeability. The results show that Pore-Cor could be used to model the effects of clay precipitation, even though these effects were too subtle for a change in porosity to be observed.
There are limitations to a more general use of this method, which must be borne in mind. These include the fact that mercury intrusion will normally redistribute delicate clay structures away from the centres of pores and throats, and hence cause an underestimate of the effect of these structures on permeability. This was not a problem for the present samples, in which the small amount of deposited clay was at the edges of the void spaces. It is also evident that the network permeabilities generated by the model are much smaller than the exper- imental permeabilities, although the permeability trends in this and other studies are correct. Despite these weak- nesses, the method provides a novel and sensitive insight into the effects of authigenic clays, and could prove to be a powerful tool in the study of the pore-level properties of reservoir sandstones and other complex porous media.
Nomenclature
A c’u
d k I
P Y
x,y,z
cross-sectional area of unit cell normal to flow side length of cubic pore throat diameter absolute permeability length of throat applied mercury pressure throat radius Cartesian coordinates
Greek letters
fl number c~f tubes in z direction -, interfacial tension h contact angle A mean free path length T tortuosity
Q network averaging operator
Acknowledgements
We thank John Kettle and ECC International for use of the mercury porosimeter. Joe S. Small is supported by NERC, and Cathy Ridgway by a PCFCjUFC research initiative.
References
Blunt, M. and King, P. (1990) Macroscopicparametersfrom simu- lations of pore scale flow Am. Phys. Sot. Phys. Rev. A 42, 4780-4787.
Blunt, M. and King, P. (1991) Relative permeabilities from two and three dimensional pore scale network modelling Trans. in Porous Media 6,407-433.
Cebeci, 0. (1980) The intrusion of conical and spherical pores in mercu, intrusion porosimetry J. Co//. and htarface.Sci. 78, 383-388.
Chatzis, I. and Dullien, R (1985) The modelling of mercury poro- simetry and the relative permeability of mercury in sand- stones using percolation theory Int. Chem. Engin. 25, 47-66.
588 Marine and Petroleum Geology 1996 Volume 13 Number 5
Modelling of simulated clay precipitation within reservoir sandstones: G. P. Matthews et al.
Conner, W., Blanco, C., Coyne, K., Neil, L, Mendioroz, S. and Pajares, J. (1988a) Measurement of the Morphology of High Surface Area Solids: Inferring Pore Shape Characteristics. In: Characterization of Porous So/ids (Eds K. K. Unger, J. Rouquerol, K. S. W. Sing and H. Kral). Elsevier Science Pub- lishers B.V. Amsterdam 273-281.
Conner, W. and Horowitz, J. (1988) Correcting data to obtain the actual pore and throat size distributions AlChE Symp Series 8429-34
Constantinides, G. and Payatakes, A. (1989) A three dimensional network model for consolidated porous media Basic studies. Chem. Engin. Comm 81,55-81
Gane, R., Kettle, L., Matthews, G. and Ridgway, C. (1996) Void space structure of compressible polymer spheres and con- solidated calcium carbonate paper-coating formulations Industr. Engng Chem. Res. (in press).
Garboczi, E. (1991) Mercury porosimetry and effective networks for permeability calculations in porous materials Powder Tech. 67, 121-125.
Haines, W. (1927) Studies in the physical Properties of soils. IV. A further contribution to the theory of capillary phenomena in soil J. Agricul. Sci. 17, 264
Kettle, J. and Matthews, G. (1993) Computer Modelling of the Pore Structure and Permeability of Pigmented Coatings. In: Advanced Coating Fundamentals Symposium. 1993 April 30- May 1 1993 Tappi Press Atlanta, Minneapolis. 121-126.
Kloubek, L. (1994) Investigation of porous structures using mer- cury reintrusion and retention J. Colloid interface Sci. 163, 10-18.
Lenormand, R. (1989) Flow through porous media: limits of frac- tal patterns In: Proc R Sot LondA 423, 159-168.
Lenormand, R., Touboul, E. and Zarcone, C. (1988) Numerical models and experiments on immiscible displacements in porous media J. Fluid Mechanics 189,165-187.
Li,Y. and Wardlaw, N. (1990) Quantitative determination of pore structure from mercury capillary pressure curves, In: Inter- facial Phenomena in Petroleum Recovery (Ed. N.R Morrow), Marcel Dekker, Inc. New York, Basel, 101-156
Lymberopoulos, D. and Payatakes, A. (1992) Derivation of topo- logical, geometrical, and correlational properties of porous media from pore chart analysis of serial section data J. Colloid Interface Sci. 150,61-80.
Mason, G. and Mellor, D. (1991) Analysis of the percolation properties of a real porous material. In: Characterization of Porous So/ids /I (Eds K. K. Unger, J. Rouquerol, K. S. W. Sing and H. Kral). Elsevier Science Publishers 8.V. Amsterdam 41- 50.
Mason, G., Morrow, N. R. and Walsh, T. (1988) Capillary proper- ties of pores formed by two unequal parallel rods and a plate. In: Characterization of porous so/ids. Elsevier Science Pub- lishers B.V., Amsterdam 243-252.
Matthews, G., Moss, A. and Ridgway, C. (1995a) The effects of correlated networks on mercury intrusion simulations and permeabilities of sandstone and other porous media Powder Technol. 83,61-77.
Matthews, G., Moss, A., Spearing, M. and Voland, F. (1993) Net- work calculation of mercury intrusion and absolute per- meability in sandstone and other porous media Powder Technol. 76,95-107.
Matthews, G., Ridgway, C. and Spearing, M. (1995b) Void Space Modelling of Mercury Intrusion Hysteresis in Sandstone, Paper Coating and Other Porous Media J. Colloid lnterfaca Sci. 171, 8-27.
Matthews, G. and Spearing, M. (1992) Measurement and mod- elling of diffusion, porosity and other pore level charac- teristics of sandstones Mar. Petrol. Geol. 9, 146-154.
McHardy, W. J., Wilson, M. L and Tait, J. M. (1982) Electron Microscope and X-ray diffraction Studies of Filamentous lllitic Clay from Sandstones of the Magnus Field C/ay Min. 17, 23- 29.
Pallat, N., Wilson, J. and McHardy, W. (1984) The Relation between Permeability and the Morphology of Diagenic lllite reservoir Rocks J. Petrol. Technol. 36,2225-2227.
Small, L., Hamilton, D. and Habesch, S. (1992a) Experimental simulation of clay precipitation within reservoir sandstones 1: Techniques and examples J. Sedim. Petrol. 62,508-519.
Small, J. S., Hamilton, D. L., Habesch, S. (1992b) Experimental simulation of clay precipitation within reservoir sandstones 2: Mechanism of illite formation and controls on morphology J. Sedim. Petrol. 62,520-529.
Spearing, M. and Matthews, G. (1991a) Modelling characteristic properties of sandstones Transport in Porous Media 6, Jl- 90.
Spearing, M. and Matthews, G. (1991b) Computer modelling of the geometry of outcrop sandstone, In: Computer Modelling in the Environmental Sciences, (Eds D.G. Farmer and M.J. Ryeroft), Oxford University Press, Oxford, pp 139-152.
Thiry, M. and Millet, G. (1986) Mineralogical forms of silica and their sequence of formation in silcretes J. Sedim. Petrol. 57, 343-352.
Tsakiroglou, C. and Payatakes, A. (1990) A new simulator of mercury porosimetry for the characterisation of porous materials J. Colloid interface Sci. 137,315339.
Tsakiroglou. C. and Payatakes, A. (1992) Effects of pore-size cor- relations on mercury porosimetry curves J. Colloid interface Sci. 146, 479-494.
van Brakel. S., Modry, S. and Svata. M. (1981) Mercury poro- simetry: state of the art Powder Technol. 29, 1-12.
Wardlaw, N., Li, Y. and Forbes, D. (1987) Pore-throat size cor- relation from capillary pressure curves Transport in Porous Media 2,597-614.
Wilson, M. and Pittman, E. (1977) Authigenicclays in sandstones: recognition and influence on reservoir properties and palaeo- environmental analysis J. Sedim. Petrol. 47,3-31.
Yanuka, M., Dullien, F. and Elrick, D. (1986) Percolation processes and porous media 1. Geometrical and topological model of porous media using a three-dimensional joint pore size dis- tribution J. Colloid Interface Sci. 112,24-41.
Yuan, H. and Swanson, B. (1989) Resolving pore-size charac- teristics by rate-controlled porosimetry Sot. Petrol. Engin. Formation Evaluation March 17-24.
Marine and Petroleum Geology 1996 Volume 13 Number 5 589
Related Documents