Modelling of Mine Flooding in the Pittsburgh Coal Basin, USA B R Leavitt 1 , J J Donovan 2 , A J Morris 2 and E Werner 2 ABSTRACT Coal mining in the Pittsburgh coal seam, in the eastern United States, began in the late-1700s. Since that time numerous mining technologies have been used throughout the basin. Environmental concerns, particularly mine discharge quality, have only been considered since the early-1970s. During the last 20 years, many of the larger underground mines have closed and are now either flooding or already flooded. In order to understand the consequences and potential future effects of this flooding, mine mapping of the basin has been compiled utilising a geographic information system (GIS) with an emphasis on locating barrier pillars between mines. Mine flooding has been monitored at numerous sites utilising pressure transducers and data loggers. These data have been combined with historical data from mining companies and structure contour maps to yield chronological flooding maps of the basin from 1980 to present. Utilising these maps and the indicated flooding rates, future discharge locations have been identified along with estimates of when these discharges are likely to occur. Related work has identified barrier pillar hydraulic conductivities and vertical infiltration rates as a function of overburden thickness. All of this information has been integrated into a groundwater flow model that simulates mine flooding. This model is useful in defining mine to mine interactions as the various mines fill with water, and the testing of various flooding scenarios. The model will be used in evaluating mine discharge rates and evaluating the options for regional mine drainage treatment. INTRODUCTION Mining in the Pittsburgh coal The Pittsburgh coal seam has been described as the single most valuable mineral deposit in the world. This coal deposit is located in parts of Pennsylvania, Ohio and West Virginia. (Figure 1) Mining of this resource began in 1761 across the Monongahela River from the city of Pittsburgh (Leavitt, 1999). During the past 240 years, it is estimated that 56 per cent of the coal has been mined (Ruppert, 2001). Environmental aspects of underground coal mining Acid mine drainage (AMD) has been a chronic problem in the basin. During the 1950s to the early-1970s, the pH of the Monongahela River at the Lock and Dam # 8 near point Marion, ranged from three to five. (United States Geological Survey, 2003) It was customary at that time to discharge mine water directly to rivers and streams without regard to the resulting environmental impact. With the advent of the Clean Water Act in 1972, AMD treatment plants were constructed and placed in operation. By the end of the decade, the pH of the Monongahela River had returned to the mid seven range. (United States Geological Survey, 2003) During the last 20 years, a number of mines have ceased operation and either have flooded, or are flooding. During the same time period, the sales price of coal has declined, thus putting financial pressure on the remaining coal mine operators. The combination of high costs, low sales price, and depleting reserves has led the various state and federal government agencies to become concerned that the water treatment burden would no longer be born by the coal industry, and that AMD would again degrade the waters of the Monongahela River. Based on preliminary data, more than 58.5 million cubic metres of mine water per year are discharged from the existing mines; 50.1 per cent of this water is untreated. A total of 5136 tons of iron are produced and 26.5 per cent of this is untreated. PURPOSE OF THIS STUDY The purpose of this study is to map the existing underground mine areas in the Pittsburgh coal seam; determine the location of coal barriers and mine interconnections; measure the water level or current discharge volume in the various mines or mine complexes; develop a mine flooding model for the basin; identify the chemistry of the mine water and its changes over time; identify future mine discharges including their location, flow rate, chemistry and time of occurrence. The interim results of the study of the mine chemistry and its evolution are being reported separately at this conference and are not included here. 6th ICARD Cairns, QLD, 12 - 18 July 2003 1065 1. Consulting Hydrogeologist, 2776 S-Bridge Road, Washington PA 15301, USA. 2. Department of Geology and Geography, West Virginia University, Morgantown WV 26506-6300, USA. FIG 1 - Location map.

Welcome message from author
This document is posted to help you gain knowledge. Please leave a comment to let me know what you think about it! Share it to your friends and learn new things together.
Transcript

Modelling of Mine Flooding in the Pittsburgh Coal Basin, USA
B R Leavitt1, J J Donovan2, A J Morris2 and E Werner2
ABSTRACTCoal mining in the Pittsburgh coal seam, in the eastern United States,began in the late-1700s. Since that time numerous mining technologieshave been used throughout the basin. Environmental concerns,particularly mine discharge quality, have only been considered since theearly-1970s. During the last 20 years, many of the larger undergroundmines have closed and are now either flooding or already flooded. Inorder to understand the consequences and potential future effects of thisflooding, mine mapping of the basin has been compiled utilising ageographic information system (GIS) with an emphasis on locatingbarrier pillars between mines. Mine flooding has been monitored atnumerous sites utilising pressure transducers and data loggers. These datahave been combined with historical data from mining companies andstructure contour maps to yield chronological flooding maps of the basinfrom 1980 to present. Utilising these maps and the indicated floodingrates, future discharge locations have been identified along with estimatesof when these discharges are likely to occur. Related work has identifiedbarrier pillar hydraulic conductivities and vertical infiltration rates as afunction of overburden thickness. All of this information has beenintegrated into a groundwater flow model that simulates mine flooding.This model is useful in defining mine to mine interactions as the variousmines fill with water, and the testing of various flooding scenarios. Themodel will be used in evaluating mine discharge rates and evaluating theoptions for regional mine drainage treatment.
INTRODUCTION
Mining in the Pittsburgh coal
The Pittsburgh coal seam has been described as the single mostvaluable mineral deposit in the world. This coal deposit islocated in parts of Pennsylvania, Ohio and West Virginia. (Figure1) Mining of this resource began in 1761 across theMonongahela River from the city of Pittsburgh (Leavitt, 1999).During the past 240 years, it is estimated that 56 per cent of thecoal has been mined (Ruppert, 2001).
Environmental aspects of underground coalmining
Acid mine drainage (AMD) has been a chronic problem in thebasin. During the 1950s to the early-1970s, the pH of theMonongahela River at the Lock and Dam # 8 near point Marion,ranged from three to five. (United States Geological Survey,2003) It was customary at that time to discharge mine waterdirectly to rivers and streams without regard to the resultingenvironmental impact. With the advent of the Clean Water Act in1972, AMD treatment plants were constructed and placed inoperation. By the end of the decade, the pH of the MonongahelaRiver had returned to the mid seven range. (United StatesGeological Survey, 2003) During the last 20 years, a number ofmines have ceased operation and either have flooded, or areflooding. During the same time period, the sales price of coal hasdeclined, thus putting financial pressure on the remaining coalmine operators. The combination of high costs, low sales price,and depleting reserves has led the various state and federalgovernment agencies to become concerned that the water
treatment burden would no longer be born by the coal industry,and that AMD would again degrade the waters of theMonongahela River. Based on preliminary data, more than 58.5million cubic metres of mine water per year are discharged fromthe existing mines; 50.1 per cent of this water is untreated. Atotal of 5136 tons of iron are produced and 26.5 per cent of thisis untreated.
PURPOSE OF THIS STUDY
The purpose of this study is to map the existing undergroundmine areas in the Pittsburgh coal seam; determine the location ofcoal barriers and mine interconnections; measure the water levelor current discharge volume in the various mines or minecomplexes; develop a mine flooding model for the basin; identifythe chemistry of the mine water and its changes over time;identify future mine discharges including their location, flowrate, chemistry and time of occurrence. The interim results of thestudy of the mine chemistry and its evolution are being reportedseparately at this conference and are not included here.
6th ICARD Cairns, QLD, 12 - 18 July 2003 1065
1. Consulting Hydrogeologist, 2776 S-Bridge Road, Washington PA15301, USA.
2. Department of Geology and Geography, West Virginia University,Morgantown WV 26506-6300, USA.
FIG 1 - Location map.
METHODS
GIS mapping of mined coal
Historic mine mapping in the Pittsburgh Basin has been based onmine specific coordinate systems. Larger operators occasionallyused a single coordinate system for their various mines but thesewere still proprietary systems. If all of these maps were to bepresented, they had to be located in a single coordinate system.Since mining in the basin has spanned over two centuries, themine mapping ranges from non-existent to stylised, to draft, todigital. Older maps, on paper or velum, may not have maintainedtheir dimensional stability and consequently must be adjustedback to their original size. Maps also exist at different scales;where possible we tried to obtain maps at a scale of 1:4800.However, it has been necessary to use maps ranging from 1:1200to 1:12 000.
Mine maps were obtained from State and Federal maprepositories, library archives, and coal mining companies. TheWest Virginia Geologic and Economic Survey provided manymine outlines that they had developed. Maps were scannedutilising large format scanners at a resolution of 200 dots perinch (dpi). Once scanned, it was often necessary to merge thescanned images so that the entire mine, or a large portion of it,could be represented by a single file. Once scanned, the image isgeoreferenced using the geographic information system (GIS).These scanned, merged, and referenced images represent verylarge computer files frequently exceeding of 200 megabytes foreach mine. With these file sizes, it is not feasible to represent allof the mining in tag image file format (TIFF). Consequently,each mine outline is digitised along with the barrier pillarsindicated on the map and any internal pillars greater than abouttwo hectares in size.
Field location of mine-map features by GPS
Georeferencing is the process of locating a scanned image inspace. Underground mines are particularly difficult to locatebecause they have few surface features that can be used forreference. Two methods were used for the georeferencing; thepreferred method is to obtain coordinates utilising the GlobalPositioning System (GPS). A handheld GPS receiver is takeninto the field to those places where the mine and the surface havean identifiable point in common. Typically, these are shafts,power boreholes, pump holes, and drift or slope entries. In thisstudy a GarminTM etrex Legend with wide area augmentationsystem (WAAS) real time correction was utilised. With this unit,accuracies of two to five metres were usually obtained, and 239points have been located in the study area. The second method isto match surface features shown on the underground mine map tothe same feature found on the USGS topographic quadrangle.Typically, these are road intersections and streams. This methodis more problematic due to the quality of the surface mapping onthe older mine maps and the mapping error in the 7.5 minutequadrangles. However, if mining surface features no longer exist,then georeferencing to the 7.5 minute quadrangles is the onlyalternative. For the purpose of this project, we are usingUniversal Transverse Mecator (UTM) with NAD27 as the datum.NAD27 is used because that is the same datum as thetopographic quadrangles published by the US Geological Survey.Using these techniques 322 mine outlines are currently in thedatabase, encompassing 341 264 hectares of mined land.
Water level monitoring
Since mines tend to fill with water from the lowest part of themine to the highest it is possible to monitor the flooding processby drilling monitoring wells and measuring the water level in the
well. Access to water level data has been obtained in three ways,well and or data access has been provided by mining companies,abandoned wells have been located and monitoring wells havebeen drilled. In total, 29 well monitoring points have beenestablished along with 60 mine discharge points. Water levels aremonitored periodically using an electric water level probe, and atmost sites water levels are recorded hourly using Global WaterTM
model 14 recording pressure transducers. Water levels fordischarging mines are assumed to be at or near the elevation ofthe discharge.
Estimation of flooding levels
Mining greatly increases the hydraulic conductivity of the coalseam. This degree of interconnection is illustrated in the Jordanmine. Two monitoring wells exist in this mine about 7900 metresapart, yet the measured water level difference between these twolocations is less than two metres during non-pumping conditions.Barring excessive roof collapse or subsidence, this highconductivity zone allows the extrapolation of the water levelobserved in the monitoring well throughout the mine. Theextrapolation of the measured water level is continued until themine barrier is reached. Utilising this technique combined withknown mine interconnections, flooding maps can be generated.Currently, 86 mines have flooding data available. The mines inthe database have been separated into groups depending on theirflooding status. Table 1 shows the mine status. These dataindicate that 71.5 per cent of the basin flooding status is known.As additional water level data are obtained these statistics will bemodified.
RESULTS
Distribution of mine flooding
The distribution of mine flooding is influenced by one globalfactor. It is the relationship of the coal seam to the surfacetopography. This relationship expresses itself in several ways.The primary influence is on the location and direction of mining.Initial mining in the basin occurred at the coal outcrop due to itseasy access and identifiable location (Leavitt, 1999). Mining atthese sites was conducted in an up dip direction so that waterwould freely drain from the mines. Mining of this type wasdominant in the northern part of the basin and along the majordrainages specifically the Ohio River North of the town ofWheeling, West Virginia, the Monongahela River valley North ofCalifornia, Pennsylvania and the east side of the MonongahelaRiver south of this point. The hydrologic effect of this mining isa predominance of unflooded, freely draining mines. Drainagefrom these mines is dominated by persistent low pH conditionswith significant amounts of dissolved iron and particularlyaluminium.
1066 Cairns, QLD, 12 - 18 July 2003 6th ICARD
B R LEAVITT, J J DONOVAN, A J MORRIS and E WERNER
Status Hectares Per centActive 67 821.5 19.9Draining 16 552.3 4.8Flooding 159 565.5 46.8No data 97 324.6 28.5Total 341 263.9 100
TABLE 1Distribution of mined area.

As transportation, mine ventilation, and mine dewateringimproved down-dip mining became practical and thus thestructure of coal had a direct influence on the ability of mines toflood (Leavitt, 1999). Many of these mines began productionbetween 1900 and 1950 and most have closed between 1980 and2002. Most of these mines are located in the interior of the basinwest of the Monongahela River and east of the Ohio River andare at a lower elevation than either of these regional drainagesystems. Drainage from these mines is dominated by an initiallow pH and high metals content followed by a transition to aneutral pH net alkaline water with iron levels below 200 mg/L.
Mine to mine interactions
Although down-dip mining was practiced early in the 20th
century, mine dewatering continued to be a problem for the mineoperators. Mine to mine interconnections were frequently madeto facilitate water removal. As recently as the 1950s, theseinterconnections were endorsed by the State of Pennsylvania inorder to reduce the potential for impounded mine water tothreaten the safety of the miners. (Pennsylvania Department ofMines, 1950) Where these interconnections exist significant flowcan occur between mines with the result that two or more minesmay behave as one flooded unit.
6th ICARD Cairns, QLD, 12 - 18 July 2003 1067
MODELLING OF MINE FLOODING IN THE PITTSBURGH COAL BASIN, USA
FIG 2 - Mine flooding 1980.

Beginning in the 1930s, mine safety laws began to requireimproved barrier pillars between mines (Leavitt, 1999). Thesepillars were designed according to the Ashley formula in order toprevent catastrophic failure between a flooded mine and an activemine. This formula requires 20 feet of coal plus an additionalwidth of coal equal to four times the height of the coal seam plusone tenth of the potential hydraulic head (Leavitt, 1999). Wherethese barrier pillars exist they form a significant restriction tomine flooding. Heads in excess of 280 feet have been observedacross mine barrier pillars. Despite this restriction, water leakagefrom mine to mine through the barrier pillars can have asignificant effect on mine flooding rate.
Visualisation of transient mine flooding
In order to visualise the sequence of mine flooding the GISoutline of each mine, for which water level data are available,was cut along the appropriate structure contour into flooded andunflooded sections. The water level utilised is as of 31 Decemberfor each calendar year represented. Using historical datacombined with data obtained by this project we have been able todocument much of the flooding history of the basin. Figures 2 to4 show the sequence of mine flooding in the southeastern part ofthe basin based on these data for years 1980, 1990 and 2000respectively.
1068 Cairns, QLD, 12 - 18 July 2003 6th ICARD
B R LEAVITT, J J DONOVAN, A J MORRIS and E WERNER
FIG 3 - Mine flooding 1990.

Identification of potential discharges
Water discharge from a flooding mine is first anticipated at thelowest surface elevation above the mine. This may be a mineopening such as a drift entry or it may be a stream where thestress relief fracture system provides a conduit between the mineand the surface. If the first connection is not adequate for thevolume of mine water to be discharged then the water level in themine will continue to increase until a dynamic equilibrium isachieved. Such a situation was observed near Fairmont, WestVirginia. In 1996, the flooding of mine #38 resulted in adischarge into the bottom of Buffalo Creek. This discharge
discoloured the water, but the volume was insufficient to controlthe amount of inflow the mine was receiving. The water levelcontinued to rise and a second discharge was anticipated from anold pump borehole. Discharge was prevented when a siphon wasbuilt to transfer the water into an adjacent mine.
Future mine flooding scenarios
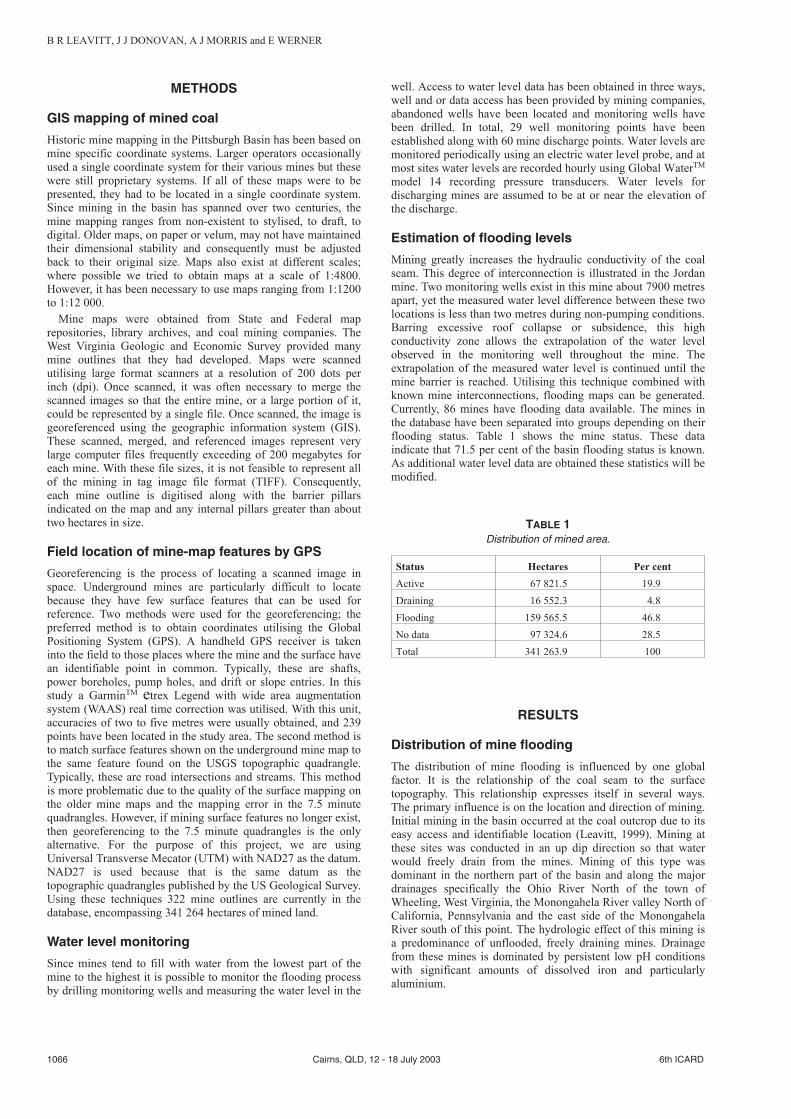
Water level data obtained during this project has been used toidentify future discharges from flooding mines. Of particularinterest are the Shannopin Mine and the Clyde, Gateway, Pit Gascomplex.
6th ICARD Cairns, QLD, 12 - 18 July 2003 1069
MODELLING OF MINE FLOODING IN THE PITTSBURGH COAL BASIN, USA
FIG 4 - Mine flooding 2000.
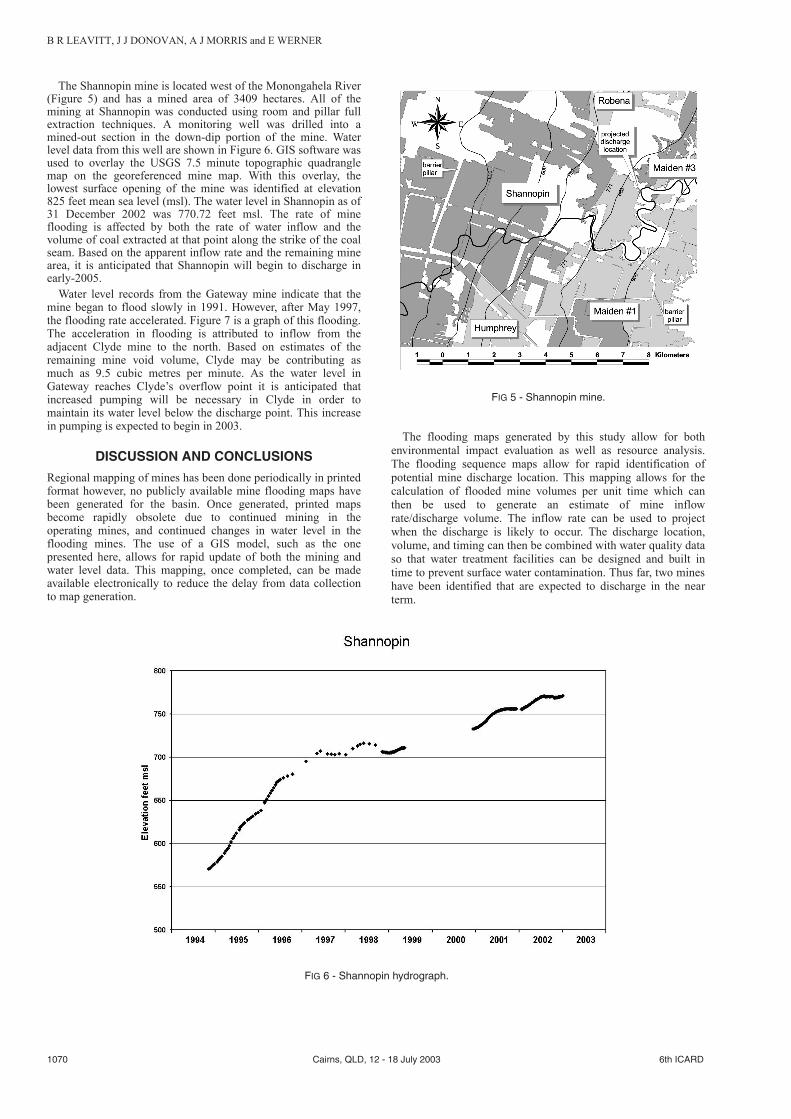
The Shannopin mine is located west of the Monongahela River(Figure 5) and has a mined area of 3409 hectares. All of themining at Shannopin was conducted using room and pillar fullextraction techniques. A monitoring well was drilled into amined-out section in the down-dip portion of the mine. Waterlevel data from this well are shown in Figure 6. GIS software wasused to overlay the USGS 7.5 minute topographic quadranglemap on the georeferenced mine map. With this overlay, thelowest surface opening of the mine was identified at elevation825 feet mean sea level (msl). The water level in Shannopin as of31 December 2002 was 770.72 feet msl. The rate of mineflooding is affected by both the rate of water inflow and thevolume of coal extracted at that point along the strike of the coalseam. Based on the apparent inflow rate and the remaining minearea, it is anticipated that Shannopin will begin to discharge inearly-2005.
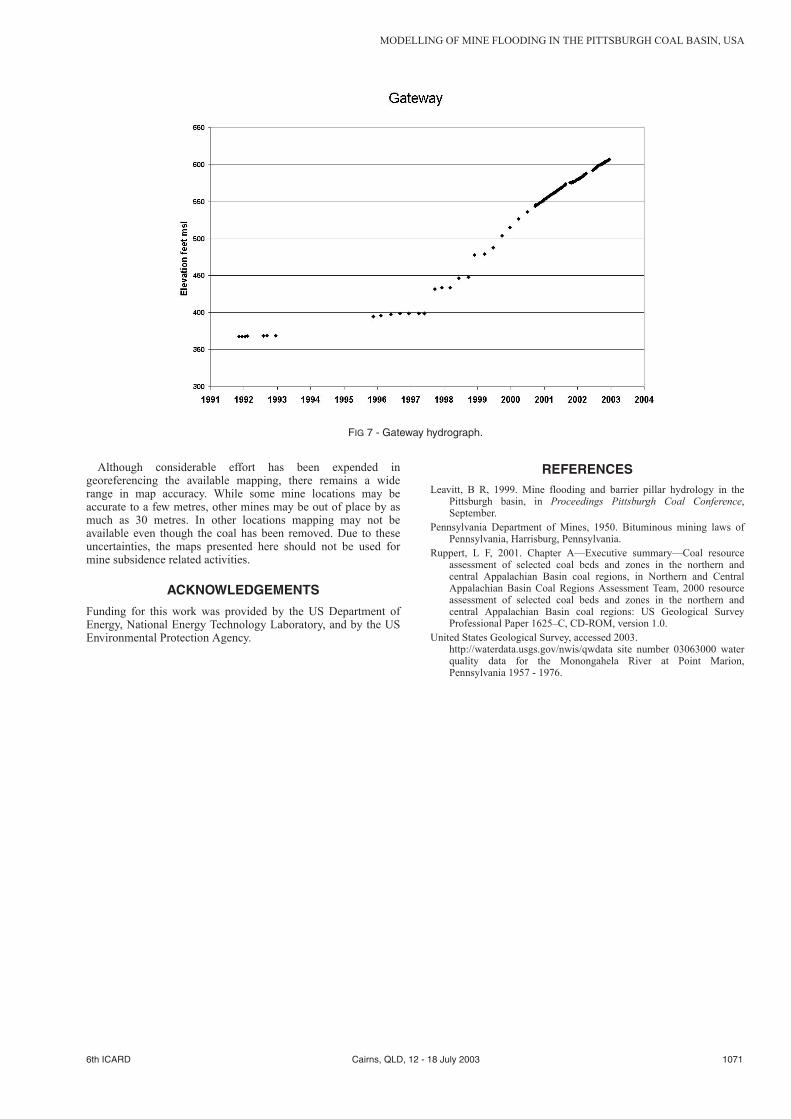
Water level records from the Gateway mine indicate that themine began to flood slowly in 1991. However, after May 1997,the flooding rate accelerated. Figure 7 is a graph of this flooding.The acceleration in flooding is attributed to inflow from theadjacent Clyde mine to the north. Based on estimates of theremaining mine void volume, Clyde may be contributing asmuch as 9.5 cubic metres per minute. As the water level inGateway reaches Clyde’s overflow point it is anticipated thatincreased pumping will be necessary in Clyde in order tomaintain its water level below the discharge point. This increasein pumping is expected to begin in 2003.
DISCUSSION AND CONCLUSIONS
Regional mapping of mines has been done periodically in printedformat however, no publicly available mine flooding maps havebeen generated for the basin. Once generated, printed mapsbecome rapidly obsolete due to continued mining in theoperating mines, and continued changes in water level in theflooding mines. The use of a GIS model, such as the onepresented here, allows for rapid update of both the mining andwater level data. This mapping, once completed, can be madeavailable electronically to reduce the delay from data collectionto map generation.
The flooding maps generated by this study allow for bothenvironmental impact evaluation as well as resource analysis.The flooding sequence maps allow for rapid identification ofpotential mine discharge location. This mapping allows for thecalculation of flooded mine volumes per unit time which canthen be used to generate an estimate of mine inflowrate/discharge volume. The inflow rate can be used to projectwhen the discharge is likely to occur. The discharge location,volume, and timing can then be combined with water quality dataso that water treatment facilities can be designed and built intime to prevent surface water contamination. Thus far, two mineshave been identified that are expected to discharge in the nearterm.
1070 Cairns, QLD, 12 - 18 July 2003 6th ICARD
B R LEAVITT, J J DONOVAN, A J MORRIS and E WERNER
FIG 6 - Shannopin hydrograph.
FIG 5 - Shannopin mine.
Although considerable effort has been expended ingeoreferencing the available mapping, there remains a widerange in map accuracy. While some mine locations may beaccurate to a few metres, other mines may be out of place by asmuch as 30 metres. In other locations mapping may not beavailable even though the coal has been removed. Due to theseuncertainties, the maps presented here should not be used formine subsidence related activities.
ACKNOWLEDGEMENTS
Funding for this work was provided by the US Department ofEnergy, National Energy Technology Laboratory, and by the USEnvironmental Protection Agency.
REFERENCESLeavitt, B R, 1999. Mine flooding and barrier pillar hydrology in the
Pittsburgh basin, in Proceedings Pittsburgh Coal Conference,September.
Pennsylvania Department of Mines, 1950. Bituminous mining laws ofPennsylvania, Harrisburg, Pennsylvania.
Ruppert, L F, 2001. Chapter A—Executive summary—Coal resourceassessment of selected coal beds and zones in the northern andcentral Appalachian Basin coal regions, in Northern and CentralAppalachian Basin Coal Regions Assessment Team, 2000 resourceassessment of selected coal beds and zones in the northern andcentral Appalachian Basin coal regions: US Geological SurveyProfessional Paper 1625–C, CD-ROM, version 1.0.
United States Geological Survey, accessed 2003.http://waterdata.usgs.gov/nwis/qwdata site number 03063000 waterquality data for the Monongahela River at Point Marion,Pennsylvania 1957 - 1976.
6th ICARD Cairns, QLD, 12 - 18 July 2003 1071
MODELLING OF MINE FLOODING IN THE PITTSBURGH COAL BASIN, USA
FIG 7 - Gateway hydrograph.
Related Documents