Modelling of local two-phase flow parameters in upward subcooled flow boiling at low pressure Bo stjan Kon car * , Ivo Kljenak, Borut Mavko Jo zef Stefan Institute, Jamova 39, SI-1000 Ljubljana, Slovenia Abstract The subject of the present work is a multidimensional modelling of vertical upward subcooled boiling flow using a two-fluid approach and calculation of local two-phase flow parameters (void fraction and bubble size). The dependence of bubble diameter on local flow conditions was taken into account. A sensitivity analysis of closure equations showed that besides phase-change mechanisms, the transverse hydrodynamic mechanisms also have to be considered for modelling of subcooled flow boiling at low-pressure conditions. The evolution of cross-sectional distributions of void fraction and local bubble diameter along the flow was simulated and compared to low-pressure experimental data from the literature [Experimental investigation of subcooled boiling, M.S.N.E. Thesis, Purdue University, West Lafayette, IN, USA, 1999; Int. J. Multiphase Flow 28 (2002) 1351]. Ó 2003 Elsevier Ltd. All rights reserved. Keywords: Subcooled boiling flow; Void distribution; Two-fluid model; Multidimensional modelling 1. Introduction Subcooled flow boiling denotes the process of evap- oration of liquid flowing near a heated surface (usually channel wall), when the bulk flow temperature is lower than the local saturation temperature. The liquid tem- perature near the heated surface exceeds the saturation temperature and then gradually decreases (below satu- ration temperature) as the distance from the surface increases. Although subcooled boiling may appear in the form of different boiling regimes, the present work deals only with nucleate subcooled boiling, in which liquid evaporates in the form of vapour bubbles and a two- phase layer occurs near the heated surface. Among many industrial systems, subcooled flow boiling is im- portant in water-cooled nuclear reactors, where the presence of vapour influences the system reactivity. One may categorize subcooled boiling according to system pressure. The essential quantitative difference between boiling at so-called ‘‘high-pressure’’ and ‘‘low- pressure’’ conditions (below 10 bar) is the order of magnitude of the difference between liquid and vapour densities. At low pressure, nucleated bubbles are larger and move farther away from the heated wall into the cooler liquid before condensing, thus creating a different flow structure. The increased interest to investigate low- pressure subcooled boiling, which has appeared in recent years, is mainly due to the need to perform safety analyses of low-pressure research reactors and to in- vestigate the sump-cooling concept for so-called ad- vanced light water reactors. In subcooled boiling flow in a vertical channel, not only is vapour unevenly distributed over the channel cross-section, but, in addition, the distribution evolves along the flow, as both the void fraction and the width of the two-phase layer near the heated surface gradually increase. This non-homogeneous distribution of vapour significantly influences hydrodynamic and thermal pro- cesses, including heat transfer. Although a considerable amount of literature deals with the cross-sectional dis- tribution of the gas phase in adiabatic bubbly flow, in- vestigations of analogous phenomena in boiling flow have been much less common. Many experiments on subcooled boiling flow in channels have been performed over the past decades. As * Corresponding author. Tel.: +386-1-588-5260; fax: +386-1- 561-2335. E-mail address: [email protected] (B. Kon car). 0017-9310/$ - see front matter Ó 2003 Elsevier Ltd. All rights reserved. doi:10.1016/j.ijheatmasstransfer.2003.09.021 International Journal of Heat and Mass Transfer 47 (2004) 1499–1513 www.elsevier.com/locate/ijhmt

Welcome message from author
This document is posted to help you gain knowledge. Please leave a comment to let me know what you think about it! Share it to your friends and learn new things together.
Transcript
International Journal of Heat and Mass Transfer 47 (2004) 1499–1513
www.elsevier.com/locate/ijhmt
Modelling of local two-phase flow parameters in upwardsubcooled flow boiling at low pressure
Bo�sstjan Kon�ccar *, Ivo Kljenak, Borut Mavko
Jo�zzef Stefan Institute, Jamova 39, SI-1000 Ljubljana, Slovenia
Abstract
The subject of the present work is a multidimensional modelling of vertical upward subcooled boiling flow using a
two-fluid approach and calculation of local two-phase flow parameters (void fraction and bubble size). The dependence
of bubble diameter on local flow conditions was taken into account. A sensitivity analysis of closure equations showed
that besides phase-change mechanisms, the transverse hydrodynamic mechanisms also have to be considered for
modelling of subcooled flow boiling at low-pressure conditions. The evolution of cross-sectional distributions of void
fraction and local bubble diameter along the flow was simulated and compared to low-pressure experimental data from
the literature [Experimental investigation of subcooled boiling, M.S.N.E. Thesis, Purdue University, West Lafayette,
IN, USA, 1999; Int. J. Multiphase Flow 28 (2002) 1351].
� 2003 Elsevier Ltd. All rights reserved.
Keywords: Subcooled boiling flow; Void distribution; Two-fluid model; Multidimensional modelling
1. Introduction
Subcooled flow boiling denotes the process of evap-
oration of liquid flowing near a heated surface (usually
channel wall), when the bulk flow temperature is lower
than the local saturation temperature. The liquid tem-
perature near the heated surface exceeds the saturation
temperature and then gradually decreases (below satu-
ration temperature) as the distance from the surface
increases. Although subcooled boiling may appear in the
form of different boiling regimes, the present work deals
only with nucleate subcooled boiling, in which liquid
evaporates in the form of vapour bubbles and a two-
phase layer occurs near the heated surface. Among
many industrial systems, subcooled flow boiling is im-
portant in water-cooled nuclear reactors, where the
presence of vapour influences the system reactivity.
One may categorize subcooled boiling according to
system pressure. The essential quantitative difference
between boiling at so-called ‘‘high-pressure’’ and ‘‘low-
* Corresponding author. Tel.: +386-1-588-5260; fax: +386-1-
561-2335.
E-mail address: [email protected] (B. Kon�ccar).
0017-9310/$ - see front matter � 2003 Elsevier Ltd. All rights reserv
doi:10.1016/j.ijheatmasstransfer.2003.09.021
pressure’’ conditions (below 10 bar) is the order of
magnitude of the difference between liquid and vapour
densities. At low pressure, nucleated bubbles are larger
and move farther away from the heated wall into the
cooler liquid before condensing, thus creating a different
flow structure. The increased interest to investigate low-
pressure subcooled boiling, which has appeared in recent
years, is mainly due to the need to perform safety
analyses of low-pressure research reactors and to in-
vestigate the sump-cooling concept for so-called ad-
vanced light water reactors.
In subcooled boiling flow in a vertical channel, not
only is vapour unevenly distributed over the channel
cross-section, but, in addition, the distribution evolves
along the flow, as both the void fraction and the width
of the two-phase layer near the heated surface gradually
increase. This non-homogeneous distribution of vapour
significantly influences hydrodynamic and thermal pro-
cesses, including heat transfer. Although a considerable
amount of literature deals with the cross-sectional dis-
tribution of the gas phase in adiabatic bubbly flow, in-
vestigations of analogous phenomena in boiling flow
have been much less common.
Many experiments on subcooled boiling flow in
channels have been performed over the past decades. As
ed.

Nomenclature
Abub non-dimensional bubble influence area
Ai interfacial area concentration (m�1)
Aw heated area (m2)
A1/ non-dimensional single-phase convection
area
Bo boiling number¼ qw=GhfgCL lift force coefficient
CTD turbulent dispersion force coefficient
C1, C2 wall lubrication force coefficients
Clb coefficient in the Sato model of bubble in-
duced turbulence
cpl liquid specific heat (J kg�1 K�1)
cw specific heat of solid wall (J kg�1 K�1)
Dh channel hydraulic diameter (m)
db bubble diameter (m)
dbw bubble departure diameter (m)
f bubble nucleation frequency (s�1)
G mass flow rate (kgm�2 s�1)
hif interfacial heat transfer coefficient
(Wm�2 K�1)
hfg latent heat (J kg�1)
hQ quenching heat transfer coefficient
(Wm�2 K�1)
h1/ single-phase convection heat transfer coeffi-
cient (Wm�2 K�1)
k turbulent kinetic energy of liquid (m2 s�2)
kl liquid thermal conductivity (Wm�1 K�1)
kw thermal conductivity of solid wall
(Wm�1 K�1)
Na number of active nucleation sites per unit
area (m�2)
n*
unit normal vector
Nub bubble Nusselt number
p pressure (Pa, bar)
qe evaporation heat flux (Wm�2)
qQ quenching heat flux (Wm�2)
qw wall heat flux (Wm�2)
q1/ single-phase convection heat flux (Wm�2)
r radial coordinate
St Stanton number¼Nu=RePrlT temperature (K)
v velocity (m s�1)
V control volume (m3)
yw distance from the near-wall computational
cell (m)
yþ non-dimensional distance
z axial coordinate (m)
Greek symbols
a void fraction
C mass transfer rate (kg s�1 m�3)
ll molecular liquid viscosity (N sm�2)
lturbl turbulent viscosity of liquid (N sm�2)
leffl effective viscosity of liquid (N sm�2)
lbl bubble induced viscosity of liquid (N sm�2)
q density (kgm�3)
qw density of solid wall (kgm�3)
sG bubble growth period (s)
sQ quenching period (s)
Subscripts
g vapour phase
in inlet conditions
i interface
l liquid phase
sat saturation
sub subcooling
w wall
Superscripts
d drag related
l lift force related
td turbulent dispersion force related
w wall related
wl wall lubrication force related
1500 B. Kon�ccar et al. / International Journal of Heat and Mass Transfer 47 (2004) 1499–1513
the emphasis of the present work is on the multidi-
mensional aspects of subcooled boiling, experiments in
which the non-homogeneous cross-sectional distribu-
tions of flow parameters were not investigated, but only
cross-sectional averages were determined (such as void
fraction or heat transfer coefficient, related to the cross-
sectional average temperature) are not considered here.
Besides, our scope is limited to experiments in which
water was used as a working fluid. Numerous experi-
ments that were performed with refrigerants at low
pressure are not considered, as they are supposed to
simulate boiling of water at high-pressure conditions,
which is not the subject of the present work.
Possibly the earliest experimental investigations of
the multidimensional character of subcooled boiling
were performed by St Pierre and Bankoff [3], who ob-
served subcooled boiling in a vertical rectangular chan-
nel with heated walls at pressures ranging from 200 to
800 psia (1.4 to 5.5 bar). They have measured transverse
void fractions over the channel cross-section at different
elevations. Nylund et al. (1967, as cited by Anglart and
Nylund [4]) have measured radial void fraction profiles
in an annular test section with a heated inner rod at
pressure 47 bar, and in a test section with six heated rods
at pressure 49.7 bar. Later, Sekoguchi et al. [5] have
determined radial void fraction profiles in cylindrical

B. Kon�ccar et al. / International Journal of Heat and Mass Transfer 47 (2004) 1499–1513 1501
tubes with heated walls at pressures 2, 4 and 8 atm.
Much recently, Bartel [1] has obtained radial profiles of
flow parameters at different axial locations in a vertical
annulus with a heated inner rod, at near atmospheric
pressure. Lee et al. [2] have also performed similar ex-
periments at comparable flow conditions, but have
reported radial distributions of flow parameters only at
a single axial location.
Among multidimensional theoretical descriptions of
subcooled boiling, the most widely used approach so far
appears to be two-fluid modelling. Thus, Kurul and
Podowski [6], Lai and Farouk [7], Anglart and Nylund
[4], Lahey Jr. and Drew [8], and Roy et al. [9] have all
proposed their own modifications of the two-fluid
model. However, their models have been applied either
to boiling of water at high pressure or to boiling of re-
frigerants at low pressure. Unfortunately, the extrapo-
lation of models developed for water at high-pressure
conditions to low pressure usually leads to erroneous
results. Extrapolations of models developed for high-
pressure conditions to low pressure have so far been
attempted only for one-dimensional two-fluid models
[10,11]. Namely, although the generic features of the
two-fluid model are the same, many closure relations
describing mass, momentum and energy exchange at the
gas–liquid interface do not apply to both high-pressure
and low-pressure conditions.
Multidimensional two-fluid models of subcooled
boiling flow of water at low pressure have been proposed
by Janssens-Maenhout et al. [12], Tu and Yeoh [13] and
Lee et al. [2]. All of them applied the general-purpose
computational fluid dynamics (CFD) code CFX. Lee
et al. [2] have successfully applied their model to the
simulation of their own experimental results, whereas Tu
and Yeoh [13] and Janssens-Maenhout et al. [12] have
presented only evolutions of cross-sectional average
quantities along the flow.
Some promising approaches for modelling of boiling
based on local instantaneous description of the flow field
have also been proposed [14,15]. However, due to the
complex structure of the interface in subcooled nucleate
boiling, these approaches are still computationally too
demanding for simulating boiling systems over a sig-
nificant portion of a channel. Another approach which
is worth mentioning is the so-called bubble-tracking
modelling, in which vapour bubbles are considered in-
dividually [16,17].
In the present work, a two-fluid model of upward
subcooled nucleate boiling flow in a vertical channel at
low-pressure conditions is proposed. The model consists
of a generic two-fluid model, which is implemented
within the CFX code, and additional closure relations
introduced by the authors. The model was validated by
comparing calculated results to experimental data from
other authors [1,2]. To the best of the authors’ knowl-
edge, this is the first attempt to simulate the evolution of
cross-sectional distributions of two-phase flow para-
meters along the flow at low-pressure conditions using a
two-fluid model.
2. Two-fluid model of subcooled nucleate flow boiling
The two-fluid model of subcooled nucleate boiling
flow consists of a dispersed phase (vapour bubbles) and
a continuous phase (liquid flow) and is based on two sets
of averaged transport equations. At averaging, the so-
called ‘‘interpenetrating continua’’ approach is used,
where each phase is treated as a continuum that fills up
the entire control volume and is described by its own
system of averaged equations for mass, momentum and
energy. Averaged equations for both phases are coupled
with additional closure relations describing the exchange
of mass, momentum and energy at the interface as well
as the turbulence within each phase. The two-fluid
model has been described extensively in many works
[18,19].
In the present work, the general-purpose computa-
tional fluid dynamics (CFD) code CFX-4.3 [20] was
used as a framework for solving the generic two-fluid
model with additional relevant closure relations, in-
troduced by the authors, which describe the mecha-
nisms of phase change and lateral transport of mass,
momentum and energy. The discretisation of transport
equations in the CFX-4.3 code is based on a conser-
vative finite-volume method. A non-staggered grid ar-
rangement is employed, where all variables (velocity
components and scalars) are stored in the geometrical
centres of control volumes (cells) that fill up the con-
sidered flow domain.
The emphasis of the present paper is on the de-
scription of the closure relations and the analysis of
calculated results.
2.1. Turbulence modelling
Due to the lower density of vapour, it is commonly
assumed that, in nucleate boiling flow, the motion of the
dispersed vapour phase follows the fluctuations in the
continuous liquid phase [6]. Accordingly, the turbulence
stresses are modelled only for the liquid phase, whereas
the vapour phase is assumed to be laminar. In the
present work, the following option from the CFX-4.3
code was applied: turbulence in the liquid phase is
modelled using a k–e model with an additional term
describing the bubble-induced turbulence. Shear and
bubble-induced turbulence are linearly superimposed,
according to an assumption from Sato et al. [21], where
the effective viscosity of the continuous liquid phase is
expressed as:
leffl ¼ ll þ lturb
l þ lbl : ð1Þ

1502 B. Kon�ccar et al. / International Journal of Heat and Mass Transfer 47 (2004) 1499–1513
The bubble-induced turbulence viscosity lbl in the liquid
phase depends on the vapour phase volume fraction a,the local bubble diameter db and the relative velocity
between the phases:
lbl ¼ Clbqladbjv
*g � v
*lj: ð2Þ
In the present work, the coefficient Clb was set to the
value 0.6, as recommended by Sato et al. [21]. The liquid
phase turbulence in the near wall region is described by
so-called ‘‘wall functions’’. The turbulent boundary
layer near the wall consists of a very thin laminar sub-
layer adjacent to the wall and a so-called ‘‘buffer re-
gion’’, which describes the flow between the laminar
sublayer and the core of the turbulent flow (modelled
with the k–e model). The thickness of the laminar sub-
layer is defined by the non-dimensional distance from
the wall yþ ¼ 11:23 [22]. In the laminar sublayer, the
axial liquid velocity is a linear function of the distance
from the wall. In the buffer region (11:236 yþ 6 300),
the velocity profile is described by the logarithmic wall
function [22].
2.2. Interphase momentum transfer
In the CFX-4.3 code, the interphase transfer of mo-
mentum in bubbly flows is modelled with the following
interfacial forces: drag force, lift force, turbulent dis-
persion force and wall lubrication force [20]. The inter-
phase drag force is flow-regime dependent and is
modelled according to a correlation by Ishii and Zuber
[23]. The lift force on the liquid phase can be calculated
as [20]:
F*
L ¼ aCLqlðu*
g � u*
lÞ � r � ðu*lÞ; ð3Þ
where CL is the lift force coefficient and was set to the
value 0.1, which is adequate for weakly turbulent bubbly
flow [24]. This force is shear-induced and pushes the
bubbles towards the wall (i.e. towards the lower velocity
region). The effect of diffusion of the vapour phase,
caused by liquid phase turbulence, is described with the
turbulent dispersion force:
F*
TD ¼ �CTDqlkra; ð4Þ
where k is the turbulent kinetic energy of the liquid
phase and CTD is the turbulent dispersion coefficient,
which was set to 0.1 according to Kurul and Podowski
[6]. Since the drainage rate of liquid is restrained by the
no-slip condition at the wall, the wall lubrication force
acts in the radial direction away from the wall and
prevents the accumulation of bubbles near the wall. The
wall lubrication force is modelled using a correlation
from Antal et al. [25]:
F*
W ¼ aqlðu*
g � u*
lÞ2
db�max C1
�þ C2
dbyw
; 0
�n*; ð5Þ
where yw denotes the distance from the wall. According
to Eq. (5), the wall lubrication force strongly depends on
the local bubble diameter db. In the present work, the
coefficient values were set as C1 ¼ �0:04 and C2 ¼ 0:08to obtain a good agreement between calculated and
experimental void fraction radial profiles. With this set
of coefficients, the wall lubrication force acts within the
region of two bubble diameters away from the heated
wall.
2.3. Interfacial condensation
In various subcooled boiling experiments, different
behaviour of bubbles near the heated surface has been
observed. At low-pressure conditions, a majority of in-
vestigators [26–28] agree on the following physical pic-
ture: bubbles generated at the heated wall slide along the
wall, eventually depart and travel further with the sub-
cooled flow, where they are subject to condensation.
In the present model of subcooled flow boiling, heat
and mass exchange between the phases are described by
bubble evaporation on the heated wall (Section 2.4) and
by bubble condensation in the subcooled liquid flow.
After departure from the heated wall, a bubble is sup-
posed to be surrounded by the subcooled liquid. When
the liquid surrounding a bubble is subcooled, the vapour
inside the bubble and the bubble interface are assumed
to be at saturation temperature. The interfacial con-
densation rate Ccond across the phase boundary is cal-
culated as:
Ccond ¼hifAiðTsat � TlÞ
hfg; ð6Þ
where Ai is the interfacial area per unit volume, hfg is thelatent heat and hif is the interphase heat transfer coeffi-
cient, defined by the bubble Nusselt number Nub:
hif ¼Nubkldb
; ð7Þ
where Nub is calculated from the Ranz-Marshall corre-
lation (from [20]). The bubbles in the proposed two-fluid
model are assumed to have a spherical shape, so that the
interfacial area Aif is expressed as 6a=db, a being the
vapour volume fraction.
2.4. Wall evaporation model
Modelling of the heat transfer term at the wall is one
of the most important issues in simulation of flow
boiling. The mechanisms controlling the heat transfer
from the wall to each phase are complex and although
nucleate flow boiling has been intensively investigated in
B. Kon�ccar et al. / International Journal of Heat and Mass Transfer 47 (2004) 1499–1513 1503
the past {Bowring (1962, as cited by Bibeau and Sal-
cudean [26]), Meister [29], Victor et al. [30]}, a lot of
research effort is still needed to satisfactory understand
the process.
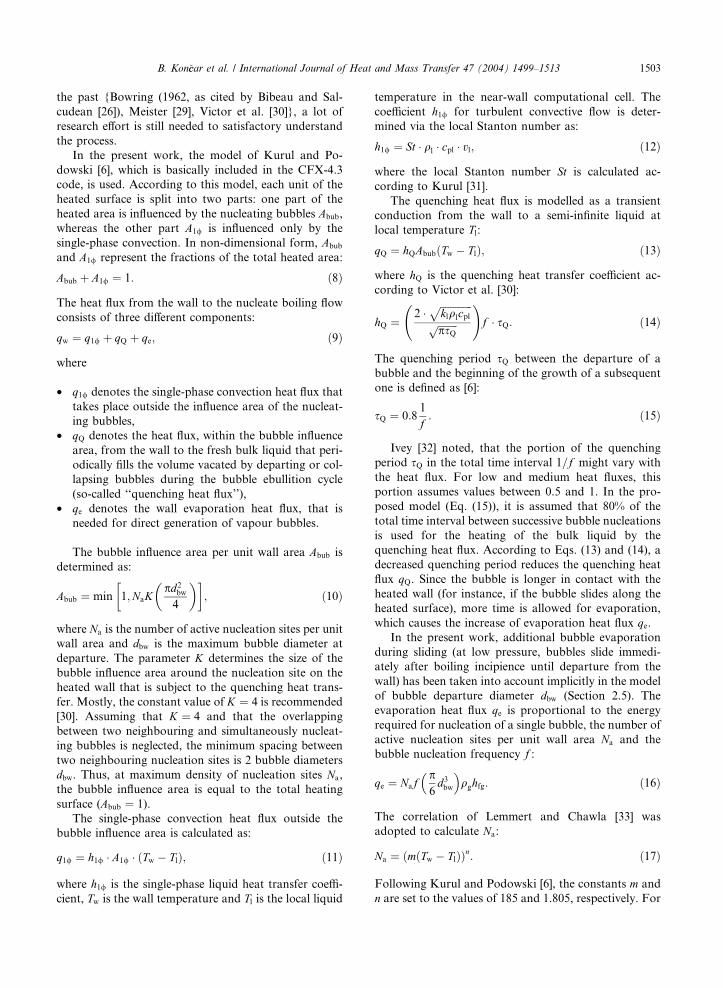
In the present work, the model of Kurul and Po-
dowski [6], which is basically included in the CFX-4.3
code, is used. According to this model, each unit of the
heated surface is split into two parts: one part of the
heated area is influenced by the nucleating bubbles Abub,
whereas the other part A1/ is influenced only by the
single-phase convection. In non-dimensional form, Abub
and A1/ represent the fractions of the total heated area:
Abub þ A1/ ¼ 1: ð8Þ
The heat flux from the wall to the nucleate boiling flow
consists of three different components:
qw ¼ q1/ þ qQ þ qe; ð9Þ
where
• q1/ denotes the single-phase convection heat flux that
takes place outside the influence area of the nucleat-
ing bubbles,
• qQ denotes the heat flux, within the bubble influence
area, from the wall to the fresh bulk liquid that peri-
odically fills the volume vacated by departing or col-
lapsing bubbles during the bubble ebullition cycle
(so-called ‘‘quenching heat flux’’),
• qe denotes the wall evaporation heat flux, that is
needed for direct generation of vapour bubbles.
The bubble influence area per unit wall area Abub is
determined as:
Abub ¼ min 1;NaKpd2
bw
4
� �� �; ð10Þ
where Na is the number of active nucleation sites per unit
wall area and dbw is the maximum bubble diameter at
departure. The parameter K determines the size of the
bubble influence area around the nucleation site on the
heated wall that is subject to the quenching heat trans-
fer. Mostly, the constant value of K ¼ 4 is recommended
[30]. Assuming that K ¼ 4 and that the overlapping
between two neighbouring and simultaneously nucleat-
ing bubbles is neglected, the minimum spacing between
two neighbouring nucleation sites is 2 bubble diameters
dbw. Thus, at maximum density of nucleation sites Na,
the bubble influence area is equal to the total heating
surface (Abub ¼ 1).
The single-phase convection heat flux outside the
bubble influence area is calculated as:
q1/ ¼ h1/ � A1/ � ðTw � TlÞ; ð11Þ
where h1/ is the single-phase liquid heat transfer coeffi-
cient, Tw is the wall temperature and Tl is the local liquid
temperature in the near-wall computational cell. The
coefficient h1/ for turbulent convective flow is deter-
mined via the local Stanton number as:
h1/ ¼ St � ql � cpl � vl; ð12Þ
where the local Stanton number St is calculated ac-
cording to Kurul [31].
The quenching heat flux is modelled as a transient
conduction from the wall to a semi-infinite liquid at
local temperature Tl:
qQ ¼ hQAbubðTw � TlÞ; ð13Þ
where hQ is the quenching heat transfer coefficient ac-
cording to Victor et al. [30]:
hQ ¼2 �
ffiffiffiffiffiffiffiffiffiffiffiffiffiklqlcpl
pffiffiffiffiffiffiffiffipsQ
p
!f � sQ: ð14Þ
The quenching period sQ between the departure of a
bubble and the beginning of the growth of a subsequent
one is defined as [6]:
sQ ¼ 0:81
f: ð15Þ
Ivey [32] noted, that the portion of the quenching
period sQ in the total time interval 1=f might vary with
the heat flux. For low and medium heat fluxes, this
portion assumes values between 0.5 and 1. In the pro-
posed model (Eq. (15)), it is assumed that 80% of the
total time interval between successive bubble nucleations
is used for the heating of the bulk liquid by the
quenching heat flux. According to Eqs. (13) and (14), a
decreased quenching period reduces the quenching heat
flux qQ. Since the bubble is longer in contact with the
heated wall (for instance, if the bubble slides along the
heated surface), more time is allowed for evaporation,
which causes the increase of evaporation heat flux qe.In the present work, additional bubble evaporation
during sliding (at low pressure, bubbles slide immedi-
ately after boiling incipience until departure from the
wall) has been taken into account implicitly in the model
of bubble departure diameter dbw (Section 2.5). The
evaporation heat flux qe is proportional to the energy
required for nucleation of a single bubble, the number of
active nucleation sites per unit wall area Na and the
bubble nucleation frequency f :
qe ¼ Nafp6d3bw
� �qghfg: ð16Þ
The correlation of Lemmert and Chawla [33] was
adopted to calculate Na:
Na ¼ ðmðTw � TlÞÞn: ð17Þ
Following Kurul and Podowski [6], the constants m and
n are set to the values of 185 and 1.805, respectively. For

1504 B. Kon�ccar et al. / International Journal of Heat and Mass Transfer 47 (2004) 1499–1513
the bubble nucleation frequency, the relationship of
Cole (1960, cited by Ivey [32]), was used:
f ¼
ffiffiffiffiffiffiffiffiffiffiffiffiffiffiffiffiffiffiffiffiffiffiffiffiffi4
3
gðql � qgÞdbwql
s; ð18Þ
where f is affected only by the bubble departure dia-
meter dbw and by phase densities ql and qg. Thus, the
modelling of wall heat transfer in subcooled nucleate
boiling largely depends on determining dbw.The remaining unknown in equations for heat flux
components (11), (13), (16) is the wall temperature Tw,that can be calculated from the wall heat flux balance
(Eq. (9)) with an iterative procedure using a bisection
algorithm [20]. The wall temperature depends on the
liquid temperature and velocities in the near-wall cell.
This heat flux partitioning algorithm is used as a default
algorithm in the CFX-4.3 code and presents a strongly
coupled problem for the code solver.
When the heat flux components are calculated, the
evaporation rate at the wall per unit volume Cw can be
obtained from the evaporation heat flux qe:
Cw ¼ qeðhfg þ cplDTsubÞ
Aw;i
Vi; ð19Þ
where hfg is the latent heat used to evaporate the liquid
at saturation temperature, whereas Aw;i and Vi are the
heated area and volume of the ith near-wall cell. The
second term in the denominator of Eq. (19) is used for
heating of the subcooled liquid to the saturation tem-
perature. It is assumed that the vapour inside the bub-
bles is at saturation condition.
2.5. Bubble departure diameter at the wall
According to many experimental results, the bubble
departure diameter dbw varies along the heated wall. The
experimental data of Unal [34], Zeitoun and Shoukri
[27], Bartel [1] and Prodanovic et al. [28] showed that at
low pressure (of about 1 bar), bubble sizes significantly
increased with decreasing subcooling along heated
channels. The generated bubbles of spherical or ellip-
soidal shape were relatively large (they reach maximum
diameters of a few millimetres). In the original CFX-4.3
code, dbw is modelled as a function of liquid subcooling.
In the present work, the authors applied Unal’s [34]
mechanistic model to describe the variation of bubble
departure size along the heated wall. Unal assumed that
a bubble is subject to simultaneous microlayer evapo-
ration at the bottom and to condensation at the top. The
bubble may slide or collapse on the heated surface
during its lifetime. After reaching the maximum size, the
bubble departs from the wall and migrates into the
subcooled liquid, where it eventually collapses. Unal’s
mechanistic model describes the maximum bubble de-
parture diameter dbw as a function of pressure, liquid
subcooling, heat flux and liquid flow velocity:
dbw ¼ Cbw
2:42� 10�5 � p0:709affiffiffiffiffiffib/
p ; ð20Þ
where coefficients a, C, b and / are defined as:
a ¼ ðqw � h1/ � DTsubÞ1=3kl2C1=3hfgqg
ffiffiffiffiffiffiffiffiffiffiffiffiffiffiffiffiffiffipkl=qlcpl
pffiffiffiffiffiffiffiffiffiffiffiffiffiffiffikwqwcwklqlcpl
s;
C ¼hfgll cpl=ð0:013hfgPr1:7l Þ
� 3ffiffiffiffiffiffiffiffiffiffiffiffiffiffiffiffiffiffiffiffiffiffiffiffiffiffir=ðql � qgÞg
q ;
b ¼ DTsub2ð1� qg=qlÞ
;
/ ¼vl
0:61
�0:47for vl P 0:61 m s�1;
1 for vl < 0:61 m s�1:
�
The range of applicability of the correlation is:
pressure: 0:1 < p < 17:7 MPa,
wall heat flux: 0:47 < qw < 10:64 MWm�2,
liquid velocity: 0:08 < ul < 9:15 m s�1,
liquid subcooling: 3:0 < DTsub < 86 K.
Since the heat flux in the considered experimental
data is below the range of applicability of the correla-
tion, the coefficient Cbw was added in Eq. (20) to describe
relatively large bubbles at low-pressure conditions. The
default value of Cbw is 2. However, this value had to be
adjusted in some experimental cases (see Section 3).
2.6. Modelling of local bubble diameter in the flow domain
Bubble size determines the interfacial momentum
transfer (drag force, wall lubrication force) as well as
interfacial heat and mass transfer (evaporation and
condensation). Since the maximum liquid temperature
occurs at the heated wall, one could expect that the
maximum value of local bubble diameter db would also
occur there. However, the experimental data of Bartel [1]
(see also Fig. 7) indicate that the maximum value of
measured local bubble Sauter diameter is somewhat
shifted away from the heated wall. The measured local
bubble diameter first increases in the radial direction and
then starts decreasing after reaching its maximum
somewhere in the subcooled flow region.
Due to lack of experimental data about the size of
bubble diameter or interfacial area concentration in
subcooled flow boiling, many investigators assumed
constant values of bubble diameter in the flow field and
spherical shape of the bubbles to determine the interfa-
cial area concentration Ai. Chatoorgoon et al. [35] used a
bubble diameter of 2.5 mm in their one-dimensional
subcooled boiling model. Lai and Farouk [7] prescribed
a 1 mm bubble diameter in the flow field to perform two-
dimensional numerical simulations of subcooled flow

B. Kon�ccar et al. / International Journal of Heat and Mass Transfer 47 (2004) 1499–1513 1505
boiling. Kurul and Podowski [6] and Anglart and Ny-
lund [4] modelled the bubble diameter as a linear func-
tion of local liquid subcooling with maximum value of
db located in the near-wall cell:
db ¼db1 � db0
DTsub;1 � DTsub;0DTsub þ
db0DTsub;1 � db1DTsub;0DTsub;1 � DTsub;0
:
ð21Þ
This approach requires the prescription of minimum db0and maximum bubble diameter db1, at reference sub-
coolings, DTsub;0 and DTsub;1, respectively. To develop an
adequate model of bubble diameter, it is necessary to
understand the physical mechanisms, which control the
bubble increase in the wall region. The possible reasons
that may cause the increase of bubble diameter in the
wall region are the following:
• Bubbles may coalesce before or after departure from
the heated surface. However, bubble coalescence is
probably not significant for the case of experiments
simulated in the present work [1,2], since the local
void fraction is always below 0.3.
• Very likely, a spectrum of bubble sizes (with mean
bubble departure diameter dbw) is being generated
in every local region of the heated wall; in a given ve-
locity and temperature field of liquid, larger bubbles
migrate farther into the subcooled flow than smaller
bubbles. Thus, the radial profile of measured local
bubble diameter averaged over the spectrum of bub-
ble sizes may increase with the distance from the wall
until the condensation effect prevails.
In the original CFX-4.3 code, the local bubble dia-
meter is treated as an adjustable parameter that is
independent from the bubble departure diameter. In
the present work, a simple model of radial distribution
of bubble diameter is proposed. The shift of the maxi-
mum local bubble diameter away from the heated wall
is modelled by a linear evolution in the radial direction
as:
d�b ¼ minðdbw þ yw; db;maxÞ; ð22Þ
where the bubble departure diameter dbw is imposed in
the near-wall cell. The radial distance from the near-wall
cell center is denoted as yw. The maximum allowed
bubble diameter db;max in the subcooled flow is pre-
scribed as 2dbw. Eq. (22) is then multiplied by a relation
describing the decrease of the bubble diameter due to
condensation in the subcooled flow field:
db ¼ d�b � exp
�� DTsub � DTsub;w
2 � DTsub;w
�ð23Þ
where DTsub;w is the local subcooling in the near-wall cell.
Thus, in the proposed model, the local bubble diameter
db in the flow field is coupled with the bubble departure
diameter dbw generated in the near-wall cell.
2.7. Saturation temperature
In the original CFX-4.3 code, the saturation tem-
perature may be defined only as a constant value over
the entire flow domain. In the present work, the satu-
ration temperature is modelled as a function of local
static pressure (according to steam tables). This is par-
ticularly important at near-atmospheric pressure, where
the saturation temperature may vary substantially along
the flow (for about 5 K in a 2 m long vertical tube) due
to high relative pressure drop.
3. Results and discussion
The proposed two-fluid model of subcooled flow
boiling was validated against two sets of low-pressure
experimental data from the literature, Bartel [1] and Lee
et al. [2]. In Bartel’s [1] experiments, radial profiles of
local void fraction and local bubble Sauter diameter
were measured. As bubbles in the proposed model are
assumed to be spherical, their diameters are equal to
Sauter diameters and may therefore be compared to
experimental results. In the work of Lee et al. [2], only
radial profiles of void fraction at a single axial location
are reported.
The subcooled flow boiling experiments of Bartel [1]
were performed at atmospheric pressure. The experi-
ments were carried out in a vertical annulus with a
heated inner rod. The annular test section has inner and
outer diameters of 19.1 and 38.1 mm, respectively. The
length of the heated part of the annulus is 1.5 m, while
the inlet part of the test section (0.635 m) is not heated.
Electrical conductivity probes were used to measure
local two-phase flow parameters, including void frac-
tion, interfacial area concentration and bubble Sauter
diameter. The data were collected at three different axial
locations in the heated part of the test section with a
fixed heater rod. Thus, the axial evolution of radial
distributions of flow parameters was observed.
It should be noted that in the case of Bartel’s ex-
periments, the absolute pressure was not measured in
any location of the experimental facility. Therefore, the
pressure at the inlet of the heated section was estimated
by the sum of the atmospheric pressure and the pressure
difference due to the elevation between the test section
inlet and the top of the separator tank, which was ex-
posed to the atmosphere. A detailed geometrical de-
scription of the experimental facility is provided in the
original reference [1]. Experiments were carried out at
different values of mass flow rate, heat flux and inlet
temperature. Experimental conditions are presented in
Table 1.

Table 1
Experimental conditions of Bartel [1]
Experiment
No.
qw(kWm�2)
G(kgm�2 s�1)
vinlet(m s�1)
Tin(K)
1 105 470 0.49 363.8
2 147 922 0.96 369.2
3 128 701 0.73 366.6
4 128 701 0.73 367.9
5 145 700 0.73 367.5
9.55 mm
z r
Inle
t H
eate
dse
ctio
n
500
mm
1500
mm
19.05 mm
Inlet liquid flow
Hea
ted
rod
9.5 mm
zr
Inle
t H
eate
dse
ctio
n
330
mm
1670
mm
18.75 mm
Inlet liquid flow
Hea
ted
tube
(a) (b)
Fig. 1. Simulation domains of Bartel’s (a) and Lee et al. (b) test
section.
1506 B. Kon�ccar et al. / International Journal of Heat and Mass Transfer 47 (2004) 1499–1513
The second set of experimental data used in the
present work was obtained by Lee et al. [2]. They have
used a test channel of similar geometry and dimensions
as the one used by Bartel [1]. The vertical annular test
channel is 2.376 m long with a heated inner tube. The
1.67 m long inner tube with outer diameter of 19 mm is
composed of a heated section with copper electrodes at
both ends of the heated section. The outer tube consists
of two stainless steel tubes of 37.5 mm inner diameter,
which are connected below the measuring plane by a
transparent 50 mm long glass tube.
Local measurements over the channel cross-section
were performed only at one axial location, 1.61 m
downstream of the beginning of the heated section. The
temperature and absolute pressure were measured at the
inlet. The measurement errors of mass flow rate, inlet
subcooling and heat flux were estimated to be within
±1.8%, ±2.5% and ±1.7% of the related values, respec-
tively. The system pressure was maintained between 1
and 2 bar. Local measurements of void fraction and
vapour velocity were carried out using electrical con-
ductivity probes. In the present work, four representa-
tive experimental cases, presented in Table 2, were
simulated.
3.1. Numerical model of selected experiments
The flow through the annular vertical tube is as-
sumed to be axis-symmetric. Therefore, the calculations
were carried out on a two-dimensional computational
domain in cylindrical r–z coordinates (Fig. 1).Due to similar geometry and dimensions, both sim-
ulation domains (for Bartel’s and Lee et al. test section)
were divided into 20 radial and 200 axial cells. The un-
heated inlet sections were included in the domains, be-
cause the radial profiles of velocity and temperature at
Table 2
Experimental conditions of Lee et al. [2]
Experiment No. Pinlet (MPa) qw (kWm�2) G
1 0.115 169.76 4
2 0.121 232.59 7
3 0.130 114.78 4
4 0.125 139.08 7
the inlet of the heated sections are not reported. Thus,
in the simulations, profiles developed until the beginning
of the heated section. Bartel’s test section is represented
by a 500 mm long unheated inlet part, followed by a
1500 mm long heated part. The inner and outer radii of
the simulation domain are 9.55 and 19.05 mm, respec-
tively. The test section of Lee et al. is represented by
a 330 mm long unheated inlet part, followed by a
1670 mm long heated part. The inner and outer radii of
Lee et al. computational domain are 9.5 and 18.75 mm,
respectively.
To solve the system of transport equations and clo-
sure relations, the appropriate boundary conditions
were set. A free slip boundary condition for the vapour
phase is used at the walls, taking into account the sliding
(kgm�2 s�1) Tin (�C) TsubðinÞ (�C)
78.14 83.9 19.6
18.16 84 21.2
76.96 95.6 11.5
15.17 93.9 12.0

B. Kon�ccar et al. / International Journal of Heat and Mass Transfer 47 (2004) 1499–1513 1507
of the bubbles in the laminar sublayer. As a logarithmic
wall function is used as a wall boundary condition for
the liquid phase velocity, the dimension of the near-wall
computational cell must satisfy the condition yþ >11:23. This requirement does not allow performing a
systematic convergence analysis on different grids (which
was also not reported in the works of other authors
[9,13]). The location of the centre of the first computa-
tional cell is set to 0.5 mm away from the heated wall in
both computational grids, so that yþ assumes values
between 50 and 80. A constant heat flux boundary
condition is applied at the inner wall of the annulus. The
outer wall of the annulus is assumed to be adiabatic. At
the inlet, uniform velocity and temperature profiles are
set according to Tables 1 and 2. At the outlet of the
annulus, a pressure boundary condition is applied. The
solution was considered to converge when relative errors
of enthalpy flows (relatively to the added heat) were
lower than 3% [36].
3.2. Sensitivity analyses of closure models
A series of parametric tests was performed to evalu-
ate the effect of the most important closure relations on
the radial distribution of local flow parameters. The tests
were carried out on Bartel’s case 4. This case was se-
lected as illustrative, because neither the mass flux nor
the wall heat flux assume extreme values in the consid-
ered ranges (see Tables 1 and 2).
3.2.1. Influence of bubble-induced turbulence
The influence of the bubble-induced turbulence
model (Eqs. (1) and (2)) is shown on Fig. 2. Two cal-
culations were performed, with different values of the
coefficient Clb (0.6 and 0.01) in the model of Sato et al.
(Eq. (2)). All other closure relations were kept un-
changed. In the case of a low value of Clb (0.01), the
effect of shear-induced turbulence prevails over the effect
of bubble-induced turbulence. Fig. 2a shows the radial
distribution of the effective viscosity of the liquid, where
higher liquid viscosity means more intense turbulent
mixing. In the case of prevailing shear-induced turbu-
lence (Clb ¼ 0:01), the liquid viscosity is the highest in
the central region of the annular gap, while it is lower
near both walls. In the case of significant bubble-
induced turbulence (Clb ¼ 0:6), the turbulent mixing of
the liquid is most intense near the heated wall, where the
bubbles are generated. Bubble-induced turbulence sig-
nificantly enhances the transverse transport of mass,
momentum and heat in the wall region, causing a flat-
tening of the variable gradients (e.g. liquid temperature
and axial liquid velocity, as shown in Fig. 2b and c). Due
to the bubble-induced turbulence, the reduced temper-
ature near the heated wall also influences the wall
evaporation rate. As a lower temperature directly affects
the calculation of the bubble departure diameter dbw
(Eq. (20)), a lower diameter dbw is calculated along the
heated wall for the simulation with Clb ¼ 0:6 (Fig. 2).
Following Eq. (16), the lower value of diameter dbwimplies a lower evaporation heat flux qe (Fig. 2e).
Consequently, a lower wall evaporation rate results in a
lower void fraction in the near-wall region (Fig. 2f).
Thus, bubble-induced turbulence causes a lower void
fraction in the near-wall region.
3.2.2. Influence of non-drag forces
The effect of the non-drag forces (turbulent disper-
sion: TD, lift force: LF and wall lubrication: WL) for
Bartel’s experimental case 4 is presented on Fig. 3. Four
different calculations were performed to evaluate the
effect of each non-drag force on the flow parameters.
The forces were gradually added to the generic two-fluid
model, whereas the other closures remained unchanged.
Thus, the curve ‘‘None’’ indicates the calculation, where
none of the non-drag forces is included in the two-fluid
model, whereas the curve ‘‘TD+LF+WL’’ represents
the calculation with all non-drag forces implemented in
the model.
As shown on Fig. 3a, the inclusion of the turbulent
dispersion force (TD) acts to flatten the radial void
fraction profile. Similarly, the gradient of the liquid
temperature (Fig. 3b) also decreases. As shown in Fig.
3a and b, the lift force has no significant effect on the
lateral distribution of flow parameters. The additional
inclusion of the wall lubrication force (TD+LF+WL)
significantly improves agreement with experimental
data. The wall lubrication force acts to push the vapour
bubbles away from the wall and successfully reproduces
the maximum void fraction located somewhat apart
from the wall. However, the influence of the wall lu-
brication force on the liquid temperature is not signifi-
cant. Finally, one can see that the calculation without
non-drag forces (None) gives the poorest prediction of
local void fraction distribution (Fig. 3a).
3.2.3. Influence of bubble size
Bubbles in boiling flow are subject to complex
physical phenomena (evaporation, condensation, tur-
bulence, coalescence, etc.) that affect their size. The
bubble size varies significantly along the flow, as well as
in the radial direction to the flow. Four different calcu-
lations with different models of local bubble diameter
were performed (Fig. 4). The experimental values rep-
resent the local bubble Sauter diameter. In the first two
calculations, constant values for bubble diameters were
used (1 and 4 mm). The calculation denoted as ‘‘linear’’
means that the bubble diameter db is modelled as a linear
function of local liquid subcooling, according to Eq.
(21). The bubble diameters at the reference liquid sub-
cooling temperatures of 5 and )2 K were set to the
values of 1 and 3.8 mm for the conditions of the con-
sidered experiment (as in the work of Kon�ccar and

0
0.02
0.04
0.06
0.08
0.1
0.12
0 0.2 0.4 0.6 0.8 1
(r-Ri)/(Ro-Ri)
Liqu
id v
isco
sity
(Pas
) Cmi=0.01
Cmi=0.6
370
371
372
373
374
0 0.2 0.4 0.6 0.8 1
(r-Ri)/(Ro-Ri)
Liq.
tem
pera
ture
(K) Cmi=0.01
Cmi=0.6
0
0.2
0.4
0.6
0.8
1
1.2
0 0.2 0.4 0.6 0.8 1
(r-Ri)/(Ro-Ri)
Liq.
vel
ocity
(ms-1
)
Cmi=0.01
Cmi=0.6
0
0.001
0.002
0.003
0.004
0.005
0.006
0 20 40 60 80 100 120
z/Dh
d bw (m
)
Cmi=0.01
Cmi=0.6
0
0.2
0.4
0.6
0.8
1
0 20 40 60 80 100 120
z/Dh
q e/q
w
Cmi=0.01
Cmi=0.6
0
0.2
0.4
0.6
0.8
1
0 0.2 0.4 0.6 0.8 1
(r-Ri)/(Ro-Ri)
Void
frac
tion
Cmi=0.01
Cmi=0.6
(a) (b)
(c) (d)
(e) (f)
Fig. 2. Influence of bubble-induced turbulence (at axial location z=Dh ¼ 98:7; [1], case 4).
0
0.2
0.4
0.6
0.8
1
0 0.2 0.4 0.6 0.8 1
(r-Ri)/(Ro-Ri)
Void
frac
tion
ExpNoneTDTD+LFTD+LF+WL
370
371
372
373
374
0 0.2 0.4 0.6 0.8 1(r-Ri)/(Ro-Ri)
Liq.
tem
pera
ture
(K)
NoneTDTD+LFTD+LF+WL
(a) (b)
Fig. 3. Influence of non-drag forces (at axial location z=Dh ¼ 98:7; [1], case 4).
1508 B. Kon�ccar et al. / International Journal of Heat and Mass Transfer 47 (2004) 1499–1513

0
0.002
0.004
0.006
0.008
0.01
0 0.2 0.4 0.6 0.8 1
(r-Ri)/(Ro-Ri)
Bubb
le d
iam
eter
(m)
Exp1 mm4 mmlinearincreasing profile
0
0.2
0.4
0.6
0.8
1
0 0.2 0.4 0.6 0.8 1
(r-Ri)/(Ro-Ri)
Void
frac
tion
Exp1 mm4 mmlinearincreasing profile
370
371
372
373
374
375
0 0.2 0.4 0.6 0.8 1
(r-Ri)/(Ro-Ri)
Liqu
id te
mpe
ratu
re (K
) 1 mm4 mmlinearincreasing profile
0
0.02
0.04
0.06
0.08
0.1
0.12
0.14
0.16
0 0.2 0.4 0.6 0.8 1
(r-Ri)/(Ro-Ri)
Liqu
id v
isco
sity
(Pas
)
1 mm4 mmlinearincreasing profile
(a) (b)
(c) (d)
Fig. 4. Influence of bubble diameter modelling (at axial location z=Dh ¼ 98:7; [1], case 4).
B. Kon�ccar et al. / International Journal of Heat and Mass Transfer 47 (2004) 1499–1513 1509
Mavko [37]). Outside this subcooling range, the dia-
meters are assumed to be constant (boundary values are
extrapolated). In the calculation denoted as ‘‘increasing
profile’’, the bubble diameter is modelled according to
Eq. (23) proposed in this paper. A comparison of bubble
diameters in Fig. 4a shows that the ‘‘increasing profile’’
model exhibits a good agreement against the experi-
mental data. Radial void fraction profiles are presented
in Fig. 4b. Except in the ‘‘1 mm’’ calculation case, dif-
ferent bubble diameter modelling does not exhibit a
significant influence on the radial void fraction distri-
bution. In the case of 1 mm bubble size, the void fraction
maximum is much higher and is located at the wall.
Namely, due to small bubble diameter, the wall lubri-
cation force is too weak to transport the bubbles away
from the wall. A small bubble diameter also increases
the condensation rate, so that the two-phase region is
much narrower. Fig. 4c shows radial profiles of liquid
temperature, where the highest temperature gradient at
the wall can be observed in the case of 1 mm bubble
diameter and the lowest in the case of 4 mm bubble
diameter. As discussed previously, a high temperature
gradient near the wall is a consequence of low turbulent
mixing in the wall region. According to Eq. (2), the
bubble-induced viscosity is directly proportional to the
bubble diameter db. A comparison of liquid viscosities
(Fig. 4d) for different bubble models confirms that the
least intense turbulent mixing occurs in the case of the
smallest bubble diameter.
3.3. Simulation of experimental data
As illustrative examples, Fig. 5 shows the evolution
of the calculated partitioning of the wall heat flux along
the heated channel for two of Bartel’s experiments. In
both cases, the single-phase convection heat flux grad-
ually decreases, while quenching and evaporation heat
fluxes increase. Most of the heat flux is transferred to the
liquid phase. The evaporation heat flux fraction does not
exceed 0.5 of the wall heat flux, even near the end of the
heated length. Due to the relatively low inlet subcooling,
boiling is initiated already at the beginning of the heated
section in both cases. For the experimental case 4, a fully
developed boiling region (q1/ ¼ 0) may be observed at
the end of the heated section. The transition from par-
tially developed to the fully developed boiling region
coincides with the rapid increase of average void frac-
tion, as shown in Fig. 6.
Fig. 7 presents radial distributions of void fraction
and local bubble diameter at three different axial loca-
tions for Bartel’s experiments [1] (see Table 1). In gen-
eral, the predicted evolution of the two-phase region
along the tube agrees with the experimental observation:
as boiling develops along the heated wall, the two-phase
region widens, the void fraction maximum increases and
shifts away from the wall. Although some discrepancies
between measured and predicted results of individual
radial profiles may be observed, in general, the axial
evolutions of void fraction and bubble diameter profiles

0
0.2
0.4
0.6
0.8
1
0 20 40 60 80 100 120
z/Dh
Frac
tion
of th
e to
tal h
eat f
lux Case 3
qe/qw
q1 /qw
qQ/qw
heated section
0
0.2
0.4
0.6
0.8
1
0 20 40 60 80 100 120
z/Dh
Frac
tion
of th
e to
tal h
eat f
lux Case 4
qe/qw
q1 /qw
qQ/qw
heated section
Fig. 5. Calculated heat flux partitioning along the heated channel [1].
0
0.05
0.1
0.15
0 20 40 60 80 100 120
z/D h
Void
frac
tion
Void
frac
tionExp
Case 3Calc
0
0.05
0.1
0.15
0 20 40 60 80 100 120
z/Dh
Exp
Case 4Calc
Fig. 6. Distribution of averaged void fraction along the heated channel [1].
1510 B. Kon�ccar et al. / International Journal of Heat and Mass Transfer 47 (2004) 1499–1513
(experimental values represent the bubble Sauter dia-
meter) are successfully reproduced. This indicates that
the proposed modelling approach captures basic mech-
anisms that control low-pressure subcooled boiling in
vertical upward flow.
For case 1, a reasonable agreement of void fraction
profiles at the lowest and the highest axial location may
be observed, whereas the calculated local void fraction
at the intermediate location somewhat underpredicts the
experimental data. For case 2, a good agreement of void
fraction at the lowest axial location, underprediction at
the intermediate axial location and an extremely high
discrepancy of void fraction results at the highest loca-
tion can be noted. However, the measured void fraction
values at the highest location are most unusual, since
one would not expect the void fraction at the highest
location to be lower than the void fraction at an inter-
mediate location. Similar agreement of void fraction
profiles as in case 1 can be observed in case 3 (good at
the lowest and at the highest axial location and under-
prediction of void fraction at the intermediate location).
For cases 4 and 5, the void fraction is somewhat un-
derpredicted at the lowest and intermediate axial loca-
tions, whereas quite good agreement at the highest
location may be observed.
In general, the calculated local bubble diameter
profiles assume similar shapes as measured profiles.
Considering the radial direction away from the wall, the
increase of bubble diameter in the near-wall region is
followed by a decrease of bubble diameter towards the
outer adiabatic wall. The best agreement with measured
bubble diameter data may be observed in cases 3, 4 and
5 with the same mass flow rate, whereas the agreement is
less satisfactory in cases 1 and 2 with different mass flow
rates.
It should be mentioned that the proposed two-fluid
model experienced some difficulties in the cases 1 and 2.
A reasonable prediction of void fraction for these two
cases, presented in Fig. 7, was achieved by adjusting the
coefficient Cbw in the correlation for bubble departure
diameter dbw (Eq. (20)) to the values 3 and 1.5 for the
experimental cases 1 and 2, respectively. Since the local
void fraction of the considered experiments is always
below 0.3, bubble coalescence at the heated surface is
not expected to be a major reason for these necessary
adjustments of bubble departure diameter. The en-
hanced variation of bubble departure size may be due to
sliding of bubbles in the thermal boundary layer adja-
cent to the heated wall. Namely, according to Proda-
novic et al. [28], the sliding distance and bubble

0
0.05
0.1
0.15
0.2
0.25
0.3
0 0.2 0.4 0.6 0.8 1(r-Ri)/(Ro-Ri)
Void
frac
tion
Case 1 Exp Calc z/Dh
4077.798.7
0
0.002
0.004
0.006
0.008
0.01
0 0.2 0.4 0.6 0.8 1(r-Ri)/(Ro-Ri)
Bubb
le d
iam
eter
(m) Exp Calc z/Dh
4077.798.7
Case 1
0
0.05
0.1
0.15
0.2
0.25
0.3
0 0.2 0.4 0.6 0.8 1(r-Ri)/(Ro-Ri)
Void
frac
tion
Void
frac
tion
Void
frac
tion
Void
frac
tion
Case 2 Exp Calc z/Dh
4077.798.7
0
0.002
0.004
0.006
0.008
0.01
0 0.2 0.4 0.6 0.8 1
Bubb
le d
iam
eter
(m)
Bubb
le d
iam
eter
(m)
Bubb
le d
iam
eter
(m)
Bubb
le d
iam
eter
(m)
Exp Calc z/Dh4077.798.7
Case 2
0
0.05
0.1
0.15
0.2
0.25
0.3
0 0.2 0.4 0.6 0.8 1(r-Ri)/(Ro-Ri)
(r-Ri)/(Ro-Ri) (r-Ri)/(Ro-Ri)
Case 3 Exp Calc z/Dh
4077.798.7
0
0.002
0.004
0.006
0.008
0.01
0 0.2 0.4 0.6 0.8 1(r-Ri)/(Ro-Ri)
(r-Ri)/(Ro-Ri)
Exp Calc z/Dh4077.798.7
Case 3
0
0.05
0.1
0.15
0.2
0.25
0.3
0 0.2 0.4 0.6 0.8 1
Case 4 Exp Calc z/Dh
4077.798.7
0
0.002
0.004
0.006
0.008
0.01
0 0.2 0.4 0.6 0.8 1
Exp Calc z/Dh4077.798.7
Case 4
0
0.05
0.1
0.15
0.2
0.25
0.3
0 0.2 0.4 0.6 0.8 1
(r-Ri)/(Ro-Ri)
Case 5 Exp Calc z/Dh
4077.798.7
0
0.002
0.004
0.006
0.008
0.01
0 0.2 0.4 0.6 0.8 1
(r-Ri)/(Ro-Ri)
Exp Calc z/Dh4077.798.7
Case 5
Fig. 7. Radial distributions of void fraction and local bubble diameter for Bartel’s experiments [1].
B. Kon�ccar et al. / International Journal of Heat and Mass Transfer 47 (2004) 1499–1513 1511
departure size strongly depend on the variation of mass
flow rate and heat flux in the range of low Bond num-
bers, Bo < 5� 10�4, to which conditions for all simu-
lated experiments in this paper belong. This underlines
the need for further improvement of bubble departure
size model, which should take into account a better
description of bubble sliding phenomenon.
Comparisons between calculated and measured void
fraction radial profiles of Lee et al. [2] experiments
are presented in Fig. 8. The value of Cbw remained

0
0.1
0.2
0.3
0 0.2 0.4 0.6 0.8 1
(r-Ri)/(Ro-Ri)
Void
Fra
ctio
nVo
id F
ract
ion
Void
Fra
ctio
nVo
id F
ract
ion
Exp Calc z (m)
0.181.181.61
Case 1
0
0.1
0.2
0.3
0 0.2 0.4 0.6 0.8 1 1.2
(r-Ri)/(Ro-Ri)
Exp Calc z (m)
0.181.181.61
Case 2
0
0.1
0.2
0.3
0 0.2 0.4 0.6 0.8 1 1.2
(r-Ri)/(Ro-Ri)
Exp Calc z (m)
0.181.181.61
Case 3
0
0.1
0.2
0.3
0 0.2 0.4 0.6 0.8 1
(r-Ri)/(Ro-Ri)
Exp Calc z (m)
0.181.181.61
Case 4
Fig. 8. Radial distributions of void fraction for Lee et al. experiments [2].
1512 B. Kon�ccar et al. / International Journal of Heat and Mass Transfer 47 (2004) 1499–1513
unchanged (Cbw ¼ 2) in all calculations. Although the
measurements of local void fraction were performed
only at one axial location (z ¼ 1:61 m), the simulation
results at two other axial locations are also presented in
the figures to illustrate the simulated evolution. A good
agreement between predictions and experimental data
may be observed for three out of four experimental
cases. The local void fraction is significantly underpre-
dicted only for the experimental case 2.
4. Conclusions
A two-fluid model of subcooled nucleate boiling flow
in a vertical channel at low-pressure conditions was
proposed. The model allows the simulation of the
gradual evolution of the flow structure along the channel
due to hydrodynamic and thermal mechanisms.
A good overall agreement between calculated and
experimental data from the literature was obtained. The
analysis of results also highlighted the importance of the
following two phenomena in the modelling of subcooled
boiling flow at low-pressure conditions:
• lateral hydrodynamic mechanisms: lift force, wall lu-
brication force and mixing due to bubble-induced
turbulence,
• variation of bubble diameter according to local flow
conditions.
Acknowledgements
The financial support of the Ministry of Education,
Science and Sports of the Republic of Slovenia under
Research programme P0-0505-0106 is gratefully ac-
knowledged.
References
[1] M.D. Bartel, Experimental investigation of subcooled
boiling, M.S.N.E. Thesis, Purdue University, West Lafa-
yette, IN, USA, 1999.
[2] T.H. Lee, G.C. Park, D.J. Lee, Local flow characteristics
of subcooled boiling flow of water in a vertical concen-
tric annulus, Int. J. Multiphase Flow 28 (2002) 1351–
1368.
[3] C.C. St Pierre, S.G. Bankoff, Vapor volume profiles in
developing two-phase flow, Int. J. Heat Mass Transfer 10
(1967) 237–249.
[4] H. Anglart, O. Nylund, CFD application to prediction of
void distribution in two-phase bubbly flows in rod bundles,
Nucl. Eng. Des. 163 (1996) 81–98.
[5] K. Sekoguchi, O. Tanaka, S. Esaki, N. Katsuki, M.
Nakasatomi, Prediction method of flow patterns in sub-
cooled and low quality boiling regions, Bull. Jpn. Soc.
Mech. Eng. 24 (1981) 834–841.
[6] N. Kurul, M.Z. Podowski, Multidimensional effects in
forced convection subcooled boiling, in: Proceedings of the
Ninth International Heat Transfer Conference, vol. 2,
August 19–24, Jerusalem, Israel, 1990, pp. 21–26.

B. Kon�ccar et al. / International Journal of Heat and Mass Transfer 47 (2004) 1499–1513 1513
[7] J.C. Lai, B. Farouk, Numerical simulation of subcooled
boiling and heat transfer in vertical ducts, Int. J. Heat Mass
Transfer 36 (1993) 1541–1551.
[8] R.T. Lahey Jr., D.A. Drew, The analysis of two-phase flow
and heat transfer using a multidimensional, four field, two-
fluid model, Nucl. Eng. Des. 204 (2001) 29–44.
[9] R.P. Roy, S. Kang, J.A. Zarate, A. Laporta, Turbulent
subcooled boiling flow––experiments and simulations,
J. Heat Transfer 124 (2002) 73–93.
[10] S. Hari, Y.A. Hassan, Improvement of the subcooled
boiling model for low-pressure conditions in thermal-
hydraulic codes, Nucl. Eng. Des. 216 (2002) 139–152.
[11] B. Kon�ccar, B. Mavko, Modelling of low-pressure sub-
cooled flow boiling using the RELAP5 code, Nucl. Eng.
Des. 220 (2003) 255–273.
[12] G. Janssens-Maenhout, J.U. Knebel, U. Mueller, Sub-
cooled nucleate boiling at low pressure and low heat flux,
in: Proceedings of 3rd International Conference on Mul-
tiphase Flow, June 8–12, Lyon, France, 1998.
[13] J.Y. Tu, G.H. Yeoh, On numerical modelling of low
pressure subcooled boiling flows, Int. J. Heat Mass
Transfer 45 (2002) 1197–1209.
[14] D. Juric, G. Tryggvason, Computation of boiling flows,
Int. J. Multiphase Flow 24 (1998) 387–410.
[15] D. Legendre, J. Boree, J. Magnaudet, Thermal and
dynamic evolution of a spherical bubble moving steadily
in a superheated or subcooled liquid, Phys. Fluids 10
(1998) 1256–1272.
[16] G.A. Mortensen, J.A. Trapp, Two-phase flow modeling
with discrete particles, in: Proceedings of the ASME Heat
Transfer Division, Two-Phase Flow in Energy Exchange
Systems, vol. 220, pp. 73–85, 1992.
[17] I. Kljenak, G.C. Park, B. Mavko, T. Lee, Bubble-tracking
modeling of subcooled nucleate boiling in a vertical
annulus, in: Proceedings of the Twelfth International Heat
Transfer Conference, August 18–23, Grenoble, France,
2002, pp. 767–772.
[18] M. Ishii, Thermo-fluid dynamic theory of two-phase flow,
Eyrolles, Paris, 1975.
[19] M. Leskovar, B. Mavko, An original combined multiphase
model of the steam-explosion premixing phase, J. Mech.
Eng. 48 (2002) 438–448.
[20] CFX-4.3 Solver Manual, AEA Technology plc, Harwell,
United Kingdom, 1999.
[21] Y. Sato, M. Sadatomi, K. Sekoguchi, Momentum and heat
transfer in two-phase bubble flow––I. Theory, Int. J.
Multiphase Flow 7 (1981) 167–177.
[22] B.E. Launder, D.B. Spalding, Mathematical Models of
Turbulence, Academic Press, New York, 1972.
[23] M. Ishii, N. Zuber, Drag coefficient and relative velocity in
bubbly, droplet or particulate flows, AIChE J. 25 (1979)
843–855.
[24] R.T. Lahey Jr., The CFD analysis of multidimensional
phenomena in multiphase flow, in: Proceedings of 2nd
International Conference on Multiphase Flow, April 3–7,
Kyoto, Japan, 1995.
[25] S.P. Antal, R.T. Lahey Jr., J.E. Flaherty, Analysis of phase
distribution in fully developed laminar bubbly two-phase
flow, Int. J. Multiphase Flow 17 (1991) 635–652.
[26] E.L. Bibeau, M. Salcudean, Subcooled void growth mech-
anisms and prediction at low pressure and low velocity, Int.
J. Multiphase Flow 20 (1994) 837–863.
[27] O. Zeitoun, M. Shoukri, Bubble behavior and mean
diameter in subcooled flow boiling, J. Heat Transfer 118
(1996) 110–116.
[28] V. Prodanovic, D. Fraser, M. Salcudean, Bubble behavior
in subcooled flow boiling of water at low pressures and low
flow rates, Int. J. Multiphase Flow 28 (2002) 1–19.
[29] G. Meister, Vapour bubble growth and recondensation in
subcooled boiling flow, Nucl. Eng. Des. 54 (1979) 97–114.
[30] H. Victor, M. Del Valle, D.B.R. Kenning, Subcooled flow
boiling at high heat flux, Int. J. Heat Mass Transfer 28
(1985) 1907–1920.
[31] N. Kurul, Multidimensional effects in two-phase flow
including phase change, Ph.D. Thesis, Rensselaer Poly-
technic Institute, Troy, NY, USA, 1990.
[32] H.J. Ivey, Relationships between bubble frequency, depar-
ture diameter and rise velocity in nucleate boiling, Int. J.
Heat Mass Transfer 10 (1967) 1023–1040.
[33] M. Lemmert, J.M. Chawla, Influence of flow velocity on
surface boiling heat transfer coefficient, in: E. Hahne, U.
Grigull (Eds.), Heat Transfer in Boiling, Academic Press
and Hemisphere, 1977.
[34] H.C. Unal, Maximum bubble diameter, maximum bubble-
growth time and bubble-growth rate, Int. J. Heat Mass
Transfer 19 (1976) 643–649.
[35] V. Chatoorgoon, G.R. Dimmick, M.B. Carver, W.N.
Selander, Application of generation and condensation
models to predict subcooled boiling void at low pressures,
Nucl. Technol. 98 (1992) 366–378.
[36] B. Kon�ccar, Model of forced convective subcooled boiling
at low pressure conditions, Ph.D. Thesis, Faculty of
Mathematics and Physics, University of Ljubljana, Slove-
nia, 2002.
[37] B. Kon�ccar, B. Mavko, CFD simulation of subcooled flow
boiling at low pressure, in: Proceedings of International
Conference Nuclear Energy in Central Europe, September
10–13, Portoro�zz, Slovenia, 2001.
Related Documents