International Journal of Research and Scientific Innovation (IJRSI) | Volume VII, Issue XI, November 2020 | ISSN 2321–2705 www.rsisinternational.org Page 69 Modelling of Drainage Basin in Udi-Awgu Cuesta, Southeastern Nigeria Using Remote Sensing and GIS Ejemeyovwi Danny Ochuko Associate Professor, Faculty of The Social Sciences, Department of Geog. & Reg. Planning, Delta Slate University, P.M.B.1, Abraka, Nigeria Abstract: GIS and remotely sensed enhanced multi-spectral data of Digital Elevation Model (DEM,), Landsat ETM+ digital Image and aerial photos to generate hydrologic mops for basin morphometric studies. Measurement of properties to evaluate parameters (Indices,) was carried out for Udi-Awgwu Cuesta Regions, South Eastern Nigeria. The analysis was carried out using digitized hydrological maps geo referenced using 4 points (resampled and merged) and the sub mqpof the study area extracted and incorporated into the GIS spatial data base in a GIS environment. The interpreted images are superimposed to create appropriate information platform to generate hydrological maps for analysis, interpretation and classification at sub basins level of water divided concept. The mapping of the drainage networks was followed by fieldwork (ground truthing) for confirmation of field observations during pre and post interpretative phases using the basic interpretative element of colour, lone, shape, pattern, shadow, site and association.. There is observed increased innetwork and basins in the enhanced data (ETM and DEM) than the aerial Photos due to higher resolving power( resolutions). There are major implications of the properties and parameters representedby six factors of reduced ranked variables evaluated with their implications include: basin circularity (RC) values of 0.62- 0.74 approaches one (1) tend to indicate basin pear shape with geological and hydrological tendencies of the uniform infiltration which does not overflow, as it takes long time for excess water to reach the basin outlet. The relief of 750m indicates high gravity water flow, high erosion tendencies, high infiltration arid high run-off conditions while the drainage density (Dd) between 0.85 and 0.95 depicts high permeable subsurface under sparse vegetation cover arid of medium relief subject to high erosion. The low values (0.52-0.62) of the bifurcation ratio (Rb) indicates low structural complexity and high permeability subsurface with attendant subsurface erosion. Cumulative stream length (between 830-1019.6) is indicative of fairly low value that characterized medium relief permeable bedrock and low structural disturbance depicting absence of geologic influence in the area. The various landforms associated with geo- fluvial processes in the upland area area ridges, undulating plateau, rills and gullies with rough to smooth rounded tops while in the lowland area are found sedimentary veneers (weathered, eroded loose earth materials) transported downwards and are responsible for the developments of fluvial deposition features of rolling plains, foot slopes, narrow valleys with main valley floor at the end of erosional plain. Keywords: Geology, Drainage, Basin Morphometry, Landforms, GIS/Remote Sensing. I.INTRODUCTION opographical base maps produced from aerial photos available to Nigeria researchers, are on the scale of 1:50,000 and until new ones with large scales are produced, the need still exists for the maps to be improved upon (using various enhancement procedure and techniques) to make them more useful for geomorphologic and hydrologic investigations. This study further explore the enhancement techniques of aerial photographyand satellite data adopted by Ebisemiju, 1978) and Reddy et al., (2004) anddigital analyses of satellite data was applied by Reddy et al, (2004); Das and Makheijee, (2007) and Koul et al, (2007) among ethers for morphometric studies whose results actually portray true field data. The aim of this research work is to use satellite remotely sensed multispectral data of digital elevation model (DEM) and Landsat ETM+) and Aerial photos to generate hydrologic maps for measurement of morphometric properties to evaluate parameters (indices) using digital analysis. The specific objectives include to: • Generate hydrological maps using remotely sensed data i.e. Landsat enhanced thematic mapper (ETM+) and digital elevation model (DEM), data, and aerial photos. • Generated hydrological maps to digitally map the drainage basins and stream networks to generate morphometric properties. • evaluate parameters (indices) in the drainage basins to present their implications and • identify the various landforms in the area and adduced reasons for their formations II. STUDY AREA The study area is a part of the Udi-Awgu cuesta in Enugu State, South Eastern Nigeria, The Udi-Awgu Cuesta is located in Udi and Awgu LGAs of Enugu State, Nigeria within the sector of the impressive Nsukka-Okigwe Cuesta running through North-South direction on the cuesta is bounded in the east by the Cross river plan and on the west by the Anambra/Mamu lowlands. The Udi-Awgu section of the cuesta is referenced by latitudes 6° 00 ʹ N and 6° 20 ʹ N as well as longitudes 7° 02ʹE and 7°31ʹE with approximate area extent of 4,200 km 2 . (fig. l - 3) T

Welcome message from author
This document is posted to help you gain knowledge. Please leave a comment to let me know what you think about it! Share it to your friends and learn new things together.
Transcript
International Journal of Research and Scientific Innovation (IJRSI) | Volume VII, Issue XI, November 2020 | ISSN 2321–2705
www.rsisinternational.org Page 69
Modelling of Drainage Basin in Udi-Awgu Cuesta, Southeastern Nigeria Using Remote Sensing and GIS
Ejemeyovwi Danny Ochuko Associate Professor, Faculty of The Social Sciences, Department of Geog. & Reg. Planning, Delta Slate University, P.M.B.1,
Abraka, Nigeria
Abstract: GIS and remotely sensed enhanced multi-spectral data of Digital Elevation Model (DEM,), Landsat ETM+ digital Image and aerial photos to generate hydrologic mops for basin morphometric studies. Measurement of properties to evaluate parameters (Indices,) was carried out for Udi-Awgwu Cuesta Regions, South Eastern Nigeria. The analysis was carried out using digitized hydrological maps geo referenced using 4 points (resampled and merged) and the sub mqpof the study area extracted and incorporated into the GIS spatial data base in a GIS environment. The interpreted images are superimposed to create appropriate information platform to generate hydrological maps for analysis, interpretation and classification at sub basins level of water divided concept. The mapping of the drainage networks was followed by fieldwork (ground truthing) for confirmation of field observations during pre and post interpretative phases using the basic interpretative element of colour, lone, shape, pattern, shadow, site and association.. There is observed increased innetwork and basins in the enhanced data (ETM and DEM) than the aerial Photos due to higher resolving power( resolutions). There are major implications of the properties and parameters representedby six factors of reduced ranked variables evaluated with their implications include: basin circularity (RC) values of 0.62- 0.74 approaches one (1) tend to indicate basin pear shape with geological and hydrological tendencies of the uniform infiltration which does not overflow, as it takes long time for excess water to reach the basin outlet. The relief of 750m indicates high gravity water flow, high erosion tendencies, high infiltration arid high run-off conditions while the drainage density (Dd) between 0.85 and 0.95 depicts high permeable subsurface under sparse vegetation cover arid of medium relief subject to high erosion. The low values (0.52-0.62) of the bifurcation ratio (Rb) indicates low structural complexity and high permeability subsurface with attendant subsurface erosion. Cumulative stream length (between 830-1019.6) is indicative of fairly low value that characterized medium relief permeable bedrock and low structural disturbance depicting absence of geologic influence in the area. The various landforms associated with geo- fluvial processes in the upland area area ridges, undulating plateau, rills and gullies with rough to smooth rounded tops while in the lowland area are found sedimentary veneers (weathered, eroded loose earth materials) transported downwards and are responsible for the developments of fluvial deposition features of rolling plains, foot slopes, narrow valleys with main valley floor at the end of erosional plain.
Keywords: Geology, Drainage, Basin Morphometry, Landforms, GIS/Remote Sensing.
I.INTRODUCTION
opographical base maps produced from aerial photos available to Nigeria researchers, are on the scale of
1:50,000 and until new ones with large scales are produced, the need still exists for the maps to be improved upon (using various enhancement procedure and techniques) to make them more useful for geomorphologic and hydrologic investigations. This study further explore the enhancement techniques of aerial photographyand satellite data adopted by Ebisemiju, 1978) and Reddy et al., (2004) anddigital analyses of satellite data was applied by Reddy et al, (2004); Das and Makheijee, (2007) and Koul et al, (2007) among ethers for morphometric studies whose results actually portray true field data.
The aim of this research work is to use satellite remotely sensed multispectral data of digital elevation model (DEM) and Landsat ETM+) and Aerial photos to generate hydrologic maps for measurement of morphometric properties to evaluate parameters (indices) using digital analysis. The specific objectives include to:
• Generate hydrological maps using remotely sensed data i.e. Landsat enhanced thematic mapper (ETM+) and digital elevation model (DEM), data, and aerial photos.
• Generated hydrological maps to digitally map the drainage basins and stream networks to generate morphometric properties.
• evaluate parameters (indices) in the drainage basins to present their implications and
• identify the various landforms in the area and adduced reasons for their formations
II. STUDY AREA
The study area is a part of the Udi-Awgu cuesta in Enugu State, South Eastern Nigeria, The Udi-Awgu Cuesta is located in Udi and Awgu LGAs of Enugu State, Nigeria within the sector of the impressive Nsukka-Okigwe Cuesta running through North-South direction on the cuesta is bounded in the east by the Cross river plan and on the west by the Anambra/Mamu lowlands. The Udi-Awgu section of the cuesta is referenced by latitudes 6° 00ʹN and 6° 20ʹN as well as longitudes 7° 02ʹE and 7°31ʹE with approximate area extent of 4,200 km2. (fig. l - 3)
T
International Journal of Research and Scientific Innovation (IJRSI) | Volume VII, Issue XI, November 2020 | ISSN 2321–2705
www.rsisinternational.org Page 70
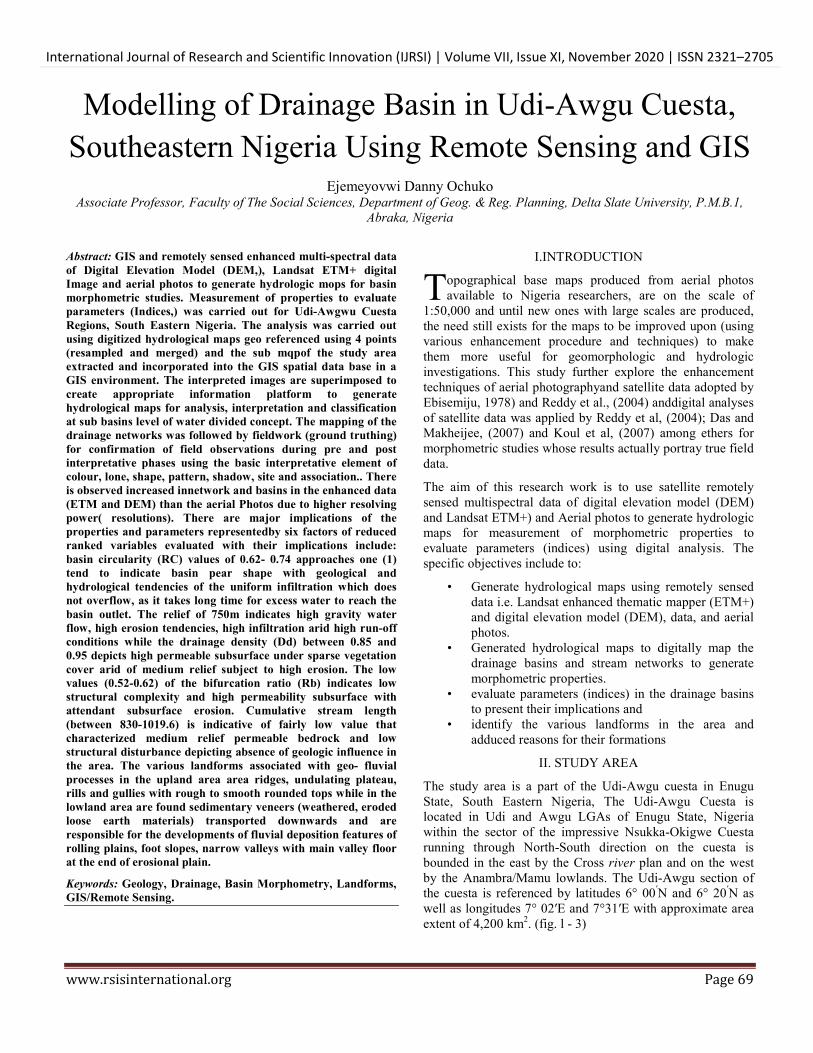
The Enugu and Awgu escarpments form the eastern portion of the Nsukka— Okigwe cuesta are “neither contemporaneous nor continuous but consist of two distinct escarpments which overlap for a distance and separated by five to six kilometers lowland of the Enugu shales. The Local Government Areas of Awgu and Udi is situated on much of the highlands of Awgu, Udi, Nsukka hills and the rolling low lands of the Ebonyi River basin to the east and the Oji-River basin to the west.
Fig 1; Map of Nigeria Showing EnuguState
Source: Kena. Kaduna (2007)
Udi-Agwu area lies in the humid tropical climate and it has fairly uniform annual rainfall and temperature. The climate is defined by high values of evapotranspiration, humidity, temperature and rainfall that characterized region using data obtainedfrom Enugu Meteorological. Station, (2012). Climate variables do considerably influence water resources in the area as rainfall constitutes the major input into the hydrological cycle in the area. The temperatures are
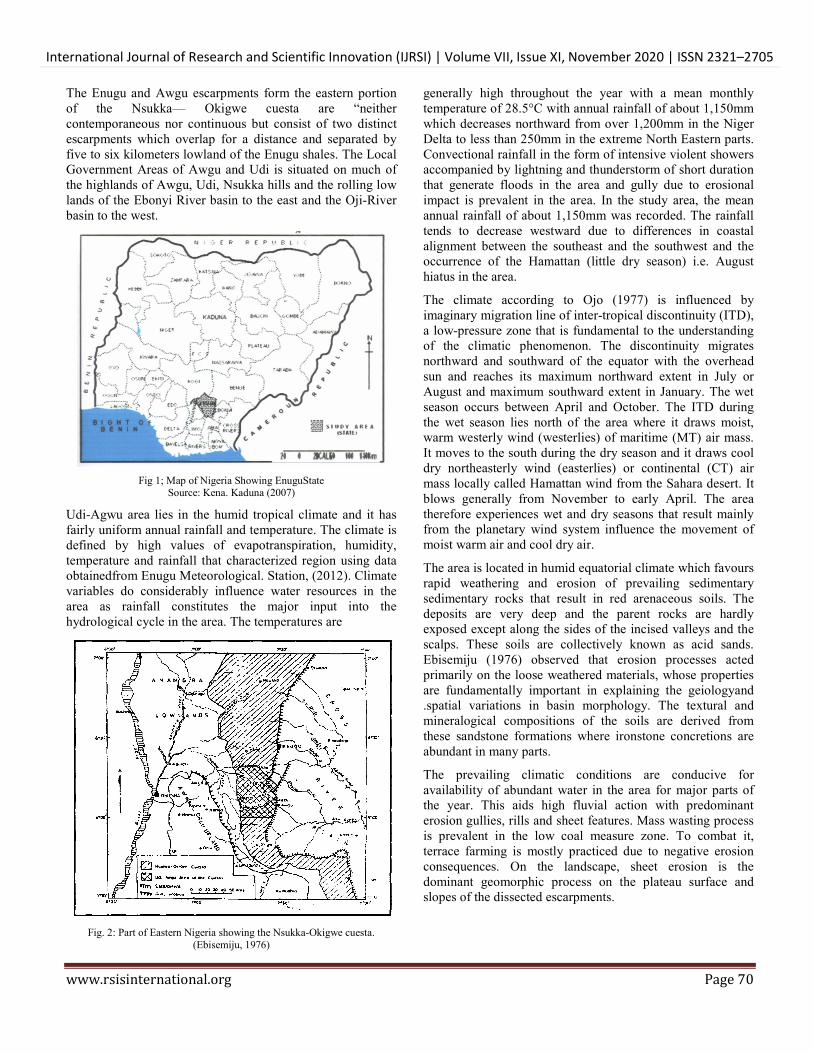
Fig. 2: Part of Eastern Nigeria showing the Nsukka-Okigwe cuesta.
(Ebisemiju, 1976)
generally high throughout the year with a mean monthly temperature of 28.5°C with annual rainfall of about 1,150mm which decreases northward from over 1,200mm in the Niger Delta to less than 250mm in the extreme North Eastern parts. Convectional rainfall in the form of intensive violent showers accompanied by lightning and thunderstorm of short duration that generate floods in the area and gully due to erosional impact is prevalent in the area. In the study area, the mean annual rainfall of about 1,150mm was recorded. The rainfall tends to decrease westward due to differences in coastal alignment between the southeast and the southwest and the occurrence of the Hamattan (little dry season) i.e. August hiatus in the area.
The climate according to Ojo (1977) is influenced by imaginary migration line of inter-tropical discontinuity (ITD), a low-pressure zone that is fundamental to the understanding of the climatic phenomenon. The discontinuity migrates northward and southward of the equator with the overhead sun and reaches its maximum northward extent in July or August and maximum southward extent in January. The wet season occurs between April and October. The ITD during the wet season lies north of the area where it draws moist, warm westerly wind (westerlies) of maritime (MT) air mass. It moves to the south during the dry season and it draws cool dry northeasterly wind (easterlies) or continental (CT) air mass locally called Hamattan wind from the Sahara desert. It blows generally from November to early April. The area therefore experiences wet and dry seasons that result mainly from the planetary wind system influence the movement of moist warm air and cool dry air.
The area is located in humid equatorial climate which favours rapid weathering and erosion of prevailing sedimentary sedimentary rocks that result in red arenaceous soils. The deposits are very deep and the parent rocks are hardly exposed except along the sides of the incised valleys and the scalps. These soils are collectively known as acid sands. Ebisemiju (1976) observed that erosion processes acted primarily on the loose weathered materials, whose properties are fundamentally important in explaining the geiologyand .spatial variations in basin morphology. The textural and mineralogical compositions of the soils are derived from these sandstone formations where ironstone concretions are abundant in many parts.
The prevailing climatic conditions are conducive for availability of abundant water in the area for major parts of the year. This aids high fluvial action with predominant erosion gullies, rills and sheet features. Mass wasting process is prevalent in the low coal measure zone. To combat it, terrace farming is mostly practiced due to negative erosion consequences. On the landscape, sheet erosion is the dominant geomorphic process on the plateau surface and slopes of the dissected escarpments.
International Journal of Research and Scientific Innovation (IJRSI) | Volume VII, Issue XI, November 2020 | ISSN 2321–2705
www.rsisinternational.org Page 71
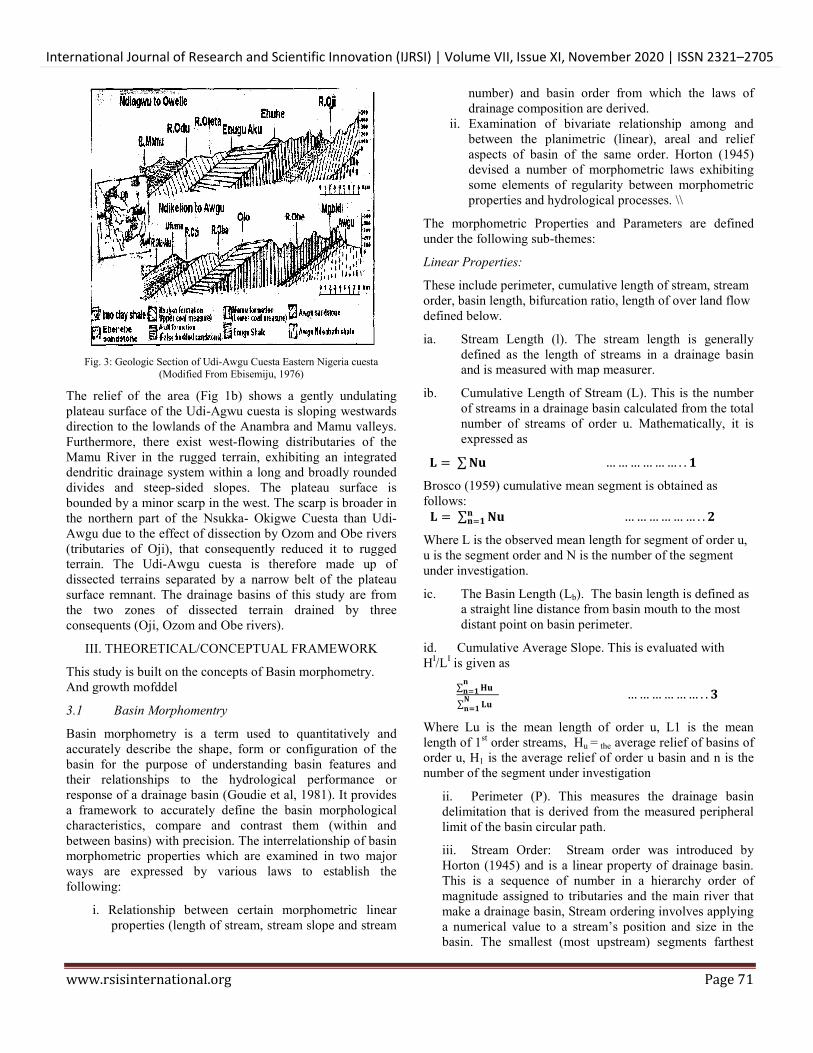
Fig. 3: Geologic Section of Udi-Awgu Cuesta Eastern Nigeria cuesta
(Modified From Ebisemiju, 1976)
The relief of the area (Fig 1b) shows a gently undulating plateau surface of the Udi-Agwu cuesta is sloping westwards direction to the lowlands of the Anambra and Mamu valleys. Furthermore, there exist west-flowing distributaries of the Mamu River in the rugged terrain, exhibiting an integrated dendritic drainage system within a long and broadly rounded divides and steep-sided slopes. The plateau surface is bounded by a minor scarp in the west. The scarp is broader in the northern part of the Nsukka- Okigwe Cuesta than Udi-Awgu due to the effect of dissection by Ozom and Obe rivers (tributaries of Oji), that consequently reduced it to rugged terrain. The Udi-Awgu cuesta is therefore made up of dissected terrains separated by a narrow belt of the plateau surface remnant. The drainage basins of this study are from the two zones of dissected terrain drained by three consequents (Oji, Ozom and Obe rivers).
III. THEORETICAL/CONCEPTUAL FRAMEWORK
This study is built on the concepts of Basin morphometry. And growth mofddel
3.1 Basin Morphomentry
Basin morphometry is a term used to quantitatively and accurately describe the shape, form or configuration of the basin for the purpose of understanding basin features and their relationships to the hydrological performance or response of a drainage basin (Goudie et al, 1981). It provides a framework to accurately define the basin morphological characteristics, compare and contrast them (within and between basins) with precision. The interrelationship of basin morphometric properties which are examined in two major ways are expressed by various laws to establish the following:
i. Relationship between certain morphometric linear properties (length of stream, stream slope and stream
number) and basin order from which the laws of drainage composition are derived.
ii. Examination of bivariate relationship among and between the planimetric (linear), areal and relief aspects of basin of the same order. Horton (1945) devised a number of morphometric laws exhibiting some elements of regularity between morphometric properties and hydrological processes. \\
The morphometric Properties and Parameters are defined under the following sub-themes:
Linear Properties:
These include perimeter, cumulative length of stream, stream order, basin length, bifurcation ratio, length of over land flow defined below.
ia. Stream Length (l). The stream length is generally defined as the length of streams in a drainage basin and is measured with map measurer.
ib. Cumulative Length of Stream (L). This is the number of streams in a drainage basin calculated from the total number of streams of order u. Mathematically, it is expressed as
𝐋 = ∑ 𝐍𝐮 … … … … … … . . 𝟏
Brosco (1959) cumulative mean segment is obtained as follows: 𝐋 = ∑ 𝐍𝐮 𝐧
𝐧 𝟏 … … … … … … . . 𝟐
Where L is the observed mean length for segment of order u, u is the segment order and N is the number of the segment under investigation.
ic. The Basin Length (Lb). The basin length is defined as a straight line distance from basin mouth to the most distant point on basin perimeter.
id. Cumulative Average Slope. This is evaluated with HI/LI is given as
∑ 𝐇𝐮
𝐧 𝐧 𝟏
∑ 𝐋𝐮 𝐍 𝐧 𝟏
… … … … … … . . 𝟑
Where Lu is the mean length of order u, L1 is the mean length of 1st order streams, Hu = the average relief of basins of order u, H1 is the average relief of order u basin and n is the number of the segment under investigation
ii. Perimeter (P). This measures the drainage basin delimitation that is derived from the measured peripheral limit of the basin circular path.
iii. Stream Order: Stream order was introduced by Horton (1945) and is a linear property of drainage basin. This is a sequence of number in a hierarchy order of magnitude assigned to tributaries and the main river that make a drainage basin, Stream ordering involves applying a numerical value to a stream’s position and size in the basin. The smallest (most upstream) segments farthest
International Journal of Research and Scientific Innovation (IJRSI) | Volume VII, Issue XI, November 2020 | ISSN 2321–2705
www.rsisinternational.org Page 72
from the outlet of the basin are numbered as first-order streams. Increasingly, larger downstream segments have larger values of stream order. The stream ordering system makes it possible for streams all over the world to be classified into order categories irrespective of the nature of the underlying rock. Aside Horton’s ordering scheme, we have two systems of order consequent upon emphasis on a quantitative structure rather than rock structure. According to Schumm (1977a&b), these are two main types of ordering applied worldwide namely:
a. Horton (1945) Ordering System: In the scheme, each higher order streams include one segment of each of the lower orders flowing into it. That is a 4th order Horton stream is in fact a composite stream made up of 4th, 3rd, 2nd and 1st order segments.
b. Strahler’s (1964b) Ordering System: He designated each fingertip segment as first (1st) order (order 1) stream and where two first (1st) order streams meet, a second (2nd) order is formed and so on.
Strahler scheme differs from Horton’s in that the higher order streams are not extended upstream and the lower order streams are not renumbered. Strahler ordered as Horton did in the preliminary step thus removing the subjective decisions inherent in the application of the rules for tracing the higher order segments upstreams to their sources.
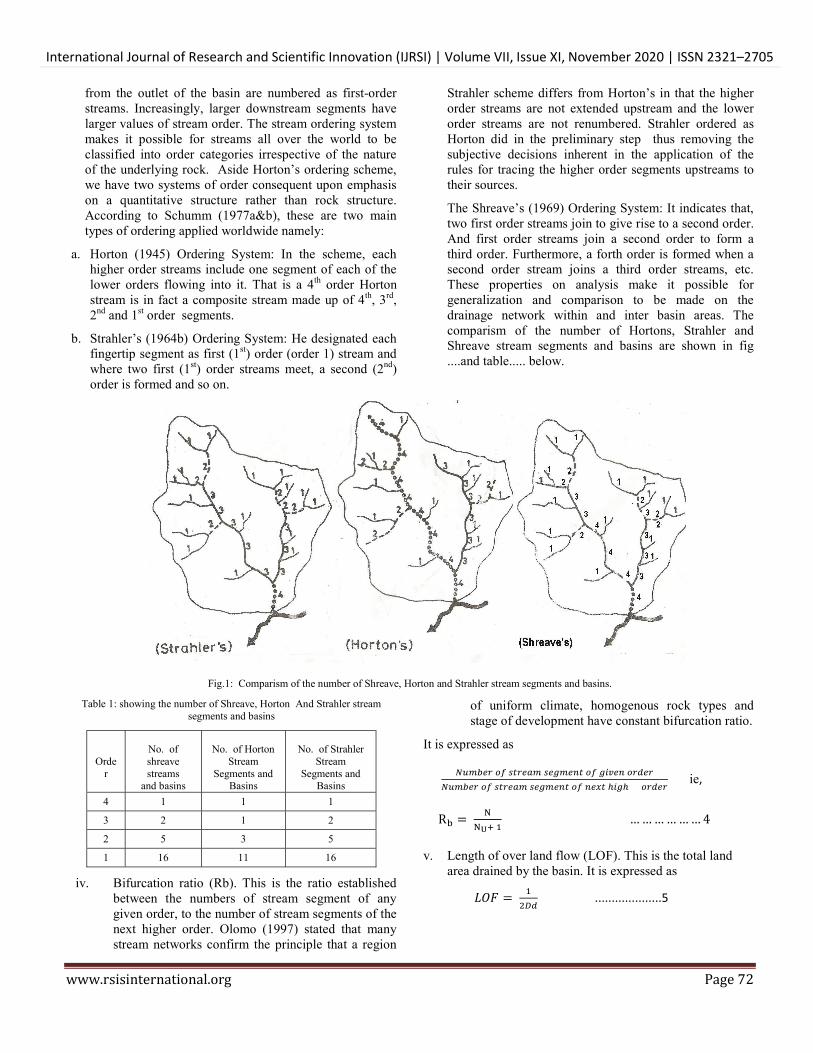
The Shreave’s (1969) Ordering System: It indicates that, two first order streams join to give rise to a second order. And first order streams join a second order to form a third order. Furthermore, a forth order is formed when a second order stream joins a third order streams, etc. These properties on analysis make it possible for generalization and comparison to be made on the drainage network within and inter basin areas. The comparism of the number of Hortons, Strahler and Shreave stream segments and basins are shown in fig ....and table..... below.
Fig.1: Comparism of the number of Shreave, Horton and Strahler stream segments and basins.
Table 1: showing the number of Shreave, Horton And Strahler stream segments and basins
Orde
r
No. of shreave streams
and basins
No. of Horton
Stream Segments and
Basins
No. of Strahler
Stream Segments and
Basins
4 1 1 1
3 2 1 2
2 5 3 5
1 16 11 16
iv. Bifurcation ratio (Rb). This is the ratio established between the numbers of stream segment of any given order, to the number of stream segments of the next higher order. Olomo (1997) stated that many stream networks confirm the principle that a region
of uniform climate, homogenous rock types and stage of development have constant bifurcation ratio.
It is expressed as
ie,
R =
… … … … … … 4
v. Length of over land flow (LOF). This is the total land area drained by the basin. It is expressed as
𝐿𝑂𝐹 = ....................5
International Journal of Research and Scientific Innovation (IJRSI) | Volume VII, Issue XI, November 2020 | ISSN 2321–2705
www.rsisinternational.org Page 73
Where Dd = drainage density.
2. Areal Parameters: These are defined below:
i. Basin Area (A): The area of the basin surface projected into the horizontal plane of map. This is the total area encircling the drainage basin for which a polar planimeter is used for its measurement. It was established by Gravelius (1914) and well established by Horton (1945). It is quantitatively established using Perimeter (P) and Area (A) relationships for circularity of basin as
𝐏 = 𝟐𝛑𝐫 & 𝐀 = 𝛑𝐫𝟐, 𝐫 = 𝐩
𝟐𝛑=
√𝐀
√𝛑 ………… 𝟔𝐚
𝐓𝐡𝐞𝐫𝐞𝐟𝐨𝐫𝐞, 𝐀 = 𝐩𝟐
𝟒𝛑 … … … … … … . 𝟔𝐛
Where p= Perimeter, 𝝅 is pie.
ii. Basin Circularity (Rc): The basin circular ratio (Rc) of a drainage basin is defined as the ratio between the area of the basin and the area of equivalent circle having the same perimeter. The circular ratio by Miller (1923) is expressed as
Basin Area
Basin length
Mathematically, it is expressed as
𝑹𝒄 = 𝟒𝝅𝑨
𝒑𝟐 … … … … … … . 𝟕
iii. Elongation Ratio (Re): This is defined as the diameter of a circle having the same area as the basin. Schumm (1956) defined it as the ratio of the diameter of circle of basin area to the basin length. It is expressed as
𝐑𝐞 = 𝟐
𝐋𝐛 𝐱
𝐀
√𝐀 𝛑⁄ … … … … … … . 𝟖
Where p= Perimeter, A basin area, 𝝅 is pie
The absorption of minor stream by major one drainage a system is simplified the value of Re is in the range of 0.6-1 indicating rotundity and low degree integration for which the value assumed pear shape. High degree of integration is of a natural system whereas low degree of integration is ascribed to abnormality related to deferent characteristics and variation of rainfall (Wooldridge and Morgan, 1958; Strahler 1965).
iv. Form Factor (Rf): The shape extent or dimension of the basin is another parameter that is quantitatively measured as established by Gravelius (1914) and Horton (1945). The basin shape is quantitatively defined as the ratio between the area of the basin and the square of total length of the basin. It is expressed as
Basin Area
(Basin length)2
Mathematically, it is expressed as
𝐑𝐟 = 𝐀
(𝐋𝐛)𝟐 … … … … … … . 𝟗
Drainage Density (Dd): This is defined as the ratio of the total length of streams in a given drainage basin to the total land area in square kilometre.
It is expressed as
D = L
A …………….10
L = total length of stream, A = total area of basin.
vi. Stream Frequency (Fu): This is defined as the degree of occurrence of a stream segment on a unit area of basin space. The stream frequency based on work of Horton (1945) and is expressed as ratio as follows.
Number of all stream segments
Basin Area
𝐢. 𝐞. 𝐅𝐮 = 𝐍
𝐀 … … … … … … . 𝟏𝟏
The lower the frequency, the more dissected is the basin related to natural effect.
vii. Index of Drainage Density Or Drainage Intensity (ID): This is a characteristic of intensity of dissection. Faniran (1969) established it as drainage area intensity with reference to texture effect of drainage density and stream frequency. It is expressed as
𝑰𝒅 = 𝑫𝒅 𝒙 𝑭𝒔. … … … … … … . 𝟏𝟐
3. Relief Parameters: These include
i. Basin Relief: This tends to show height difference between maximum height and the minimum height in a given basin or sub-basin and expressed in meters. It plays an important role in drainage development, surface and sub-surface water flow, landforms development and erosion properties of the basin. Reddy et al (2004) expressed it as
𝑩𝒉 = 𝑩𝒉𝒎𝒂𝒙 − 𝑩𝒉𝒎𝒊𝒏 … … … … … … . 𝟏𝟑
The highest point in a basin does not always coincide with the point farthest from the basin mouth and Ebisemiju (1975) calculation is along basin length i.e. the elevation difference between the basin mouth and the point farthest from it. The relief ratio used is ‘sensu stricto’ of the slope of basin length, i.e. ratio of basin length to the horizontal distance whose elevations were estimated from topographical maps. The term relief ratio was first proposed by Schumm (1956) and is defined as “the ratio between the total relief of a basin (elevation difference of lowest and highest points of a basin) and the longest dimension of the basin parallel to the principle drainage lines. Melton (1957) replaced this length
International Journal of Research and Scientific Innovation (IJRSI) | Volume VII, Issue XI, November 2020 | ISSN 2321–2705
www.rsisinternational.org Page 74
with the basin perimeter because of the subjectiveness (subjective element) that goes into drawing a line parallel. Strahler (1964) while agreeing with the use of the perimeter as a horizontal length dimension, does away with difficulties of creating a suitable axial line in the basin”. He however contends that, there is shortcoming in that “minor crenulations of the perimeter may greatly increase its length without representing any actual change on characteristic areal dimensions of the basins. There are shortcomings on Ongley’s (1968) basin vertorial axis (Abrahams, 1970) and Maxwell (1960) definition of basin diameter, which according to him is “very cumbersome”.
ii. Ruggedness Number (Rn): This indicates structural complexity of the terrain. It is calculated as the product of basin relief and the drainage density.
That is 𝑹𝒏 = 𝑩𝒉 𝒙 𝑫𝒅. … … … … … … . 𝟏𝟒
Basin Morphometric Laws:
The universality of these laws is essentially in monolithologic regions free of strong structural controls and experiencing uniform geologic processes has been confirmed by several empirical studies of a natural drainage system (Morisawa, 1962; Gregory, 1966), and through statistical analysis of computer and laboratory simulated stream networks (Schenck, 1963; Shreave, 1966). The degree of interdependence among and between the areal and relief aspects of drainage basins provides some insight into the dynamics of drainage basin evolution for which two models above evolved..These include Schumm (1956 law of basin lengths, law of basin areas, law of contributing areas and Maxuel (1950) law of basin relief. Studies of drainage stream related properties and parameters of most rivers in the world produce a straight-line graph of either positive or negative relationship, ‘with exceptions resulting from local factors altering the relationship’ (Waugh, 1995).Others include Laws of Drainage Composition that include law of stream numbers and law of stream lengths of relevance to this study.
Law of stream numbers: The law states that “the number of streams of different orders in a given drainage basin tends clearly to approximate an inverse geometric series in which the first older stream is unity and the ratio is bifurcation ratio”
Law of Stream Lengths: The law states that the average lengths of streams of each of the different orders in a drainage basin tend to closely approximate direct geometric series in which the first term is the average length of streams of first order and the ratio is the stream length-ratio.
Laws of Drainage Composition
These laws consist of the law of stream numbers, law of stream lengths and law of stream slopes.
Law of stream numbers:
The law states that “the number of streams of different orders in a given drainage basin tends clearly to approximate an inverse geometric series in which the first order stream is unity and the ratio is bifurcation ratio”.
Mathematically, it is expressed as
Where N = number of stream segment of order u, k is the order of trunk segment, u is the order of the segment under investigation and Rb is the bifurcation ratio which is expressed as
When number of stream segment of each order is plotted against stream order on a semi-log paper, a linear relationship of a resultant best-fit line is a straight line. The antilog of the coefficient of the regression line fitted by the method of least squares is the average bifurcation ratio for that basin.
The law of stream numbers has been found to apply well to natural and .simulated drainage networks. A marked up-concavity lower-end of the regression line is however generally noted suggesting that the geometric progression may not be closely observed in the higher orders (Schumn, 1956: Maxwell, 1960; Ebisemiju, 1978).
Law of Stream Lengths
The law states that the average lengths of streams of each of the different orders in a drainage basin tend to closely approximate direct geometric series in which the first term is the average length of streams of first order and the ratio is the stream length ratio. Mathematically, Lu is the mean length of order u is expressed as
Where, Li is the mean length of l order streams, u is the order of the segment under investigation and RL is the stream length ratio expressed as
When the logarithm of the mean length of streams of each order is plotted against stream order, a linear relationship is usually obtained with some scattered points about the regression line. The antilog of the coefficient is the average stream length ratio for that basin which has been found to vary from 1.5 to 3.0. Significant scatter of the points about the regression line has been attributed to variation in lithology and structure within a basin (Morisawa, 1962.).

International Journal of Research and Scientific Innovation (IJRSI) | Volume VII, Issue XI, November 2020 | ISSN 2321–2705
www.rsisinternational.org Page 75
The Law of Stream Slopes
According to Horton (1945) there is a fairly definite relationship between slope of the streams and stream order which can be represented by an inverse geometric series. The average slope is represented as
Where Su is the average slope of stream of order u, Si is the average shape of first order stream, Rs is a constant slope ratio, K is the order of the highest order stream and u is the order of the segments under consideration. When the logarithm of the mean stream slope is plotted against stream order, a linear relationship is obtained and the antilog of the co-efficient is mean stream slope ratio for the basin. This law tends to be valid if strahler’s.segment data are used (Broscoe, 1959; Morisawa, 1962).
Law of Basin Areas:
It states “the mean drainage basin areas of successive stream order tend to approximate closely a direct geometric series beginning with mean area of first order basin and increases according to a constant ratio” (Schumm, 1956). This law has been found to apply not only to natural basin but also to basins of ephemeral streams. Mathematically, it is expressed as
Where Au is the mean area of basins of order u, Li is the mean area of 1storder, Ra is the area ratio, and u is the order of the segment under consideration. The mean area ratio is expressed as
The Law of Basin Length:
It states ‘the mean of basins length of different orders tend closely to approximate a direct geometric series in which the first term is the mean length of basin of first order and the ratio is basin len9th ratio”. The mean basin length is mathematically expressed as
Where L is mean length of basin of order u, Lbl is the mean length of order basin and RLbis the basin length ratio and u is the order of basin under investigation. The mean length ratio is expressed as
The Law of Contributing Areas.
This law states that ‘the relationship between mean drainage basin areas of each order of any drainage network is a linear function whose slope (regression coefficient) is equivalent to the area in square feet necessary on the average maintenance of one foot of drainage channel which is the constant of channel maintenance according to Schumm (1956).
This law has been modified by Strahler (1957) and stated by Chortey (1957) as follows:
‘The relationship between drainage basin areas of each order and the total stream lengths contained within and supported by these areas is a direct logarithmic function, the regression coefficient of which is unity, and the value of the area when the total stream lengths is unity equals Schumm’s constant of channel maintenance’.
In other words
Where A = drainage basin area, L = mean stream length and C = intercept.
The Law of Basin Relief:
The law of basin relief according to Maxuel (1950), states ‘that the mean relief of basins of each order in a watershed, tend closely to follow a direct geometric series in which the ratio is the watershed relief ratio’. That is
Where H = the average relief of basins of order u, H1 is the average relief of order u basin, RR is the basin relief ratio and u is the order of basin under investigation. The relief ratio (RR) is the average slope within length while H is the ratio of the average relief of basin of order u to that of the next higher order That is
The lithological heterogeneity can however bring about some departure from a straight line.
3.2 (i). Cyclic or cellular growth model.
The cyclic model is basically deterministic and is used on the idea of branching processes (Scheidegger, 1966) and is based on the assumptions of allometry. The law of allometric growth was first formulated in biology by Huxley (1924). Allometric growth model explains that the rate of growth of a
International Journal of Research and Scientific Innovation (IJRSI) | Volume VII, Issue XI, November 2020 | ISSN 2321–2705
www.rsisinternational.org Page 76
system is proportional to the size of the system. In which case, the size of the variable at each order or stage is always a constant proportion of the size at the previous stage. The growth manifests itself in the variables of a system growing geometrically with order as is the case with morphometric properties of drainage systems (Ebisemiju, 1978). However, the system grows through the formation of self-similar networks and each cycle is geometrically similar to the previous ones. Strahler (1958) used the method of dimensional analysis and the principle of geometrical similarity of drainage basins. He demonstrated that in landscape undergoing similar geologic processes, geometrical similarity is generally preserved in basins of increasing order. Thus, the laws of drainage networks are governed by the law of allometric growth.
3.2(ii) Random configuration model.
The random configuration model explains that drainage networks are not evolving in such a deterministic manner rather; it is generated by a random walk. Thus, in a basin there is the merging of first order streams already in the system at the beginning of the time period under consideration such that the resulting topology of the network is completely random and the observed hierarchies are as a result of a link-generating process. The empirical laws of drainage composition and the power-function relations between the variables in a fluvial system are a consequence of the topological and geometrical randomness of natural drainage networks (Smart, 1974). This idea of the random graph theory was first put forward by Leopold and Langbein (1962), subsequently developed by Schenck (1963) and Shreave (1966).
Some quantitative geomorphologists in recent times tend to verify and improves on this random model of simulating channel networks and the concept of topological randomness of stream networks, which Shraeve (1966) proposed is used to theoretically derive several empirical laws of drainage composition. Both approaches are based on a common underlying concept as follows: That, local environment is much more important than chance in determining the properties of real stream networks and the randomly generated stream networks have statistical properties similar to those of natural stream nets. Shreave (1966) and Mosley and Pecker (1973) suggested that, in the absence of structural and lithological heterogeneities within a basin, the topology of stream nets is governed primarily by chance and secondly or perhaps not at all by local environmental factors”. Even then, as Hagget and Chorley (1969) pointed out that:“It must be recognized that, the randomly-generated networks… do not stimulate the actual geomorphic processes involved in the evolution of natural networks, which usually take place simultaneously over an exposed area, ”in support of configuration theory, Scheidegger (1970) argued that, if the allometric growth were correct and “complete geometrical similarity” are maintained between basins of different orders, the bifurcation and length ratios for a given basin should be
equal, and the exponent of the equation relating basin area to main stream length should be 0.5. That is:
Rb=RL ……………27
and Lm = bA0.5 ……….…28
These are not so regarded as proof of the ‘inadequacy of the cycle theory’. Now, equality of Rb and RL is possible if and only if the total lengths of streams of each order are equal. This is not possible in real-life situations and does not necessarily invalidate allometry, since the proponents of this theory did not assert the ‘complete geometrical similarity” to actually exist between basins of different orders. Horton talked of stream numbers as tending “closely to approximate an inverse geometric series”, whereas Strahler (1968) clearly stated that “perfect geometrical similarity is not to be expected in a drainage basin” Moreover, two of the advocates of the random graph theory, Smart (1957) and Surkans (1967) attributed the deviation of the exponent in the area – length equation from 0.5 to the influence of stream sinuosity: ‘The variation in mainstream sinuosity with area, can be responsible for a significant part of the deviation of n from ½”. It is also significant to note that when basin length was related to basin area for 172 1st, 2nd, 3rd and 4th order basins in the study area, the exponent was 0.505:
Lb = 1.612A0.505 …………29
However, mainstream length was substituted for basin length. The exponent was 0.604:
2Lm = 1.549A0.604 ………..30
This is in agreement with the results of other workers (e.g. Hack, 1957) thus confirming Smarts and Surkans, (1967) observation on the effect of stream sinuosity on the exponent.
Although the cyclic theory does not allow for the growth of “adventitious streams” which Ranalli and Scheidegger (1968) have shown to form a characteristic feature of channel networks, it has been rightly pointed out by Faulkner (1974) of “the advantage of being on a physical law such that deviating points from the regression lines (geometrical abnormalities) can be given non-random significance within the model”. Perhaps it is more appropriate to think of drainage network evolution as being governed by Gibrat’s law of proportionate effect (Woldenberg and Berry, 1967). In other words, growth of drainage network is simply the probabilistic rather than the deterministic version of allometry: Thus, they observed that:’Growth probabilities of entities within the system are a random proportion of the previous value of the entity … Hence, the probability of a given percentage increases in size, is constant for an entity in the system’’.
3.3 Literature Review
The literature review is based on works the various laws on basin morphometriy,, methodologies of data collection and brief discussion on some related applications using remote
International Journal of Research and Scientific Innovation (IJRSI) | Volume VII, Issue XI, November 2020 | ISSN 2321–2705
www.rsisinternational.org Page 77
sensing and basin morphometric properties / parameters (indices). The various sources of data for morphometric studies include topographical maps, aerial photographs, satellite data and field data. These data are not independent of one another as maps are derived from aerial photos and field survey. The reviewed works are presented as follow:
Winoh (1976) worked on the most comprehensive reference sources of topographical map coverage in the world and revealed that, 1:25,000 large scale maps exist for most parts of Europe, Japan, New Zealand, some part of North African and South American countries, are adequate for analysis in morphometry. However, on the related progress made so far together with identified problems, limitations and precautions to be noted in its application as well as proffered solution on map accuracy and detailed survey in drainage network representation concerning maps generally as data source by workers worldwide include: workers Schnieder (1961); Schick (1964); Leopold (1964); Gregory (1966); Morisawa (1967); Werrity (1972); Eyles (1973); Gardiner (1975); Jarvis (1976); Ebisemiju (1976); Richards (1978); Stagg (1978);
Maps at a large scale suitable for basin morphometry do not exist for most African countries with scales 1:50,000 and above are suitable. The maps production were sponsored by colonial masters (either institute geographique national du Paris or the directorate of overseas survey, Britain). In this case, it is necessary to resort to the use of available medium scale maps or aerial photographs in most African countries. Hilton (1999) in his work on Practical Geography in Africa for which he reviewed maps produced in these countries, observed that most of them are not well mapped and the published topographical map series are of different scales suitable for various purposes of planning and administration.
On Nigeria maps, he concluded on the mapping status is that of less well mapped than Ghana, though larger in size with greater human, material and natural resources. According to him, there exist various scales of mapping in Nigeria namely 1:500,000; 1:65,000 and 1:25,000). The small map scales in which the country is covered are in fifteen sheets that were published between 1950 and 1952 respectively. However, the Nigeria surveys produced maps series of 1:50,000 coverage in the 1960s, for which most of the sheets have not been reviewed and updated to this day. Ebisemiju (1976) and Coates, (1958) therefore called for extreme caution in the use of these maps for morphological and morphometric studies while similar conclusions were drawn by Eyles (1966) with respect to Malaysian 1:63,000 topographical maps. Ebisemiju (1976) noted that, true drainage networks reflect the ground data in his work in Udi-Awgu area using aerial photos of 1: 40,000 with the scale corrected for errors of earth curvatures and atmospheric attenuation reflecting observation of Misra and Ramesh, 1984. With correct interpretation using specialized stereoscope or digitized data was for further analyses and on network, aerial photos could adequately enhanced and represented ground details (Misra and Ramesh, 1984).
On the other hand, high resolution spatial satellite data of infrared wavelengths radiation corrected and analyzed with specialized software (Arcview, Erdas, Idrisi, Span 70, etc,) were applied in morphometric studies for analysis, classification and presentation of hydrologic and geomorphic properties and parameters by Das and Mukhejee, (2005 ); Reddy et al, (2004); Mesa, (2006); Koul et al, (2007) and Maria et al (2007).
Satellite images are available at small scale of 1:250,000 and above it. The spatial resolutions are adequate for geomorphic studies and are useful in basin morphometric studies. Maria et al (2007) used landsat enhanced thematic mapper (ETM+) data for production of hydrological map for basin morphometry. Thus, large scale phenomena such as extent of major flood inundation and drainage network could be mapped and analyzed from images with increased ground resolution especially with Landsat-TM (30m), Landsat-ETM+ (1 Sin), SPOTHRV (high resolution visible (32m) and HRV lR (high resolution visible infrared) l0m, Ikonos image (3.2m) panchromatic (0.8m), Quick bird (2.4m) panchromatic (0.6ni) and Worldview (the world highest resolution satellite) 0.5m resolutions respectively using various wavebands. They provide large to small scale images corrected for preprocess and enhancement corrections for earth curvatures and atmospheric attenuation at ground receiving stations.
Chisman (1977) on Landsat satellite image stated that, it could be invaluable for mapping inhospitable terrain like the impenetrable Himalayas. These sensors respond to infrared radiations bands outside the visible range of electromagnetic radiation (EMR) and provide for geomorphological and hydrological applications in various terrain analysis of drainage network channels. According to SPOT Director Jean-Marc (2003) on success of landsat and SPOT image space data process, he ascribed the main reason as in serving the global application request at a 1 Sin resolution image and for cost effectiveness.
GIS spatial data of hydrologic and geomorphic relevance derived from topographical maps as well as data from high resolution satellite image, constitute input data in a GIS operational environment. GIS techniques are now rapidly growing in importance and sophistication (Wedo, 2000). The GIS techniques for researches use Landsat TM or ETM+ digital satellite data together with topographical map of 1:50,000 scale which are subjected to accurate Digital Elevation Model (DEM) using appropriate software package. According to Reddy et at, (2004); Das ancd Mukherjee, (2005); Mesa, (2006); Koul et al, (2007) and Maria et al, (2007), the presentation of the hydrologic mapdata, statistical data analyst are carried out using this methodology. Drainage basin development depends on the subsurface geology, rainfall, exogenic and endogenic geomorphic forces in the area. The drainage pattern of the basin ranges from sub dendritic pattern at higher elevations, parallel to sub parallel and radial in the lower elevations. Based on the drainage orders, river basins are classified using 3 order basins (for its

International Journal of Research and Scientific Innovation (IJRSI) | Volume VII, Issue XI, November 2020 | ISSN 2321–2705
www.rsisinternational.org Page 78
maturity) in analysis of linear, relief and areal morphometric parameters according to Strahler, 1964.
The digital morphometric analyses procedures have made GIS a highly effective tool to understand and manage the natural resources (Srinivasan, 1988). The digital satellite research works of Maria et al, (2007) and Reddy et at, (2004) created appropriate information platform upon which to systematically proceed toward determining the morphometric parameters using hydrological maps of satellite based images.
Digital Elevation Model (DEM), remotely sensed data is usually combined with other thematic data including DEM derivatives (slope, depressions, drainage) or other format such as aerial photos Landsat ETM+, topo map data etc. (Meijerink et al, 2007). This is used fo r better enhancement presentation (pictorially) for clearer image articulation of the terrain attributes. The summarized applcaition major works carried out on morphometrtic analyses usingal maps topographical maps, aerial photos. ETM/DEM is shown in table 1.
Table 2: Show some conclusions drawn concerning maps as a data source
Source
Map
Area
Conclusion
Schneider (1961) 1:24,000 USA Concluded that contour crenulation is inadequate portrayal of stream channels.
Schick (1964) 1:20,000 Isreal Drainage network analysis on blue lines depicts about 10% less than on scale 1:2,500
Leopold (1964) 1:31680 USA First-order streams on topo-map were in reality fifth–order streams.
Gregory (1966) 1:25,000 SW England Functioning net, greater than blue line net. Crenulation net includes paleohydrological element.
Morisawa (1967) 1:24,000 USA Concluded that blue lines representing river network on topo-map under represented true total stream
length and drainage density of same network on ground
Werrity (1972) 1:25,000 SW England Exterior link lengths reliably shown by 1:25000 but not 1:25,000
Eyles (1973) 1:25,000 New Zealand Drainage network analysis on blue lines depicted only 80% of the true drainage network.
Gardiner (1975) 1:25,000 1:10,560
NEandSW England.
S Scotland
1:25,000 2ND series or 1:10 560 regular Edition best 1:25,000 provisional edition has less blue line net and may differ nationally.
Jarvis (1976)
1:25,000 SW England.
Scotland 2nd series best available at this scale: comparable in two areas.
Ebisemiju (1976) 1:50,000 Nigeria Drainage network analysis based on blue lines gives wrong picture of true drainage network. The mean
field exterior link length is as less as depicted.
Richards (1978) 1:25,000 SW England On provisional edition, mean field exterior link lengths less. But mean numbers more than on crenulation
or blue line nets.
Stagg (1978) Ejemeyovwi,(2914)
1: 25,000 1:50,00
Wa les Nigera
Drainage Density of networks from air photographs 5.34 times that of provisional edition map. Drainage network analyses ground portral based on blue line (with i8% less details) and aerial
photograph gives wrong picture of the true drainage network while ETM/ DEM depicted the true drainage network.
IV. RESEARCH METHOD
Remotely sensed multispectral satellite digital data used and aerial photos constitute the primary data to generate hydrologic maps to determine of morphometric properties in evaluating parameters (indices). The image analysis was carried out using digital analysis method to produce hydrological maps.
4.1 Mapping and Mapping Procedure
The maps generated in a GIS environment are input data for ArcGIS and ArchydroWizardsoftwares analyses of morphometric data generated, interpreted and classified based on sub basins water divide concept of the features delineated and allocated into known categories (basins) on the base map. The maps were geo-referenced using coordinates of 4 points, resampled, and merged and the sub-map of the study area extracted, and incorporated into the spatial data base. The images imputed in the system were geo-referenced. The mapping of the drainage networks was followed by ground
trothing. This is ground-based confirmation by field observations undertaken during the pre and post interpretative phases using interpretative elements (colour, tone, shape, pattern, shadow, site and association). This is to define the drainage networks, delineate and classify the various catchment areas at sub- basins level. The digital elevation model (DEM) analysis of the study area were carried out in a continuous raster and vector formats to generate height and slope maps inwhich the data values represent the elevations for which the entire area drainage network are shown.
The analyzed hydrological maps were obtained from various data sources at sub basin level. Each of the streams segment were analyzed using the software packages for data generated holistic result. The morphometric properties generated were used to evaluate the parameters. These morphometric analysis procedures have made GIS a highly effective tool to understand and manage the natural resources (Srinivasan, 1988). The digital satellite research works of Maria et al,
International Journal of Research and Scientific Innovation (IJRSI) | Volume VII, Issue XI, November 2020 | ISSN 2321–2705
www.rsisinternational.org Page 79
(2007) and Reddy et al, (2004) created appropriate information platform upon which to systematically proceed toward determining the morphometric parameters using hydrological maps parameters. There is further enhancement procedure of satellite data combined or draped for upgrade with data of aerial photos and DEM. The topographic drainage divide of each of the prevailing third order basin, were examined on the topographical map and aerial photos mapped sheets were easily examined with the DEM profile. Together with ancillary or archival data, the mapping was finally carried out in line with the works of Maria et al (2007) and Reddy (2004) on watersheds in western Crete, Greece and on a basaltic terrain, central India analysed using IDRISI software spatial analysis system package.
On the drainage order, the drainage channels were classified into different order using Strahler(1957;1964a&b). In a GIS environment, the drainage channel segments were ordered numerically as order number one from the stream’s headwaters to a point downstream to nth order and the other parameter analyses procedure were followed. The linear, areal and relief aspects of the basin were generated from the hydrological maps and the parameters of each sub basin and the channel networks analyzed. The morphometric properties and parameters generated or evaluated using the data are shown in Table la. The properties include: cumulative length of stream, stream lengths, number of streams, stream order, bifurcation ratio, basin length, basin shape, basin perimeter, lengths of over land flow, length ratio and area ratio. These were used for evaluation of parameters (with established equations) summarized in Table lb.
Table la: Morphonietric Properties
Definition/Expression
1. Cumulative length of stream: Summed Total length of streams of all order.
2. Perimeter (P): Total length of streams of order u. L=âNu Measured basin peripheral limit.
3. Number of streams (N): Calculated from the total number of streams of order u.
4. Basin Area(A): This areas of the basin surface projected into the horizontal plane of map
5. Stream order: Sequence of number in a hierarchy order of magnitude assigned to tributaries and the main river
6. Basin length (LB): The length of the straight line from the south of the basin to the most distant basin perimeter point
7. Basin shape (BS): The planimetric shape is the circle or pear-shape standard figure of
8. Bifurcation: This is ratio of no of stream segment of order u to the ratio of next stream segment.
Table 1b: Morphometric Parameters and their Mathematical Expressions
Catchment characteristics Formulae
1. Basin Circularity (Shape) (Rc)= 4irA/P2 2. Form Factor, (Rf)= A/(Lb)2 3. Basin Elongation, (Re) (2/Lb)XA/31A/πV 4. Texture ratio (T) = N(1/p) 5. Ruggedness no (Rn) = Bh x Dd 6. Drainage Density (Dd), (Dd) = L/A 7. Stream Frequency, (Fu) = N/A 8. Index of Drainage Density (Id) = Dd x Fs 9. Basin Relief (Bh) = Bhmax- Bhmin 10. Length of Overland Flow (Lof) = I/2Dd 11. Constant of Channel Maintenance (C) =Km2/km 12. BiFurcation ratio (Rb) = NUINuH
V. DATA ANALYSIS
Derived Data (Properties) and Evaluation of Morphometric Parameters
The 3rdorder basins are prominent in Udi-Awgucuesta are largeenough to attain stateofequilibrium and stability. They aregeomorphological and morphological significance and small enough to evaluate data at sub-basin level to enable comparison with previous studies as observed by Ebisemiju (1976). The linear, areal and relief properties together with the parameters of each basin were determined from the hydrologic maps. This observed details of aerial photographs did not portray actual ground details as the enhanced satellite dataof DEM /Landsat ETM+.
The data analysis using Arc GIS and Arc Hydro Wizard for this study, is based on generated hydrologic maps from different primary data sources, derived at sub-basin levels. The data include hydrologic properties (table 2a) determined directly and the indices (parameters) are mathematically derived. The in Arc GIS and Arc Hydro Wizard inferences drawn from the analyzed data are valid, as the variables were carefully determined based on software packages.
Table 2a: showing the linear properties. Areal and Relief parameters measured or determined for the basin
S/N PROPERTIES AERIAL PHOTOS
LANDSAT ETM/DEM
1. Cum length of stream
(KM) L = 1019.6 1146
2. Stream-length (L) (Km)
within A-C basins 956.5 1145.7
3. Stream number N = 925 N = 1048
4. Stream order (U) U1’615, U2’167,
U3’32, U4’1
U1’679, U2’204, U3’44,
U4’1
5. Bifurcation Ratio 4.35 3.99
6. Basin length Lb Lb = 114 Lb = 123
7. Basin Perimeter (Km) A-C =
2300.50 A-C = 2,058.60
8. Length of overland flow 0.18 0.07
9. Basin Area (Km2) A-C =
7161.04 A-C = 9120
10. Basin height (m) Mjn 300 Mjn-9.1 Max
492
International Journal of Research and Scientific Innovation (IJRSI) | Volume VII, Issue XI, November 2020 | ISSN 2321–2705
www.rsisinternational.org Page 80
Table 2b: Morphometric indices for plots on basin morphometric laws
S/N PROPERTIES AERIAL PHOTOS
LANDSAT ETM/DEM
11. Basin circularity (Re) =
4πA/P2 0.62 0.59
12. Form factor (Rf) = A/(Lb)2 0.80 0.88
13. Basin elongation (re) =
(2/Lb) XA/yA 1.00 3.05
14. Cum stream Length (L) 1019.60 146.7
15. Drainage Density (Dd) =
L/A 1.40 1.30
16. Stream Frequency (Fu) =
N/A 1.30 1.10
17. Index of Drainage Density
(id) = Dd x Fs 1.82 1.40
18. Constant of Channel
maintenance (c) = Km2/km
1160 (topomap contour Estimate
4010m (DEM
estimate)
19. Ruggedness no (Rn) = Bh
nod 3.68 3.33
20. Bifurcation ratio (Rb) 3.26 4.24
VI. RESULTS
This research is predicated on the analyses of Landsat-ETM+, Aerial photos and DEM data analyzed digitally to produced hydrological maps. The modeled basins using raster and vector formats, identified three basins (A, B & C) with Aerial photographic method but identified four basins with larger surface area extent for basin A using ETM/DEM due to better clarity capability of high resolution of details of the terrain.
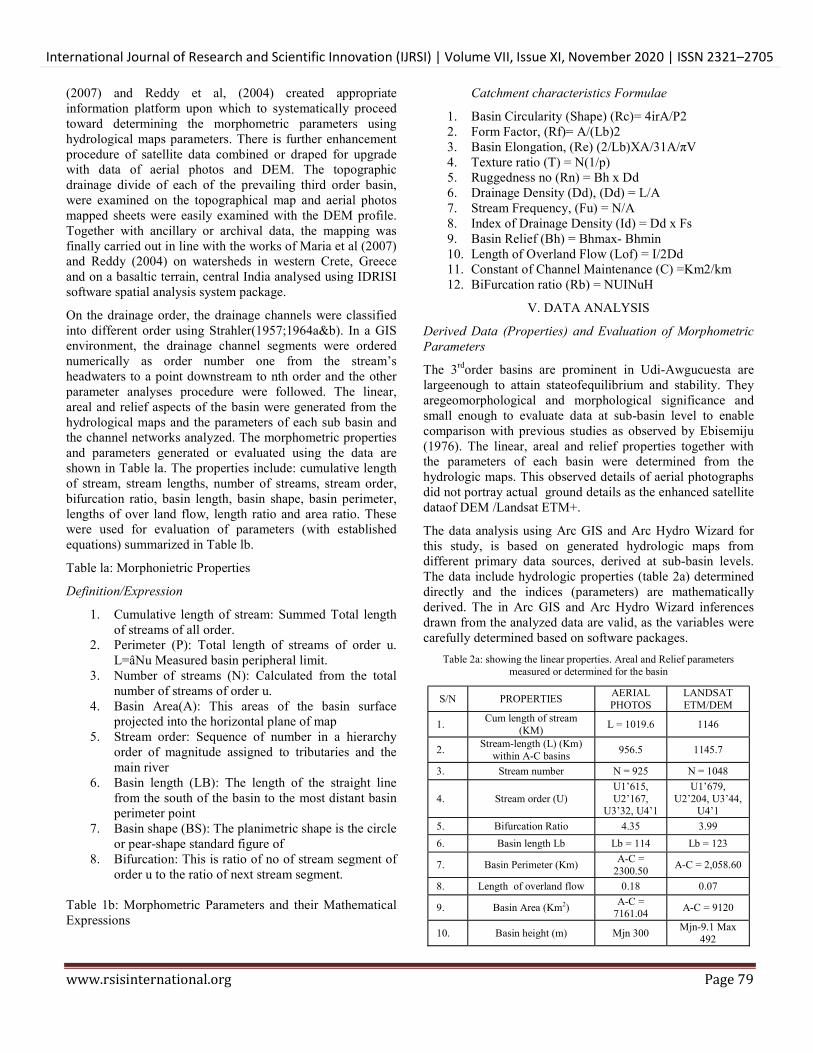
The hydrological mapsbelow show a grid representation of the stream channels within the cuesta and the vector segmentation (stream channels) from grid cells in Fig.4. This was achieved by defining the number of flow accumulation into the cells carried out before the actual stream channel was generated for realism and network details of hydrological parameters and landform portrayal.
Essentially, questions were answered on how much area is required to generate sufficient runoff (energy) to incise the underlying bedrock to create and maintain a stream channel. Also important is how many grid cells our various drainage networks are based on. This involves using different grids change in stream network delineation and drainage density. Thus, in Figure 4 stream networks were created, one with threshold value of 500 and the other with threshold value of 1000. The number of river threshold refers to the number of cells to start a river within a sub watershed. The DEM developed from Aster, Linder radar data (30m resolution) is an input data used to determine the flow accumulation network, drainage segmentation, stream segmentation (stream order) and ultimately the watershed delineation.
The derived morphometric data of Udi-Awgu closely follow the trend obtained in similar terrain conditions in the literature reviewed. Thus, satellite remotely sensed data can effectively be used in land resource, evaluation, of stream segment and features to understanding the spatial distribution
and landform characteristics, the status of erosion for judicious planning and management of river basin.
Fig. 4: Vector model showing flow accumulation pattern
6.1 Hydrological Maps
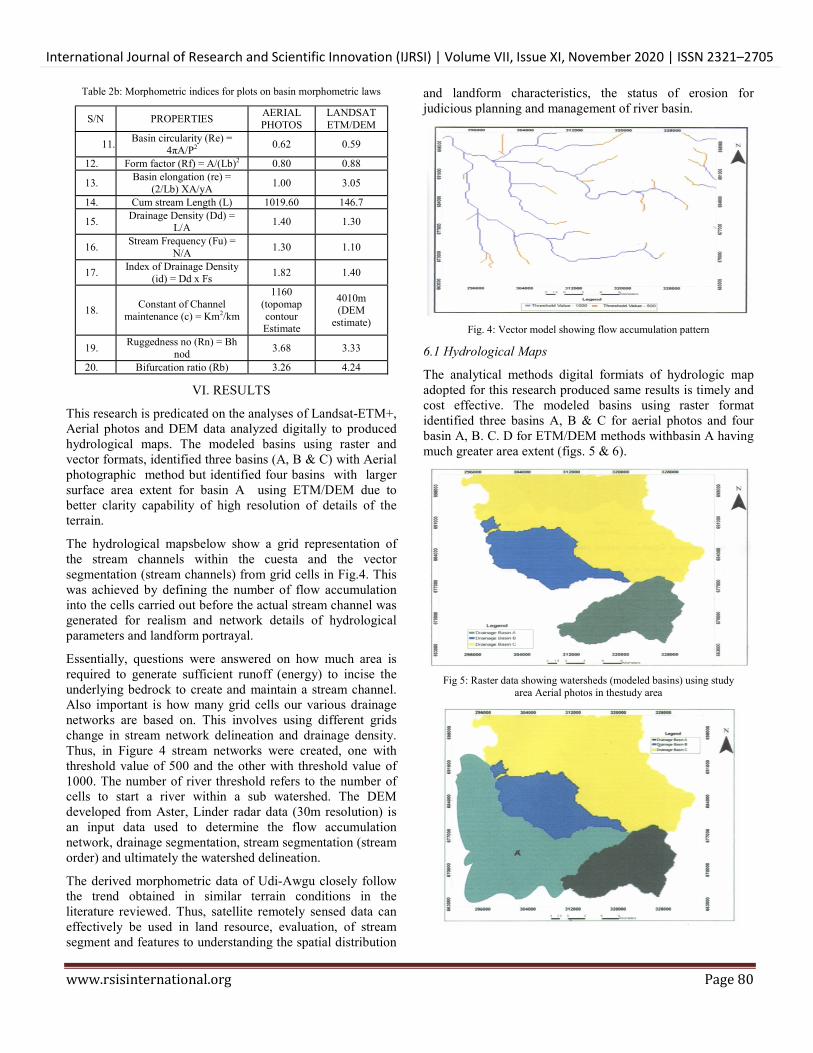
The analytical methods digital formiats of hydrologic map adopted for this research produced same results is timely and cost effective. The modeled basins using raster format identified three basins A, B & C for aerial photos and four basin A, B. C. D for ETM/DEM methods withbasin A having much greater area extent (figs. 5 & 6).
Fig 5: Raster data showing watersheds (modeled basins) using study
area Aerial photos in thestudy area
International Journal of Research and Scientific Innovation (IJRSI) | Volume VII, Issue XI, November 2020 | ISSN 2321–2705
www.rsisinternational.org Page 81
Fig.6: Raster data showing watersheds within Udi-Awgu cuesta using ETMIDEM
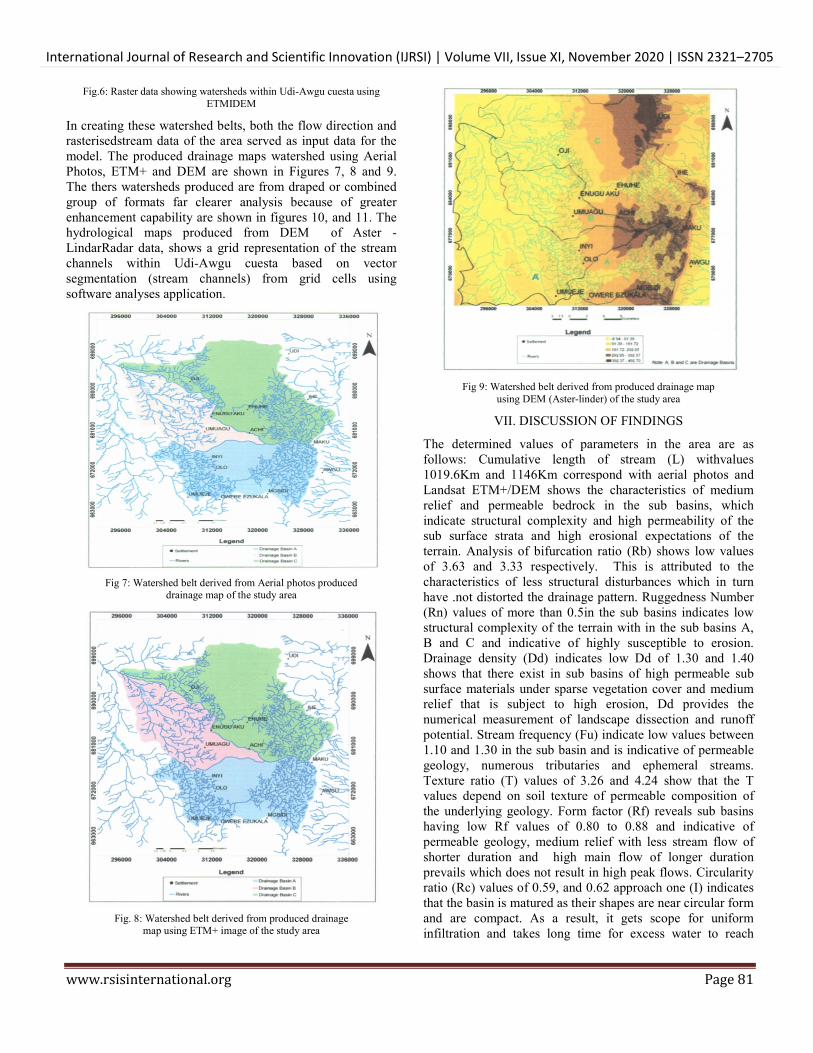
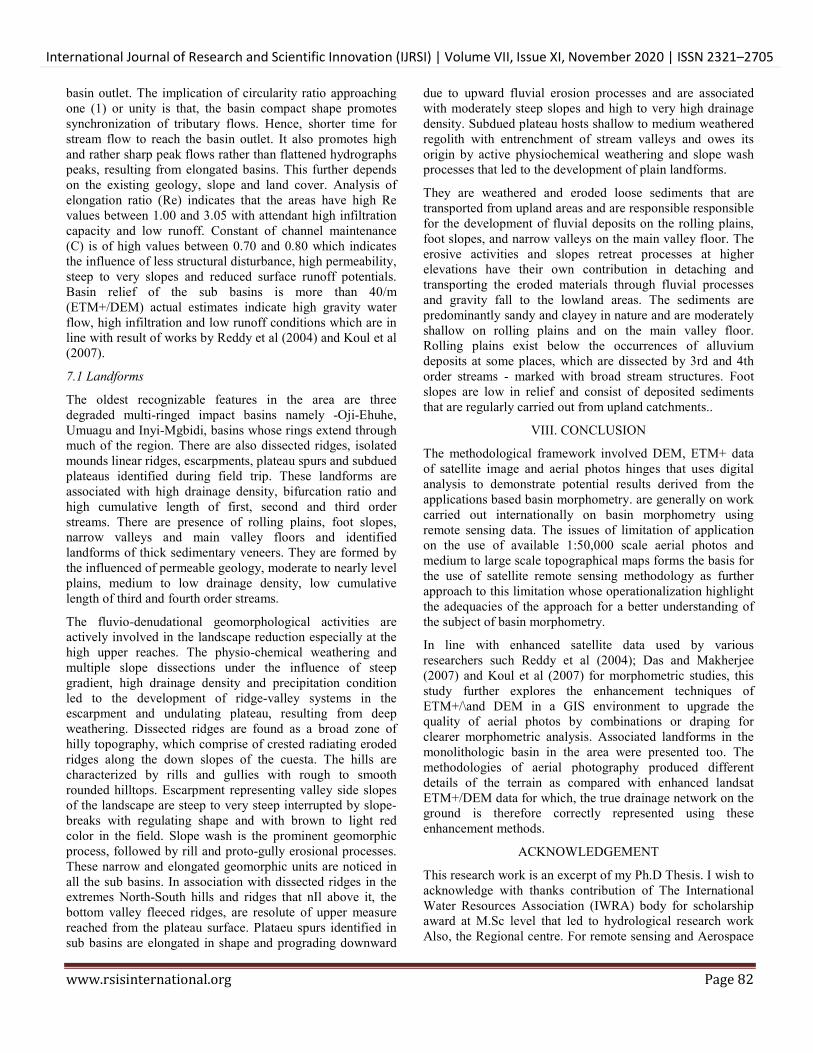
In creating these watershed belts, both the flow direction and rasterisedstream data of the area served as input data for the model. The produced drainage maps watershed using Aerial Photos, ETM+ and DEM are shown in Figures 7, 8 and 9. The thers watersheds produced are from draped or combined group of formats far clearer analysis because of greater enhancement capability are shown in figures 10, and 11. The hydrological maps produced from DEM of Aster -LindarRadar data, shows a grid representation of the stream channels within Udi-Awgu cuesta based on vector segmentation (stream channels) from grid cells using software analyses application.
Fig 7: Watershed belt derived from Aerial photos produced
drainage map of the study area
Fig. 8: Watershed belt derived from produced drainage
map using ETM+ image of the study area
Fig 9: Watershed belt derived from produced drainage map
using DEM (Aster-linder) of the study area
VII. DISCUSSION OF FINDINGS
The determined values of parameters in the area are as follows: Cumulative length of stream (L) withvalues 1019.6Km and 1146Km correspond with aerial photos and Landsat ETM+/DEM shows the characteristics of medium relief and permeable bedrock in the sub basins, which indicate structural complexity and high permeability of the sub surface strata and high erosional expectations of the terrain. Analysis of bifurcation ratio (Rb) shows low values of 3.63 and 3.33 respectively. This is attributed to the characteristics of less structural disturbances which in turn have .not distorted the drainage pattern. Ruggedness Number (Rn) values of more than 0.5in the sub basins indicates low structural complexity of the terrain with in the sub basins A, B and C and indicative of highly susceptible to erosion. Drainage density (Dd) indicates low Dd of 1.30 and 1.40 shows that there exist in sub basins of high permeable sub surface materials under sparse vegetation cover and medium relief that is subject to high erosion, Dd provides the numerical measurement of landscape dissection and runoff potential. Stream frequency (Fu) indicate low values between 1.10 and 1.30 in the sub basin and is indicative of permeable geology, numerous tributaries and ephemeral streams. Texture ratio (T) values of 3.26 and 4.24 show that the T values depend on soil texture of permeable composition of the underlying geology. Form factor (Rf) reveals sub basins having low Rf values of 0.80 to 0.88 and indicative of permeable geology, medium relief with less stream flow of shorter duration and high main flow of longer duration prevails which does not result in high peak flows. Circularity ratio (Rc) values of 0.59, and 0.62 approach one (I) indicates that the basin is matured as their shapes are near circular form and are compact. As a result, it gets scope for uniform infiltration and takes long time for excess water to reach
International Journal of Research and Scientific Innovation (IJRSI) | Volume VII, Issue XI, November 2020 | ISSN 2321–2705
www.rsisinternational.org Page 82
basin outlet. The implication of circularity ratio approaching one (1) or unity is that, the basin compact shape promotes synchronization of tributary flows. Hence, shorter time for stream flow to reach the basin outlet. It also promotes high and rather sharp peak flows rather than flattened hydrographs peaks, resulting from elongated basins. This further depends on the existing geology, slope and land cover. Analysis of elongation ratio (Re) indicates that the areas have high Re values between 1.00 and 3.05 with attendant high infiltration capacity and low runoff. Constant of channel maintenance (C) is of high values between 0.70 and 0.80 which indicates the influence of less structural disturbance, high permeability, steep to very slopes and reduced surface runoff potentials. Basin relief of the sub basins is more than 40/m (ETM+/DEM) actual estimates indicate high gravity water flow, high infiltration and low runoff conditions which are in line with result of works by Reddy et al (2004) and Koul et al (2007).
7.1 Landforms
The oldest recognizable features in the area are three degraded multi-ringed impact basins namely -Oji-Ehuhe, Umuagu and Inyi-Mgbidi, basins whose rings extend through much of the region. There are also dissected ridges, isolated mounds linear ridges, escarpments, plateau spurs and subdued plateaus identified during field trip. These landforms are associated with high drainage density, bifurcation ratio and high cumulative length of first, second and third order streams. There are presence of rolling plains, foot slopes, narrow valleys and main valley floors and identified landforms of thick sedimentary veneers. They are formed by the influenced of permeable geology, moderate to nearly level plains, medium to low drainage density, low cumulative length of third and fourth order streams.
The fluvio-denudational geomorphological activities are actively involved in the landscape reduction especially at the high upper reaches. The physio-chemical weathering and multiple slope dissections under the influence of steep gradient, high drainage density and precipitation condition led to the development of ridge-valley systems in the escarpment and undulating plateau, resulting from deep weathering. Dissected ridges are found as a broad zone of hilly topography, which comprise of crested radiating eroded ridges along the down slopes of the cuesta. The hills are characterized by rills and gullies with rough to smooth rounded hilltops. Escarpment representing valley side slopes of the landscape are steep to very steep interrupted by slope-breaks with regulating shape and with brown to light red color in the field. Slope wash is the prominent geomorphic process, followed by rill and proto-gully erosional processes. These narrow and elongated geomorphic units are noticed in all the sub basins. In association with dissected ridges in the extremes North-South hills and ridges that nIl above it, the bottom valley fleeced ridges, are resolute of upper measure reached from the plateau surface. Plataeu spurs identified in sub basins are elongated in shape and prograding downward
due to upward fluvial erosion processes and are associated with moderately steep slopes and high to very high drainage density. Subdued plateau hosts shallow to medium weathered regolith with entrenchment of stream valleys and owes its origin by active physiochemical weathering and slope wash processes that led to the development of plain landforms.
They are weathered and eroded loose sediments that are transported from upland areas and are responsible responsible for the development of fluvial deposits on the rolling plains, foot slopes, and narrow valleys on the main valley floor. The erosive activities and slopes retreat processes at higher elevations have their own contribution in detaching and transporting the eroded materials through fluvial processes and gravity fall to the lowland areas. The sediments are predominantly sandy and clayey in nature and are moderately shallow on rolling plains and on the main valley floor. Rolling plains exist below the occurrences of alluvium deposits at some places, which are dissected by 3rd and 4th order streams - marked with broad stream structures. Foot slopes are low in relief and consist of deposited sediments that are regularly carried out from upland catchments..
VIII. CONCLUSION
The methodological framework involved DEM, ETM+ data of satellite image and aerial photos hinges that uses digital analysis to demonstrate potential results derived from the applications based basin morphometry. are generally on work carried out internationally on basin morphometry using remote sensing data. The issues of limitation of application on the use of available 1:50,000 scale aerial photos and medium to large scale topographical maps forms the basis for the use of satellite remote sensing methodology as further approach to this limitation whose operationalization highlight the adequacies of the approach for a better understanding of the subject of basin morphometry.
In line with enhanced satellite data used by various researchers such Reddy et al (2004); Das and Makherjee (2007) and Koul et al (2007) for morphometric studies, this study further explores the enhancement techniques of ETM+/\and DEM in a GIS environment to upgrade the quality of aerial photos by combinations or draping for clearer morphometric analysis. Associated landforms in the monolithologic basin in the area were presented too. The methodologies of aerial photography produced different details of the terrain as compared with enhanced landsat ETM+/DEM data for which, the true drainage network on the ground is therefore correctly represented using these enhancement methods.
ACKNOWLEDGEMENT
This research work is an excerpt of my Ph.D Thesis. I wish to acknowledge with thanks contribution of The International Water Resources Association (IWRA) body for scholarship award at M.Sc level that led to hydrological research work Also, the Regional centre. For remote sensing and Aerospace
International Journal of Research and Scientific Innovation (IJRSI) | Volume VII, Issue XI, November 2020 | ISSN 2321–2705
www.rsisinternational.org Page 83
surveys Ile Ife for the satellite data collection and analysis carried out is appreciated. I am indeed indebted to my supervisors: OdemerhoM Francis, a Professor of Geomorphology (Southern Illinois University, Edmonville, USA) and Oyebande Lekan, a Professor of Hydrology (University of Lagos. Nigeria) for their tutoring in remote sensing, GIS, geomorphology and hydrology professions.
REFERENCES
[1] Adeniyi, P. O. &Omojola, O. (1997). Land use/land cover drainage evaluation in Sokoto Rima Basin of N.W. Nigeria based on Archival remote sensing techniques. In Adeniyi P. O. (ed). Gea information technology application for resource and environmental management in Africa.APubi.by AARSF pp. 142—172.
[2] Chisman, H. (1977). The use of remote sensing data in cartography.InBarneth, O. and Curtis, L. (eds.) Environmental remote sensing practices and problems, pp. 82-100.
[3] Coates, OR. (1958). Quantitative geomorphology of small drainage basin of southern Indian,, Office of Naval Research, Geography branch, Project NE 389-042, tech, rep. 10.
[4] Das, A. K. & Mukherjees (2005). Drainage morphometry using satellite data and GIS in ranged district. Mahgrashi, India: Jour. of Geological Society India, vol. 65, no. 5, pp. 577-5 86.
[5] Ebisemiju, F. S. (1976). Morphornetric work with Nigerian topographical maps. Lagos: The Nigerian Geographical Jour., vol. 19, no. 1, pp. 66-77.
[6] Ebisemiju, F. S. (1978). Anobjective criterion for the selection of representative basin. Water Resource Research Jour.., vol. 15,no. 2, pp. 65-80.
[7] Ejemeyovwi, D.O. (2008). The physiographic and drainage systems of Delta state Nigeria. In Odemerlio, F. (ed.) Pubi.of Geography Department, Delta State University Press Pubi. Abraka, pp.9-20.
[8] Eyles, K. 1. (1966). Stream presentation on Malaysian ma ps.Malaysia: Jour, of Tropical Geography, vol. 22, pp. 1-9.
[9] Eyles, K. I. (1973). Drainage density representation on Willington maps. New Zealand: Jour, of Hydrology, vol. 12, pp. 19-31.
[10] Goudie, A.S.J; Anderson, M; Burt, T.; Lewin, J.; Richards K.;Whalkey, B. &Woalkey, P. (1981).Geomorphologioal techniques. George Allen and UnwinPubi. London, pp. 3-11,26-55.
[11] Gregory, K. J. (1966). Dry valleys and the composition of the cirainagenet Jour. Hydrol., vol. 4, pp. 327—340.
[12] Hilton, T.R. (1.999). Practical Geography in Africa.LongnianPubi, London, pp. 72-83.
[13] Horton, R. F. (1945). Erosional development of streams and their drainage basin: hydrophysical approach to quantitative morphology in basins. Bull.56, Geo. Soc. Amer. pp. 275-370.
[14] Javis, R.S. (1976). Link Length organization and network scale dependences on networic diameter model. Water resources research, vol.12, pp. 128-1225.
[15] Jean-Mark, N. J. (2003). Spotlight of Spot image.An interview by chairman and CEO in SPOT Magazine — A New dimension technologies for earth observation, no. 39 — 41, pp. 7-21.
[16] Leopold, L.B; Wolmun, M.G & Miller, J.P.(l964). Fluvial processes in geomorphology. New York: In Freeman, A. and Lerman, A. (eds.) Jour. of Chemistry, Geology and Physics. Springes— Verlag.
[17] Mark, D.M.( 1978). Geomorphometricparameters.A review and evaluation.Geog. Ann., vol. 57A, pp. 165— 177.
[18] MeijerinkA.M.J.,Bannert, D.; Batelaan, O.; Lubczynski, M. W. &Pointet, T. ((2007). Remote Sensing applications to groundwater. Published by the United Nations Educational, Scientific and Cultural Organization.An IHP-V1 Series, no.16, pp.1 - 50,
[19] Mesa, L.M. (2006). Morphometric analysis of a subtropical Andean basin, Ticuman. Argentina: Jour. of Environmental Geology, vol. 50, no 8, pp. 1235-1242.
[20] Misra, R. & Ramesh A. l984).Fundamentals of Cartography.Conceptpublication company, New Delhi, India; reversed and enlarged vol. 1, pp. 59-25 1.
[21] Morisawa, M. C. (1957). Accuracy of determination of stream lengths from topographical maps.Trans Amer. Geography Jour., vol. 38.
[22] Ojo, O. (1977). The Climate of West Africa.HeinernannBoolcs Publ. SOP
[23] Reddy, G.E .O.Gangalakuta, P.; Amai, K.; Maji, A. K.; &Kothiram, S.G.(2004). Damage morphometry and the influence of the’ landform characteristics on a basaltic terrain, central India remote sensing and GIS approach. India: Jot. Jour. of Applied Earth Observation and Geo information, vol. 6, no 1, pp.1-17.
[24] Schenick, H. (1963). Simulation of the evolution or drainage networks with a digital computer. Jour. Geophysisvol., 68, pp. 5739 —5745.
[25] Schick, A.P. (1964) Accuracy of the 1: 20,000 topographical maps of Isreal for morphometric studies. Bull., Isreal Exploration Soc. vol. 28, pp. 43 .Iour.ofgeophysical research, vol. 66, pp. 361.
[26] Smart, J,S. (1978). The analysis of drainage network composition.EarthSurface Process, vol. 3, pp 124-170.
[27] Srinivasan, P.S (1988). Use of remote sensing techniques for detailed hydrogeomorphological investigation of part of Narmadasar command area.Jndia Jour. of remote seeming, vol. 16, no. 1, pp. 55-62.
[28] Strahier, A. N. (1952). Dynamic basis of geomorphology.Geol.Soc. Amer. Jour. of Sc., vol. i
[29] Strahler, A.N.(1957).Quantitative analysis of watershed geomorphology. Jour. of Trans, Amer. Geophysics Union, vol. 38, pp. 9 13-920.
[30] Strahler, A. N. (1964a). Statistical analysis in geomorphic research.Jour.of Geol., vol. 62, pp. 597-625.
[31] Strahler, A. N. (1964b). Quantitative geomophology of drainage basins and channels networks. New York: In T. Chow (ed.) Handbook of applied hydrology. McGraw-Hill, USA, section 4, pp. 39-76.
[32] Umeji, A. C. (2000).Evolution of the Abakaliki and the Anambra Sedimentary Basisn, Southeastern Nigeria.Areport of Shell Chair project submitted to SPDC, Nig. Ltd, 155p.
[33] Umeji, O. P. (2005). Polynological study of the Okaba Coal mine section in the Anambra
Related Documents