Modelling nitrous oxide and carbon dioxide emission from soil in an incubation experiment Hongtao Xing a, b , Enli Wang b, ⁎, Chris J. Smith b , Denis Rolston c , Qiang Yu a, d a Institute of Geographical Sciences and Natural Resources Research, Chinese Academy of Sciences, A11 Datun Road Anwai, Beijing, 100101, China b CSIRO Land and Water, GPO BOX 1666, Canberra, ACT, Australia c Department of Land, Air and Water Resources, University of California, Davis, CA 9516, USA d Plant Functional Biology and Climate Change Cluster, University of Technology, Sydney, PO Box 123, Broadway 2007 NSW, Australia abstract article info Article history: Received 26 July 2010 Received in revised form 23 June 2011 Accepted 4 July 2011 Available online 22 October 2011 Keywords: Nitrous oxide emission APSIM DAYCENT Decomposition CO 2 flux Nitrous oxide (N 2 O), one of the primary green house gases (GHG), is an important contributor to the radiative forcing and chemistry of the atmosphere. Nitrous oxide emissions from soil are mainly due to denitrification. In this paper, we test sub-modules in the APSIM and DAYCENT models to simulate denitrification. The models were tested by comparison of predicted and measured N 2 O emission from an incubation experiment using 8.2 L soil cores. The N gas sub-modules in DAYCENT were based on the leaky pipe metaphor, that is, total N gas emissions are proportional to N cycling and gas diffusivity in the soil determines the relative amounts of N gas species emitted. The same approach was added to APSIM to enable simulation of N 2 O emission. The soil monoliths were irrigated three times during a two-week period and set on tension tables to control the suction at the base of each core. The results show that APSIM underestimates denitrification, whereas DAYCENT better predicted N 2 O emission from denitrification. In contrast, predictions of CO 2 emissions were better from APSIM than DAYCENT. Modification to the temperature response for denitrification in APSIM improved the simulation significantly. The use of multiple soil layers in the simulations improved predictions, especially at low soil moisture content. Under these conditions, the layered approach better captures the impact of soil moisture distribution. Reducing the time step to hourly improve the prediction of N 2 O peaks and the daily total emissions, but there were still temporal mismatches between simulated and observed values. The denitrification algorithms in DAYCENT, combined with APSIM simulated CO 2 , together with an hourly time step and a layered approach, produced the best results. These results highlight the need for improvement to the APSIM denitrification sub-model. Crown Copyright © 2011 Published by Elsevier B.V. All rights reserved. 1. Introduction Nitrous oxide (N 2 O) is one of the major greenhouse gases (GHG) that cause global warming. It is a long-lived trace gas in the atmosphere and plays an important role in ozone depletion (Prather et al., 1994; Rodhe, 1990). One molecule of N 2 O has 310 times greater impact on the warming potential than a molecule carbon dioxide (CO 2 ), and has a residence time of about 120 years in the atmosphere (Albritton et al., 1995; Olivier et al., 1998; Prather et al., 1994). The concentration of N 2 O in the atmosphere has increased from ~ 270 ppb in the pre-industrial period to ~ 319 ppb by 2005 (IPCC, 2007). Nitrous oxide contributes about 5% of global warming potential in the GHG assessments (Rodhe, 1990). The IPCC report (2007) and other studies (Bouwman et al., 1995; Prather et al., 1994) indicate that the increase in N 2 O concentration is mainly attributed to soil-atmosphere exchange from agriculture areas. Improved understanding of the processes that produce N 2 O and accurate prediction of the flux from agricultural soils is needed to provide the scientific basis for development of mitigation strategies. Nitrous oxide emissions from agricultural soils occur during nitrification and denitrification (Davidson, 1991; del Grosso et al., 2000a; Firestone and Davidson, 1989; Li et al., 1992; Parton et al., 1996; Sahrawat and Keeney, 1986). Nitrification is the biological process that occurs under aerobic conditions (Bremner and Blackmer, 1978) and oxidises ammonium (NH 4 ) to nitrate (NO 3 ). During nitrification, a small proportion of the nitrogen is lost as N 2 O(Conrad, 1996; Firestone and Davidson, 1989). The rate of nitrification is controlled by NH 4 concentration, soil pH, temperature, water content, and available soluble carbon. The maximum rate occurs in aerobic soils with moderate water content (Goreau et al., 1980; Hasegawa et al., 1999; Keating et al., 2001; Li et al., 1992; Parton et al., 1996). In contrast, denitrification is a microbial process that occurs under anaerobic or oxygen-restricted conditions where the microbes reduce the NO 3 to gaseous N. The N oxides (NO 3 , NO 2 , NO, or N 2 O) are used as the terminal electron acceptors. It is a process of the dissimilatory Geoderma 167-168 (2011) 328–339 ⁎ Corresponding author. Tel.: + 61 02 62465964. E-mail address: [email protected] (E. Wang). 0016-7061/$ – see front matter. Crown Copyright © 2011 Published by Elsevier B.V. All rights reserved. doi:10.1016/j.geoderma.2011.07.003 Contents lists available at ScienceDirect Geoderma journal homepage: www.elsevier.com/locate/geoderma

Welcome message from author
This document is posted to help you gain knowledge. Please leave a comment to let me know what you think about it! Share it to your friends and learn new things together.
Transcript
Geoderma 167-168 (2011) 328–339
Contents lists available at ScienceDirect
Geoderma
j ourna l homepage: www.e lsev ie r.com/ locate /geoderma
Modelling nitrous oxide and carbon dioxide emission from soil in anincubation experiment
Hongtao Xing a,b, Enli Wang b,⁎, Chris J. Smith b, Denis Rolston c, Qiang Yu a,d
a Institute of Geographical Sciences and Natural Resources Research, Chinese Academy of Sciences, A11 Datun Road Anwai, Beijing, 100101, Chinab CSIRO Land and Water, GPO BOX 1666, Canberra, ACT, Australiac Department of Land, Air and Water Resources, University of California, Davis, CA 9516, USAd Plant Functional Biology and Climate Change Cluster, University of Technology, Sydney, PO Box 123, Broadway 2007 NSW, Australia
⁎ Corresponding author. Tel.: +61 02 62465964.E-mail address: [email protected] (E. Wang).
0016-7061/$ – see front matter. Crown Copyright © 20doi:10.1016/j.geoderma.2011.07.003
a b s t r a c t
a r t i c l e i n f oArticle history:Received 26 July 2010Received in revised form 23 June 2011Accepted 4 July 2011Available online 22 October 2011
Keywords:Nitrous oxide emissionAPSIMDAYCENTDecompositionCO2 flux
Nitrous oxide (N2O), one of the primary green house gases (GHG), is an important contributor to the radiativeforcing and chemistry of the atmosphere. Nitrous oxide emissions from soil are mainly due to denitrification.In this paper, we test sub-modules in the APSIM and DAYCENTmodels to simulate denitrification. The modelswere tested by comparison of predicted and measured N2O emission from an incubation experiment using8.2 L soil cores. The N gas sub-modules in DAYCENTwere based on the leaky pipe metaphor, that is, total N gasemissions are proportional to N cycling and gas diffusivity in the soil determines the relative amounts of N gasspecies emitted. The same approach was added to APSIM to enable simulation of N2O emission. The soilmonoliths were irrigated three times during a two-week period and set on tension tables to control thesuction at the base of each core. The results show that APSIM underestimates denitrification, whereasDAYCENT better predicted N2O emission from denitrification. In contrast, predictions of CO2 emissions werebetter from APSIM than DAYCENT. Modification to the temperature response for denitrification in APSIMimproved the simulation significantly. The use of multiple soil layers in the simulations improved predictions,especially at low soil moisture content. Under these conditions, the layered approach better captures theimpact of soil moisture distribution. Reducing the time step to hourly improve the prediction of N2O peaksand the daily total emissions, but there were still temporal mismatches between simulated and observedvalues. The denitrification algorithms in DAYCENT, combined with APSIM simulated CO2, together with anhourly time step and a layered approach, produced the best results. These results highlight the need forimprovement to the APSIM denitrification sub-model.
Crown Copyright © 2011 Published by Elsevier B.V. All rights reserved.
1. Introduction
Nitrous oxide (N2O) is one of the major greenhouse gases (GHG)that cause global warming. It is a long-lived trace gas in theatmosphere and plays an important role in ozone depletion (Pratheret al., 1994; Rodhe, 1990). One molecule of N2O has 310 times greaterimpact on the warming potential than a molecule carbon dioxide(CO2), and has a residence time of about 120 years in the atmosphere(Albritton et al., 1995; Olivier et al., 1998; Prather et al., 1994). Theconcentration of N2O in the atmosphere has increased from ~270 ppbin the pre-industrial period to ~319 ppb by 2005 (IPCC, 2007). Nitrousoxide contributes about 5% of global warming potential in the GHGassessments (Rodhe, 1990). The IPCC report (2007) and other studies(Bouwman et al., 1995; Prather et al., 1994) indicate that the increasein N2O concentration is mainly attributed to soil-atmosphereexchange from agriculture areas. Improved understanding of the
11 Published by Elsevier B.V. All rig
processes that produce N2O and accurate prediction of the flux fromagricultural soils is needed to provide the scientific basis fordevelopment of mitigation strategies.
Nitrous oxide emissions from agricultural soils occur duringnitrification and denitrification (Davidson, 1991; del Grosso et al.,2000a; Firestone and Davidson, 1989; Li et al., 1992; Parton et al.,1996; Sahrawat and Keeney, 1986). Nitrification is the biologicalprocess that occurs under aerobic conditions (Bremner and Blackmer,1978) and oxidises ammonium (NH4) to nitrate (NO3). Duringnitrification, a small proportion of the nitrogen is lost as N2O (Conrad,1996; Firestone and Davidson, 1989). The rate of nitrification iscontrolled by NH4 concentration, soil pH, temperature, water content,and available soluble carbon. The maximum rate occurs in aerobicsoils with moderate water content (Goreau et al., 1980; Hasegawa etal., 1999; Keating et al., 2001; Li et al., 1992; Parton et al., 1996).
In contrast, denitrification is a microbial process that occurs underanaerobic or oxygen-restricted conditions where the microbes reducethe NO3 to gaseous N. The N oxides (NO3, NO2, NO, or N2O) are used asthe terminal electron acceptors. It is a process of the dissimilatory
hts reserved.
Table 1Soil bulk density, soil pH and initial soil organic carbon, total N content.
Soil depth Soil organic carbon Total N Soil bulk density pH
% (weight) % (weight) g cm−3 –
3 cm 2.25 0.17 1.38 5.39 cm 0.90 0.065 1.60 4.114 cm 0.46 0.035 1.54 4.1
329H. Xing et al. / Geoderma 167-168 (2011) 328–339
reduction of NO3 (or nitrite, NO2) to gaseous products including nitricoxide (NO), N2O, and N2 (Heinen, 2006; Knowles, 1981; Paul and Clark,1989;Williams et al., 1992). During denitrification, the relative yields ofN2 and N2O are a function of the NO3 concentration and intensity of thereducing conditions with more N2 being produced under highlyreduced conditions (Parton et al., 1996; Ye et al., 1994). The ratio ofN2:N2O is positively correlated with the amount of soluble carbon andwater-filled-pore space (WFPS — reflecting O2 availability in soil), butinversely related to NO3 concentration (Parton et al., 1996;Weier et al.,1993). Quantification of N2O emissions from denitrification has provedto be difficult because of variations in soil texture, soil water content,biological properties, and substrate levels (NO3 and soluble carbon),which regulate N2O production (Li et al., 1992).
Different approaches have been used to predict N2O emissionsfrom nitrification and denitrification. Statistical approaches were usedin some early studies based on data from laboratory incubationexperiments (Focht, 1974; Parton et al., 1996; Weier et al., 1993).Later, mechanistic models were developed to simulate the physicaland biological processes that control nitrification and denitrificationrates. These approaches have increased understanding of relation-ships between these rates, soil moisture, soil texture, diffusion,soluble carbon and N oxides. These models include DNDC (Li et al.,1992; Li et al., 2000), DAYCENT (Parton et al., 1996; Parton et al.,2001) and APSIM (Keating et al., 2001). The DNDC model is the mostdetailed in process description; it simulates the dynamics of themicrobial denitrifer population. Further, it has been coupled withgeographical information systems (Kiese et al., 2005) to estimate N2Oemissions from catchments (Kiese et al., 2005; Li et al., 2005a). TheDAYCENT model is relatively simple and widely used (Chen et al.,2008). APSIM is able to simulate both the nitrification anddenitrification processes. It has been recently tested for simulationsof N2O emissions by optimising the denitrification rate and incorpo-rating N2:N2O equations of del Grosso et al. (2000a,b) into APSIM(Huth et al., 2010; Thorburn et al., 2010).With the exception of DNDC,most models run on a daily time step. Thus, they do not simulate thedynamics of N2O emissions at hourly or finer time steps. However,peak N2O emissions are observed to occur within 1 or 2h, particularlyin light textured well drained soils because of the rapid change in soilmoisture. The relative merit of using hourly or daily time steps forsimulating N2O emissions is not well documented. In the currentmodels, N2O productions from a soil profile are predicted using: (i) asingle soil layer (DAYCENT; Parton et al., 1996), (ii) by summation ofN2O production from multiple soil layers (APSIM; Thorburn et al.,2010), (iii) considering the contributions from each soil layer basedon process understanding (DNDC, Li et al., 2000) or (iv) empiricalequations (FASSAT, Hanson et al., 2000). The comparison of theseapproaches and the contributions from each layer to the total fluxhave not been analysed in detail.
The objectives of this paper were to: (i) test the algorithms used inDAYCENT and APSIM for simulating denitrification in terms of N2Oemissions against data obtained in an incubation experiment,(ii) investigate possible ways of improving APSIM for simulation ofgaseous loss of nitrogen, and (iii) explore whether the use of multiplelayered and hourly time step simulations lead to better N2Osimulations.
2. Material and methods
2.1. The incubation experiment
An incubation experiment was carried out in the laboratory in1997 for 14 days using soil collected from improved pasture at thenorthern side of Wagga Wagga, Australia (35.153°S, 147.472°E). Thesoil was a Red Kandosol (Isbell, 1996), or Typic Haploxeralf (SoilSurvey Staff, 1992) typically a sandy or loamy A horizon (~0.4 to 0.5 mthick) overlying a light to medium clay B horizon. The soil is well
drained as shown by saturated hydraulic conductivities of 850 and35 mm/day at 0.3 and 1.0 m depths, respectively (Snow et al., 1999).Soil carbon (2.25%) and nitrogen (0.17%) values (Table 1) in thesurface 0.05 m were low and the soil was acidic (pH≤5.3) withexchangeable Al present on the cation exchange sites.
Five undisturbed soil cores (225 mm diameter, 200 mm length)were takenusing large sleeveswith a reinforced cuttingedge (McKenzieand Cresswell, 2002; McKenzie and Jacquier, 1997) (see Figure 3 inMcKenzie and Jacquier, 1997). The inner ring creates an air filledannulus that was filled with Vaseline heated slightly above meltingpoint (about 50 °C) and injected into the gapwith a grease gun. The baseof the coreswas prepared by carefully removing the surfacewith a smallscalpel to create a freshly broken surface, whichwas then cleaned usinga vacuumcleaner. The coreswere loweredonto ceramicplates thatweremounted in Perspex base made to fit the outside diameter of the PVCcore (approximately 250 mminternal diameter), resulting in a tight sealbetween theoutsideof the core and the ceramicplate. A small amountoffine-grain contact material (diatomaceous earth) was added to theceramic plates to improve the contact between the base of the soil coreand the ceramic plate (Cresswell, 2002). The outer PVC side of the coreswas sealed to the Perspex holder using silicon sealant.
Water potentials of−10 cm (−13.33 kPa, 1 cm=1.33 kPa), -25 cm(−33.325 kPa), −50 cm (-66.65 kPa), −75 cm (−99.975 kPa) and−100 cm (−133.3 kPa) of water were applied respectively to the baseof the five individual cores using hanging columns of water to controlthe tension at the base of the cores (Cresswell, 2002). Micro-tensiometers and soil solution samplers (22 mm diameter), and smallTime Domain Reflectometry (TDR) probes (35 mm diameter) wereinstalled horizontally in each core at 30, 90 and 140 mm below the soilsurface. Water treatments of the soil cores were run two weeks beforethe experiment to calibrate TDR. Tension was measured using waterfilled manometers. Soil water contents were recorded every 15 min,and soil solutions were collected several times per day followingirrigation and then at increasing time intervals to measure NO3
concentration.Irrigation of the cores was carried out three times during the
experimental period using a drip infiltrometer filled with gauge 18hypodermic needles (McKenzie and Jacquier, 1997). The irrigant waseffluent collected fromWagga (Falkiner and Smith, 1997; Smith et al.,1998) spiked with potassium bromide and 15N potassium nitrate.Between 607 and 746 cm3 of solutions was added to the soil coreswith a NO3–N concentration of 210 μg N cm3.
During the experiment, temperature was held constant at 25 °C.Evaporation (E) from the soil cores was measured at about 3–4 hourintervals following irrigation events and then at increasing timeintervals as the change in weight of the cores using a 15 kg(repeatability of 0.2 g) balance.
Fluxes of CO2 and N2O were measured several times each 24 hourperiod by placing a cover over the core, sealing the cover to the PVCcore using a large rubber band and with drawing two 10 cm3 gassamples from the headspace at 0, 10, and 20 min. The gas flux wascalculated as the initial linear rate of concentration change (Galballyet al., 2008). The headspace volume of the covers was 2604±90 cm3.Nitrous oxide analyses were made on a HP5890 Series 1 (HewlettPackard, USA) gas chromatograph, fitted with an electron capturedetector (ECD) thatwas operated at 400 °C. Sampleswere injected via a10-port Valco gas sampling valve fitted with a 3 cm3 gas loop held at
330 H. Xing et al. / Geoderma 167-168 (2011) 328–339
80 °C. The gas chromatographic separation was achieved using twopacked columns (0.32 cm outside diameter) containing Porapak QS,and operated at 65 °C. The two columns were arranged in a back-flusharrangement. Carbon dioxide concentrations were measured usingLicor CO2/H2O gas analyser. The CO2 and N2O measurement systemswere calibrated undertaken, and standards run during each measure-ment period.
2.2. Modelling of nitrification and denitrification in APSIM
The Agricultural Production Systems Simulator (APSIM; Keating etal., 2001) is a process-oriented model that has modules for thesimulation of plant and soil processes. The APSIM-SoilN module(Probert et al., 1998; Thorburn et al., 2010) simulates the dynamics ofboth carbon and nitrogen. A detailed description of the module is givenat http://www.apsim.info/Wiki/SoilN.ashx. In SoilN, soil organic matteris divided into four pools: a fresh organic matter pool (FOM) includingroots and incorporated crop residue, a BIOM pool representing themore labile soil microbial biomass and microbial products, a HUM poolcomprising the humic fraction of soil organic matter, and an inert pool(INERT) that does not decompose. Decomposition of the BIOM, HUMand FOM pools are treated as first-order decay processes with the ratebeing modified by soil temperature and moisture and the C:N ratio forthe FOM pool. Carbon dioxide (CO2) production is calculated as aconstant fraction of the carbon undergoing decomposition of FOM,HUM, and BIOM pools. The CO2 emission from the soils is calculated asthe sum of CO2 production in the soil layers. Flows between differentpools are calculated in terms of carbon, and the corresponding nitrogenflows depend on the C:N ratio of the receiving pool. Mineralisation andimmobilisation of N is determined as the balance between the release ofN during decomposition and immobilisation duringmicrobial synthesisand humification. Vertical movement of inorganic N in the soil profile iscontrolled by the water movement as simulated by the soil waterbalance model.
In APSIM, nitrification depends on four main factors: the substrateNH4 concentration, oxygen, soil moisture, soil pH and soil tempera-ture. Impact of oxygen availability and soil water on biological activityis simulated using a soil moisture factor, which has a value of 1.0 if soilmoisture is between the middle range and the drained upper limit. Itdecreases linearly to zerowhen soil moisture drops to lower limit (toodry) or increases to saturation (lack of oxygen supply). Themodel alsoassumes that the optimal pH for the biological processes is between 6and 8, and the process stops at pH of 9 and 4.5. Unlike CERES (Godwinand Jones, 1991), there is no provision for the potential rate ofnitrification to change with time to represent a changing microbialpopulation. APSIM also use a more sensitive temperature functionthan that in the CERES model to account for the combined effects onboth biological and physical processes.
In the model, the denitrification rate is controlled by available NO3
in the soil, active carbon, soil aeration, and temperature. Active carbonis related to the carbon concentration of humic and fresh organicpools. Soil aeration is simulated with a soil moisture factor thatincreases from 0.0 at drained upper limit to 1.0 at saturation watercontent (anaerobic condition). The model assumes a wider temper-ature range than that for nitrification.
APSIM did not calculate N2O emission in its earlier versions.Recently, the ratio of N2 to N2O from del Grosso et al. (2000a,b) for Ngas emitted during denitrification, and a constant fraction of nitrifica-tionwere introduced to simulate N2O emissions (Thorburn et al., 2010).
2.3. Modelling of nitrification, denitrification and N2O emission inDAYCENT
Detailed description of DAYCENT can be found in Parton et al.(1996) and Parton et al. (2001). Briefly, nitrification is controlled bysoil NH4 concentration, soil moisture, temperature and pH. It is
linked to the daily net N mineralisation from organic matterdecomposition. In addition, it uses the water filled pore space(WFPS) to normalise the effect of soil moisture and texture. It linksthe optimal temperature to the average maximum monthly airtemperature for the warmest month of the year to account for thehigher temperature optimum at warmer environments. It assumesno reduction in the nitrification rate at high pH. Nitrous oxideemissions during nitrification are estimated as a proportion of thenitrification rate.
DAYCENT assumes that the total N gas loss from denitrification iscontrolled by labile carbon availability (e-donor), NO3 concentration(e-acceptor) and oxygen (O2) availability (competing e-acceptor). Itassumes that the process is controlled by the molecular species (NO3,or labile C) that is most limiting, and then attenuated by a multiplierthat reflects O2 availability. The O2 status of soil is simulated as afunction of WFPS and soil texture (del Grosso et al., 2000b; Parton etal., 1996; Parton et al., 2001). It is assumed there is no denitrification ifWFPS is less than 40% for fine textured soils, b55% for mediumtextured soils and 60% for sandy soil. Total N gas flux increasesexponentially with increasing WFPS in all soils. The availability oflabile carbon is estimated from soil heterotrophic respiration (CO2),which is estimated using a maximum soil respiration rate(80 kg C ha−1 d−1) modified by soil temperature and moisturefactors. Nitrous oxide emission from denitrification is calculatedbased on the N2 to N2O ratio of total denitrification. Further, itassumes that the proportion of N2O from denitrification decreases asthe ratio of e-donor to e-acceptor increased. That is, a larger amount ofN2 is produced from NO3 as the intensity of reduction increases underanaerobic conditions.
2.4. Simulation of the N2O emission in the incubation experiment usingDAYCENT and APSIM
Nitrous oxide production was modelled at both daily and hourlytime steps, with either a single or multiple soil layers, to investigatethe effect of time step and layering on the simulation results. Threeapproaches were used for comparison purposes: i) the originalDAYCENT model (DAYCENT), ii) the APSIM simulated denitrificationrate together with the N2 to N2O ratio from DAYCENT (APSIM_D),iii) same as in i) but the CO2 production from soil heterotrophicrespiration was replaced by the CO2 production from decompositionof soil organic matter in APSIM (DAYCENT_A).
The simulations were conducted outside the APSIM framework byprogramming the modules with Visual Basic and running thesimulations in Excel. The HUM and BIOM pools in APSIM wereinitialised based on measured soil organic carbon content. Theproportion of organic carbon that is inert (Finert) and the proportionof non-inert C in BIOMpool (Fbiom) were set to 0.4 and 0.03 (Probert etal., 1998), respectively. Fresh organic matter contained in the soil wasestimated based on previous crop type (legume pasture) and adjustedtomatch the first measured CO2 flux from the soil in the 10 cm suctiontreatment.
Nitrous oxide and CO2 release was modelled firstly using a singlelayer (0–20 cm soil), which is the default depth in DAYCENT for N2Osimulation. In subsequent simulations, three soil layers (0–6, 6–12and 12–20 cm) were used. Studies (Chatskikh et al., 2005; Davidsonet al., 2000; Hanson et al., 2000; Perez et al., 2000) show that some ofN2O will be reduced to N2 as it diffuses through the soil. The relativecontribution of N2O produced in each soil layer was estimated basedon the central depth of the layers to the soil surface as according toChatskikh et al. (2005):
fN2O = max 0; min 1:0;1:008−0:0343Zi−3:1816Z2i
� �� �ð1Þ
331H. Xing et al. / Geoderma 167-168 (2011) 328–339
where fN2O is the contribution factor, Z is the depth of the centre oflayer i from soil surface (m).
For multiple soil layer simulations, the surface N2O emission fromthe 20 cm soil cylinder was calculated as the N2O produced in each ofthe three layers multiplied by the contribution factor from Eq. (1). Therelative contribution decreases with depth. A thicker layer at depthmay locally produce more N2O, but the contribution to surfaceemission is smaller.
The daily potential rates of nitrification and denitrification weretransformed to hourly rates by dividing by 24 for simulations athourly time step. The daily rates of soil organic matter decompositionfor BIOM, FOM, and HUM pools were transformed to hourly ratesusing Eq. (2) because they are first order decay rates:
ln 1:0−rð Þ = ln 1:0−Rð Þ = 24 ð2Þ
where r is the hourly rate, and R is the daily decomposition rate.In the experiment, soil water content wasmonitored continuously.
However, soil NO3 was measured intermittently. The observed soilwater content (hourly basis) was used as input to the model. Nitrate–N contents in each soil layers were estimated for each hour based onwater movement between the three layers in the soil cylinders (seebelow). The estimated hourly NO3–N contents were used as input forthe hourly modelling.
2.5. Calculation of NO3–N movement and drainage at the bottom of thecores
Drainage from the cylinder was calculated from the measured soilwater content in the soil profile and evaporation (data not shown), forthe purpose of estimating NO3–N concentration in the soil at anhourly time-step and NO3–N leaching from the soil cores. For eachtime step, the water balance is given as:
D = I−E + ∑n
i=1Vi × ΔSWi ð3Þ
where D is drainage at the base of the core (cm3); I is the irrigationamount (cm3); E is evaporation (cm3); ΔSW is the change ofvolumetric water content (cm3 cm−3) in the soil profiles; Vi is volumeof the soil in a layer (cm3).
Water movement was estimated based on themeasured soil watercontent in the cylinder. Furthermore, we assumed that NO3–N wasmixed in the soil solution and the downwards flux was proportionalto drainage, thus only convective transport was considered.
3. Results
3.1. Soil moisture and drainage
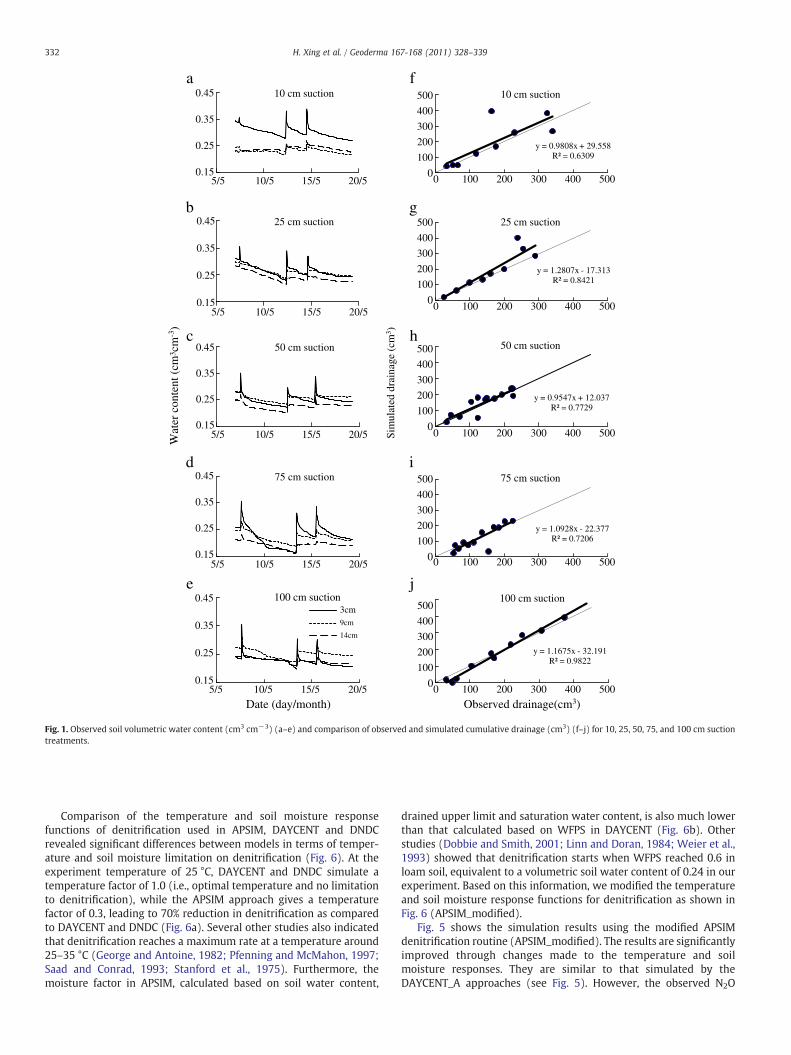
The dynamics of soil water contents at three layers in the soilcylinders are shown in Fig. 1(a–e). Water contents in the 0–6 cmsurface soil layer were constantly higher than those in the 6–12 cmand 12–20 cm soil layers in the 10 cm suction treatments (Fig. 1a). Inthe other treatment, differences in water contents between layerswere much smaller, especially in the 100 cm suction treatment(Fig. 1e).
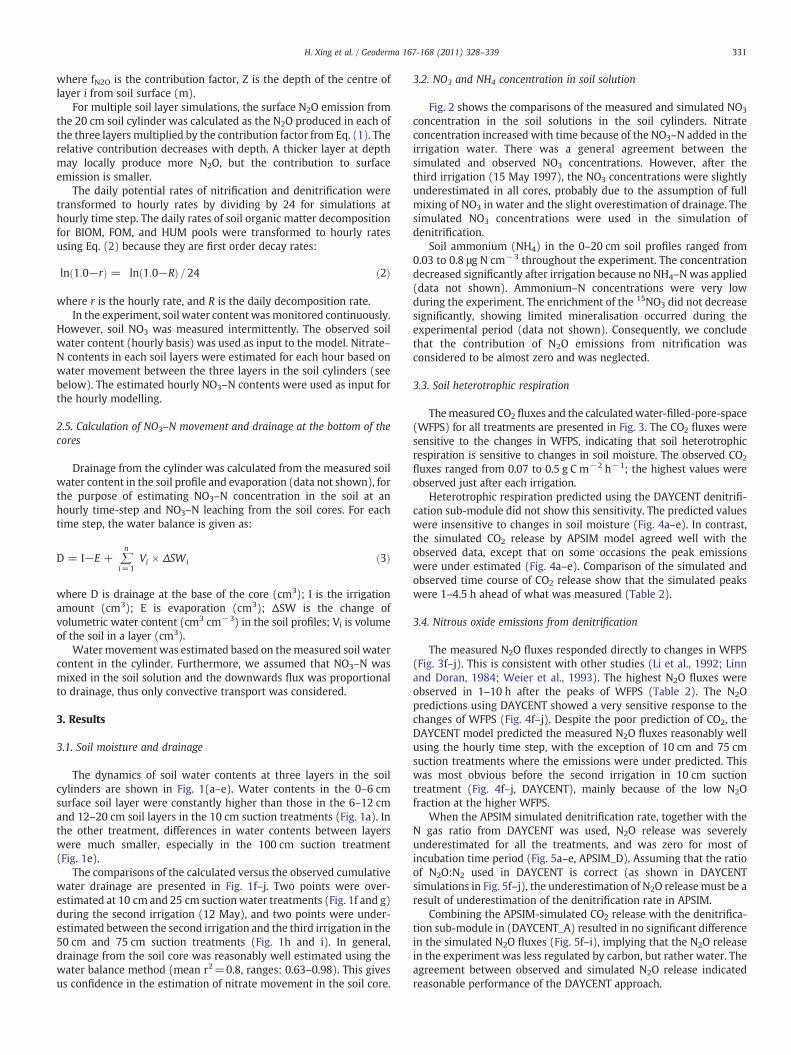
The comparisons of the calculated versus the observed cumulativewater drainage are presented in Fig. 1f–j. Two points were over-estimated at 10 cm and 25 cm suctionwater treatments (Fig. 1f and g)during the second irrigation (12 May), and two points were under-estimated between the second irrigation and the third irrigation in the50 cm and 75 cm suction treatments (Fig. 1h and i). In general,drainage from the soil core was reasonably well estimated using thewater balance method (mean r2=0.8, ranges: 0.63–0.98). This givesus confidence in the estimation of nitrate movement in the soil core.
3.2. NO3 and NH4 concentration in soil solution
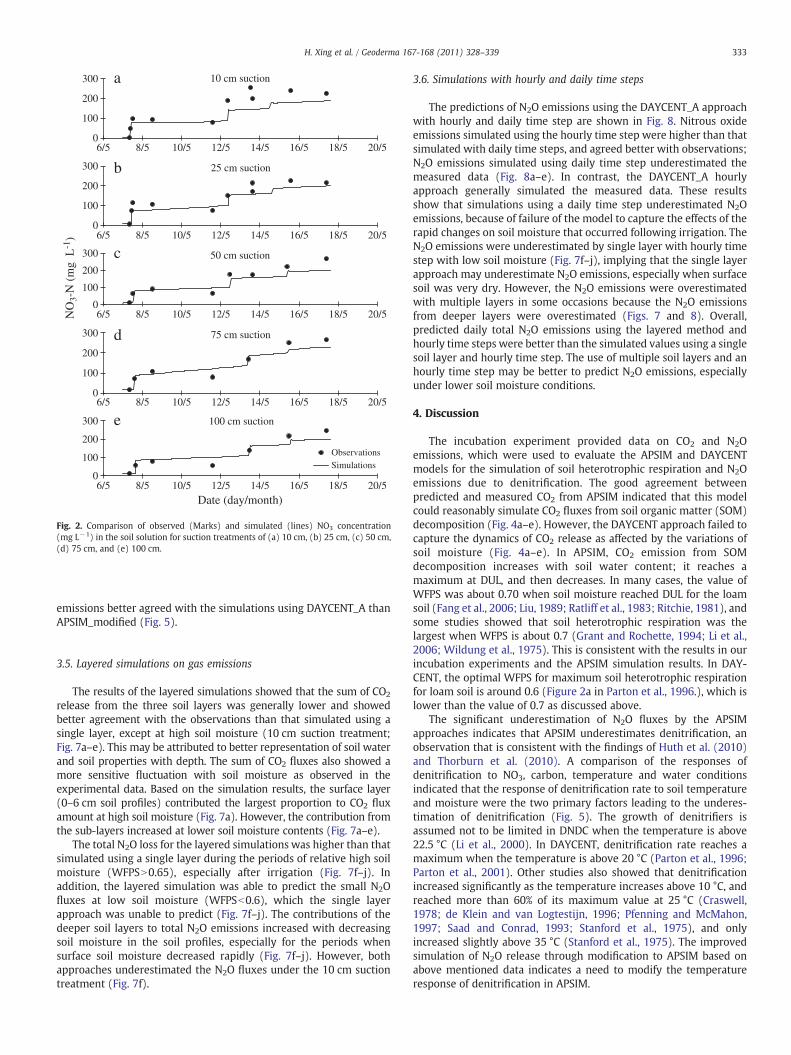
Fig. 2 shows the comparisons of the measured and simulated NO3
concentration in the soil solutions in the soil cylinders. Nitrateconcentration increased with time because of the NO3–N added in theirrigation water. There was a general agreement between thesimulated and observed NO3 concentrations. However, after thethird irrigation (15 May 1997), the NO3 concentrations were slightlyunderestimated in all cores, probably due to the assumption of fullmixing of NO3 in water and the slight overestimation of drainage. Thesimulated NO3 concentrations were used in the simulation ofdenitrification.
Soil ammonium (NH4) in the 0–20 cm soil profiles ranged from0.03 to 0.8 μg N cm−3 throughout the experiment. The concentrationdecreased significantly after irrigation because no NH4–Nwas applied(data not shown). Ammonium–N concentrations were very lowduring the experiment. The enrichment of the 15NO3 did not decreasesignificantly, showing limited mineralisation occurred during theexperimental period (data not shown). Consequently, we concludethat the contribution of N2O emissions from nitrification wasconsidered to be almost zero and was neglected.
3.3. Soil heterotrophic respiration
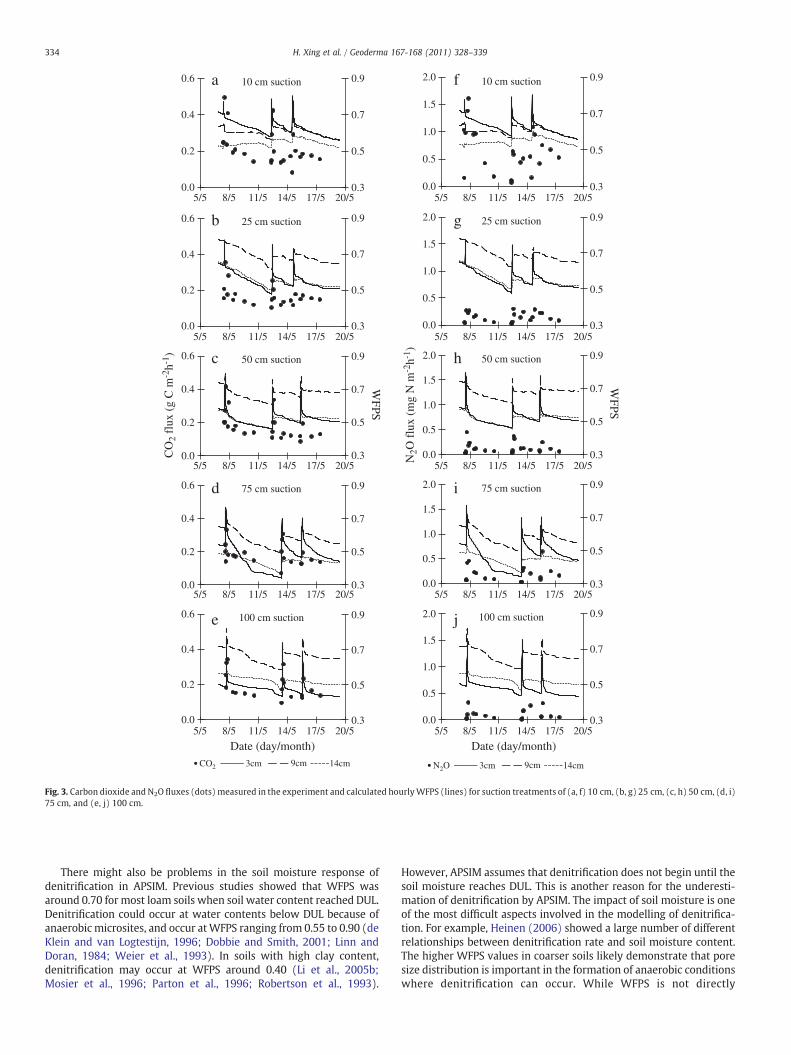
Themeasured CO2 fluxes and the calculatedwater-filled-pore-space(WFPS) for all treatments are presented in Fig. 3. The CO2 fluxes weresensitive to the changes in WFPS, indicating that soil heterotrophicrespiration is sensitive to changes in soil moisture. The observed CO2
fluxes ranged from 0.07 to 0.5 g C m−2 h−1; the highest values wereobserved just after each irrigation.
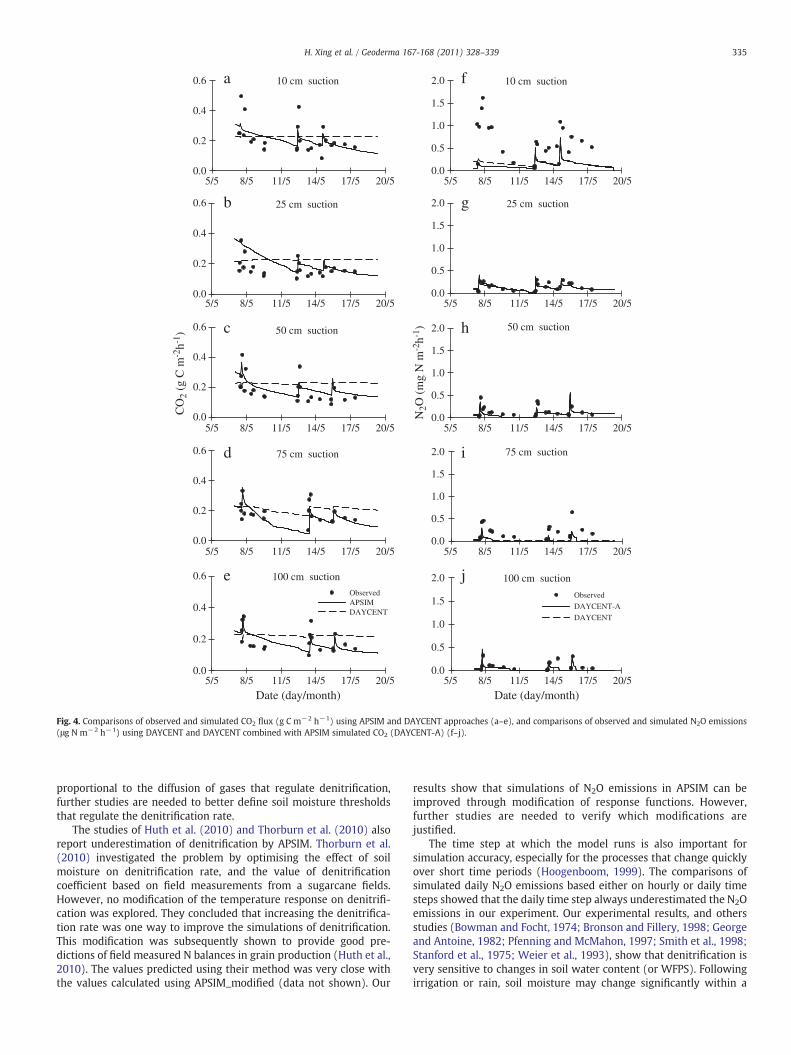
Heterotrophic respiration predicted using the DAYCENT denitrifi-cation sub-module did not show this sensitivity. The predicted valueswere insensitive to changes in soil moisture (Fig. 4a–e). In contrast,the simulated CO2 release by APSIM model agreed well with theobserved data, except that on some occasions the peak emissionswere under estimated (Fig. 4a–e). Comparison of the simulated andobserved time course of CO2 release show that the simulated peakswere 1–4.5 h ahead of what was measured (Table 2).
3.4. Nitrous oxide emissions from denitrification
The measured N2O fluxes responded directly to changes in WFPS(Fig. 3f–j). This is consistent with other studies (Li et al., 1992; Linnand Doran, 1984; Weier et al., 1993). The highest N2O fluxes wereobserved in 1–10 h after the peaks of WFPS (Table 2). The N2Opredictions using DAYCENT showed a very sensitive response to thechanges of WFPS (Fig. 4f–j). Despite the poor prediction of CO2, theDAYCENT model predicted the measured N2O fluxes reasonably wellusing the hourly time step, with the exception of 10 cm and 75 cmsuction treatments where the emissions were under predicted. Thiswas most obvious before the second irrigation in 10 cm suctiontreatment (Fig. 4f–j, DAYCENT), mainly because of the low N2Ofraction at the higher WFPS.
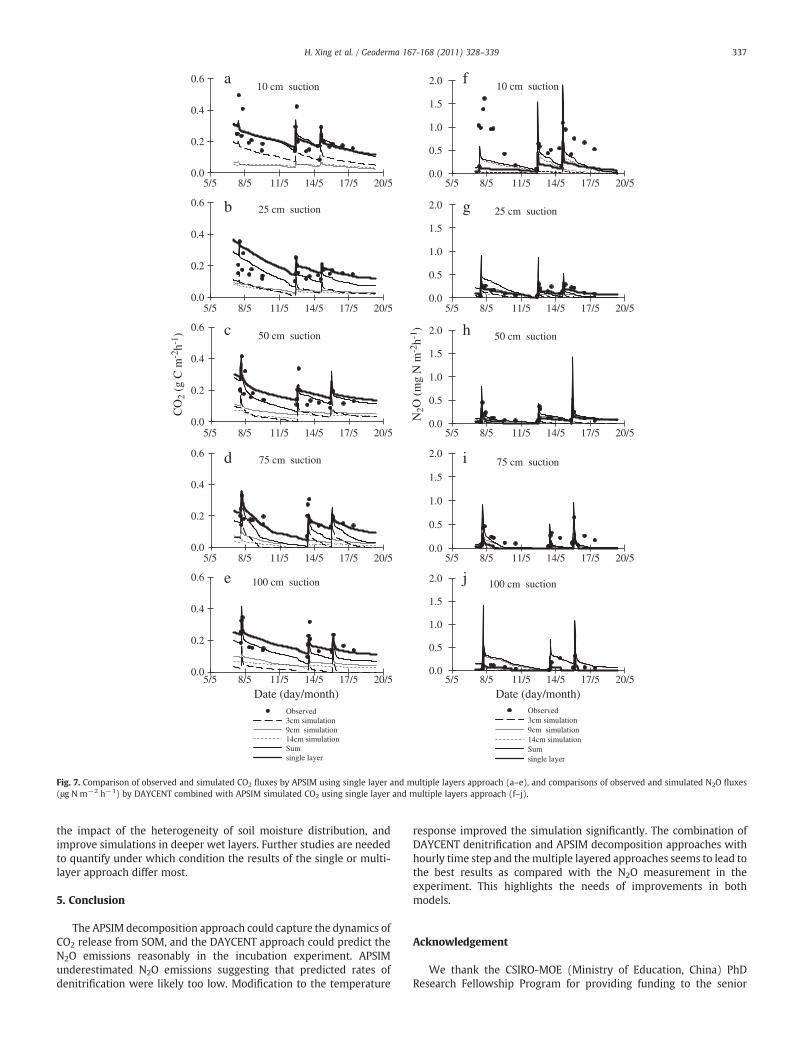
When the APSIM simulated denitrification rate, together with theN gas ratio from DAYCENT was used, N2O release was severelyunderestimated for all the treatments, and was zero for most ofincubation time period (Fig. 5a–e, APSIM_D). Assuming that the ratioof N2O:N2 used in DAYCENT is correct (as shown in DAYCENTsimulations in Fig. 5f–j), the underestimation of N2O release must be aresult of underestimation of the denitrification rate in APSIM.
Combining the APSIM-simulated CO2 release with the denitrifica-tion sub-module in (DAYCENT_A) resulted in no significant differencein the simulated N2O fluxes (Fig. 5f–i), implying that the N2O releasein the experiment was less regulated by carbon, but rather water. Theagreement between observed and simulated N2O release indicatedreasonable performance of the DAYCENT approach.
y = 0.9808x + 29.558R² = 0.6309
0
100
200
300
400
500
0 100 200 300 400 500
0 100 200 300 400 500
0 100 200 300 400 500
0 100 200 300 400 500
0 100 200 300 400 500
0
100
200
300
400
500
0
100
200
300
400
500
0
100
200
300
400
500
0
100
200
300
400
500
10 cm suction
y = 1.2807x - 17.313R² = 0.8421
25 cm suction
y = 0.9547x + 12.037R² = 0.7729
50 cm suction
y = 1.0928x - 22.377R² = 0.7206
75 cm suction
y = 1.1675x - 32.191R² = 0.9822
100 cm suction
Sim
ulat
ed d
rain
age
(cm
3 )
0.15
0.25
0.35
0.45
5/5 10/5 15/5 20/5
10 cm suctiona
0.15
0.25
0.35
0.45
5/5 10/5 15/5 20/5
0.15
0.25
0.35
0.45
5/5 10/5 15/5 20/5
0.15
0.25
0.35
0.45
5/5 10/5 15/5 20/5
0.15
0.25
0.35
0.45
5/5 10/5 15/5 20/5
25 cm suctionb
50 cm suctionc
75 cm suctiond
Date (day/month)
100 cm suction3cm 9cm
14cm
e
f
g
h
i
j
Wat
er c
onte
nt (
cm3 c
m-3
)
Observed drainage(cm3)
Fig. 1. Observed soil volumetric water content (cm3 cm−3) (a–e) and comparison of observed and simulated cumulative drainage (cm3) (f–j) for 10, 25, 50, 75, and 100 cm suctiontreatments.
332 H. Xing et al. / Geoderma 167-168 (2011) 328–339
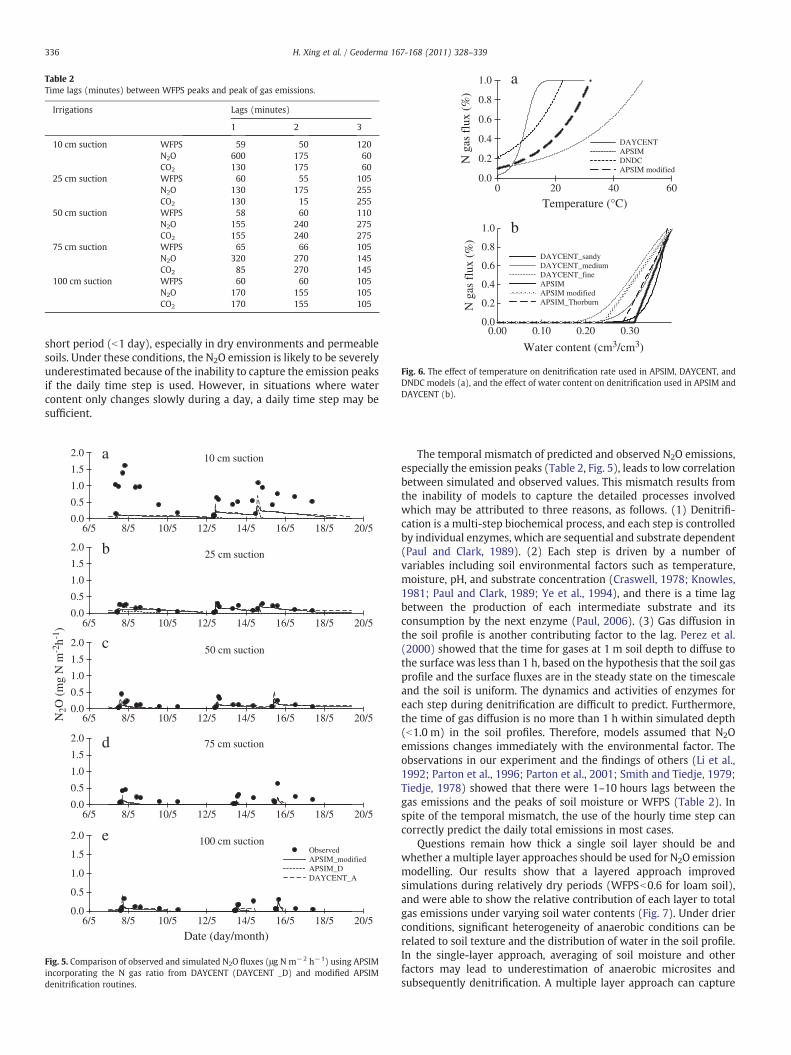
Comparison of the temperature and soil moisture responsefunctions of denitrification used in APSIM, DAYCENT and DNDCrevealed significant differences between models in terms of temper-ature and soil moisture limitation on denitrification (Fig. 6). At theexperiment temperature of 25 °C, DAYCENT and DNDC simulate atemperature factor of 1.0 (i.e., optimal temperature and no limitationto denitrification), while the APSIM approach gives a temperaturefactor of 0.3, leading to 70% reduction in denitrification as comparedto DAYCENT and DNDC (Fig. 6a). Several other studies also indicatedthat denitrification reaches a maximum rate at a temperature around25–35 °C (George and Antoine, 1982; Pfenning and McMahon, 1997;Saad and Conrad, 1993; Stanford et al., 1975). Furthermore, themoisture factor in APSIM, calculated based on soil water content,
drained upper limit and saturation water content, is also much lowerthan that calculated based on WFPS in DAYCENT (Fig. 6b). Otherstudies (Dobbie and Smith, 2001; Linn and Doran, 1984; Weier et al.,1993) showed that denitrification starts when WFPS reached 0.6 inloam soil, equivalent to a volumetric soil water content of 0.24 in ourexperiment. Based on this information, we modified the temperatureand soil moisture response functions for denitrification as shown inFig. 6 (APSIM_modified).
Fig. 5 shows the simulation results using the modified APSIMdenitrification routine (APSIM_modified). The results are significantlyimproved through changes made to the temperature and soilmoisture responses. They are similar to that simulated by theDAYCENT_A approaches (see Fig. 5). However, the observed N2O
0
100
200
300
0
100
200
300
0
100
200
300
0
100
200
300
0
100
200
300
6/5 8/5 10/5 12/5 14/5 16/5 18/5 20/5
6/5 8/5 10/5 12/5 14/5 16/5 18/5 20/5
6/5 8/5 10/5 12/5 14/5 16/5 18/5 20/5
6/5 8/5 10/5 12/5 14/5 16/5 18/5 20/5
6/5 8/5 10/5 12/5 14/5 16/5 18/5 20/5
10 cm suctiona
b
c
d
e
25 cm suction
50 cm suction
75 cm suction
Date (day/month)
100 cm suction
ObservationsSimulations
NO
3-N
(m
g L
-1)
Fig. 2. Comparison of observed (Marks) and simulated (lines) NO3 concentration(mg L−1) in the soil solution for suction treatments of (a) 10 cm, (b) 25 cm, (c) 50 cm,(d) 75 cm, and (e) 100 cm.
333H. Xing et al. / Geoderma 167-168 (2011) 328–339
emissions better agreed with the simulations using DAYCENT_A thanAPSIM_modified (Fig. 5).
3.5. Layered simulations on gas emissions
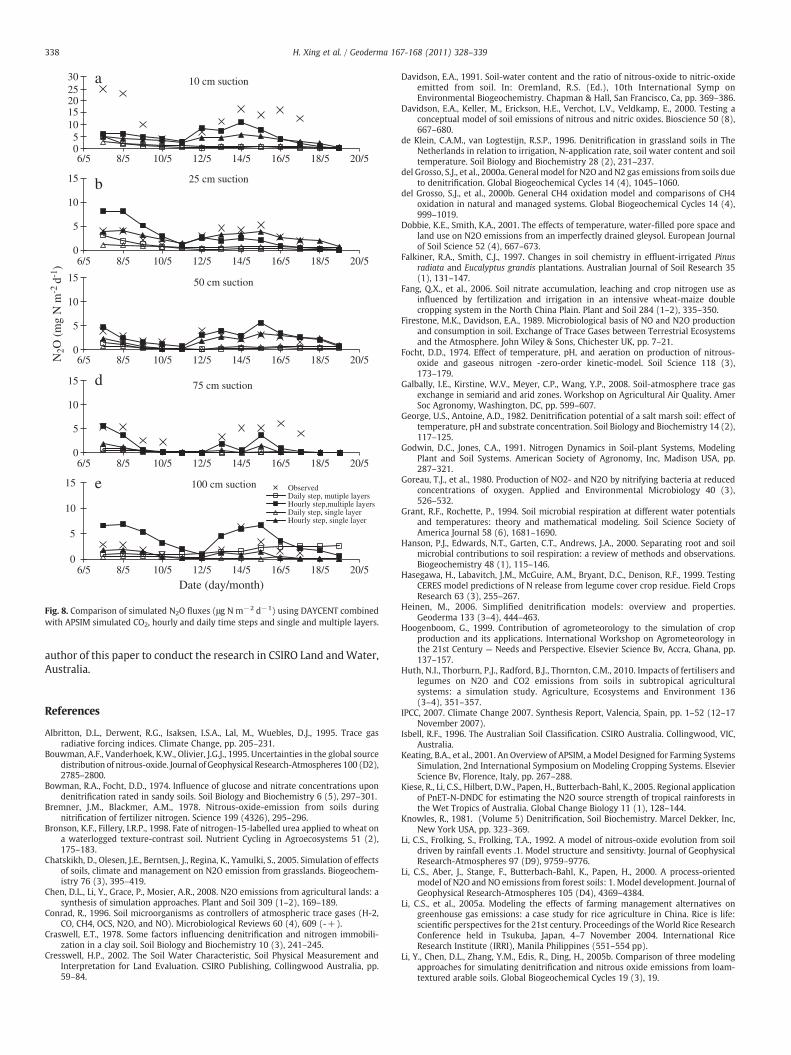
The results of the layered simulations showed that the sum of CO2
release from the three soil layers was generally lower and showedbetter agreement with the observations than that simulated using asingle layer, except at high soil moisture (10 cm suction treatment;Fig. 7a–e). This may be attributed to better representation of soil waterand soil properties with depth. The sum of CO2 fluxes also showed amore sensitive fluctuation with soil moisture as observed in theexperimental data. Based on the simulation results, the surface layer(0–6 cm soil profiles) contributed the largest proportion to CO2 fluxamount at high soil moisture (Fig. 7a). However, the contribution fromthe sub-layers increased at lower soil moisture contents (Fig. 7a–e).
The total N2O loss for the layered simulations was higher than thatsimulated using a single layer during the periods of relative high soilmoisture (WFPSN0.65), especially after irrigation (Fig. 7f–j). Inaddition, the layered simulation was able to predict the small N2Ofluxes at low soil moisture (WFPSb0.6), which the single layerapproach was unable to predict (Fig. 7f–j). The contributions of thedeeper soil layers to total N2O emissions increased with decreasingsoil moisture in the soil profiles, especially for the periods whensurface soil moisture decreased rapidly (Fig. 7f–j). However, bothapproaches underestimated the N2O fluxes under the 10 cm suctiontreatment (Fig. 7f).
3.6. Simulations with hourly and daily time steps
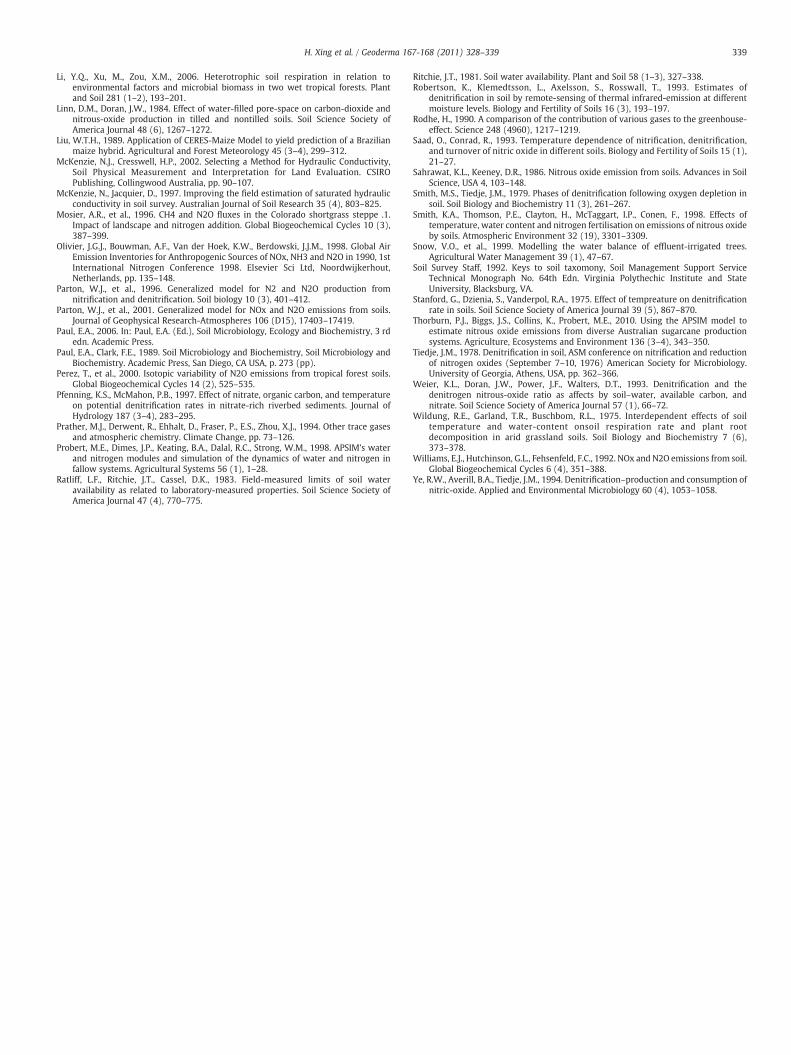
The predictions of N2O emissions using the DAYCENT_A approachwith hourly and daily time step are shown in Fig. 8. Nitrous oxideemissions simulated using the hourly time step were higher than thatsimulated with daily time steps, and agreed better with observations;N2O emissions simulated using daily time step underestimated themeasured data (Fig. 8a–e). In contrast, the DAYCENT_A hourlyapproach generally simulated the measured data. These resultsshow that simulations using a daily time step underestimated N2Oemissions, because of failure of the model to capture the effects of therapid changes on soil moisture that occurred following irrigation. TheN2O emissions were underestimated by single layer with hourly timestep with low soil moisture (Fig. 7f–j), implying that the single layerapproach may underestimate N2O emissions, especially when surfacesoil was very dry. However, the N2O emissions were overestimatedwith multiple layers in some occasions because the N2O emissionsfrom deeper layers were overestimated (Figs. 7 and 8). Overall,predicted daily total N2O emissions using the layered method andhourly time steps were better than the simulated values using a singlesoil layer and hourly time step. The use of multiple soil layers and anhourly time step may be better to predict N2O emissions, especiallyunder lower soil moisture conditions.
4. Discussion
The incubation experiment provided data on CO2 and N2Oemissions, which were used to evaluate the APSIM and DAYCENTmodels for the simulation of soil heterotrophic respiration and N2Oemissions due to denitrification. The good agreement betweenpredicted and measured CO2 from APSIM indicated that this modelcould reasonably simulate CO2 fluxes from soil organic matter (SOM)decomposition (Fig. 4a–e). However, the DAYCENT approach failed tocapture the dynamics of CO2 release as affected by the variations ofsoil moisture (Fig. 4a–e). In APSIM, CO2 emission from SOMdecomposition increases with soil water content; it reaches amaximum at DUL, and then decreases. In many cases, the value ofWFPS was about 0.70 when soil moisture reached DUL for the loamsoil (Fang et al., 2006; Liu, 1989; Ratliff et al., 1983; Ritchie, 1981), andsome studies showed that soil heterotrophic respiration was thelargest when WFPS is about 0.7 (Grant and Rochette, 1994; Li et al.,2006; Wildung et al., 1975). This is consistent with the results in ourincubation experiments and the APSIM simulation results. In DAY-CENT, the optimal WFPS for maximum soil heterotrophic respirationfor loam soil is around 0.6 (Figure 2a in Parton et al., 1996.), which islower than the value of 0.7 as discussed above.
The significant underestimation of N2O fluxes by the APSIMapproaches indicates that APSIM underestimates denitrification, anobservation that is consistent with the findings of Huth et al. (2010)and Thorburn et al. (2010). A comparison of the responses ofdenitrification to NO3, carbon, temperature and water conditionsindicated that the response of denitrification rate to soil temperatureand moisture were the two primary factors leading to the underes-timation of denitrification (Fig. 5). The growth of denitrifiers isassumed not to be limited in DNDC when the temperature is above22.5 °C (Li et al., 2000). In DAYCENT, denitrification rate reaches amaximum when the temperature is above 20 °C (Parton et al., 1996;Parton et al., 2001). Other studies also showed that denitrificationincreased significantly as the temperature increases above 10 °C, andreached more than 60% of its maximum value at 25 °C (Craswell,1978; de Klein and van Logtestijn, 1996; Pfenning and McMahon,1997; Saad and Conrad, 1993; Stanford et al., 1975), and onlyincreased slightly above 35 °C (Stanford et al., 1975). The improvedsimulation of N2O release through modification to APSIM based onabove mentioned data indicates a need to modify the temperatureresponse of denitrification in APSIM.
0.3
0.5
0.7
0.9
0.0
0.2
0.4
0.6
5/5 8/5 11/5 14/5 17/5 20/5
10 cm suctiona
b
c
d
e
f
g
h
i
j
0.3
0.5
0.7
0.9
0.0
0.2
0.4
0.6 25 cm suction
0.3
0.5
0.7
0.9
0.0
0.2
0.4
0.6 50 cm suction
0.3
0.5
0.7
0.9
0.0
0.2
0.4
0.6 75 cm suction
0.3
0.5
0.7
0.9
0.3
0.5
0.7
0.9
0.3
0.5
0.7
0.9
0.3
0.5
0.7
0.9
0.3
0.5
0.7
0.9
0.3
0.5
0.7
0.9
0.0
0.2
0.4
0.6
Date (day/month) Date (day/month)
100 cm suction
0.0
0.5
1.0
1.5
2.0
5/5 8/5 11/5 14/5 17/5 20/5
5/5 8/5 11/5 14/5 17/5 20/5 5/5 8/5 11/5 14/5 17/5 20/5
5/5 8/5 11/5 14/5 17/5 20/5 5/5 8/5 11/5 14/5 17/5 20/5
5/5 8/5 11/5 14/5 17/5 20/5 5/5 8/5 11/5 14/5 17/5 20/5
5/5 8/5 11/5 14/5 17/5 20/5 5/5 8/5 11/5 14/5 17/5 20/5
10 cm suction
0.0
0.5
1.0
1.5
2.0 25 cm suction
0.0
0.5
1.0
1.5
2.0 50 cm suction
0.0
0.5
1.0
1.5
2.0 75 cm suction
0.0
0.5
1.0
1.5
2.0 100 cm suction
CO2 —— 3cm 9cm -----14cm N2O —— 3cm 9cm -----14cm
WFPS
N2O
flu
x (m
g N
m-2
h-1)
CO
2 fl
ux (
g C
m-2
h-1)
WFPS
Fig. 3. Carbon dioxide and N2O fluxes (dots) measured in the experiment and calculated hourlyWFPS (lines) for suction treatments of (a, f) 10 cm, (b, g) 25 cm, (c, h) 50 cm, (d, i)75 cm, and (e, j) 100 cm.
334 H. Xing et al. / Geoderma 167-168 (2011) 328–339
There might also be problems in the soil moisture response ofdenitrification in APSIM. Previous studies showed that WFPS wasaround 0.70 for most loam soils when soil water content reached DUL.Denitrification could occur at water contents below DUL because ofanaerobic microsites, and occur atWFPS ranging from 0.55 to 0.90 (deKlein and van Logtestijn, 1996; Dobbie and Smith, 2001; Linn andDoran, 1984; Weier et al., 1993). In soils with high clay content,denitrification may occur at WFPS around 0.40 (Li et al., 2005b;Mosier et al., 1996; Parton et al., 1996; Robertson et al., 1993).
However, APSIM assumes that denitrification does not begin until thesoil moisture reaches DUL. This is another reason for the underesti-mation of denitrification by APSIM. The impact of soil moisture is oneof the most difficult aspects involved in the modelling of denitrifica-tion. For example, Heinen (2006) showed a large number of differentrelationships between denitrification rate and soil moisture content.The higher WFPS values in coarser soils likely demonstrate that poresize distribution is important in the formation of anaerobic conditionswhere denitrification can occur. While WFPS is not directly
0.0
0.5
1.0
1.5
2.0
5/5 8/5 11/5 14/5 17/5 20/5
10 cm suction
0.0
0.5
1.0
1.5
2.0 25 cm suction
0.0
0.5
1.0
1.5
2.0 50 cm suction
0.0
0.5
1.0
1.5
2.0 75 cm suction
0.0
0.5
1.0
1.5
2.0
Date (day/month)
100 cm suction
Observed
DAYCENT-A
DAYCENT
0.0
0.2
0.4
0.6
5/5 8/5 11/5 14/5 17/5 20/5
5/5 8/5 11/5 14/5 17/5 20/55/5 8/5 11/5 14/5 17/5 20/5
5/5 8/5 11/5 14/5 17/5 20/55/5 8/5 11/5 14/5 17/5 20/5
5/5 8/5 11/5 14/5 17/5 20/55/5 8/5 11/5 14/5 17/5 20/5
5/5 8/5 11/5 14/5 17/5 20/55/5 8/5 11/5 14/5 17/5 20/5
10 cm suctiona
b
c
d
e
f
g
h
i
j
0.0
0.2
0.4
0.6 25 cm suction
0.0
0.2
0.4
0.6 50 cm suction
0.0
0.2
0.4
0.6 75 cm suction
0.0
0.2
0.4
0.6
Date (day/month)
100 cm suction
ObservedAPSIMDAYCENT
N2O
(m
g N
m-2
h-1)
CO
2 (g
C m
-2h-1
)
Fig. 4. Comparisons of observed and simulated CO2 flux (g C m−2 h−1) using APSIM and DAYCENT approaches (a–e), and comparisons of observed and simulated N2O emissions(μg N m−2 h−1) using DAYCENT and DAYCENT combined with APSIM simulated CO2 (DAYCENT-A) (f–j).
335H. Xing et al. / Geoderma 167-168 (2011) 328–339
proportional to the diffusion of gases that regulate denitrification,further studies are needed to better define soil moisture thresholdsthat regulate the denitrification rate.
The studies of Huth et al. (2010) and Thorburn et al. (2010) alsoreport underestimation of denitrification by APSIM. Thorburn et al.(2010) investigated the problem by optimising the effect of soilmoisture on denitrification rate, and the value of denitrificationcoefficient based on field measurements from a sugarcane fields.However, no modification of the temperature response on denitrifi-cation was explored. They concluded that increasing the denitrifica-tion rate was one way to improve the simulations of denitrification.This modification was subsequently shown to provide good pre-dictions of field measured N balances in grain production (Huth et al.,2010). The values predicted using their method was very close withthe values calculated using APSIM_modified (data not shown). Our
results show that simulations of N2O emissions in APSIM can beimproved through modification of response functions. However,further studies are needed to verify which modifications arejustified.
The time step at which the model runs is also important forsimulation accuracy, especially for the processes that change quicklyover short time periods (Hoogenboom, 1999). The comparisons ofsimulated daily N2O emissions based either on hourly or daily timesteps showed that the daily time step always underestimated the N2Oemissions in our experiment. Our experimental results, and othersstudies (Bowman and Focht, 1974; Bronson and Fillery, 1998; Georgeand Antoine, 1982; Pfenning and McMahon, 1997; Smith et al., 1998;Stanford et al., 1975; Weier et al., 1993), show that denitrification isvery sensitive to changes in soil water content (or WFPS). Followingirrigation or rain, soil moisture may change significantly within a
0.0
0.2
0.4
0.6
0.8
1.0
0.00 0.10 0.20 0.30
N g
as f
lux
(%)
Water content (cm3/cm3)
DAYCENT_sandyDAYCENT_mediumDAYCENT_fineAPSIMAPSIM modifiedAPSIM_Thorburn
0.0
0.2
0.4
0.6
0.8
1.0
0 20 40 60
N g
as f
lux
(%)
Temperature (°C)
DAYCENTAPSIMDNDCAPSIM modified
a
b
Fig. 6. The effect of temperature on denitrification rate used in APSIM, DAYCENT, andDNDC models (a), and the effect of water content on denitrification used in APSIM andDAYCENT (b).
Table 2Time lags (minutes) between WFPS peaks and peak of gas emissions.
Irrigations Lags (minutes)
1 2 3
10 cm suction WFPS 59 50 120N2O 600 175 60CO2 130 175 60
25 cm suction WFPS 60 55 105N2O 130 175 255CO2 130 15 255
50 cm suction WFPS 58 60 110N2O 155 240 275CO2 155 240 275
75 cm suction WFPS 65 66 105N2O 320 270 145CO2 85 270 145
100 cm suction WFPS 60 60 105N2O 170 155 105CO2 170 155 105
336 H. Xing et al. / Geoderma 167-168 (2011) 328–339
short period (b1 day), especially in dry environments and permeablesoils. Under these conditions, the N2O emission is likely to be severelyunderestimated because of the inability to capture the emission peaksif the daily time step is used. However, in situations where watercontent only changes slowly during a day, a daily time step may besufficient.
0.0
0.5
1.0
1.5
2.0
6/5 8/5 10/5 12/5 14/5 16/5 18/5 20/5
6/5 8/5 10/5 12/5 14/5 16/5 18/5 20/5
6/5 8/5 10/5 12/5 14/5 16/5 18/5 20/5
6/5 8/5 10/5 12/5 14/5 16/5 18/5 20/5
6/5 8/5 10/5 12/5 14/5 16/5 18/5 20/5
10 cm suctiona
b
d
c
e
0.0
0.5
1.0
1.5
2.025 cm suction
0.0
0.5
1.0
1.5
2.050 cm suction
0.0
0.5
1.0
1.5
2.0 75 cm suction
0.0
0.5
1.0
1.5
2.0
Date (day/month)
100 cm suctionObservedAPSIM_modifiedAPSIM_DDAYCENT_A
N2O
(m
g N
m-2
h-1)
Fig. 5. Comparison of observed and simulated N2O fluxes (μg N m−2 h−1) using APSIMincorporating the N gas ratio from DAYCENT (DAYCENT _D) and modified APSIMdenitrification routines.
The temporal mismatch of predicted and observed N2O emissions,especially the emission peaks (Table 2, Fig. 5), leads to low correlationbetween simulated and observed values. This mismatch results fromthe inability of models to capture the detailed processes involvedwhich may be attributed to three reasons, as follows. (1) Denitrifi-cation is a multi-step biochemical process, and each step is controlledby individual enzymes, which are sequential and substrate dependent(Paul and Clark, 1989). (2) Each step is driven by a number ofvariables including soil environmental factors such as temperature,moisture, pH, and substrate concentration (Craswell, 1978; Knowles,1981; Paul and Clark, 1989; Ye et al., 1994), and there is a time lagbetween the production of each intermediate substrate and itsconsumption by the next enzyme (Paul, 2006). (3) Gas diffusion inthe soil profile is another contributing factor to the lag. Perez et al.(2000) showed that the time for gases at 1 m soil depth to diffuse tothe surface was less than 1 h, based on the hypothesis that the soil gasprofile and the surface fluxes are in the steady state on the timescaleand the soil is uniform. The dynamics and activities of enzymes foreach step during denitrification are difficult to predict. Furthermore,the time of gas diffusion is no more than 1 h within simulated depth(b1.0 m) in the soil profiles. Therefore, models assumed that N2Oemissions changes immediately with the environmental factor. Theobservations in our experiment and the findings of others (Li et al.,1992; Parton et al., 1996; Parton et al., 2001; Smith and Tiedje, 1979;Tiedje, 1978) showed that there were 1–10 hours lags between thegas emissions and the peaks of soil moisture or WFPS (Table 2). Inspite of the temporal mismatch, the use of the hourly time step cancorrectly predict the daily total emissions in most cases.
Questions remain how thick a single soil layer should be andwhether a multiple layer approaches should be used for N2O emissionmodelling. Our results show that a layered approach improvedsimulations during relatively dry periods (WFPSb0.6 for loam soil),and were able to show the relative contribution of each layer to totalgas emissions under varying soil water contents (Fig. 7). Under drierconditions, significant heterogeneity of anaerobic conditions can berelated to soil texture and the distribution of water in the soil profile.In the single-layer approach, averaging of soil moisture and otherfactors may lead to underestimation of anaerobic microsites andsubsequently denitrification. A multiple layer approach can capture
0.0
0.2
0.4
0.6
5/5 8/5 11/5 14/5 17/5 20/5
10 cm suctiona
c
d
b
e
f
h
i
g
j
0.0
0.2
0.4
0.625 cm suction
0.0
0.2
0.4
0.650 cm suction
0.0
0.2
0.4
0.675 cm suction
0.0
0.2
0.4
0.6 100 cm suction
Observed3cm simulation9cm simulation14cm simulationSumsingle layer
0.0
0.5
1.0
1.5
2.0
Date (day/month)Date (day/month)
100 cm suction
Observed3cm simulation9cm simulation14cm simulationSumsingle layer
0.0
0.5
1.0
1.5
2.0
5/5 8/5 11/5 14/5 17/5 20/5
5/5 8/5 11/5 14/5 17/5 20/5 5/5 8/5 11/5 14/5 17/5 20/5
5/5 8/5 11/5 14/5 17/5 20/5 5/5 8/5 11/5 14/5 17/5 20/5
5/5 8/5 11/5 14/5 17/5 20/5 5/5 8/5 11/5 14/5 17/5 20/5
5/5 8/5 11/5 14/5 17/5 20/5 5/5 8/5 11/5 14/5 17/5 20/5
10 cm suction
0.0
0.5
1.0
1.5
2.025 cm suction
0.0
0.5
1.0
1.5
2.0 50 cm suction
0.0
0.5
1.0
1.5
2.075 cm suction
N2O
(m
g N
m-2
h-1)
CO
2 (g
C m
-2h-1
)
Fig. 7. Comparison of observed and simulated CO2 fluxes by APSIM using single layer and multiple layers approach (a–e), and comparisons of observed and simulated N2O fluxes(μg N m−2 h−1) by DAYCENT combined with APSIM simulated CO2 using single layer and multiple layers approach (f–j).
337H. Xing et al. / Geoderma 167-168 (2011) 328–339
the impact of the heterogeneity of soil moisture distribution, andimprove simulations in deeper wet layers. Further studies are neededto quantify under which condition the results of the single or multi-layer approach differ most.
5. Conclusion
The APSIM decomposition approach could capture the dynamics ofCO2 release from SOM, and the DAYCENT approach could predict theN2O emissions reasonably in the incubation experiment. APSIMunderestimated N2O emissions suggesting that predicted rates ofdenitrification were likely too low. Modification to the temperature
response improved the simulation significantly. The combination ofDAYCENT denitrification and APSIM decomposition approaches withhourly time step and themultiple layered approaches seems to lead tothe best results as compared with the N2O measurement in theexperiment. This highlights the needs of improvements in bothmodels.
Acknowledgement
We thank the CSIRO-MOE (Ministry of Education, China) PhDResearch Fellowship Program for providing funding to the senior
05
101520
3025
6/5 8/5 10/5 12/5 14/5 16/5 18/5 20/5
6/5 8/5 10/5 12/5 14/5 16/5 18/5 20/5
6/5 8/5 10/5 12/5 14/5 16/5 18/5 20/5
6/5 8/5 10/5 12/5 14/5 16/5 18/5 20/5
6/5 8/5 10/5 12/5 14/5 16/5 18/5 20/5
10 cm suctiona
b
d
e
0
5
10
15
Date (day/month)
100 cm suction ObservedDaily step, mutiple layersHourly step,multiple layersDaily step, single layerHourly step, single layer
0
5
10
15 25 cm suction
0
5
10
15 50 cm suction
0
5
10
15 75 cm suction
N2O
(m
g N
m-2
d-1
)
Fig. 8. Comparison of simulated N2O fluxes (μg N m−2 d−1) using DAYCENT combinedwith APSIM simulated CO2, hourly and daily time steps and single and multiple layers.
338 H. Xing et al. / Geoderma 167-168 (2011) 328–339
author of this paper to conduct the research in CSIRO Land andWater,Australia.
References
Albritton, D.L., Derwent, R.G., Isaksen, I.S.A., Lal, M., Wuebles, D.J., 1995. Trace gasradiative forcing indices. Climate Change, pp. 205–231.
Bouwman, A.F., Vanderhoek, K.W., Olivier, J.G.J., 1995. Uncertainties in the global sourcedistribution of nitrous-oxide. Journal of Geophysical Research-Atmospheres 100 (D2),2785–2800.
Bowman, R.A., Focht, D.D., 1974. Influence of glucose and nitrate concentrations upondenitrification rated in sandy soils. Soil Biology and Biochemistry 6 (5), 297–301.
Bremner, J.M., Blackmer, A.M., 1978. Nitrous-oxide-emission from soils duringnitrification of fertilizer nitrogen. Science 199 (4326), 295–296.
Bronson, K.F., Fillery, I.R.P., 1998. Fate of nitrogen-15-labelled urea applied to wheat ona waterlogged texture-contrast soil. Nutrient Cycling in Agroecosystems 51 (2),175–183.
Chatskikh, D., Olesen, J.E., Berntsen, J., Regina, K., Yamulki, S., 2005. Simulation of effectsof soils, climate and management on N2O emission from grasslands. Biogeochem-istry 76 (3), 395–419.
Chen, D.L., Li, Y., Grace, P., Mosier, A.R., 2008. N2O emissions from agricultural lands: asynthesis of simulation approaches. Plant and Soil 309 (1–2), 169–189.
Conrad, R., 1996. Soil microorganisms as controllers of atmospheric trace gases (H-2,CO, CH4, OCS, N2O, and NO). Microbiological Reviews 60 (4), 609 (-+).
Craswell, E.T., 1978. Some factors influencing denitrification and nitrogen immobili-zation in a clay soil. Soil Biology and Biochemistry 10 (3), 241–245.
Cresswell, H.P., 2002. The Soil Water Characteristic, Soil Physical Measurement andInterpretation for Land Evaluation. CSIRO Publishing, Collingwood Australia, pp.59–84.
Davidson, E.A., 1991. Soil-water content and the ratio of nitrous-oxide to nitric-oxideemitted from soil. In: Oremland, R.S. (Ed.), 10th International Symp onEnvironmental Biogeochemistry. Chapman & Hall, San Francisco, Ca, pp. 369–386.
Davidson, E.A., Keller, M., Erickson, H.E., Verchot, L.V., Veldkamp, E., 2000. Testing aconceptual model of soil emissions of nitrous and nitric oxides. Bioscience 50 (8),667–680.
de Klein, C.A.M., van Logtestijn, R.S.P., 1996. Denitrification in grassland soils in TheNetherlands in relation to irrigation, N-application rate, soil water content and soiltemperature. Soil Biology and Biochemistry 28 (2), 231–237.
del Grosso, S.J., et al., 2000a. General model for N2O and N2 gas emissions from soils dueto denitrification. Global Biogeochemical Cycles 14 (4), 1045–1060.
del Grosso, S.J., et al., 2000b. General CH4 oxidation model and comparisons of CH4oxidation in natural and managed systems. Global Biogeochemical Cycles 14 (4),999–1019.
Dobbie, K.E., Smith, K.A., 2001. The effects of temperature, water-filled pore space andland use on N2O emissions from an imperfectly drained gleysol. European Journalof Soil Science 52 (4), 667–673.
Falkiner, R.A., Smith, C.J., 1997. Changes in soil chemistry in effluent-irrigated Pinusradiata and Eucalyptus grandis plantations. Australian Journal of Soil Research 35(1), 131–147.
Fang, Q.X., et al., 2006. Soil nitrate accumulation, leaching and crop nitrogen use asinfluenced by fertilization and irrigation in an intensive wheat-maize doublecropping system in the North China Plain. Plant and Soil 284 (1–2), 335–350.
Firestone, M.K., Davidson, E.A., 1989. Microbiological basis of NO and N2O productionand consumption in soil. Exchange of Trace Gases between Terrestrial Ecosystemsand the Atmosphere. John Wiley & Sons, Chichester UK, pp. 7–21.
Focht, D.D., 1974. Effect of temperature, pH, and aeration on production of nitrous-oxide and gaseous nitrogen -zero-order kinetic-model. Soil Science 118 (3),173–179.
Galbally, I.E., Kirstine, W.V., Meyer, C.P., Wang, Y.P., 2008. Soil-atmosphere trace gasexchange in semiarid and arid zones. Workshop on Agricultural Air Quality. AmerSoc Agronomy, Washington, DC, pp. 599–607.
George, U.S., Antoine, A.D., 1982. Denitrification potential of a salt marsh soil: effect oftemperature, pH and substrate concentration. Soil Biology and Biochemistry 14 (2),117–125.
Godwin, D.C., Jones, C.A., 1991. Nitrogen Dynamics in Soil-plant Systems, ModelingPlant and Soil Systems. American Society of Agronomy, Inc, Madison USA, pp.287–321.
Goreau, T.J., et al., 1980. Production of NO2- and N2O by nitrifying bacteria at reducedconcentrations of oxygen. Applied and Environmental Microbiology 40 (3),526–532.
Grant, R.F., Rochette, P., 1994. Soil microbial respiration at different water potentialsand temperatures: theory and mathematical modeling. Soil Science Society ofAmerica Journal 58 (6), 1681–1690.
Hanson, P.J., Edwards, N.T., Garten, C.T., Andrews, J.A., 2000. Separating root and soilmicrobial contributions to soil respiration: a review of methods and observations.Biogeochemistry 48 (1), 115–146.
Hasegawa, H., Labavitch, J.M., McGuire, A.M., Bryant, D.C., Denison, R.F., 1999. TestingCERES model predictions of N release from legume cover crop residue. Field CropsResearch 63 (3), 255–267.
Heinen, M., 2006. Simplified denitrification models: overview and properties.Geoderma 133 (3–4), 444–463.
Hoogenboom, G., 1999. Contribution of agrometeorology to the simulation of cropproduction and its applications. International Workshop on Agrometeorology inthe 21st Century — Needs and Perspective. Elsevier Science Bv, Accra, Ghana, pp.137–157.
Huth, N.I., Thorburn, P.J., Radford, B.J., Thornton, C.M., 2010. Impacts of fertilisers andlegumes on N2O and CO2 emissions from soils in subtropical agriculturalsystems: a simulation study. Agriculture, Ecosystems and Environment 136(3–4), 351–357.
IPCC, 2007. Climate Change 2007. Synthesis Report, Valencia, Spain, pp. 1–52 (12–17November 2007).
Isbell, R.F., 1996. The Australian Soil Classification. CSIRO Australia. Collingwood, VIC,Australia.
Keating, B.A., et al., 2001. An Overview of APSIM, aModel Designed for Farming SystemsSimulation, 2nd International Symposium on Modeling Cropping Systems. ElsevierScience Bv, Florence, Italy, pp. 267–288.
Kiese, R., Li, C.S., Hilbert, D.W., Papen, H., Butterbach-Bahl, K., 2005. Regional applicationof PnET-N-DNDC for estimating the N2O source strength of tropical rainforests inthe Wet Tropics of Australia. Global Change Biology 11 (1), 128–144.
Knowles, R., 1981. (Volume 5) Denitrification, Soil Biochemistry. Marcel Dekker, Inc,New York USA, pp. 323–369.
Li, C.S., Frolking, S., Frolking, T.A., 1992. A model of nitrous-oxide evolution from soildriven by rainfall events .1. Model structure and sensitivty. Journal of GeophysicalResearch-Atmospheres 97 (D9), 9759–9776.
Li, C.S., Aber, J., Stange, F., Butterbach-Bahl, K., Papen, H., 2000. A process-orientedmodel of N2O and NO emissions from forest soils: 1. Model development. Journal ofGeophysical Research-Atmospheres 105 (D4), 4369–4384.
Li, C.S., et al., 2005a. Modeling the effects of farming management alternatives ongreenhouse gas emissions: a case study for rice agriculture in China. Rice is life:scientific perspectives for the 21st century. Proceedings of theWorld Rice ResearchConference held in Tsukuba, Japan, 4–7 November 2004. International RiceResearch Institute (IRRI), Manila Philippines (551–554 pp).
Li, Y., Chen, D.L., Zhang, Y.M., Edis, R., Ding, H., 2005b. Comparison of three modelingapproaches for simulating denitrification and nitrous oxide emissions from loam-textured arable soils. Global Biogeochemical Cycles 19 (3), 19.
339H. Xing et al. / Geoderma 167-168 (2011) 328–339
Li, Y.Q., Xu, M., Zou, X.M., 2006. Heterotrophic soil respiration in relation toenvironmental factors and microbial biomass in two wet tropical forests. Plantand Soil 281 (1–2), 193–201.
Linn, D.M., Doran, J.W., 1984. Effect of water-filled pore-space on carbon-dioxide andnitrous-oxide production in tilled and nontilled soils. Soil Science Society ofAmerica Journal 48 (6), 1267–1272.
Liu, W.T.H., 1989. Application of CERES-Maize Model to yield prediction of a Brazilianmaize hybrid. Agricultural and Forest Meteorology 45 (3–4), 299–312.
McKenzie, N.J., Cresswell, H.P., 2002. Selecting a Method for Hydraulic Conductivity,Soil Physical Measurement and Interpretation for Land Evaluation. CSIROPublishing, Collingwood Australia, pp. 90–107.
McKenzie, N., Jacquier, D., 1997. Improving the field estimation of saturated hydraulicconductivity in soil survey. Australian Journal of Soil Research 35 (4), 803–825.
Mosier, A.R., et al., 1996. CH4 and N2O fluxes in the Colorado shortgrass steppe .1.Impact of landscape and nitrogen addition. Global Biogeochemical Cycles 10 (3),387–399.
Olivier, J.G.J., Bouwman, A.F., Van der Hoek, K.W., Berdowski, J.J.M., 1998. Global AirEmission Inventories for Anthropogenic Sources of NOx, NH3 and N2O in 1990, 1stInternational Nitrogen Conference 1998. Elsevier Sci Ltd, Noordwijkerhout,Netherlands, pp. 135–148.
Parton, W.J., et al., 1996. Generalized model for N2 and N2O production fromnitrification and denitrification. Soil biology 10 (3), 401–412.
Parton, W.J., et al., 2001. Generalized model for NOx and N2O emissions from soils.Journal of Geophysical Research-Atmospheres 106 (D15), 17403–17419.
Paul, E.A., 2006. In: Paul, E.A. (Ed.), Soil Microbiology, Ecology and Biochemistry, 3 rdedn. Academic Press.
Paul, E.A., Clark, F.E., 1989. Soil Microbiology and Biochemistry, Soil Microbiology andBiochemistry. Academic Press, San Diego, CA USA, p. 273 (pp).
Perez, T., et al., 2000. Isotopic variability of N2O emissions from tropical forest soils.Global Biogeochemical Cycles 14 (2), 525–535.
Pfenning, K.S., McMahon, P.B., 1997. Effect of nitrate, organic carbon, and temperatureon potential denitrification rates in nitrate-rich riverbed sediments. Journal ofHydrology 187 (3–4), 283–295.
Prather, M.J., Derwent, R., Ehhalt, D., Fraser, P., E.S., Zhou, X.J., 1994. Other trace gasesand atmospheric chemistry. Climate Change, pp. 73–126.
Probert, M.E., Dimes, J.P., Keating, B.A., Dalal, R.C., Strong, W.M., 1998. APSIM's waterand nitrogen modules and simulation of the dynamics of water and nitrogen infallow systems. Agricultural Systems 56 (1), 1–28.
Ratliff, L.F., Ritchie, J.T., Cassel, D.K., 1983. Field-measured limits of soil wateravailability as related to laboratory-measured properties. Soil Science Society ofAmerica Journal 47 (4), 770–775.
Ritchie, J.T., 1981. Soil water availability. Plant and Soil 58 (1–3), 327–338.Robertson, K., Klemedtsson, L., Axelsson, S., Rosswall, T., 1993. Estimates of
denitrification in soil by remote-sensing of thermal infrared-emission at differentmoisture levels. Biology and Fertility of Soils 16 (3), 193–197.
Rodhe, H., 1990. A comparison of the contribution of various gases to the greenhouse-effect. Science 248 (4960), 1217–1219.
Saad, O., Conrad, R., 1993. Temperature dependence of nitrification, denitrification,and turnover of nitric oxide in different soils. Biology and Fertility of Soils 15 (1),21–27.
Sahrawat, K.L., Keeney, D.R., 1986. Nitrous oxide emission from soils. Advances in SoilScience, USA 4, 103–148.
Smith, M.S., Tiedje, J.M., 1979. Phases of denitrification following oxygen depletion insoil. Soil Biology and Biochemistry 11 (3), 261–267.
Smith, K.A., Thomson, P.E., Clayton, H., McTaggart, I.P., Conen, F., 1998. Effects oftemperature, water content and nitrogen fertilisation on emissions of nitrous oxideby soils. Atmospheric Environment 32 (19), 3301–3309.
Snow, V.O., et al., 1999. Modelling the water balance of effluent-irrigated trees.Agricultural Water Management 39 (1), 47–67.
Soil Survey Staff, 1992. Keys to soil taxomony, Soil Management Support ServiceTechnical Monograph No. 64th Edn. Virginia Polythechic Institute and StateUniversity, Blacksburg, VA.
Stanford, G., Dzienia, S., Vanderpol, R.A., 1975. Effect of tempreature on denitrificationrate in soils. Soil Science Society of America Journal 39 (5), 867–870.
Thorburn, P.J., Biggs, J.S., Collins, K., Probert, M.E., 2010. Using the APSIM model toestimate nitrous oxide emissions from diverse Australian sugarcane productionsystems. Agriculture, Ecosystems and Environment 136 (3–4), 343–350.
Tiedje, J.M., 1978. Denitrification in soil, ASM conference on nitrification and reductionof nitrogen oxides (September 7–10, 1976) American Society for Microbiology.University of Georgia, Athens, USA, pp. 362–366.
Weier, K.L., Doran, J.W., Power, J.F., Walters, D.T., 1993. Denitrification and thedenitrogen nitrous-oxide ratio as affects by soil–water, available carbon, andnitrate. Soil Science Society of America Journal 57 (1), 66–72.
Wildung, R.E., Garland, T.R., Buschbom, R.L., 1975. Interdependent effects of soiltemperature and water-content onsoil respiration rate and plant rootdecomposition in arid grassland soils. Soil Biology and Biochemistry 7 (6),373–378.
Williams, E.J., Hutchinson, G.L., Fehsenfeld, F.C., 1992. NOx and N2O emissions from soil.Global Biogeochemical Cycles 6 (4), 351–388.
Ye, R.W., Averill, B.A., Tiedje, J.M., 1994. Denitrification–production and consumption ofnitric-oxide. Applied and Environmental Microbiology 60 (4), 1053–1058.
Related Documents