Ecological Modelling 187 (2005) 232–246 Modelling macroalgae using a 3D hydrodynamic-ecological model in a shallow, temperate estuary A.R. Trancoso ∗ , S. Saraiva, L. Fernandes, P. Pina, P. Leit˜ ao, R. Neves Maretec, Instituto Superior T´ ecnico, Av. Rovisco Pais, 1049-001 Lisboa, Portugal Received 26 June 2003; received in revised form 17 June 2004; accepted 27 January 2005 Available online 23 March 2005 Abstract This paper describes an application of MOHID modelling system to a shallow temperate coastal lagoon in Portugal’s western coast (Ria de Aveiro), simulating more than one primary producer, for a better understanding of the existing ecological dynamics and creating a useful tool to delineate land activities management practices. MOHID water quality model is driven by a physical transport model and simulates the dynamics and productivity of the two main primary producers (phytoplankton and macroalgae) as well as the cycling of nitrogen, carbon and oxygen in interaction with sediment and hydrodynamics. The integrated model is forced by exchanges with the Atlantic Ocean (tide), atmosphere, and by sediment and nutrient inputs from the upstream rivers and other discharges. Focus is given to the light parameterization of primary production, influence of hydro and sediment dynamics and to the prediction of seaweed beds distribution. The results obtained show that the model is better adjusted to field data with macroalgae’s simulation and that macroalgae can have an important role in primary production. Hydrodynamic conditions can be significant in the competition between the two primary producers, determining the predominant groups as well as their limiting factors. © 2005 Elsevier B.V. All rights reserved. Keywords: Modelling; Macroalgae; Phytoplankton; Nutrients; Sediment; Coastal lagoon 1. Introduction Estuaries are often eutrophic systems due the nutri- ent inputs from land activities and runoff. Since they are coastal waters, they benefit from low depths associated with high water mixing being characterized by high biological activity. They are often heavily populated ∗ Corresponding author. Tel.: +351 21 841 9436; fax: +351 21 421 1272. E-mail address: [email protected] (A.R. Trancoso). areas increasing the pressure on the quality status of waters and the need for proper management strategies (Valiela, 1995; Carr et al., 1997). Nutrient enrichment can alter the structure of the ecosystem and to deal with the consequences (high water turbidity, toxic/harmful algal blooms, shifts in species, etc.) one must first un- derstand the role of primary production at the system level (Mann, 1982; Cloern, 2001). Nutrient uptake during algal growth is the main pro- cess of nutrient removal from the water. Photosynthetic oxygen production during daylight and consumption 0304-3800/$ – see front matter © 2005 Elsevier B.V. All rights reserved. doi:10.1016/j.ecolmodel.2005.01.054

Welcome message from author
This document is posted to help you gain knowledge. Please leave a comment to let me know what you think about it! Share it to your friends and learn new things together.
Transcript

Ecological Modelling 187 (2005) 232–246
Modelling macroalgae using a 3D hydrodynamic-ecologicalmodel in a shallow, temperate estuary
A.R. Trancoso∗, S. Saraiva, L. Fernandes, P. Pina, P. Leitao, R. Neves
Maretec, Instituto Superior Tecnico, Av. Rovisco Pais, 1049-001 Lisboa, Portugal
Received 26 June 2003; received in revised form 17 June 2004; accepted 27 January 2005Available online 23 March 2005
Abstract
This paper describes an application of MOHID modelling system to a shallow temperate coastal lagoon in Portugal’s westerncoast (Ria de Aveiro), simulating more than one primary producer, for a better understanding of the existing ecological dynamicsand creating a useful tool to delineate land activities management practices. MOHID water quality model is driven by a physicaltransport model and simulates the dynamics and productivity of the two main primary producers (phytoplankton and macroalgae)as well as the cycling of nitrogen, carbon and oxygen in interaction with sediment and hydrodynamics. The integrated modelis forced by exchanges with the Atlantic Ocean (tide), atmosphere, and by sediment and nutrient inputs from the upstreamrivers and other discharges. Focus is given to the light parameterization of primary production, influence of hydro and sedimentdynamics and to the prediction of seaweed beds distribution. The results obtained show that the model is better adjusted tofield data with macroalgae’s simulation and that macroalgae can have an important role in primary production. Hydrodynamicc ps as wella©
K
1
ecwb
f
us ofegiest
l withfulun-tem
ro-etic
tion
0
onditions can be significant in the competition between the two primary producers, determining the predominant grous their limiting factors.2005 Elsevier B.V. All rights reserved.
eywords: Modelling; Macroalgae; Phytoplankton; Nutrients; Sediment; Coastal lagoon
. Introduction
Estuaries are often eutrophic systems due the nutri-nt inputs from land activities and runoff. Since they areoastal waters, they benefit from low depths associatedith high water mixing being characterized by highiological activity. They are often heavily populated
∗ Corresponding author. Tel.: +351 21 841 9436;ax: +351 21 421 1272.
E-mail address: [email protected] (A.R. Trancoso).
areas increasing the pressure on the quality statwaters and the need for proper management strat(Valiela, 1995; Carr et al., 1997). Nutrient enrichmencan alter the structure of the ecosystem and to deathe consequences (high water turbidity, toxic/harmalgal blooms, shifts in species, etc.) one must firstderstand the role of primary production at the syslevel (Mann, 1982; Cloern, 2001).
Nutrient uptake during algal growth is the main pcess of nutrient removal from the water. Photosynthoxygen production during daylight and consump
304-3800/$ – see front matter © 2005 Elsevier B.V. All rights reserved.doi:10.1016/j.ecolmodel.2005.01.054
A.R. Trancoso et al. / Ecological Modelling 187 (2005) 232–246 233
through respiration during the night can cause greatdiurnal variations in dissolved oxygen. When thereare high loads of nutrients, the system can becomeover-saturated with biomass producing oxygen andconsuming nutrients during the day, supporting greatpopulations of consumers and decomposers. By night,the oxygen is rapidly depleted creating anoxia condi-tions that disrupt the system resulting in massive fishkills under severe conditions. (Mann, 1982; Parsons etal., 1984; Little and Kitching, 1996)
However, estuary specificities like topography,climate and freshwater discharges modulate themagnitude of processes and their consequences (Dayet al., 1989). In deep estuaries, benthic productionmay have an insignificant contribution in relationto pelagic one, due to light limitation. However, inshallow areas with low mean residence times, benthicproducers like macroalgae can compete for nutrientswith phytoplankton that do not reside long enoughto use the nutrients carried from the upstream riversor discharges (Braunschweig et al., 2003). Sedimentdynamics has also a major role in productivity becauseit determines the underwater light availability andmacroalgae attachment conditions (Portela, 1996;Salomonsen et al., 1999).
Mathematical models that integrate hydrodynamic,sediment transport and major water quality processescan aid in developing hypotheses about the ecosystemdynamics and the possibility of simulating several sce-narios (Neves et al., 2000). MOHID is a modelling sys-t idelys ems:i 03;Pee parto Na-t -t ents cilD aterq eanw 3i thel wa-t
st-p pers
(Miranda et al., 2000; Neves et al., 2000) and thesis(Portela, 1996; Pina, 2001). Recently, macroalgae pro-ductivity was included in MOHID. Models that sim-ulate macroalgae dynamics are well reported in theliterature (Coffaro and Sfriso, 1997; Solidoro et al.,1997; Duarte and Ferreira, 1997; Alvera-Azcarate etal., 2003; Baird et al., 2003) each one with its ownspecificities. This paper presents MOHID’s primaryproduction parameterizations and its application to atemperate shallow coastal lagoon, to study the influ-ence of benthic macroalgae in the system behaviour,particularly in terms of phytoplankton and nutrient con-centrations. Focus is given to the light parameterizationof primary production, influence of hydro and sedimentdynamics and to the prediction of seaweed beds distri-bution.
2. Methodology
2.1. Site description and pre-processing
Ria de Aveiro (being the name commonly attributedto the Vouga Estuary) is a shallow temperate coastal la-goon with extensive intertidal areas. The Ria spreadsthrough nearly 45 km along the occidental coast of Por-tugal between Ovar and Mira (48◦38′N, 8◦44′W), anda maximum width of 10 km. The total covered area ofthe estuary changes between 83 km2 during spring tideand 66 km2 in neap tide (Dias et al., 1999). Averaged s area n 1a
els( r af an-n r inS an-n ainst hesel r intot TPs( areaw atede ion,r es-t all m-
em that integrates these features and has been wtudied and applied in different estuarine ecosystn Tagus estuary (Portela, 1996; Pina et al., 2000, 20ina, 2001; Braunschweig et al., 2003), in Guadianastuary (Cunha et al., 2000), in Douro estuary (Pinat al., 2003) and in all Portuguese estuaries asf an official study requested by the Portuguese
ional Water Institute (INAG, 2003) to determine waer quality status contributing to coastal managemupported by modelling (following European Counirectives 91/271/EEC and 91/676/EEC). The wuality model in MOHID has been also applied to ocaters such as in seamounts (Coelho and Santos, 200),
n the western Iberian continental shelf to optimizeevel of treatment of urban discharges into coastalers (Neves et al., 2000).
The modelling system with the pre- and porocessing tools is described by several pa
epths are in the order of 1 m, but maximum depthrtificially maintained by dredging varying betweend 4 m.
Ria de Aveiro is constituted by five main channseeFig. 1), and for each it is possible to consideresh water discharge: Vouga River in the Main Chel, Antua River in Murtosa Channel, Caster Rive.Jacinto/Ovar Channel, Boco River in Ilhavo Chel, and in Mira Channel there are some artificial dr
hat can be considered as an input of fresh water. Toads represent not only an entrance of fresh watehe estuary, but also an input of nutrients. The WWWaste Water Treatment Plants) existing in Riaere not considered in this study because the treffluents correspond to only 10% of the populatepresenting about 0.5% of the total input in theuary (INAG, 2003). Diffuse loads due to agriculturand lixiviation were considered negligible when co

234 A.R. Trancoso et al. / Ecological Modelling 187 (2005) 232–246
Fig. 1. Ria de Aveiro estuary (left: bathymetry and grid used in model simulations; right: location of Ria de Aveiro and its channels and discharges(in italics).
pared with the contribution of agricultural load carriedby rivers.
The hydrodynamic model was forced with a M2 tideat the ocean boundary and considering the annual av-erage discharge of each river shown inTable 1. Valuesin this table were obtained from statistical analysis oftime series records obtained in field stations by INAG(http://snirh.inag.pt).
The computation grid used was 326× 318 cellswide with a variable spatial step (minimum of 50 m)(see Fig. 1). This resolution was considered fineenough to describe the main physical processes in theRia, but is not time efficient for long term simulations.For this reason, the ecological processes, that needat least 1 year of simulation, were computed using adifferent grid, resulting from the spatial integration
Table 1River discharges in Ria de Aveiro used in hydrodynamic simulations(statistical analysis of time series records obtained in field stationsby INAG: http://snirh.inag.pt)
Vouga River 28.8 m3/sAntua River 6.3 m3/sCaster River 5 m3/sBoco River 2.5 m3/sArtificial drains in Mira Channel 3 m3/s
of bathymetry, merging 4× 4 grid cells into one. Thehydrodynamic conditions were recorded into a file,which can be used as input of the water propertiestransport model. This file was recorded along a M2tide period (12 h 25 min 30 s), being repeated alongthe water quality simulation period, decreasing thecomputational effort of the model.
Being a shallow estuary, Ria de Aveiro is charac-terized by the presence of several species of algae andvascular plants, commonly calledmolico, used by in-habitants in soil fertilizing. The simulation of all pho-tosynthetic organism species present in Ria de Aveiroby MOHID system is not possible yet, but the inclu-sion of macroalgae processes as an additional primaryproducer revealed some interesting results. In order tostudy the impact of macroalgae production in the overall water quality parameters, a comparison between thesimulations WITH and WITHOUT macroalgae will bepresented in this paper.
2.2. Water quality model
To model organic matter cycling, a set of conserva-tion equations are solved for the following state vari-ables: phytoplankton and macroalgae as primary pro-
A.R. Trancoso et al. / Ecological Modelling 187 (2005) 232–246 235
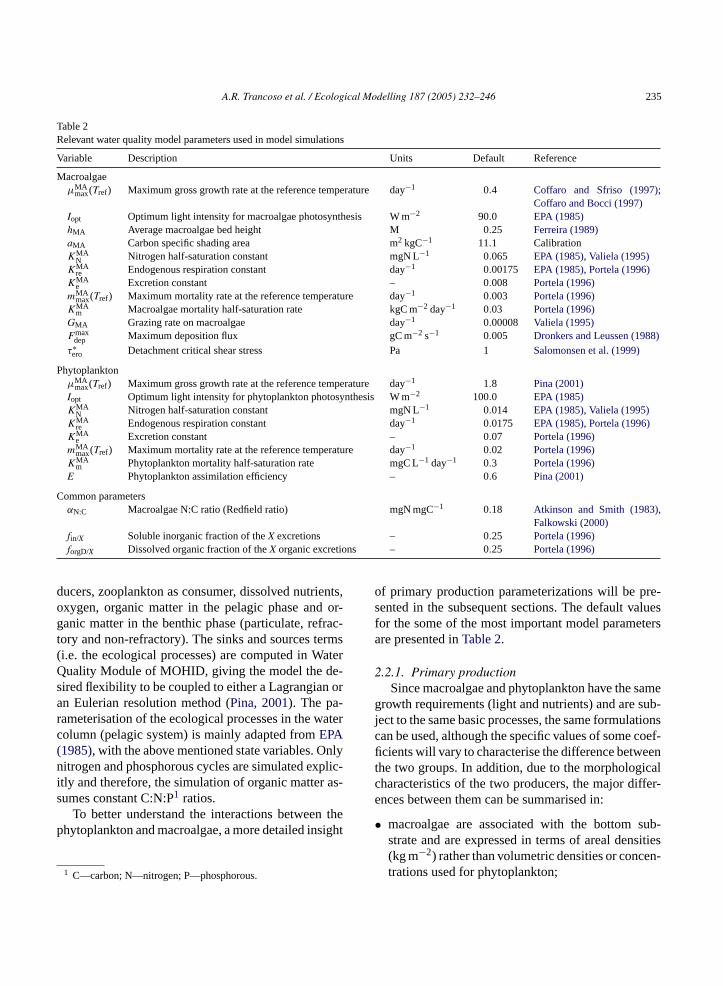
Table 2Relevant water quality model parameters used in model simulations
Variable Description Units Default Reference
MacroalgaeµMA
max(Tref) Maximum gross growth rate at the reference temperature day−1 0.4 Coffaro and Sfriso (1997);Coffaro and Bocci (1997)
Iopt Optimum light intensity for macroalgae photosynthesis W m−2 90.0 EPA (1985)hMA Average macroalgae bed height M 0.25 Ferreira (1989)aMA Carbon specific shading area m2 kgC−1 11.1 CalibrationKMA
N Nitrogen half-saturation constant mgN L−1 0.065 EPA (1985), Valiela (1995)KMA
re Endogenous respiration constant day−1 0.00175 EPA (1985), Portela (1996)KMA
e Excretion constant – 0.008 Portela (1996)mMA
max(Tref) Maximum mortality rate at the reference temperature day−1 0.003 Portela (1996)KMA
m Macroalgae mortality half-saturation rate kgC m−2 day−1 0.03 Portela (1996)GMA Grazing rate on macroalgae day−1 0.00008 Valiela (1995)Fmax
dep Maximum deposition flux gC m−2 s−1 0.005 Dronkers and Leussen (1988)τ∗
ero Detachment critical shear stress Pa 1 Salomonsen et al. (1999)
PhytoplanktonµMA
max(Tref) Maximum gross growth rate at the reference temperature day−1 1.8 Pina (2001)Iopt Optimum light intensity for phytoplankton photosynthesis W m−2 100.0 EPA (1985)KMA
N Nitrogen half-saturation constant mgN L−1 0.014 EPA (1985), Valiela (1995)KMA
re Endogenous respiration constant day−1 0.0175 EPA (1985), Portela (1996)KMA
e Excretion constant – 0.07 Portela (1996)mMA
max(Tref) Maximum mortality rate at the reference temperature day−1 0.02 Portela (1996)KMA
m Phytoplankton mortality half-saturation rate mgC L−1 day−1 0.3 Portela (1996)E Phytoplankton assimilation efficiency – 0.6 Pina (2001)
Common parametersαN:C Macroalgae N:C ratio (Redfield ratio) mgN mgC−1 0.18 Atkinson and Smith (1983),
Falkowski (2000)fin/X Soluble inorganic fraction of theX excretions – 0.25 Portela (1996)forgD/X Dissolved organic fraction of theX organic excretions – 0.25 Portela (1996)
ducers, zooplankton as consumer, dissolved nutrients,oxygen, organic matter in the pelagic phase and or-ganic matter in the benthic phase (particulate, refrac-tory and non-refractory). The sinks and sources terms(i.e. the ecological processes) are computed in WaterQuality Module of MOHID, giving the model the de-sired flexibility to be coupled to either a Lagrangian oran Eulerian resolution method (Pina, 2001). The pa-rameterisation of the ecological processes in the watercolumn (pelagic system) is mainly adapted fromEPA(1985), with the above mentioned state variables. Onlynitrogen and phosphorous cycles are simulated explic-itly and therefore, the simulation of organic matter as-sumes constant C:N:P1 ratios.
To better understand the interactions between thephytoplankton and macroalgae, a more detailed insight
1 C—carbon; N—nitrogen; P—phosphorous.
of primary production parameterizations will be pre-sented in the subsequent sections. The default valuesfor the some of the most important model parametersare presented inTable 2.
2.2.1. Primary productionSince macroalgae and phytoplankton have the same
growth requirements (light and nutrients) and are sub-ject to the same basic processes, the same formulationscan be used, although the specific values of some coef-ficients will vary to characterise the difference betweenthe two groups. In addition, due to the morphologicalcharacteristics of the two producers, the major differ-ences between them can be summarised in:
• macroalgae are associated with the bottom sub-strate and are expressed in terms of areal densities(kg m−2) rather than volumetric densities or concen-trations used for phytoplankton;
236 A.R. Trancoso et al. / Ecological Modelling 187 (2005) 232–246
• macroalgae do not have hydrodynamic transport;• macroalgae have no settling losses, but instead they
have additional losses by scouring from the bottomsubstrate, when bottom shear stress is high;
• macroalgae cannot firmly attach to the substrate inareas characterized by high positive and regular sed-imentation rates;
• emerged macroalgae are considered dormant, andthe productivity yield after re-immersion is not af-fected (Bell, 1993).
Following an exponential population growth model,where the temporal variation of biomass depends on theexistent biomass (Gotelli, 1995), one can say that pri-mary production of either phytoplankton or macroalgae(X) is governed by the equation:
∂ΦX
∂t= (µX − rX − exX −mX −GX)ΦX (1)
where t is the time (day),ΦX biomass (gC m−3 forphytoplankton; kgC m−2 for macroalgae) and the oth-ers can be seen as the net production rate, com-posed of:µX—the gross growth rate (day−1); rX—thetotal respiration rate (day−1); exX—the excretionrate (day−1); mX—the natural mortality rate (non-predatory) (day−1); GX—the grazing rate (day−1).
Facilitating result analysis, a simple parameteriza-tion was used for gross growth rate. It was defined asa function of water temperature, availability of photo-synthetic active radiation (PAR) and nutrients in thew ntsa oftena an-g ms.T d byst anst mi Thel umg n thef
µ
w -s te)
concentration (mgN L−1) andP the phosphorous con-centration (mgP L−1). Temperature and light limitationfactors follow an inhibition law and nutrient limitationfactors follow Michaelis–Menten saturation law. Lightlimitation factor formulation is based on an integra-tion of Steele photosynthetic response curve within thewater column (Pina, 2001) (see Eq.(7)).
The model assumes that growth rates are deter-mined by external concentrations of available nutrients.Therefore, nutrient composition of algal cells remainsconstant (fixed stoichiometry models) and growth andnutrient uptake rates are linearly dependent. Thus, theassumed C:N:P ratio is the Redfield ratio (106:16:1;average in marine environment) for macroalgae,phytoplankton, zooplankton and non-living organicmatter (Atkinson and Smith, 1983; Falkowski, 2000).Although stoichiometric cellular ratios depend onspecies, cell dimension, external and physiologicalconditions, most water quality models use the fixedstoichiometry approach because it simplifies themodel without prejudice of results, unless one wants tosimulate explicitly luxury uptake and nutrient storagein organisms (EPA, 1985; Valiela, 1995). Respiration(rXe ), excretion (exX) and mortality (mX) formulationscan be seen in EPA reference ecological model (EPA,1985). Grazing rate on macroalgae is computed byan imposed rate, while for phytoplankton its valuedepends on zooplankton dynamics (Pina, 2001).
2t is
a ktoni mn( d tos tom.T ter-m (2)t to-s theL ithd
I
w thze
ater column. The major growth limitation nutriere nitrogen and phosphorous because carbon isvailable in excess, and micronutrients like iron, manese, etc. are only limitative in oligotrophic systehe joint dependence of these variables is defineeparate growth limiting factors (functionψ in Eq.(2)),hat can range from a value of 0 to 1. A value of 1 mehe factor does not limit growth (i.e. light is at optimuntensity, nutrients are available in excess, etc.).imiting factors are then combined with a maximross growth rate at a reference temperature as i
ollowing equation:
X =µXmax(Tref) × Ψ (T ) × Ψ (I) × min(Ψ (N), Ψ (P))
(2)
hereT is the temperature (◦C), I the radiation intenity (W m−2), N the nitrogen (ammonia and nitra
.2.2. Light availabilityPhotosynthetic organisms only exist where ligh
ble to reach their cells. This means that phytoplans limited to the uppermost layers of the water coluphotic zone) and that benthic algae are confinehallow coastal waters where light reaches the bothe depth to which photosynthesis will occur is deined mainly by (1) the incident surface radiation,
he extinction of light in the water, and (3) the phoynthetic response to light. In the water column,ambert–Beer law defines the attenuation of light wepth:
(z) = I0 e−kz (3)
hereI (W m−2) is the light intensity at a given dep(m), I0 the light intensity at the surface andk the lightxtinction coefficient (m−1).
A.R. Trancoso et al. / Ecological Modelling 187 (2005) 232–246 237
The majority of the water quality models reviewedbyParsons et al. (1984), Rivera (1997)andPina (2001)compute the water column light extinction coefficientconsidering phytoplankton self-shading effect and par-ticulate suspended material, establishing the followingrelationship:
k = kw + kpCp + ksCs (4)
wherek andC stand for specific light extinction coef-ficient and concentration, and index w, p and s refer towater, phytoplankton’s chlorophyll and total suspendedsolid in the water column. The different set of parame-ters to be used should be based on local measurements(speciallyks) that allow the determination of the overallextinction coefficient. By applying the Lambert–Beerlaw, with a given extinction coefficient, one can com-pute the light available for photosynthesis at a givendepth.
In the benthic boundary layer, light will be attenu-ated mainly by macroalgalthalli that exert an intenseself-shading effect. The total amount of shading effectdepends of thethalli density, i.e., biomass density, aswell as on macroalgal morphology. Following this andrecognising that there are no sufficient in-depth studiesof macroalgae’s light needs, a somewhat different ap-proach must be undertaken for the light extinction co-efficient in the benthic boundary layer. The prevailinglight absorbing components will be macroalgaethalliand therefore the extinction coefficient must dependo ointd statev la-t
k
w o-e rea(hw dinga l-g lueswb nd1o cific
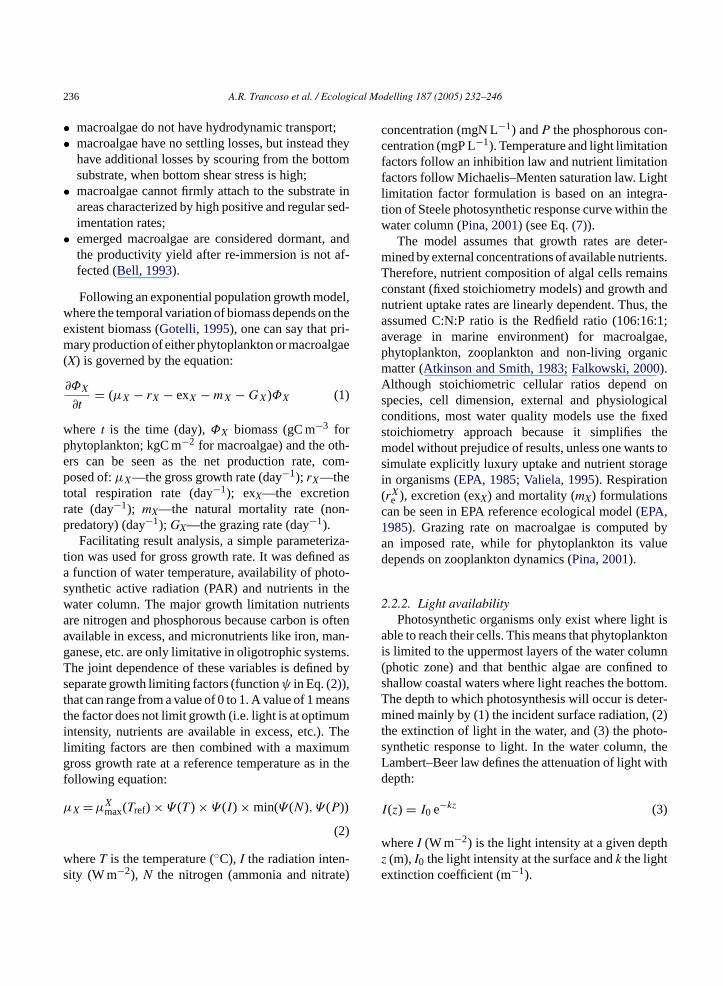
Fig. 2. Top and side views of sparse and dense macroalgae meadowsat different tide levels. Side view shows vertical orientation, top viewrepresents the area of overlap. AfterDennison (1979)in Fonseca andKenworthy (1987).
shading area accounts only for the surface area thatcauses shading, and thus, it will be lower than the to-tal surface area given by the values above. An averageheight for the macroalgal bed was used consideringthat the more elongated are macroalgae’s fronds, themore they will be subject to higher drag and frictionforces, increasing the probability of being broken ordetached from the substratum. When emerged, even ifonly partial, the self-shading effect is severely aggra-vated by the bending of the stipes (Fig. 2) and thus themultiplication by the second factor in Eq.(5).
2.2.3. Photosynthetic response to lightThe relationship of photosynthetic rate to light in-
tensity in macroalgae is similar to that found in single-celled algae (EPA, 1985; Valiela, 1995), and can bedefined with Steele photoinhibition law (Steele, 1962):
P
Pmax= I
Ioptexp
(1 − I
Iopt
)(6)
whereP is the photosynthetic rate at a given light in-tensity I (W m−2) for an organism that has a maxi-mum photosynthetic ratePmax at the optimal (saturat-ing) light intensityIopt. The light limitation factor usedin Eq.(2) is obtained by:
Ψ (I) =∫ h
0
P
Pmaxd (7)
n their biomass, height and morphology. The jependence of these factors can be adjusted to theariables of the model resulting in the following reionship:
MA = aabs×ΦMA
min(hMA , hWC)× max
(hMA
hWC,1
)(5)
herekMA is the macroalgae bed light extinction cfficient (m−1), aabs the carbon-specific shading am2 kgC−1),ΦMA the macroalgal biomass (kgC m−2),MA the macroalgal bed average height andhWC theater column height (m). The carbon-specific sharea depends on frond andthalli morphology. Macroaae’s carbon-specific absorption cross-section vaere determined byEnriquez et al. (1994)and usedy Baird et al. (2003)and vary between 11.1 a45.3 m2 kgC−1 (mean of 54.1 m2 kgC−1) dependingn the macroalgal morphology. The carbon-spe
238 A.R. Trancoso et al. / Ecological Modelling 187 (2005) 232–246
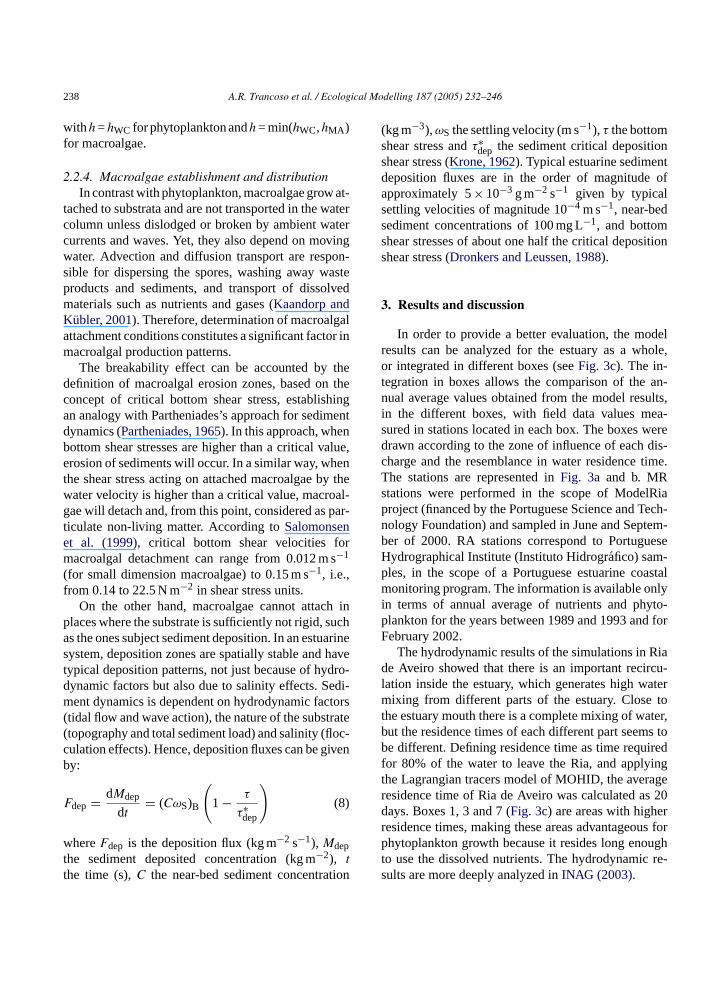
with h = hWC for phytoplankton andh = min(hWC,hMA )for macroalgae.
2.2.4. Macroalgae establishment and distributionIn contrast with phytoplankton, macroalgae grow at-
tached to substrata and are not transported in the watercolumn unless dislodged or broken by ambient watercurrents and waves. Yet, they also depend on movingwater. Advection and diffusion transport are respon-sible for dispersing the spores, washing away wasteproducts and sediments, and transport of dissolvedmaterials such as nutrients and gases (Kaandorp andKubler, 2001). Therefore, determination of macroalgalattachment conditions constitutes a significant factor inmacroalgal production patterns.
The breakability effect can be accounted by thedefinition of macroalgal erosion zones, based on theconcept of critical bottom shear stress, establishingan analogy with Partheniades’s approach for sedimentdynamics (Partheniades, 1965). In this approach, whenbottom shear stresses are higher than a critical value,erosion of sediments will occur. In a similar way, whenthe shear stress acting on attached macroalgae by thewater velocity is higher than a critical value, macroal-gae will detach and, from this point, considered as par-ticulate non-living matter. According toSalomonsenet al. (1999), critical bottom shear velocities formacroalgal detachment can range from 0.012 m s−1
(for small dimension macroalgae) to 0.15 m s−1, i.e.,from 0.14 to 22.5 N m−2 in shear stress units.
h inp ucha arines havet dro-d edi-m tors( rate( oc-c ivenb
F
wtt tion
(kg m−3),ωS the settling velocity (m s−1), τ the bottomshear stress andτ∗dep the sediment critical depositionshear stress (Krone, 1962). Typical estuarine sedimentdeposition fluxes are in the order of magnitude ofapproximately 5× 10⁻³ g m−2 s−1 given by typicalsettling velocities of magnitude 10−4 m s−1, near-bedsediment concentrations of 100 mg L−1, and bottomshear stresses of about one half the critical depositionshear stress (Dronkers and Leussen, 1988).
3. Results and discussion
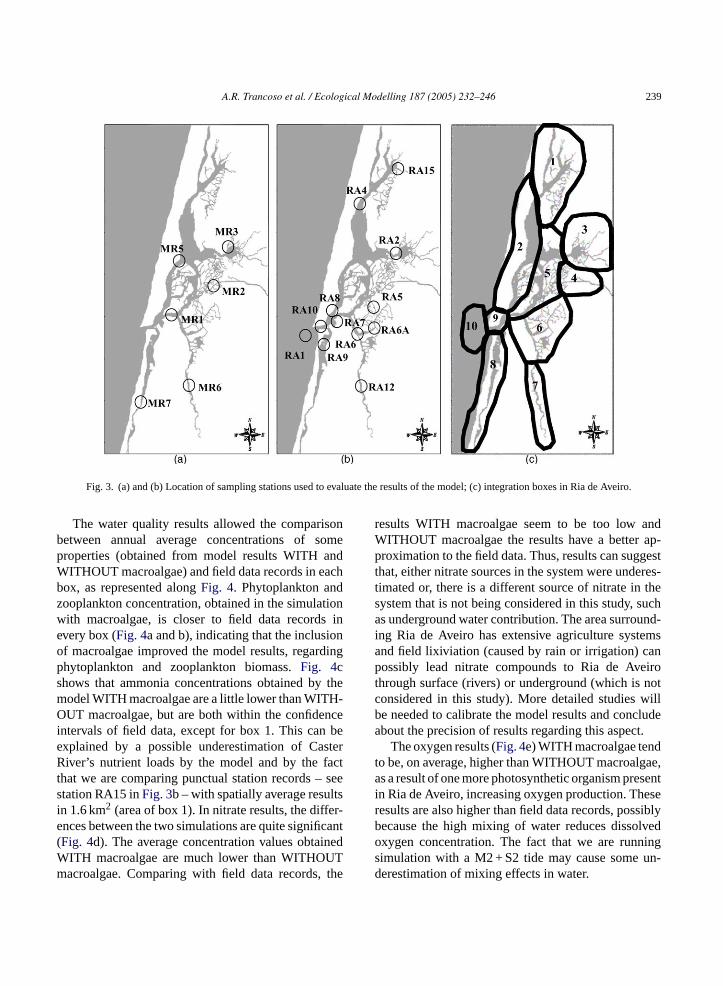
In order to provide a better evaluation, the modelresults can be analyzed for the estuary as a whole,or integrated in different boxes (seeFig. 3c). The in-tegration in boxes allows the comparison of the an-nual average values obtained from the model results,in the different boxes, with field data values mea-sured in stations located in each box. The boxes weredrawn according to the zone of influence of each dis-charge and the resemblance in water residence time.The stations are represented inFig. 3a and b. MRstations were performed in the scope of ModelRiaproject (financed by the Portuguese Science and Tech-nology Foundation) and sampled in June and Septem-ber of 2000. RA stations correspond to PortugueseHydrographical Institute (Instituto Hidrografico) sam-ples, in the scope of a Portuguese estuarine coastalmonitoring program. The information is available onlyi yto-p d forF
Riad rcu-l aterm tot ter,b s tob iredf ingt ager s 20d err us forp ught re-s
On the other hand, macroalgae cannot attaclaces where the substrate is sufficiently not rigid, ss the ones subject sediment deposition. In an estuystem, deposition zones are spatially stable andypical deposition patterns, not just because of hyynamic factors but also due to salinity effects. Sent dynamics is dependent on hydrodynamic fac
tidal flow and wave action), the nature of the substtopography and total sediment load) and salinity (flulation effects). Hence, deposition fluxes can be gy:
dep = dMdep
dt= (CωS)B
(1 − τ
τ∗dep
)(8)
hereFdep is the deposition flux (kg m−2 s−1), Mdephe sediment deposited concentration (kg m−2), the time (s),C the near-bed sediment concentra
n terms of annual average of nutrients and phlankton for the years between 1989 and 1993 anebruary 2002.
The hydrodynamic results of the simulations ine Aveiro showed that there is an important reci
ation inside the estuary, which generates high wixing from different parts of the estuary. Close
he estuary mouth there is a complete mixing of waut the residence times of each different part seeme different. Defining residence time as time requ
or 80% of the water to leave the Ria, and applyhe Lagrangian tracers model of MOHID, the averesidence time of Ria de Aveiro was calculated aays. Boxes 1, 3 and 7 (Fig. 3c) are areas with highesidence times, making these areas advantageohytoplankton growth because it resides long eno
o use the dissolved nutrients. The hydrodynamicults are more deeply analyzed inINAG (2003).
A.R. Trancoso et al. / Ecological Modelling 187 (2005) 232–246 239
Fig. 3. (a) and (b) Location of sampling stations used to evaluate the results of the model; (c) integration boxes in Ria de Aveiro.
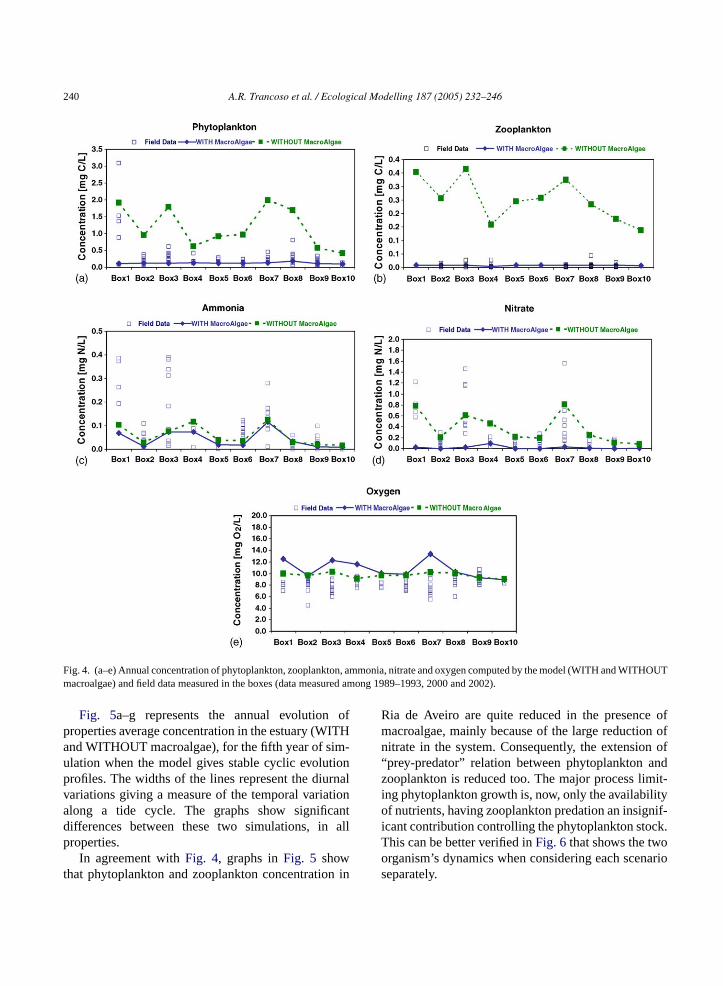
The water quality results allowed the comparisonbetween annual average concentrations of someproperties (obtained from model results WITH andWITHOUT macroalgae) and field data records in eachbox, as represented alongFig. 4. Phytoplankton andzooplankton concentration, obtained in the simulationwith macroalgae, is closer to field data records inevery box (Fig. 4a and b), indicating that the inclusionof macroalgae improved the model results, regardingphytoplankton and zooplankton biomass.Fig. 4cshows that ammonia concentrations obtained by themodel WITH macroalgae are a little lower than WITH-OUT macroalgae, but are both within the confidenceintervals of field data, except for box 1. This can beexplained by a possible underestimation of CasterRiver’s nutrient loads by the model and by the factthat we are comparing punctual station records – seestation RA15 inFig. 3b – with spatially average resultsin 1.6 km2 (area of box 1). In nitrate results, the differ-ences between the two simulations are quite significant(Fig. 4d). The average concentration values obtainedWITH macroalgae are much lower than WITHOUTmacroalgae. Comparing with field data records, the
results WITH macroalgae seem to be too low andWITHOUT macroalgae the results have a better ap-proximation to the field data. Thus, results can suggestthat, either nitrate sources in the system were underes-timated or, there is a different source of nitrate in thesystem that is not being considered in this study, suchas underground water contribution. The area surround-ing Ria de Aveiro has extensive agriculture systemsand field lixiviation (caused by rain or irrigation) canpossibly lead nitrate compounds to Ria de Aveirothrough surface (rivers) or underground (which is notconsidered in this study). More detailed studies willbe needed to calibrate the model results and concludeabout the precision of results regarding this aspect.
The oxygen results (Fig. 4e) WITH macroalgae tendto be, on average, higher than WITHOUT macroalgae,as a result of one more photosynthetic organism presentin Ria de Aveiro, increasing oxygen production. Theseresults are also higher than field data records, possiblybecause the high mixing of water reduces dissolvedoxygen concentration. The fact that we are runningsimulation with a M2 + S2 tide may cause some un-derestimation of mixing effects in water.
240 A.R. Trancoso et al. / Ecological Modelling 187 (2005) 232–246
Fig. 4. (a–e) Annual concentration of phytoplankton, zooplankton, ammonia, nitrate and oxygen computed by the model (WITH and WITHOUTmacroalgae) and field data measured in the boxes (data measured among 1989–1993, 2000 and 2002).
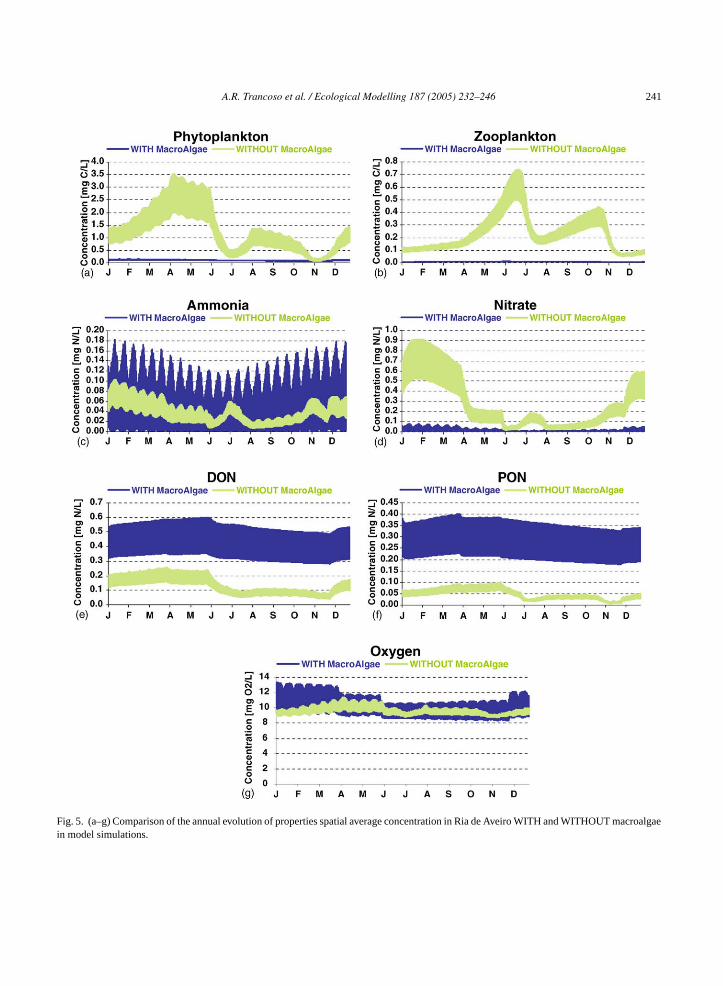
Fig. 5a–g represents the annual evolution ofproperties average concentration in the estuary (WITHand WITHOUT macroalgae), for the fifth year of sim-ulation when the model gives stable cyclic evolutionprofiles. The widths of the lines represent the diurnalvariations giving a measure of the temporal variationalong a tide cycle. The graphs show significantdifferences between these two simulations, in allproperties.
In agreement withFig. 4, graphs inFig. 5 showthat phytoplankton and zooplankton concentration in
Ria de Aveiro are quite reduced in the presence ofmacroalgae, mainly because of the large reduction ofnitrate in the system. Consequently, the extension of“prey-predator” relation between phytoplankton andzooplankton is reduced too. The major process limit-ing phytoplankton growth is, now, only the availabilityof nutrients, having zooplankton predation an insignif-icant contribution controlling the phytoplankton stock.This can be better verified inFig. 6that shows the twoorganism’s dynamics when considering each scenarioseparately.
A.R. Trancoso et al. / Ecological Modelling 187 (2005) 232–246 241
Fig. 5. (a–g) Comparison of the annual evolution of properties spatial average concentration in Ria de Aveiro WITH and WITHOUT macroalgaein model simulations.
242 A.R. Trancoso et al. / Ecological Modelling 187 (2005) 232–246
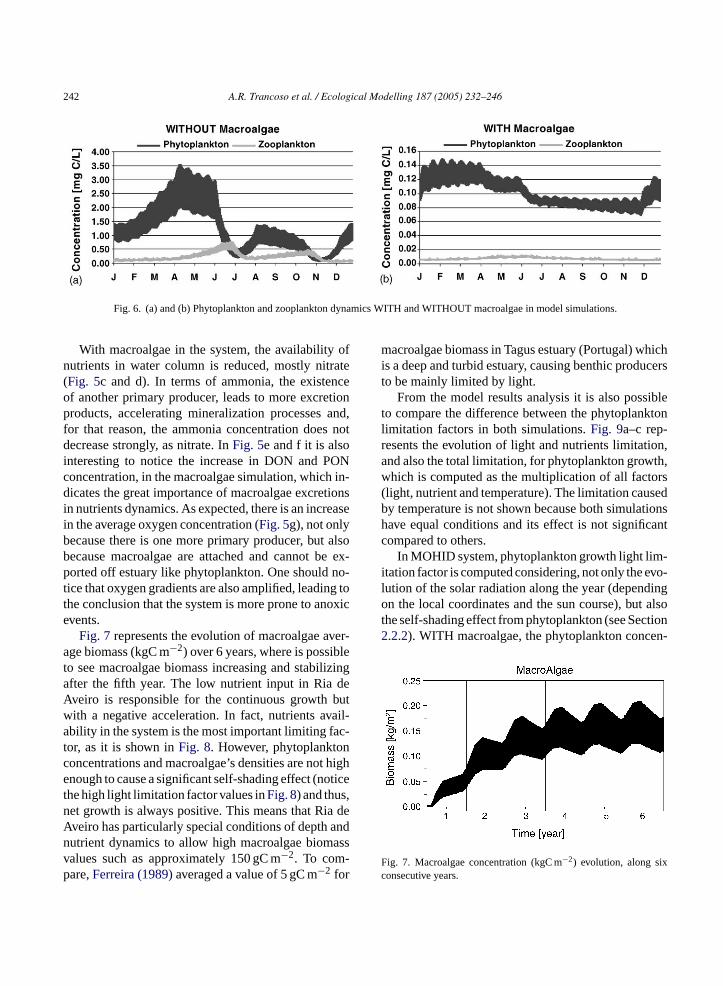
Fig. 6. (a) and (b) Phytoplankton and zooplankton dynamics WITH and WITHOUT macroalgae in model simulations.
With macroalgae in the system, the availability ofnutrients in water column is reduced, mostly nitrate(Fig. 5c and d). In terms of ammonia, the existenceof another primary producer, leads to more excretionproducts, accelerating mineralization processes and,for that reason, the ammonia concentration does notdecrease strongly, as nitrate. InFig. 5e and f it is alsointeresting to notice the increase in DON and PONconcentration, in the macroalgae simulation, which in-dicates the great importance of macroalgae excretionsin nutrients dynamics. As expected, there is an increasein the average oxygen concentration (Fig. 5g), not onlybecause there is one more primary producer, but alsobecause macroalgae are attached and cannot be ex-ported off estuary like phytoplankton. One should no-tice that oxygen gradients are also amplified, leading tothe conclusion that the system is more prone to anoxicevents.
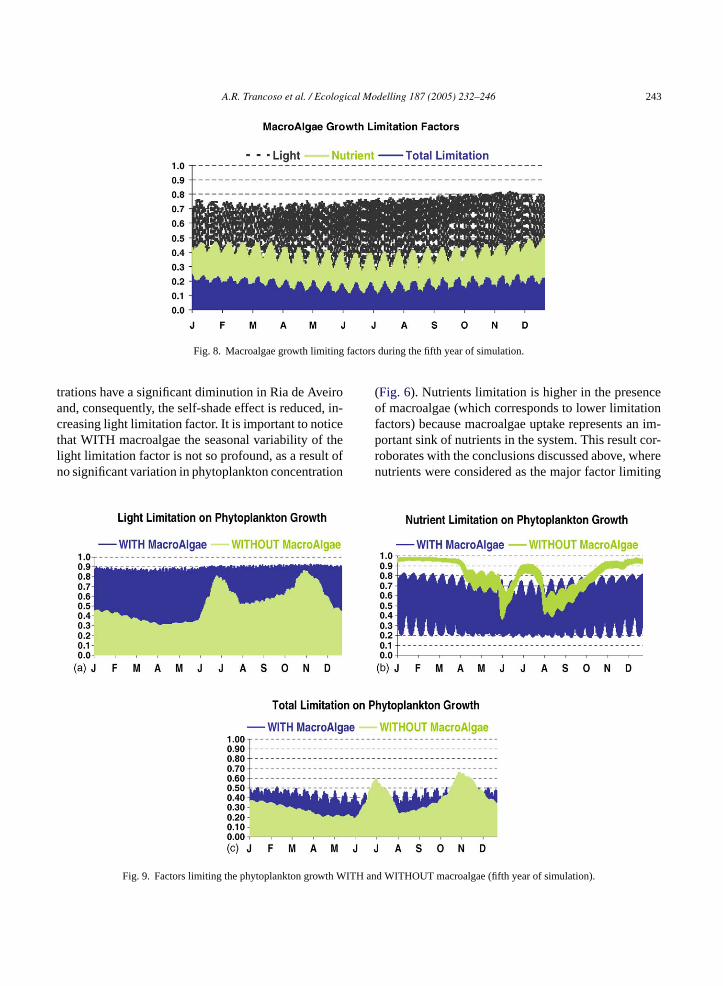
Fig. 7 represents the evolution of macroalgae aver-age biomass (kgC m−2) over 6 years, where is possibleto see macroalgae biomass increasing and stabilizingafter the fifth year. The low nutrient input in Ria deAveiro is responsible for the continuous growth butwith a negative acceleration. In fact, nutrients avail-ability in the system is the most important limiting fac-tor, as it is shown inFig. 8. However, phytoplanktonconcentrations and macroalgae’s densities are not highenough to cause a significant self-shading effect (noticethe high light limitation factor values inFig. 8) and thus,net growth is always positive. This means that Ria deA andn assvp
macroalgae biomass in Tagus estuary (Portugal) whichis a deep and turbid estuary, causing benthic producersto be mainly limited by light.
From the model results analysis it is also possibleto compare the difference between the phytoplanktonlimitation factors in both simulations.Fig. 9a–c rep-resents the evolution of light and nutrients limitation,and also the total limitation, for phytoplankton growth,which is computed as the multiplication of all factors(light, nutrient and temperature). The limitation causedby temperature is not shown because both simulationshave equal conditions and its effect is not significantcompared to others.
In MOHID system, phytoplankton growth light lim-itation factor is computed considering, not only the evo-lution of the solar radiation along the year (dependingon the local coordinates and the sun course), but alsothe self-shading effect from phytoplankton (see Section2.2.2). WITH macroalgae, the phytoplankton concen-
F xc
veiro has particularly special conditions of depthutrient dynamics to allow high macroalgae biomalues such as approximately 150 gC m−2. To com-are,Ferreira (1989)averaged a value of 5 gC m−2 for
ig. 7. Macroalgae concentration (kgC m−2) evolution, along sionsecutive years.
A.R. Trancoso et al. / Ecological Modelling 187 (2005) 232–246 243
Fig. 8. Macroalgae growth limiting factors during the fifth year of simulation.
trations have a significant diminution in Ria de Aveiroand, consequently, the self-shade effect is reduced, in-creasing light limitation factor. It is important to noticethat WITH macroalgae the seasonal variability of thelight limitation factor is not so profound, as a result ofno significant variation in phytoplankton concentration
(Fig. 6). Nutrients limitation is higher in the presenceof macroalgae (which corresponds to lower limitationfactors) because macroalgae uptake represents an im-portant sink of nutrients in the system. This result cor-roborates with the conclusions discussed above, wherenutrients were considered as the major factor limiting
WITH
Fig. 9. Factors limiting the phytoplankton growth and WITHOUT macroalgae (fifth year of simulation).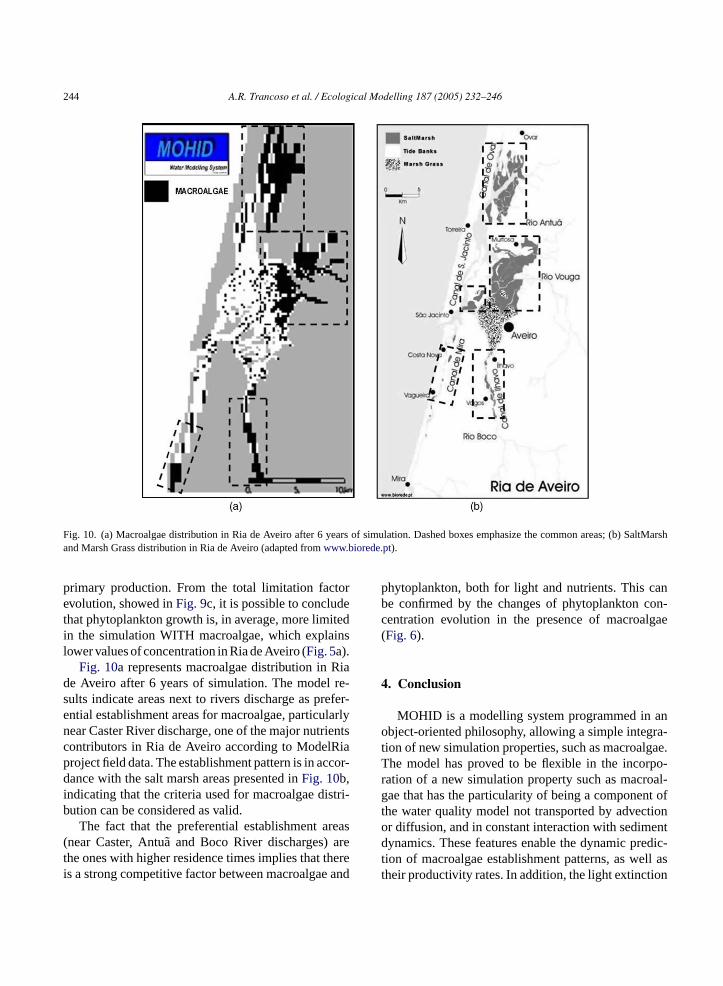
244 A.R. Trancoso et al. / Ecological Modelling 187 (2005) 232–246
Fig. 10. (a) Macroalgae distribution in Ria de Aveiro after 6 years of simulation. Dashed boxes emphasize the common areas; (b) SaltMarshand Marsh Grass distribution in Ria de Aveiro (adapted fromwww.biorede.pt).
primary production. From the total limitation factorevolution, showed inFig. 9c, it is possible to concludethat phytoplankton growth is, in average, more limitedin the simulation WITH macroalgae, which explainslower values of concentration in Ria de Aveiro (Fig. 5a).
Fig. 10a represents macroalgae distribution in Riade Aveiro after 6 years of simulation. The model re-sults indicate areas next to rivers discharge as prefer-ential establishment areas for macroalgae, particularlynear Caster River discharge, one of the major nutrientscontributors in Ria de Aveiro according to ModelRiaproject field data. The establishment pattern is in accor-dance with the salt marsh areas presented inFig. 10b,indicating that the criteria used for macroalgae distri-bution can be considered as valid.
The fact that the preferential establishment areas(near Caster, Antua and Boco River discharges) arethe ones with higher residence times implies that thereis a strong competitive factor between macroalgae and
phytoplankton, both for light and nutrients. This canbe confirmed by the changes of phytoplankton con-centration evolution in the presence of macroalgae(Fig. 6).
4. Conclusion
MOHID is a modelling system programmed in anobject-oriented philosophy, allowing a simple integra-tion of new simulation properties, such as macroalgae.The model has proved to be flexible in the incorpo-ration of a new simulation property such as macroal-gae that has the particularity of being a component ofthe water quality model not transported by advectionor diffusion, and in constant interaction with sedimentdynamics. These features enable the dynamic predic-tion of macroalgae establishment patterns, as well astheir productivity rates. In addition, the light extinction
A.R. Trancoso et al. / Ecological Modelling 187 (2005) 232–246 245
formulation used for macroalgae enables the possibil-ity of simulating a wide range of macroalgal morpho-logic behavioural patterns. The simple and systematicparameterizations used in the water quality model as-sociated with the format of model results (analysis ofpunctual or spatially integrated results) allow an easycalibration of model results.
In MOHID application to Ria de Aveiro, the re-sults show that the model is better adjusted to fielddata with macroalgae simulation and that they canhave a significant role in primary production. In thepresence of macroalgae, phytoplankton biomass pro-duction inside Ria de Aveiro was significantly re-duced and the total photosynthetic biomass is mainlycomprised by macroalgae. The main reason for thisgreater development of macroalgae, instead of phy-toplankton, is the fact that the macroalgae stay in-side the estuary for longer time, allowing them toconsume more nutrients and produce more biomass,while phytoplankton depends on the transport of wa-ter trough Ria de Aveiro and, after 20 days (accord-ing to the model results) all phytoplankton inside theestuary will be washout to the ocean. These resultsshow that macroalgae cause a shift in phytoplanktongrowth limitation. Instead of being limited by zoo-plankton, phytoplankton is mainly limited by nutri-ents, due to uptake by macroalgae. This reduction intheir biomass allied to an insufficient residence time,decreases the self-shading effect and eliminates lightas one of the limitations to primary production in thise
bet , of-f rios,i
A
orko ute( Es-t eseS e ac-k lingw orsw ny-m
Appendix A. Supplementary data
Supplementary data associated with this articlecan be found, in the online version, at10.1016/j.ecolmodel.2005.01.054.
References
Alvera-Azcarate, A., Ferreira, J.G., Nunes, J.P., 2003. Modellingeutrophication in mesotidal and macrotidal estuaries. The role ofintertidal seaweeds. Est. Coast. Shelf. Sci. 57, 715–724.
Atkinson, M.J., Smith, S.V., 1983. C:N:P ratios of benthic marineplants. Limnol. Oceanogr. 28, 568–574.
Baird, M.E., Walker, S.J., Wallace, B.B., Webster, I.T., Parlsow, J.S.,2003. The use of mechanistic descriptions of algal growth andzooplankton grazing in an estuarine eutrophication model. Est.Coast. Shelf. Sci. 56 (3/4), 685–695.
Bell, E.C., 1993. Photosynthetic response to temperature and dessi-cation of the intertidal algaMastocarpus papillatus. Mar. Biol.177, 337–346.
Braunschweig, F., Martins, F., Leitao, P., Neves, R., 2003. A method-ology to estimate renewal time scales in estuaries: the Tagus Es-tuary case. Ocean Dyn. 53 (3), 137–145.
Carr, G., Duthie, H., Taylor, W., 1997. Models of aquatic plant pro-ductivity: a review of the factor that influence growth. Aquat.Bot. 59, 195–215.
Cloern, J.E., 2001. Our evolving conceptual model of the coastaleutrophication problem. Mar. Ecol. Prog. Ser. 210, 223–253.
Coelho, H., Santos, R., 2003. Enhanced primary production overseamounts: a numerical study. Thalassas 19 (2a), 144–145.
Coffaro, G., Bocci, M., 1997. Resources competition betweenUlvarigida andZoostera marina: a quantitative approach applied tothe Lagoon of Venice. Ecol. Model. 102, 81–95.
C wth02,
C i-Thirdpp.
D ne
D sedf
D ation22,
D uaries.
D n ofdel.
E ine
stuary.This study, and the developed model itself, can
he first steps in management practices delineationering useful tools that can simulate several scenan this estuary as in others.
cknowledgements
This research was possible within the framewf a project of Portuguese National Water InstitINAG) to evaluate Water Quality in Portugueseuaries. ModelRia project, financed by the Portugucience and Technology Foundation, must also bnowledged, with special attention to the sampork made by Prof. Henrique Queiroga. The authould also like to thank the contributions of two anoous reviewers.
offaro, G., Sfriso, A., 1997. Simulation model of Ulva rigida groin shallow water of the Lagoon of Venice. Ecol. Model. 155–66.
unha, M., Coelho, H., Neves, R., Leitao, P.C., 2000. A numercal study of the Guadiana estuary. In: Proceedings of theSymposium on the Iberian Atlantic Margin, Faro, Portugal,27–28.
ay, J.W., Hall, C., Kemp, W., Yanez-Arancibia, A., 1989. EstuariEcology. Wiley, 558 pp.
ennison, W.C., 1979. Light Adaptations of Plants: A Model Baon the seagrassZostera marina. L.M.S. Thesis. University oAlaska, Fairbanks, 70 pp.
ias, J., Lopes, J., Dekeyser, L., 1999. Hydrological characterisof Ria de Aveiro, Portugal, in early Summer. Oceanol. Acta473–485.
ronkers, J., Leussen, W., 1988. Physical Processes in EstSpringer-Verlag, Berlin, Germany, 560 pp.
uarte, P., Ferreira, J.G., 1997. A model for the simulatiomacroalgal population dynamics and productivity. Ecol. Mo98, 199–214.
nriquez, S., Agustı, S., Duarte, C., 1994. Light absorption by marmacrophytes. Oecologia 98, 121–129.
246 A.R. Trancoso et al. / Ecological Modelling 187 (2005) 232–246
EPA, 1985. Rates, Constants and Kinetics Formulations inSurface Water Quality Modelling, 2nd ed. United StatesEnvironmental Protection Agency, Report EPA/600/3-85/040,454 pp.
Falkowski, P., 2000. Racionalizing elemental ratios in unicellularalgae. J. Phycol. 36, 3–6.
Ferreira, J., 1989. Mercurio em algas macrofitas do Estuario do Tejo.PhD Dissertation. Environmental Sciences, Universidade Novade Lisboa, Portugal.
Fonseca, M., Kenworthy, W., 1987. Effects of current on photosyn-thesis and distribution of seagrasses. Aquat. Bot. 27, 59–78.
Gotelli, N., 1995. A Primer of Ecology. Sinauer Associates Inc.,USA, 206 pp.
INAG, 2003. Water Quality in Portuguese Estuaries—Ria de Aveiro,vol. V. Technical Report for Portuguese National Water Institute,Portugal.
Kaandorp, J., Kubler, J., 2001. The Algorithmic Beauty of Seaweeds,Sponges and Corals. The Virtual Laboratory, Springer-Verlag(Chapter 2).
Krone, R., 1962. Flume Studies of the Transport in Estuaries ShoalingProcesses. Hydr. Eng. Lab., University of Berkeley, California,USA.
Little, C., Kitching, J.A., 1996. The biology of rocky shores. In:Biology of Habitats. Oxford University Press.
Mann, K., 1982. Ecology of coastal waters—a systems approach.Studies in Ecology, vol. 8. Blackwell Scientific Publications, 322pp.
Miranda, R., Braunschweig, F., Leitao, P., Martins, F., Santos, A.,2000. MOHID2000—a coastal integrated object oriented model.In: Hydraulic Engineering Software VIII. WIT Press.
Neves, R., Delfino, J., Silva, A., Leitao, P., Leitao, J., Pina, P., Braun-schweig, F., Miranda, R., Coelho, H., 2000. Coastal managementsupported by modelling. Optimising the level of treatment of ur-ban discharges into coastal waters. Conference Paper in Environ-mental Coastal III. Las Palmas, Canary Islands.
Parsons, T., Takahashi, M., Hargrave, B., 1984. Biological Oceano-graphic Processes. Butterworths–Heinemann, 330 pp.
Partheniades, E., 1965. Erosion and deposition of cohesive soils. J.Hydr. Div. ASCE 91 (HY1), 105–139.
Pina, P., 2001. An integrated approach to study the Tagus estuarywater quality. Master Dissertation. Marine resources ecology,management and modelling. Instituto Superior Tecnico, Univer-sidade Tecnica de Lisboa, Portugal, 70 pp.
Pina, P., Delfino, J.P., Leitao, P.C., Neves, R.J., 2000. An integratedapproach to study the Tagus estuary water quality. In: Proceed-ings of the Third Symposium on the Iberian Atlantic Margin,Faro, Portugal, pp. 95–96.
Pina, P., Braunschweig, F., Saraiva, S., Santos, M., Neves, R., 2003.The role of physics controlling the eutrophication process in es-tuaries. Thalassas 19 (2a), 157–158.
Portela, L., 1996. Modelac¸ao matematica de processoshidrodinamicos e de qualidade daagua no estuario doTejo. Dissertac¸ao PhD Dissertation. Environmental Engineer-ing, Instituto Superior Tecnico, Universidade Tecnica de Lisboa,Portugal.
Rivera, 1997. Hydrodynamics, sediment transport and light ex-tinction of Cape Bolinao, Philippine. PhD Dissertation. A.A.Balkema/Rotterdam/Brookfield, 244 pp.
Salomonsen, J., Flindt, M.R., Geertz-Hansen, O., Johansen, C., 1999.Modelling advective transport of Ulva lactuca in the shelteredbay, Møllekrogen, Roskilde Fjord, Denmark. Hydrobiologia 397,241–252.
Solidoro, C., Pecenik, G., Pastres, R., Franco, D., Dejak, C., 1997.Modelling macroalgae (Ulva rıgida) in the Venice lagoon: modelstructure identification and first parameters estimation. Ecol.Model. 94, 191–206.
Steele, J., 1962. Environmental control of photosynthesis in the sea.Limnol. Oceanogr. 7, 137–150.
Valiela, I., 1995. Marine Ecological Processes, second ed. Springer-Verlag, New York, USA, 686 pp.
Related Documents