Modelling fracture of aged graphite bricks under radiation and temperature HASHIM, Atheer, KYAW, Si <http://orcid.org/0000-0001-8568-500X> and SUN, Wei Available from Sheffield Hallam University Research Archive (SHURA) at: http://shura.shu.ac.uk/15449/ This document is the author deposited version. You are advised to consult the publisher's version if you wish to cite from it. Published version HASHIM, Atheer, KYAW, Si and SUN, Wei (2017). Modelling fracture of aged graphite bricks under radiation and temperature. Nuclear Materials and Energy, 11, 3-11. Copyright and re-use policy See http://shura.shu.ac.uk/information.html Sheffield Hallam University Research Archive http://shura.shu.ac.uk

Welcome message from author
This document is posted to help you gain knowledge. Please leave a comment to let me know what you think about it! Share it to your friends and learn new things together.
Transcript

Modelling fracture of aged graphite bricks under radiation and temperature
HASHIM, Atheer, KYAW, Si <http://orcid.org/0000-0001-8568-500X> and SUN, Wei
Available from Sheffield Hallam University Research Archive (SHURA) at:
http://shura.shu.ac.uk/15449/
This document is the author deposited version. You are advised to consult the publisher's version if you wish to cite from it.
Published version
HASHIM, Atheer, KYAW, Si and SUN, Wei (2017). Modelling fracture of aged graphite bricks under radiation and temperature. Nuclear Materials and Energy, 11, 3-11.
Copyright and re-use policy
See http://shura.shu.ac.uk/information.html
Sheffield Hallam University Research Archivehttp://shura.shu.ac.uk

Modelling Fracture of Aged Graphite Bricks under Radiation and Temperature
Atheer Hashima,b, Si Kyawa,c*, Wei Suna
a Department of Mechanical, Materials and Manufacturing The University of Nottingham
University Park, Nottingham, NG7 2RD, UK b College of Water Resources Engineering
Al Qasim Green University, 8, Al Qasim, Iraq c Department of Engineering & Maths, Faculty of ACES
Sheffield Hallam University Sheffield, S1 1WB, U.K.
*Corresponding author email: [email protected] Address: Department of Engineering & Maths, Faculty of ACES, Sheffield Hallam University, Sheffield, S1 1WB, U.K. Phone: +44-1142255618
Abstract
The graphite bricks of the UK carbon dioxide gas cooled nuclear reactors are subjected to neutron irradiation and radiolytic oxidation during operation which will affect thermal and mechanical material properties and may lead to structural failure. In this paper, an empirical equation is obtained and used to represent the reduction in the thermal conductivity as a result of temperature and neutron dose. A 2D finite element thermal analysis was carried out using Abaqus to obtain temperature distribution across the graphite brick. Although thermal conductivity could be reduced by up to 75% under certain conditions of dose and temperature, analysis has shown that it has no significant effect on the temperature distribution. It was found that the temperature distribution within the graphite brick is non-radial, different from the steady state temperature distribution used in the previous studies [1, 2]. To investigate the significance of this non-radial temperature distribution on the failure of graphite bricks, a subsequent mechanical analysis was also carried out with the nodal temperature information obtained from the thermal analysis. To predict the formation of cracks within the brick and the subsequent propagation, a linear traction–separation cohesive model in conjunction with the extended finite element method (XFEM) is used. Compared to the analysis with steady state radial temperature distribution, the crack initiation time for the model with non-radial temperature distribution is delayed by almost one year in service, and the maximum crack length is also shorter by around 20%.
Keywords: Nuclear graphite, neutron dose, irradiation temperature, damage model, crack growth
1.0 Introduction
Nowadays, in the UK, the gas-cooled graphite moderated type dominates over 90 % of the nuclear reactor [3]. Graphite is also considered to be used within the design of the new reactor generation (such as the Helium gas cooled very high temperature reactor or VHTR) as structural support and as moderator because of its extreme purity, ability to withstand extremely high temperatures [4]. The core structure of the reactor is formed from joining graphite bricks, with keys and keyways. During operation, graphite is

exposed to neutron radiation and temperature gradients that could cause irradiation and radiolytic oxidation. These occurrences will affect material properties such as weight loss, porosity changes and thermal conductivity which can potentially lead to material and structural failure [5].
Future reactors such as VHTR are expected to operate at higher temperatures than the current reactors and its core outlet temperature (COT) will be about 1000°C [5]–[8]. In order to enhance thermal efficiency of future nuclear reactors, extensive research has been carried out, aiming to provide an improved design for future reactors [6-10]. As the reactor is exposed to neutron dose and temperature, many material properties are changed by irradiation and radiolytic oxidation if air or carbon dioxide is used as a coolant. Some of the properties of nuclear graphite which change under service conditions include elastic properties and thermal expansion coefficient, irradiation creep, irradiation induced dimensional changes. The prediction of the nuclear graphite lifetime and its structural integrity are significant issues for the safety and reliability of reactor operation that could be affected by changing properties.
In previous studies [2], a constitutive model has been developed for the effects of mechanical properties changes on stress states within the graphite brick. Resultant crack development from the stress state within the brick was also studied in [1]. For previous studies, steady state temperature distribution was used to calculate thermal stress assuming that thermal conductivity of graphite brick remains constant across the brick during the operation. It was also assumed that the temperature distribution is linear across the graphite brick. However, studies [11, 12] have shown that thermal conductivity of nuclear graphite changes with both temperature and fast neutron irradiation. Hence, a new thermal analysis is required to calculate the temperature gradient across the brick by considering the changes in thermal conductivity due to dose and temperature.
In this paper, an empirical equation for the evolution of thermal conductivity is derived from available experimental data by Marsden et al. [12]. Using this relationship with relevant thermal properties, a thermal analysis is carried out. Resultant nodal temperatures are then implemented into mechanical finite element (FE) model with a constitutive model developed in [2] and fracture mechanics based damage model developed in [1]. Stress analyses and crack development are then carried out. Comparisons are also made to models with the linear temperature distribution across the brick.
2.0 Empirical Relationship of Thermal Conductivity of Graphite with Neutron Dose and Irradiated Temperature
The effects of temperature gradients and irradiation can induce damage to the graphite bricks and this leads to changes in its thermal conductivity. The common approach is based on relating thermal conductivity (K) to summation of thermal resistances (1/K) as a result of scattering hurdles [13, 14]
� �, = � ��� + � + ��
(1)
where the term � � is a coefficient, which is function of orientation terms (basal plane, �), ��� is the
thermal resistance due to grain boundary scattering, �� is the thermal resistance due to Umklapp
scattering or the so-called phonon-phonon scattering [14], and ��� is the thermal resistance due to lattice
defect scattering. KGB depends on the graphite perfection and is taken into account only for lower temperatures, as it is insignificant at intermediate and high temperatures. Ku can be scaled as a quadratic function of temperature [14] and it controls thermal conductivity at higher temperatures. Finally, KRD
depends on the neutron irradiation, as the latter plays a significant role in producing various types of defects, which are more effective in scattering phonons. Therefore, many studies [5, 13, 15] emphasize that the change in conductivity is only caused by the phonon scattering in lattice defects. This phonon scattering increases with temperature. Hence it is necessary to consider both irradiation dose and temperature to estimate the change in thermal conductivity. For significant nuclear irradiated graphite grades e.g. Gilsocarbon, Kelly [11] proposed a formula as shown in Eq (2), to calculate the thermal conductivity. It includes the terms, and , obtained empirically as a function of dose and temperature [12]. � = � [�� + . ] (2)
where is the initial irradiation induced change equal to ���� = ��� − and is a structural term
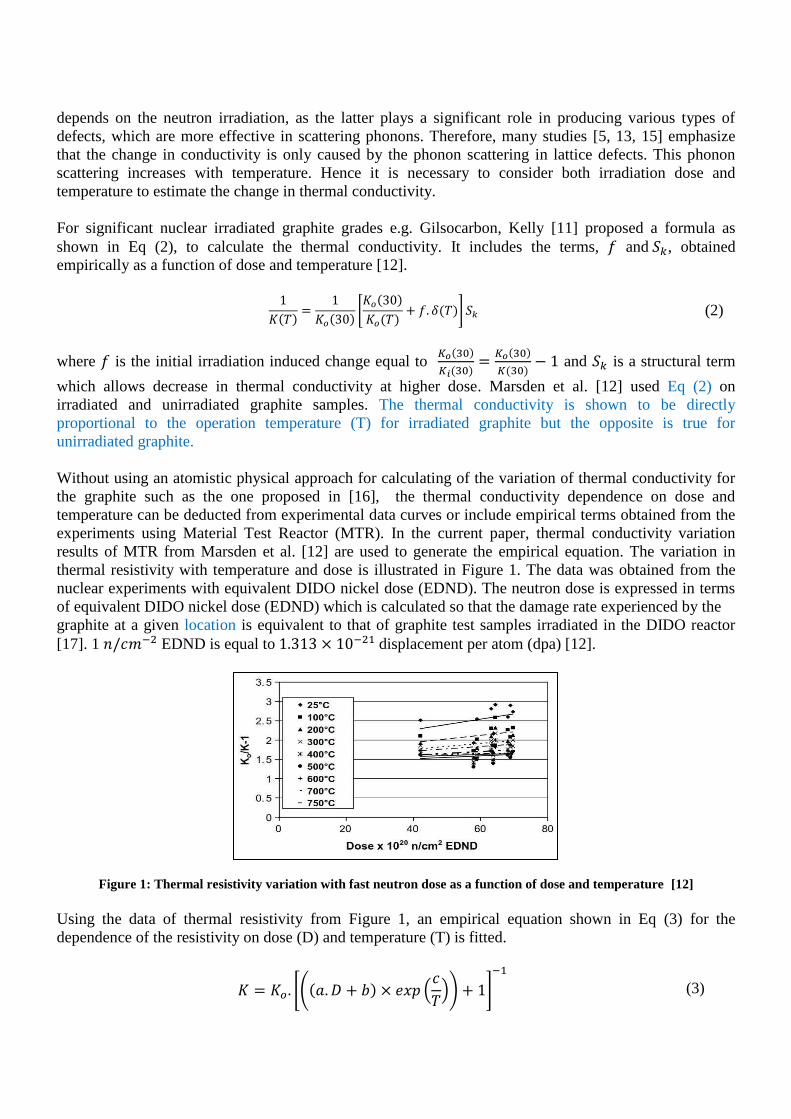
which allows decrease in thermal conductivity at higher dose. Marsden et al. [12] used Eq (2) on irradiated and unirradiated graphite samples. The thermal conductivity is shown to be directly proportional to the operation temperature (T) for irradiated graphite but the opposite is true for unirradiated graphite. Without using an atomistic physical approach for calculating of the variation of thermal conductivity for the graphite such as the one proposed in [16], the thermal conductivity dependence on dose and temperature can be deducted from experimental data curves or include empirical terms obtained from the experiments using Material Test Reactor (MTR). In the current paper, thermal conductivity variation results of MTR from Marsden et al. [12] are used to generate the empirical equation. The variation in thermal resistivity with temperature and dose is illustrated in Figure 1. The data was obtained from the nuclear experiments with equivalent DIDO nickel dose (EDND). The neutron dose is expressed in terms of equivalent DIDO nickel dose (EDND) which is calculated so that the damage rate experienced by the graphite at a given location is equivalent to that of graphite test samples irradiated in the DIDO reactor [17]. 1 / − EDND is equal to . × − displacement per atom (dpa) [12].
Figure 1: Thermal resistivity variation with fast neutron dose as a function of dose and temperature [12] Using the data of thermal resistivity from Figure 1, an empirical equation shown in Eq (3) for the dependence of the resistivity on dose (D) and temperature (T) is fitted. � = � . [ . + × � + ]−
(3)

where � is the thermal conductivity of the nuclear graphite, D is dose × / − EDND, is the irradiation temperature in Kelvin and � is the initial thermal conductivity of unirradiated graphite at 30˚C (about 130 W/m/K), and , and are constants equal to . , . and . , respectively. Please note that the data for 25oC was excluded from the fitting process to reduce the error sum of squares (SSE) from 3.742 to 1.858, with coefficients of 95% confidence bounds. The resultant Eq (3) can be used to calculate transient change in thermal conductivity for the thermal FE model for which changes in dose and temperature are expected. Finally, to illustrate the accuracy of the calculated thermal resistivity using Eq (5), the values are plotted against experimental results as shown in Figure 2 at 100˚C, 300˚C and 600˚C.
Figure 2: Thermal resistivity variation with fast neutron dose as a function of dose and temperature as fitted by the proposed formula compared to experimental results from [12] (for 100˚C, 300˚C and 600˚C)
3.0 Graphite Brick Model 3.1 Geometry and Mesh of Finite Element Model of Graphite Brick In this paper, failure of the graphite brick of Gilsocarbon under irradiation and temperature is estimated. In previous studies [1, 2], an assumed profile of temperature distribution across the graphite brick was applied to the model as one of the field variables to model the reactor conditions. The temperature is assumed to vary in the radial direction of the brick while it is kept constant in the circumferential direction and along the depth direction of the brick. Here, a separate thermal FE model is used to assess the effect of conductivity change on the temperature distribution within the brick. The empirical equation (presented in section 2) of the evolution of the thermal conductivity as a result of irradiation and temperature change is used for the thermal model. Resultant nodal temperature distribution is imported to the mechanical FE model for stress and failure analyses. The FE model is developed here based on the dimensions of a particular brick model used by Tsang and Marsden [2]. In order to save computation time, only one-eighth of hypothetical-brick design was modelled, as shown in Figure 3. The fillet radius at the corner of the keyway is 6mm. Appropriate symmetry and circumferential periodic boundary conditions were applied along B1 and B2 (see. Figure 3 (a)) as described by Li et al. [24]. The FE mesh of the brick section used for both thermal and mechanical
0
0.5
1
1.5
2
2.5
3
40 50 60 70 80
K0/
K-1
Dose×1020 n/cm2 EDND
100°C 300°C 600°C
100°C (Fitted) 300°C(Fitted) 600°C(Fitted)
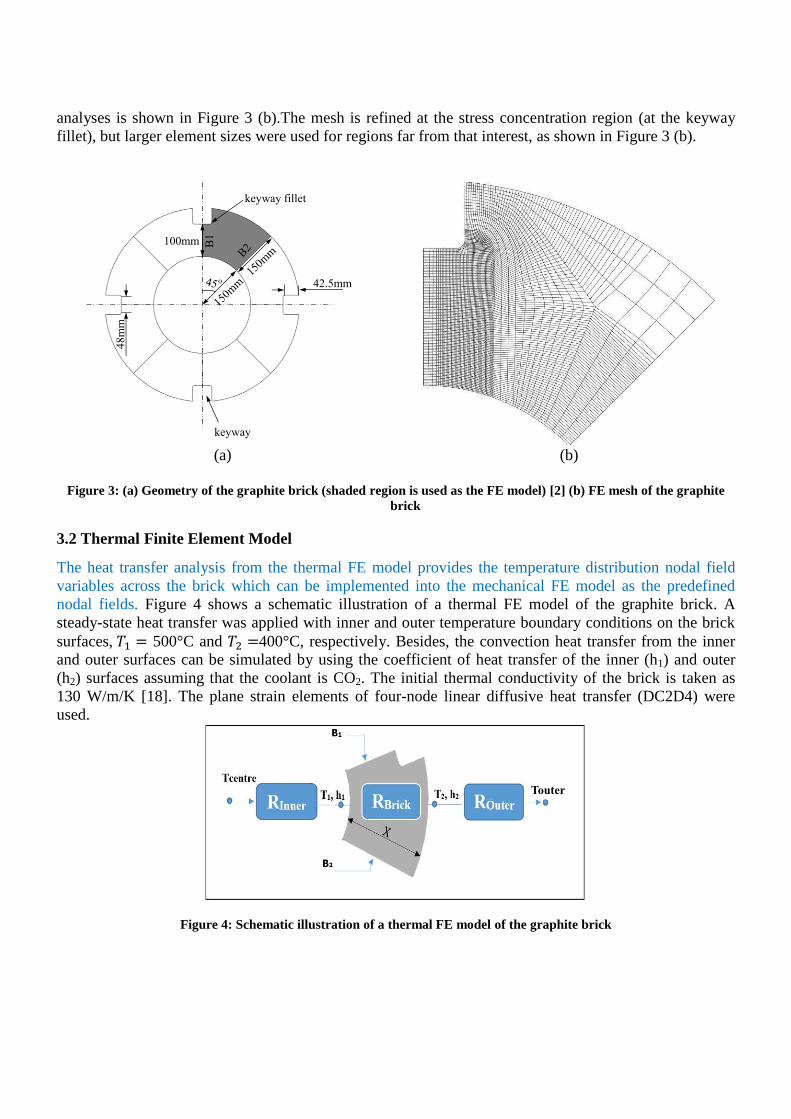
analyses is shown in Figure 3 (b).The mesh is refined at the stress concentration region (at the keyway fillet), but larger element sizes were used for regions far from that interest, as shown in Figure 3 (b).
(a) (b)
Figure 3: (a) Geometry of the graphite brick (shaded region is used as the FE model) [2] (b) FE mesh of the graphite
brick
3.2 Thermal Finite Element Model
The heat transfer analysis from the thermal FE model provides the temperature distribution nodal field variables across the brick which can be implemented into the mechanical FE model as the predefined nodal fields. Figure 4 shows a schematic illustration of a thermal FE model of the graphite brick. A steady-state heat transfer was applied with inner and outer temperature boundary conditions on the brick surfaces, = 500°C and =400°C, respectively. Besides, the convection heat transfer from the inner and outer surfaces can be simulated by using the coefficient of heat transfer of the inner (h1) and outer (h2) surfaces assuming that the coolant is CO2. The initial thermal conductivity of the brick is taken as 130 W/m/K [18]. The plane strain elements of four-node linear diffusive heat transfer (DC2D4) were used.
Figure 4: Schematic illustration of a thermal FE model of the graphite brick
keyway
100mm
42.5mm
48m
m
B1
keyway fillet
Touter

For the particular section of the brick shown in Figure 4, the governing equations of the heat transfer are:
= Δ� � = −� �
(4)
� � = � + + �
(5)
� = ℎ . �
(6)
= ��
(7)
� = ℎ . �
(8)
where is the heat flux / , is the temperature, � � is the total thermal resistance, � is the convection resistance between the outer surface of the graphite brick and the coolant, � is the convection resistance between the inner surface of the graphite brick and the coolant, is the conduction resistance within the brick, � is the area of conduction or convection (assumed identical and unity) and is the radial distance between the inner and outer surfaces. Rinner and Router are not considered for the current model to avoid a complex forced cooling model of flowing CO2 coolant. In contrary, nodes at the inner and outer surfaces of the brick are fixed at 500˚C and 400̊ C, respectively, by assuming that the CO2 coolant will keep this temperature difference at the steady state. Therefore the change in the temperature within the brick will be given solely by the change in RBrick due to the change in its conductivity, K. The dose is implemented as one of the field variables of the thermal model. It is ramped upwards from zero at the beginning of the reactor life. At the end of operation (30years) the dose varies quadratically across the brick from 214x1020 n/cm2 at the inner radius to 106x1020 n/cm2 at the exterior. With the known information of dose and temperature, updated thermal conductivity is calculated using Eq (3) and stored as the field variables which are implemented in the mechanical FE model. 3.3 Mechanical Finite Element Model With regard to the mechanical model, a user-defined material model for the constitutive stress/strain behaviour of the graphite from [2] was used. In the material model of graphite brick, different physical effects such as changes of graphite dimension, porosity and microstructure from the effect of irradiation, radiolytic oxidation and fast neutron damage are taken into account. This model was then adapted to investigate the behaviour of the brick fracture using a traction–separation cohesive model in [1]. The FE simulation was set for 30 years of plant operation. In this paper, temperature field is calculated from the separate thermal FE model and its effects on crack initiation and propagation within the graphite brick was investigated. An ABAQUS solver with a user material subroutine (UMAT) was used to calculate the resultant stresses in the mechanical model. Figure 5 summarises the mechanical FE model based on four field operating variables. In each analysis, four field-variables profiles (the operating and irradiation temperatures,

neutron fluence and weight loss) are implemented to resemble the condition of reactor operation. The operating temperature is the same as the irradiation temperature during steady state whereas the operation temperature is ramped down to the room temperature at cooling down step after operating. The nodal temperature from the thermal analysis is implemented into the mechanical model. Fluence (radiation dose) variation is mentioned in section 2. An empirical relationship from Eason et al. [18] was used for the weight loss and it can be expressed as a function of the radiation dose as shown in Equation (9). However, the weight loss resulting from the thermal oxidation was neglected as thermal oxidation is not significant for lower temperature CO2 cooled UK graphite moderators. It could be significant for new higher temperatures moderators. The coolant used in the simulation was CO2 coolant, as radiolytic oxidation is more important than other types, but modifications to the material data gained from Tsang and Marsden [20] are needed for future generation reactors. � = . × � (9)
Figure 5: Flowchart representing FE model with the model of UMAT and fracture
At the beginning of each increment, ABAQUS calculates the total strain within the model. The total strain is decomposed into estimated strain components related to different physical processes. There are seven strain components decomposed from the total strain (� , as shown in Eq (10). εT = ε + εp + ε + ε + ε + ε + ε (10)
where , , , , ℎ, ℎ, are the elastic, primary creep (recoverable), secondary creep (unrecoverable), dimensional change, thermal, interaction thermal and interaction dimensional change strains, respectively. From Hooke’s law of linear elasticity, the is calculated. The UKAEA model of Kelly and Brocklehurst [19] was used to model the creep behaviour. The and are irradiation induced creep strains and were assumed to be temperature independent. The leads to fast deformation and then gradually decreases with increasing irradiation fluence, followed by the , which is a steady state creep strain. The was assumed to be dependent on the irradiation fluence, temperature and weight loss, whereas the ℎ and were assumed to be dependent on irradiation creep in graphite. These interaction strains
Field variables
(operating
temperature,
irradiation
fluence,
irradiation
temperature and
weight loss)
UMAT for
mechanical
response
Linear damage
model
Abaqus FE
solver
Cohesive/XFEM
crack
Decompose aggregate strain
into elastic, creep,
dimensional change (DC),
thermal and interaction (DC
& thermal) strains
Aggregate strain
Stress
Str
ess
Calculate thermal
conductivity variation based
on dose and temperature
Temperature
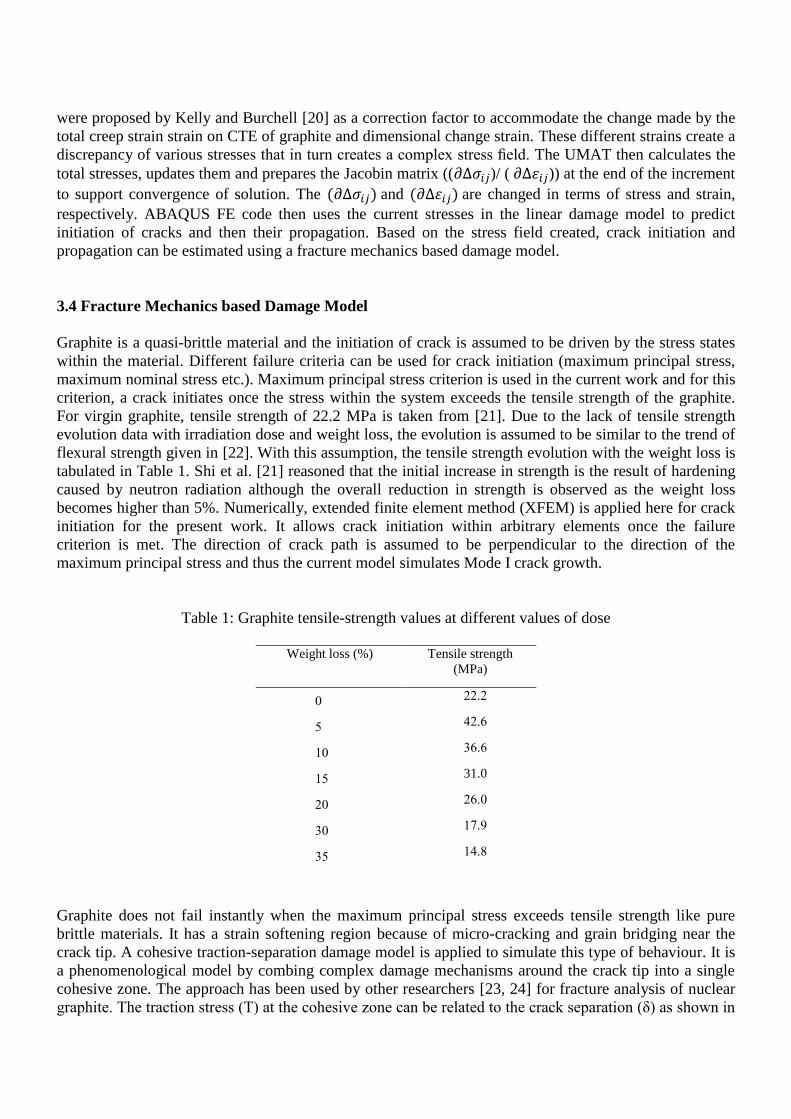
were proposed by Kelly and Burchell [20] as a correction factor to accommodate the change made by the total creep strain strain on CTE of graphite and dimensional change strain. These different strains create a discrepancy of various stresses that in turn creates a complex stress field. The UMAT then calculates the total stresses, updates them and prepares the Jacobin matrix ((�Δ� )/ ( �Δ )) at the end of the increment to support convergence of solution. The �Δ� and �Δ are changed in terms of stress and strain, respectively. ABAQUS FE code then uses the current stresses in the linear damage model to predict initiation of cracks and then their propagation. Based on the stress field created, crack initiation and propagation can be estimated using a fracture mechanics based damage model. 3.4 Fracture Mechanics based Damage Model Graphite is a quasi-brittle material and the initiation of crack is assumed to be driven by the stress states within the material. Different failure criteria can be used for crack initiation (maximum principal stress, maximum nominal stress etc.). Maximum principal stress criterion is used in the current work and for this criterion, a crack initiates once the stress within the system exceeds the tensile strength of the graphite. For virgin graphite, tensile strength of 22.2 MPa is taken from [21]. Due to the lack of tensile strength evolution data with irradiation dose and weight loss, the evolution is assumed to be similar to the trend of flexural strength given in [22]. With this assumption, the tensile strength evolution with the weight loss is tabulated in Table 1. Shi et al. [21] reasoned that the initial increase in strength is the result of hardening caused by neutron radiation although the overall reduction in strength is observed as the weight loss becomes higher than 5%. Numerically, extended finite element method (XFEM) is applied here for crack initiation for the present work. It allows crack initiation within arbitrary elements once the failure criterion is met. The direction of crack path is assumed to be perpendicular to the direction of the maximum principal stress and thus the current model simulates Mode I crack growth.
Table 1: Graphite tensile-strength values at different values of dose
Weight loss (%) Tensile strength (MPa)
0 22.2
5 42.6
10 36.6
15 31.0
20 26.0
30 17.9
35 14.8
Graphite does not fail instantly when the maximum principal stress exceeds tensile strength like pure brittle materials. It has a strain softening region because of micro-cracking and grain bridging near the crack tip. A cohesive traction-separation damage model is applied to simulate this type of behaviour. It is a phenomenological model by combing complex damage mechanisms around the crack tip into a single cohesive zone. The approach has been used by other researchers [23, 24] for fracture analysis of nuclear graphite. The traction stress (T) at the cohesive zone can be related to the crack separation (δ) as shown in
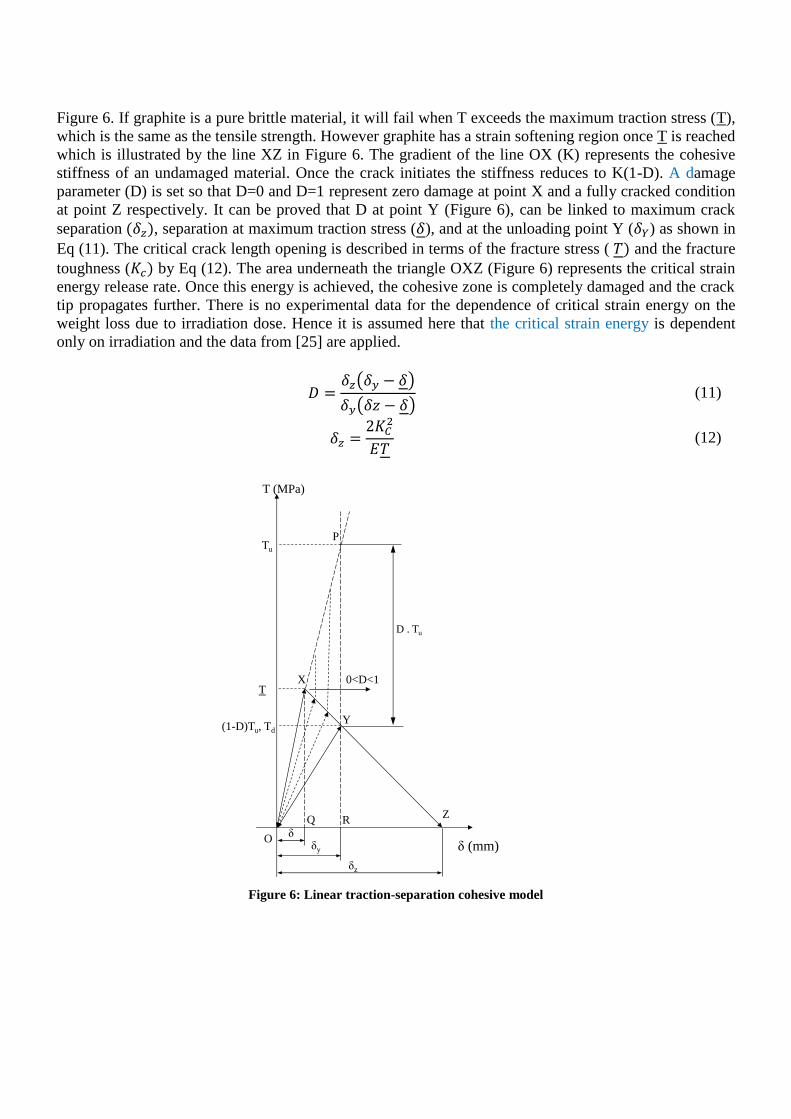
Figure 6. If graphite is a pure brittle material, it will fail when T exceeds the maximum traction stress (T), which is the same as the tensile strength. However graphite has a strain softening region once T is reached which is illustrated by the line XZ in Figure 6. The gradient of the line OX (K) represents the cohesive stiffness of an undamaged material. Once the crack initiates the stiffness reduces to K(1-D). A damage parameter (D) is set so that D=0 and D=1 represent zero damage at point X and a fully cracked condition at point Z respectively. It can be proved that D at point Y (Figure 6), can be linked to maximum crack separation , separation at maximum traction stress (), and at the unloading point Y (�) as shown in Eq (11). The critical crack length opening is described in terms of the fracture stress ( and the fracture toughness (� by Eq (12). The area underneath the triangle OXZ (Figure 6) represents the critical strain energy release rate. Once this energy is achieved, the cohesive zone is completely damaged and the crack tip propagates further. There is no experimental data for the dependence of critical strain energy on the weight loss due to irradiation dose. Hence it is assumed here that the critical strain energy is dependent only on irradiation and the data from [25] are applied. = ( − )( � − ) (11)
= � (12)
Figure 6: Linear traction-separation cohesive model
δ (mm)O
X
Y
Z
δ
T
δz
δy
Tu
(1-D)Tu, Td
0<D<1
P
Q R
D . Tu
T (MPa)

4.0 Results and Discussion 4.1 Temperature Distribution through the Graphite Brick The thermal analysis model shown in Figure 4 was implemented to analyse the heat flux and temperature distributions within the brick. Figure 7 shows the heat flux through the brick and heat flux concentration can be observed at the fillet corner. Generally, it can be seen that heat is transferred from the hotter inner core side of the brick to the outer surface of the brick. Nodal temperature field from the thermal model is implemented into the mechanical model. In contrary to the assumption made by Tsang and Marsden [2], a nonlinear change of the temperature along the radial direction of the brick is found. This is expected since the surface around the fillet region is assumed to have the same temperature (400˚C) as the outer surface of the brick at the other regions for the current model. Hence it has lower temperature than Tsang and Marsden model for which temperature varies linearly across the brick. Comparison of temperature distributions between the current model and the previous model by Tsang and Marsden is shown in Figure 8. Nodes along the path B of the brick, see Figure 9, have been chosen to demonstrate the temperature variations under the irradiation for the current model and Tsang and Marsden model.
Figure 7: Heat flux contour (in watt) through the graphite brick with temperature conditions (500 and 400 oC at the inner and outer surfaces, respectively)
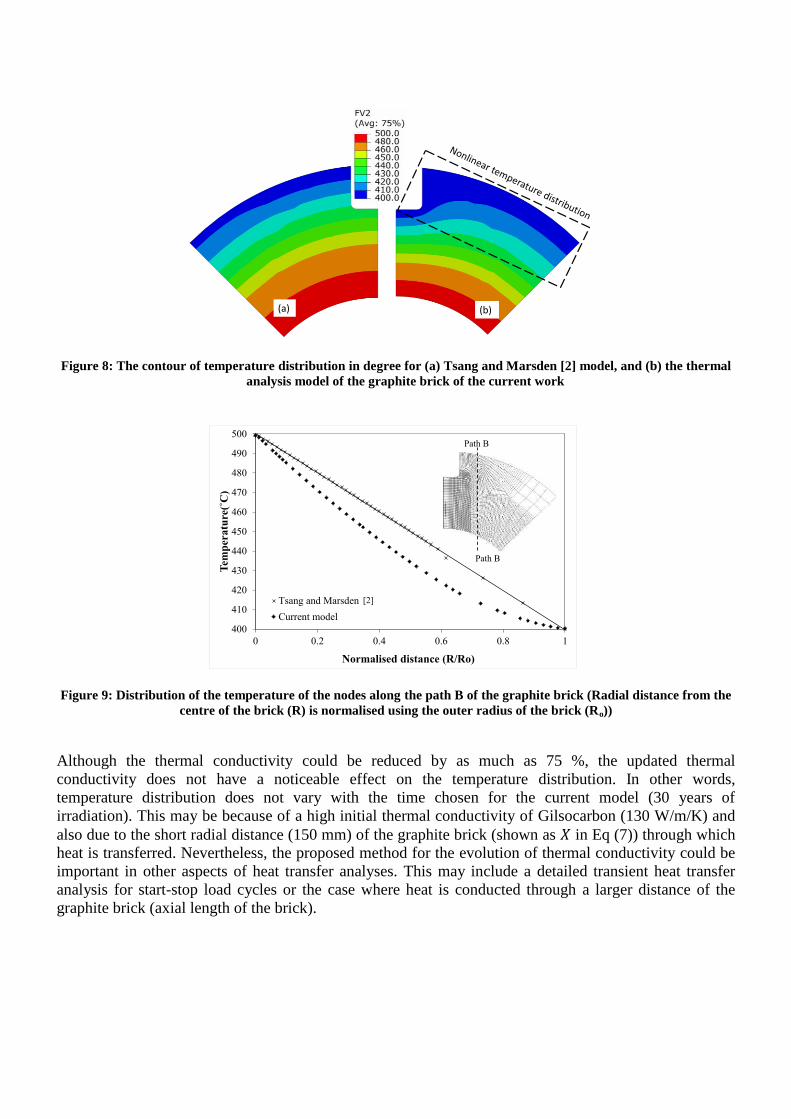
Figure 8: The contour of temperature distribution in degree for (a) Tsang and Marsden [2] model, and (b) the thermal analysis model of the graphite brick of the current work
Figure 9: Distribution of the temperature of the nodes along the path B of the graphite brick (Radial distance from the
centre of the brick (R) is normalised using the outer radius of the brick (Ro))
Although the thermal conductivity could be reduced by as much as 75 %, the updated thermal conductivity does not have a noticeable effect on the temperature distribution. In other words, temperature distribution does not vary with the time chosen for the current model (30 years of irradiation). This may be because of a high initial thermal conductivity of Gilsocarbon (130 W/m/K) and also due to the short radial distance (150 mm) of the graphite brick (shown as in Eq (7)) through which heat is transferred. Nevertheless, the proposed method for the evolution of thermal conductivity could be important in other aspects of heat transfer analyses. This may include a detailed transient heat transfer analysis for start-stop load cycles or the case where heat is conducted through a larger distance of the graphite brick (axial length of the brick).
(a) (b)
400
410
420
430
440
450
460
470
480
490
500
0 0.2 0.4 0.6 0.8 1
Tem
pera
ture
(˚C)
Normalised distance (R/Ro)
Tsang and Marsden (2008)
Current model
Path B
Path B
[2]
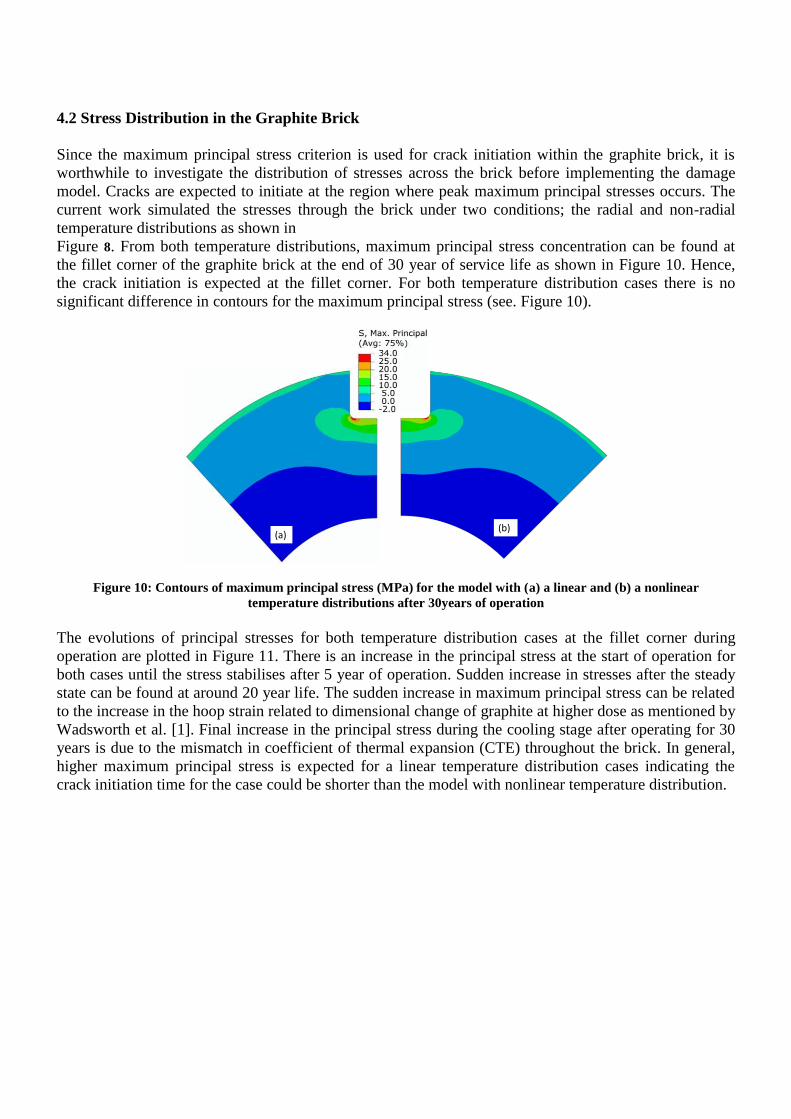
4.2 Stress Distribution in the Graphite Brick Since the maximum principal stress criterion is used for crack initiation within the graphite brick, it is worthwhile to investigate the distribution of stresses across the brick before implementing the damage model. Cracks are expected to initiate at the region where peak maximum principal stresses occurs. The current work simulated the stresses through the brick under two conditions; the radial and non-radial temperature distributions as shown in Figure 8. From both temperature distributions, maximum principal stress concentration can be found at the fillet corner of the graphite brick at the end of 30 year of service life as shown in Figure 10. Hence, the crack initiation is expected at the fillet corner. For both temperature distribution cases there is no significant difference in contours for the maximum principal stress (see. Figure 10).
Figure 10: Contours of maximum principal stress (MPa) for the model with (a) a linear and (b) a nonlinear temperature distributions after 30years of operation
The evolutions of principal stresses for both temperature distribution cases at the fillet corner during operation are plotted in Figure 11. There is an increase in the principal stress at the start of operation for both cases until the stress stabilises after 5 year of operation. Sudden increase in stresses after the steady state can be found at around 20 year life. The sudden increase in maximum principal stress can be related to the increase in the hoop strain related to dimensional change of graphite at higher dose as mentioned by Wadsworth et al. [1]. Final increase in the principal stress during the cooling stage after operating for 30 years is due to the mismatch in coefficient of thermal expansion (CTE) throughout the brick. In general, higher maximum principal stress is expected for a linear temperature distribution cases indicating the crack initiation time for the case could be shorter than the model with nonlinear temperature distribution.
(a)(b)
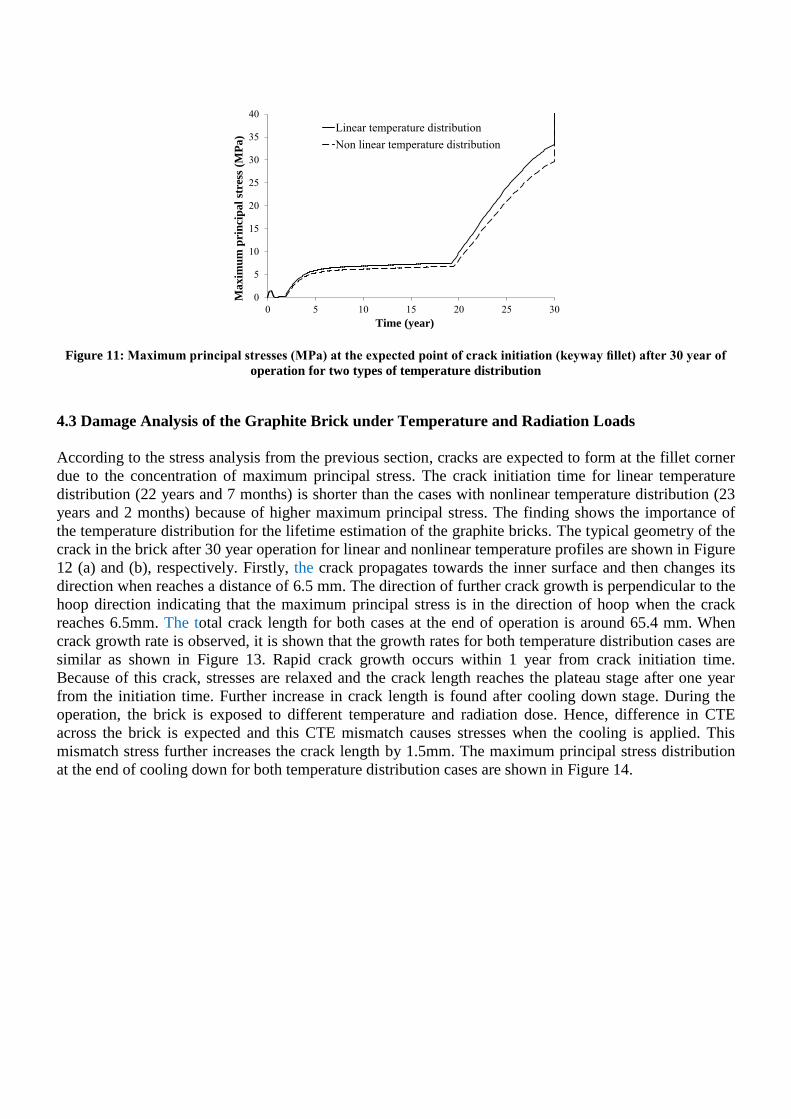
Figure 11: Maximum principal stresses (MPa) at the expected point of crack initiation (keyway fillet) after 30 year of operation for two types of temperature distribution
4.3 Damage Analysis of the Graphite Brick under Temperature and Radiation Loads According to the stress analysis from the previous section, cracks are expected to form at the fillet corner due to the concentration of maximum principal stress. The crack initiation time for linear temperature distribution (22 years and 7 months) is shorter than the cases with nonlinear temperature distribution (23 years and 2 months) because of higher maximum principal stress. The finding shows the importance of the temperature distribution for the lifetime estimation of the graphite bricks. The typical geometry of the crack in the brick after 30 year operation for linear and nonlinear temperature profiles are shown in Figure 12 (a) and (b), respectively. Firstly, the crack propagates towards the inner surface and then changes its direction when reaches a distance of 6.5 mm. The direction of further crack growth is perpendicular to the hoop direction indicating that the maximum principal stress is in the direction of hoop when the crack reaches 6.5mm. The total crack length for both cases at the end of operation is around 65.4 mm. When crack growth rate is observed, it is shown that the growth rates for both temperature distribution cases are similar as shown in Figure 13. Rapid crack growth occurs within 1 year from crack initiation time. Because of this crack, stresses are relaxed and the crack length reaches the plateau stage after one year from the initiation time. Further increase in crack length is found after cooling down stage. During the operation, the brick is exposed to different temperature and radiation dose. Hence, difference in CTE across the brick is expected and this CTE mismatch causes stresses when the cooling is applied. This mismatch stress further increases the crack length by 1.5mm. The maximum principal stress distribution at the end of cooling down for both temperature distribution cases are shown in Figure 14.
0
5
10
15
20
25
30
35
40
0 5 10 15 20 25 30
Linear temperature distribution
Non linear temperature distribution
Time (year)
Max
imum
pri
ncip
al s
tres
s (M
Pa)
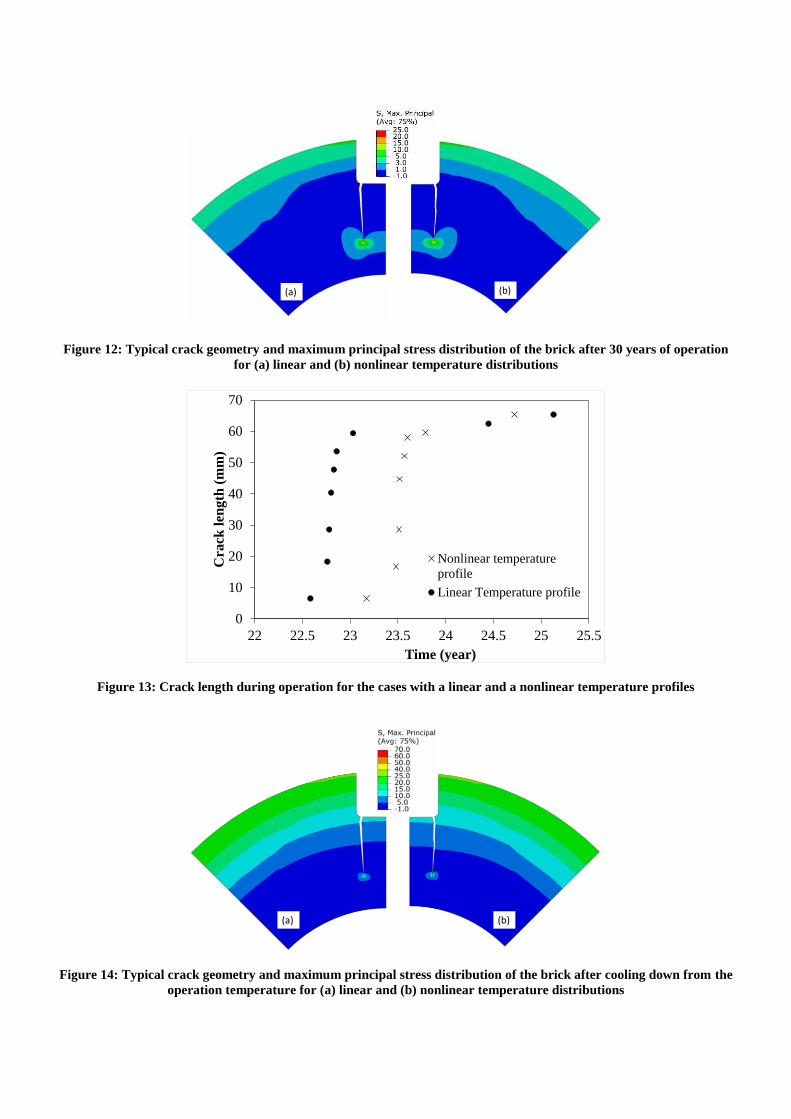
Figure 12: Typical crack geometry and maximum principal stress distribution of the brick after 30 years of operation for (a) linear and (b) nonlinear temperature distributions
Figure 13: Crack length during operation for the cases with a linear and a nonlinear temperature profiles
Figure 14: Typical crack geometry and maximum principal stress distribution of the brick after cooling down from the operation temperature for (a) linear and (b) nonlinear temperature distributions
(a) (b)
0
10
20
30
40
50
60
70
22 22.5 23 23.5 24 24.5 25 25.5
Cra
ck le
ngth
(m
m)
Time (year)
Nonlinear temperatureprofile
Linear Temperature profile
(a) (b)

5.0 Conclusions and Future Work The empirical formula of varying thermal conductivity of common irradiated graphite form, Gilsocarbon, due to the change in temperature and dose has been developed. This formula is developed by using the experimental thermal conductivity of irradiated graphite from the literature. The resultant formula can be implemented into either thermal FE model or corresponding mechanical FE model and life estimation models. Although, the thermal conductivity of graphite could be reduced by 65-75% under irradiation and temperature, the thermal analysis showed it does not have a significant effect on the temperature distribution because of the high initial thermal conductivity and the relatively small thickness of the graphite brick investigated. However, it could play a significant role in the applications when heat is conducted through much larger distance, for example through the thickness of larger graphite bricks. The thermal analysis also showed that the temperature distribution does not vary radially within the graphite brick due to the effect of the thermal concentration in the fillet corner. Based on the temperature distribution obtained from the thermal analysis, stress and damage analysis of the graphite brick under neutron dose and temperature were carried out. The dose increases the weight loss resulting in a decrease in the strength of the brick ahead the maximum principal stress and thus leading to crack initiation within the brick. The initiation of cracks occurs at the fillet corner of the graphite brick and it grows towards the inner bore of the brick. The maximum principal stress is lower at the expected crack initiation region for the case where the temperature distribution is nonlinear compared to the case with assumed linear temperature distribution. Hence the crack initiation for the case is delayed by about 7 months. Regardless of crack initiation time, both cases have similar crack growth rate and the crack growth stops after one year from initiation time. Further crack growth is only driven from CTE mismatch stresses during the cooling down stage. The study shows the importance of temperature distribution on the lifetime estimation of graphite bricks. Subtle difference in temperature distribution (as shown by two different cases in the current work) could cause the difference in the crack initiation time. However, there are some areas of the current work that needs to be improved. A transient heat analysis considering the flow of the coolant may be implemented in future instead of using a simple temperature boundary conditions for inner and outer surfaces of the graphite brick. In addition, the usage of a more realistic 3D geometry of the brick with cut-out holes for the circulation of the coolant may be considered in order to predict more accurate transient heat flow and the temperature profiles. Moreover, changes in porosity and phases in graphite as described by Kyaw et al. [26] could affect its mechanical properties and this model could be coupled to the current mechanical model in the future work. References 1. Wadsworth, M., S.T. Kyaw, and W. Sun, Finite element modelling of the effect of temperature and neutron dose on
the fracture behaviour of nuclear reactor graphite bricks. Nuclear Engineering and Design, 2014. 280: p. 1-7. 2. Tsang, D.K.L. and B.J. Marsden, The development of a stress analysis code for nuclear graphite components in gas-
cooled reactors. J of Nucl Mater, 2006. 350(3): p. 208-220. 3. World Nuclear Association, “Nuclear Power in the United Kingdom,” World Nuclear Association, 2015. [Online].
Available: http://www.world-nuclear.org/info/Country-Profiles/Countries-T-Z/United-Kingdom/. [Accessed: 11-Jul-2015].
4. Hore-Lacy, I., Nuclear Energy in the 21st Century, 1st ed. London. 2006. 5. Kelly, B.T., et al., “Irradiation damage in graphite due to fast neutrons in fission and fusion systems". International
atomic energy agency (IAEA)-TECDOC-1154, 2000. vol. 1154.

6. Goto, M., et al., “Long-term high-temperature operation of the HTTR. Nucl. Eng. Des., Oct. 2012. vol. 251: p. pp. 181-190.
7. Fütterer, M.A., et al., “Status of the very high temperature reactor system” Prog. Nucl. Energy, Nov. 2014. vol. 77: p. pp. 266-281.
8. Generation IV International Forum (GIF), “GIF R&D Outlook for Generation IV Nuclear Energy Systems,” 2009. 9. OECD Nuclear Energy Agency, “Technology Roadmap Update for Generation IV Nuclear Energy Systems” 2014: p.
pp. 45-54,. 10. Kelly, J.E., “Generation IV International Forum: A decade of progress through international cooperation” Prog.
Nucl. Energy, Nov. 2014. vol. 77: p. pp. 240-246. 11. Kelly, B.T., An improved method of estimating the thermal conductivity of irradiated graphite at any temperature.
AB 7/19346, available from the UK Public Records Office, 1967. 12. Marsden, B.J., et al., Dimensional and material property changes to irradiated Gilsocarbon graphite irradiated
between 650 and 750 °C J. Nucl. Mater., 2008. vol. 381(no. 1-2): p. pp. 62-67. 13. Snead, L.L., “Accumulation of thermal resistance in neutron irradiated graphite materials” J. Nucl. Mater, 2008. vol.
381(no. 1-2): p. pp. 76-82. 14. Kelly, B.T., Physics of Graphite. London: Applied Science Publishers, 1981. 15. Marsden, B.J., L.H. Fok, and H. Li, Irradiation Behaviour and Structural Analysis of Htr / Vhtr Graphite Core
Componentsin 18th International Conference on Structural Mechanics in Reactor Technology (SMiRT 18), China, Beijing, 2005.
16. Oliveira, L.d.S. and P.A. Greaney, Thermal resistance from irradiation defects in graphite. Comput. Mater. Sci., Jun. 2015. vol. 103: p. pp. 68-76.
17. Neighbour, G.B., Modelling of dimensional changes in irradiated nuclear graphites. J. Phys. D: Appl. Phys. , 2000. 33.
18. D.Eason, E., et al., A model of Young’s modulus for Gilsocarbon graphites irradiated in oxidising environments. Journal of Nuclear Materials, 2013. 436: p. 201-207.
19. Kelly, B.T. and J.E. Brocklehurst, UKAEA Reactor Group studies of irradiation-induced creep in graphite. Journal of Nuclear Materials, 1977. 65(0): p. 79-85.
20. Kelly, B.T. and T.D. Burchell, The analysis of irradiation creep experiments on nuclear reactor graphite. Carbon, 1994. 32(1): p. 119-125.
21. Shi, L., et al., The effect of softening on the predicted strength of brittle materials using a continuum damage mechanics failure model. 2nd International Topical Meeting on HIGH TEMPERATURE REACTOR TECHNOLOGY, Beijing, China, September 22-24, , 2004.
22. Eason, E.D., et al., Models of bending strength for Gilsocarbon graphites irradiated in inert and oxidising environments. J. Nucl. Mater, 2013. Volume 436(Issue 1-3): p. p. 208-216.
23. Zou, Z., et al., Failure predictions for nuclear graphite using a continuum damage mechanics model. J. Nucl. Mater., 2004. 324(2–3): p. 116-124.
24. Zou, Z., et al., Numerical simulation of strength test on graphite moderator bricks using a continuum damage mechanics model. Eng Fract Mech, 2006. 73: p. 318-330.
25. Ouagne, P., G.B. Neighbour, and B. McEnaney, Influence of oxidation on toughness parameters for two nuclear grade graphites. Journal of Physics D: Applied Physics, 2005. 38(8): p. 1259.
26. Kyaw, S.T., W. Sun, and A.A. Becker, Effects of compositions of filler, binder and porosity on elastic and fracture properties of nuclear graphite. Journal of Nuclear Materials, 2015. 457: p. 42-47.
Related Documents