Modelling colour changes during the caramelisation reaction Mafalda A.C. Quintas, Teresa R.S. Branda ˜o, Cristina L.M. Silva * Escola Superior de Biotecnologia, Universidade Cato ´ lica Portuguesa, R. Dr. Anto ´ nio Bernardino de Almeida, 4200-072 Porto, Portugal Abstract Sucrose solutions, with concentrations near or superior to saturation, present high potentialities for the candy and pastry industries. The development of colour in a neutral and highly concentrated sucrose solution (16.32%(w/w) water content) subjected to isothermal heat treatment (in the 100–160 °C range) was investigated. Under such conditions, sucrose degrades through caramelisation and 5- hydroxymethylfurfural (HMF) is formed. Colour development was monitored through lightness/darkening (L/L 0 ) and total colour dif- ference (TCD H ) changes during reaction course. Kinetic behaviour was mathematically described using modified Gompertz equations. The effect of temperature on the reaction was described by an Arrhenius type dependency. Colour development and sucrose degradation kinetic parameters were compared and similar lag phases were found. However, the same was not observed for reactions rate, indicating that not only sucrose degradation contributes to colour development. To investigate the colour development/HMF content relationship, a fractional conversion and a power law models where successfully proposed to express, respectively, L/L 0 and TCD H dependence on HMF content. Keywords: Caramelisation reaction; Colour kinetics; Sucrose degradation and hydroxymethylfurfural (HMF) formation Introduction Highly concentrated sucrose solutions (sugar syrups) are extensively used in pastry and confectionery products. These syrups are prepared by heating a mixture of sugar and water (3:1) to high temperatures in order to dissolve the sugar and evaporate water, producing supersaturated solutions. During this process sucrose can degrade, through the caramelisation reaction, leading to non-enzy- matic browning and thus colour changes. Besides contrib- uting to the visual aspect and flavour of the final product, colour changes can be used to control reaction’s extension. Colour is an important attribute in food products, since it is perceived immediately by the consumer. It can also be a measurement of reactions extension in food products, since formed and/or degraded compounds may contribute to a specific coloration (Francis, 1995). Colour can be assessed either by a sensory panel or using analyt- ical instrumentation. A typical example is the profuse use of absorbance readings in the 400–460 nm to evaluate brown pigments formation during non-enzymatic brown- ing. However, tristimulus colorimetry has become a pop- ular technique and equipment, since it mimics human colour perception without any prior sample preparation. It is based on the existence of three main elements: the light source (illuminant), the object of the study (which reflects or transmits light) and the observer (which receives the signal and interprets into units related to how the human eye ‘‘sees” colour) (Francis, 1995; Hutch- ings, 1994). The interpretation of such human colour per- ception, lead to the development of several colour scales. Under white light, any colour can be defined by a mix- ture of red, blue and green primaries. The International Commission on Illumination (CIE) defined a parallel interpretation by setting unreal primaries XYZ, which * Corresponding author. Tel.: +351 22 558 00 58; fax: +351 22 509 03 51. E-mail address: [email protected] (C.L.M. Silva).

Welcome message from author
This document is posted to help you gain knowledge. Please leave a comment to let me know what you think about it! Share it to your friends and learn new things together.
Transcript
Modelling colour changes during the caramelisation reaction
Mafalda A.C. Quintas, Teresa R.S. Brandao, Cristina L.M. Silva *
Escola Superior de Biotecnologia, Universidade Catolica Portuguesa, R. Dr. Antonio Bernardino de Almeida, 4200-072 Porto, Portugal
Keywords: Caramelisation reaction; Colour kinetics; Sucrose degradation and hydroxymethylfurfural (HMF) formation
Abstract
Sucrose solutions, with concentrations near or superior to saturation, present high potentialities for the candy and pastry industries.The development of colour in a neutral and highly concentrated sucrose solution (16.32%(w/w) water content) subjected to isothermalheat treatment (in the 100–160 �C range) was investigated. Under such conditions, sucrose degrades through caramelisation and 5-hydroxymethylfurfural (HMF) is formed. Colour development was monitored through lightness/darkening (L/L0) and total colour dif-ference (TCDH) changes during reaction course. Kinetic behaviour was mathematically described using modified Gompertz equations.The effect of temperature on the reaction was described by an Arrhenius type dependency. Colour development and sucrose degradationkinetic parameters were compared and similar lag phases were found. However, the same was not observed for reactions rate, indicatingthat not only sucrose degradation contributes to colour development. To investigate the colour development/HMF content relationship,a fractional conversion and a power law models where successfully proposed to express, respectively, L/L0 and TCDH dependence onHMF content.
Introduction
Highly concentrated sucrose solutions (sugar syrups) areextensively used in pastry and confectionery products.These syrups are prepared by heating a mixture of sugarand water (3:1) to high temperatures in order to dissolvethe sugar and evaporate water, producing supersaturatedsolutions. During this process sucrose can degrade,through the caramelisation reaction, leading to non-enzy-matic browning and thus colour changes. Besides contrib-uting to the visual aspect and flavour of the finalproduct, colour changes can be used to control reaction’sextension.
Colour is an important attribute in food products,since it is perceived immediately by the consumer. Itcan also be a measurement of reactions extension in food
* Corresponding author. Tel.: +351 22 558 00 58; fax: +351 22 509 0351.E-mail address: [email protected] (C.L.M. Silva).
products, since formed and/or degraded compounds maycontribute to a specific coloration (Francis, 1995). Colourcan be assessed either by a sensory panel or using analyt-ical instrumentation. A typical example is the profuse useof absorbance readings in the 400–460 nm to evaluatebrown pigments formation during non-enzymatic brown-ing. However, tristimulus colorimetry has become a pop-ular technique and equipment, since it mimics humancolour perception without any prior sample preparation.It is based on the existence of three main elements: thelight source (illuminant), the object of the study (whichreflects or transmits light) and the observer (whichreceives the signal and interprets into units related tohow the human eye ‘‘sees” colour) (Francis, 1995; Hutch-ings, 1994). The interpretation of such human colour per-ception, lead to the development of several colour scales.Under white light, any colour can be defined by a mix-ture of red, blue and green primaries. The InternationalCommission on Illumination (CIE) defined a parallelinterpretation by setting unreal primaries XYZ, which
ajmorais
Typewriter
________________________________________________________
ajmorais
Typewriter
Nomenclature
a colour space coordinate (degree of greenness/redness)
a, b and v Gompertz model parametersb colour space coordinate (degree of blueness/yel-
lowness)A, B power-law model parametersC any colour parameter (i.e. L, a, b or other)C any colour parameter estimated by the modelEa activation energy (J mol�1)Eakmax
activation energy for the kmax parameter(J mol�1)
Eak activation energy for the k parameter (J mol�1)F(P,N-P,0.05) upper 5% of the quantile for Fisher distribu-
tion (P and N-P degrees of freedom)[HMF] HMF content (gHMF/gsolution)k fractional conversion model parameter (gsolution/
gHMF)kmax maximum reaction rate (min�1)L colour space coordinate (lightness)k lag time (min)
MSE mean square errorN number of experimental data pointsp kinetic parameterP number of estimated parametersR universal gas constant (8.314 J mol�1 K�1)R2 coefficient of determinationSE standard errorSHW standardised half with (%)t time (min)T temperature (�C or K)TCD total colour differencev parameters derivative vector(VTV)�1 parameter variance–covariance matrix
Subscripts
H refers to Hunter colour space coordinates0 refers to colour parameter at initial timeref refers to parameter at reference temperatureeq refers to property at equilibrium
can be mathematically converted into more easily inter-preted and linear colour scales: the Hunter Lab and theCIE Lab (Hutchings, 1994) colour spaces. Both thesescales are similar and represent a 3-dimension rectangularspace based on the opponent-colours theory, where L –represents the lightness axis and measures how light/darkis the sample, a – measures the greenness/redness of thesample and b – represents products’ blueness/yellowness(Hutchings, 1994).
Colour changes in a food product due to process arecommonly evaluated through changes in the scale parame-ters (L, a and b) and/or through the Total Colour Differ-ence (Eq. (1)) parameter, which evaluates the overallcolour difference of a processed sample compared to a ref-erence one (indicated by the index 0 in the followingexpression):
TCD ¼ffiffiffiffiffiffiffiffiffiffiffiffiffiffiffiffiffiffiffiffiffiffiffiffiffiffiffiffiffiffiffiffiffiffiffiffiffiffiffiffiffiffiffiffiffiffiffiffiffiffiffiffiffiffiffiffiffiffiffiffiffiffiffiffiffiffiðL� L0Þ2 þ ða� a0Þ2 þ ðb� b0Þ2
qð1Þ
Non-enzymatic browning is the general denomination ofdarkening of a food product due to any reaction not owedto enzymatic activity. Although this includes several reac-tion types, such as lipid oxidation or ascorbic acid degrada-tion, non-enzymatic browning is manly associated withcarbohydrate degradation reactions, such as the Maillardand caramelisation reactions (BeMiller & Whistler, 1996).Colour changes due to Maillard reaction are extensivelydescribed in literature (e.g. are Baisier & Labuza, 1992;Bell, White, & Chen, 1998; Bruijn, Stuijs, & Bout-Dierd-eren, 1999; Buera, Chirifie, Resnik, & Lozano, 1987b;Imming, Buczys, Lehnberger, & Bliesener, 1996; Lievonen,Laaksonen, & Roos, 1998; Reyes, Poocharoen, & Wrols-
tad, 1982; Schebor, Buera, Karel, & Chirife, 1999). Onthe other hand, caramelisation related colour developmenthas been less studied (Buera, Chirifie, Resnik, & Lozano,1987a; Buera, Chirifie, Resnik, & Wetzler, 1987; Cam-merer, Wedzicha, & Kroh, 1999).
Caramelisation is the common name for a group ofreactions that occur when carbohydrates are exposed tohigh temperatures with no amino groups involved. Thisreaction is influenced by pH, impurities (salts) andsucrose concentration of the solution (Clarke, Edye, &Eggleston, 1997; Eggleston & Vercellotti, 2000; Lowary& Richards, 1988; Mauch, 1971; Richards, 1986; Vukov,1965). When highly concentrated sucrose solutions areheated at high temperatures and neutral pH, a lag phaseon sucrose degradation occurs (Clarke et al., 1997; Eggle-ston, Trask-Morrel, & Vercellotti, 1996; Lowary & Rich-ards, 1988; Richards, 1986). Such solutions are of specialimportance in confectionery products or sugar boilingduring white sugar production. The first reaction stepin the caramelisation reaction is sucrose hydrolysis lead-ing to glucose and fructose production (Clarke et al.,1997; Eggleston et al., 1996; Lowary & Richards, 1988;Mauch, 1971; Richards, 1986). Further degradation ofthese products is responsible for the formation of othercompounds, with special preponderance to the thermody-namically stable 5-hydroxymethylfurfural (HMF) (Antal,Mok, & Richards, 1990; Clarke et al., 1997; Egglestonet al., 1996; Kroh, 1994; Lowary & Richards, 1988;Mauch, 1971).
The typical brown colour developed during carameli-sation is attributed to the production of polymeric prod-ucts during the reaction course and HMF and furfural
are pointed out as precursors of such polymers (Kroh,1994).
Colour changes together with HMF content have beenstudied for numerous food systems, such as fruit juicesand purees (Bozkurt, Gogus, & Eren, 1999; Carabasa,Ibarz, Garza, & Barbosa-Canovas, 1998; Garza, Ibarz,Pagan, & Giner, 1999; Ibarz, Pagan, & Garza, 2000; Kada-kal & Nas, 2003; Rattanathanalerk, Chiewchan, & Sri-chumpoung, 2005; Tosun, 2004), dairy products (Cais-Sokolinska, Pikul, Dankow, & Wojtowski, 2005; Kumar& Mishra, 2004; Patel, Gandhi, Singh, & Patil, 1996),baked goods (Ramirez-Jimenez, Garcia-Villanova, &Guerra-Hernandez, 2000, 2001), infant foods (Fernandez-Artigas, Guerra-Hernandez, & Garcia-Villanova, 1999;Guerra-Hernandez, Leon, Corzo, Garcia-Villanova, &Romera, 2002; Ramirez-Jimenez, Guerra-Hernandez, &Garcia-Villanova, 2003), honey (Terrab, Gonzalez, Diez,& Heredia, 2003) and model Maillard systems (Carabasa-Giribet & Ibarz-Ribas, 2000a, 2000b; Shen & Wu, 2004).However, few studies try to correlate HMF content withcolour development. Most of such studies only report theobservation or not of a linear correlation between such fac-tors (Burdurlu & Karadeniz, 2003; Fallico, Arena, & Zap-pala, 2003) and in even fewer cases the possibility of anexponential correlation is addressed (Ramirez-Jimenez,Guerra-Hernandez, & Garcia-Villanova, 2000). To theauthors’ best knowledge, only one work approached thedevelopment of a mathematical model to describe such cor-relation and a power law was used (Lee & Nagy, 1988).
The lag phase and autocatalytic behaviour observedduring sucrose degradation in highly concentrated neutralsolutions has been previously discussed and modelled usinga modified Gompertz equation (Quintas, Brandao, & Silva,2007). Since sucrose hydrolysis is the first step of the cara-melisation reaction, the lag phase observed on sucrose deg-radation of highly concentrated solutions is expected to bealso observed in colour development monitoring. In fact,this lag phase (or induction period) has been observed innon-enzymatic browning of freeze dried acidic model sys-tems containing sucrose (Karel & Labuza, 1968; Labuza,Tannenbaum, & Karel, 1970) and other carbohydrate-based food model systems (Carabasa-Giribet & Ibarz-Ribas, 2000a, 2000b; Miao & Roos, 2004).
This work aims at studying colour formation and inves-tigating the relationship of caramelisation reaction extentwith colour changes. To achieve that, (i) colour changesthrough the caramelisation reaction course were modelledand (ii) the effect of sucrose degradation and HMF produc-tion on colour development was studied. Experiments werecarried out with concentrated sucrose solutions, where lagphase in sucrose degradation was previously observed(16.32 %(w/w) water content), treated at temperaturesranging from 100 to 160 �C, for different times. The kineticbehaviour was mathematically described and models wereproposed to express colour dependence on HMF content.The temperature effect on both kinetic parameters and col-our/HMF behaviour was investigated.
Sucrose solutions of 83% (w/w) were prepared by weigh-ing commercial sucrose and adding distilled water in thedesired proportion. The mixture was then heated in amicrowave oven (medium power) for short periods (1 min-ute), stirred intermittently until complete sucrose dissolu-tion (Braga da Cruz, MacInnes, Oliveira, & Malcata,2002).
A Karl Fisher coulometric determination (684 K coulo-meter, Metrohm, Switzerland) was used to measure the realmoisture content of concentrated sucrose solutions. Atleast three different batches were prepared and each batchwas analysed three times. The 95% Standard Error (SE)of the sample water content was calculated. Results indi-cated a 16.32 ± 0.82 (%w/w) water content.
The solutions were poured into Thermal Death Time(TDT) cans, 6 cm diameter and 0.8 cm height (208 �0.06, American National Can, USA), sealed under vacuum,and processed isothermally at 100, 120, 140, and 160 �C inan oil bath (polyethelene glycol 400, Clariant) for differenttimes.
Samples were poured into a clear glass petri dish andcolour parameters were determined using a tristimuluscolorimeter (Minolta Chroma Meter CR300, Japan), pro-grammed to use illuminant C as light source and the 2�observer for colour interpretation. Results were calculatedby the equipment into the Hunter Lab colour scale. Inthis scale, L ranges from 0 (black) to 100 (white), a indi-cates degree of greenness (for negative a values) anddegree of redness (for positive a results), b axis alsoranges from negative to positive values indicating, respec-tively, degree of blueness to yellowness. The L0, a0 e b0
were calculated from non-heat-treated samples (8 mea-surements). Colour changes were assessed using L/L0
and TCDH (i.e., TCD evaluated on Hunter colour space)parameters.
HMF content of the studied solutions was determinedusing High Pressure Liquid Chromatography (HPLC).Standard solutions were prepared from HMF (pure,Fluka). Both samples and standard solutions were filtered(0.45 lm) and analysed in a HPLC system (Jasco, Japan),equipped with a PU-1580 pump and an AS-1555 injector.The column was a Waters Spherisorb�S5 ODS2 C18 andthe mobile phase, acetonitrile (Isocratic Grade, Lichrosolv,Merck)/water (70:30), was running at 1.2 ml/min. Peakswere detected using a UV detector (UV-1575, Jasco) setat 284 nm and analysed using Jasco-Borwin softwarev.1.50 (JMBS Developments, Fontaine, France). TheHMF content was expressed in gHMF/gsolution.
Determination of 5-hydroxymethylfurfura lcontent
Colour measurement
Sample preparation
Experimental procedures
Materials and methods
Lag and exponential phases of colour development maybe described using the original Gompertz equation (Gom-pertz, 1825; Zwietering, Jongenburger, Rombouts, & Riet,1990). This original function describes a growth tendency,which can be modified and reparameterised to parameterswith physical meaning for describing any autocatalytickinetic behaviour (Gil, Brandao, & Silva, 2006; Quintaset al., 2007; Zwietering et al., 1990).
C ¼ a exp½� expðb� vtÞ� ð2Þwhere C is the studied colour parameter (i.e. L, a, b orother) at any given reaction time, t, and a, b, and v aremodel parameters.
This model describes a growth tendency similar to theobserved for TCDH. For a decrease behaviour, such asthe one observed for L/L0, Eq. (2) can be modified asfollows:
C ¼ 1� a exp½� expðb� vtÞ� ð3ÞThese equations can be reparameterised, calculating: amaximum reaction rate, kmax (determined by the slope ofthe steepest tangent to the exponential phase), and a lagtime, k (calculated by the interception of the asymptot withthe extrapolated tangent line). The equilibrium may be de-scribed using the a parameter, which represents the func-tion asymptotic value when t!1 (being b such that, att ¼ 0, C ! 0 in the original Gompertz equation (2)). Eqs.(3) and (2) can then be written as, respectively:
LL0
¼ 1� a exp � expkmaxe
aðk� tÞ þ 1
� �� �ð4Þ
TCDH ¼ a exp � expkmaxe
aðk� tÞ þ 1
� �� �ð5Þ
The temperature effect on food reaction kinetics is oftentranslated into a dependence of the kinetic parameters.This dependence has been widely studied and can be gener-ally expressed with an Arrhenius type equation, using a fi-nite reference temperature (Cohen, Birk, Mannheim, &Saguy, 1994; Haralampu, Saguy, & Karel, 1985; Peleg,1992; van Boekel, 1996):
p ¼ pref exp �Ea
R1
T� 1
T ref
� �� �ð6Þ
where p is a kinetic parameter, Ea is activation energy, pref
the kinetic parameter at finite reference temperature, Tref,and R the universal gas constant. Tref should correspondto the middle temperature of the experimental range, thusminimizing the correlation between parameters and theconfidence intervals (Cohen et al., 1994; van Boekel, 1996).
2.2.2. Non-linear regression analysisThe equations mentioned along the text were fitted to
experimental data by non-linear regression analysis, usingSTATISTICATM v 6.0 (Statsoft. Inc, USA) package. The
Modelling procedures
Colour kinetics and temperature effect
Levenberg–Marquadt algorithm for the least squares func-tion minimisation was used. The statistical indicators of thequality of the regression and estimates precision, coefficientof determination (R2), the mean square error (MSE, i.e. thesum of squares of residuals divided by the correspondingdegrees of freedom) and the 95% Standard Error of theparameters (SE), were obtained directly from the software.The precision of the estimated parameters was also evalu-ated by the Standardised Half Width (SHW), which wasdefined as the ratio between the 95% Standard Error andthe value of the estimate. Quality of regression was mainlyassessed by visual inspection of residuals randomness andnormality.
The measured response precision was evaluated by cal-culating the 95% inference band. The following expressionis the linear approximation of the 95% inference band of anon-linear model (Bates & Watts, 1988):
C ¼ C �ffiffiffiffiffiffiffiffiffiffiffiMSEp ffiffiffiffiffiffiffiffiffiffiffiffiffiffiffiffiffiffiffiffiffiffiffiffi
vTðV TV Þ�1vq ffiffiffiffiffiffiffiffiffiffiffiffiffiffiffiffiffiffiffiffiffiffiffi
PF ðP;N-P;0:05Þp
ð7Þ
where C is the colour parameter estimated by the model,(VTV)�1 is the variance–covariance matrix, v is the param-eters derivative vector, P the number of estimated parame-ters, N is experimental data points, and F(P,N-P,0.05) is theupper 5% of the quantile for Fisher distribution with Pand N-P degrees of freedom.
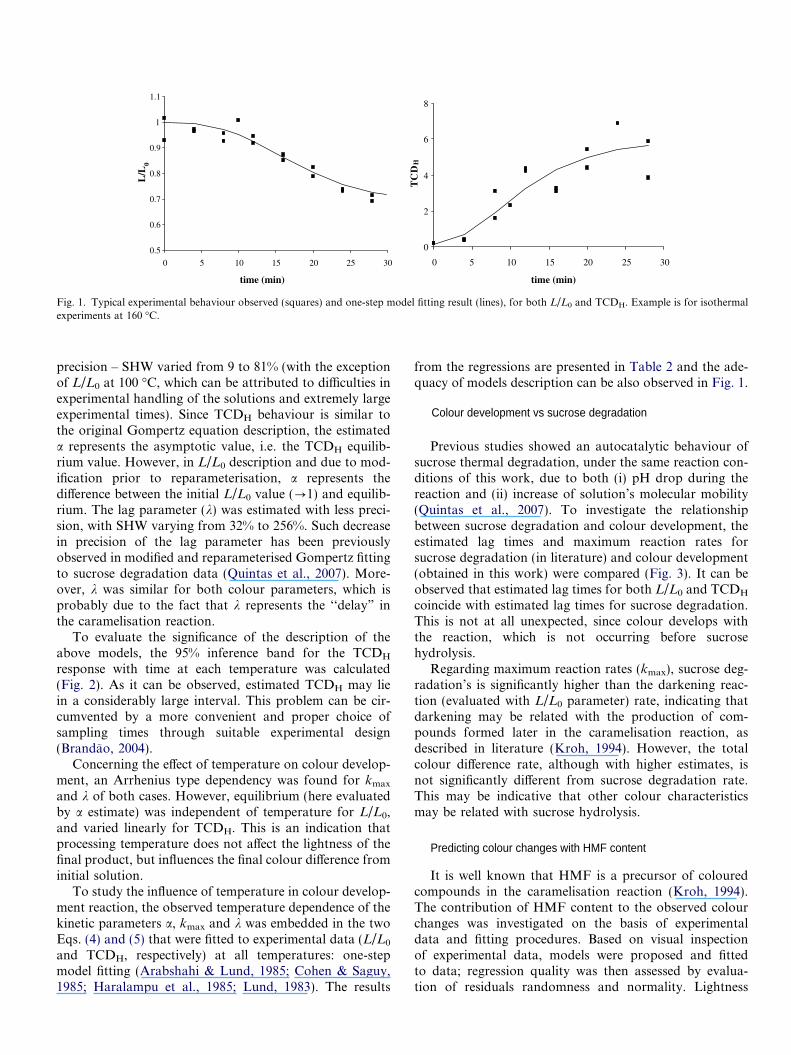
As expected, colour parameters changed with reactionextent. This change was evident in the responses L/L0
and TCDH with time. In both cases, a lag phase wasobserved followed by an exponential phase and a finalequilibrium value could be identified. There was a cleardarkening of heat-treated sucrose solutions, evaluated bya decrease in the L/L0 value, and a significant developmentof colour expressed through the increase of TCDH (Fig. 1).
The equilibrium value observed for the colour parame-ter is a rare observation in food quality factors degrada-tion, which usually follow a zero or first-order kinetics(Villota & Hawkes, 1992). However, such phenomenonhas been previously observed for colour development reac-tions and in these cases a fractional conversion model hasbeen reported (Avila & Silva, 1999; Garza et al., 1999;Ibarz et al., 2000; Silva & Silva, 1999). This observed equi-librium for colour parameters may be due to the contribu-tion of several different food components and theirinteractions.
These observed tendencies were described by modifiedand reparameterised Gompertz equations and results fromfitting Eqs. (4) and (5) to, respectively, L/L0 and TCDH
experimental data are presented in Table 1. In both cases,residuals inspection and MSE (which is an indication ofexperimental error) indicated a good regression procedure.a and kmax parameters where estimated with acceptable
Colour kinetics and temperature effect
Results and discussion
0
2
4
6
8
0 5 10 15 20 25 30
time (min)time (min)
TC
DH
0.5
0.6
0.7
0.8
0.9
1
1.1
0 5 10 15 20 25 30
L/L
0
Fig. 1. Typical experimental behaviour observed (squares) and one-step model fitting result (lines), for both L/L0 and TCDH. Example is for isothermalexperiments at 160 �C.
precision – SHW varied from 9 to 81% (with the exceptionof L/L0 at 100 �C, which can be attributed to difficulties inexperimental handling of the solutions and extremely largeexperimental times). Since TCDH behaviour is similar tothe original Gompertz equation description, the estimateda represents the asymptotic value, i.e. the TCDH equilib-rium value. However, in L/L0 description and due to mod-ification prior to reparameterisation, a represents thedifference between the initial L/L0 value (?1) and equilib-rium. The lag parameter (k) was estimated with less preci-sion, with SHW varying from 32% to 256%. Such decreasein precision of the lag parameter has been previouslyobserved in modified and reparameterised Gompertz fittingto sucrose degradation data (Quintas et al., 2007). More-over, k was similar for both colour parameters, which isprobably due to the fact that k represents the ‘‘delay” inthe caramelisation reaction.
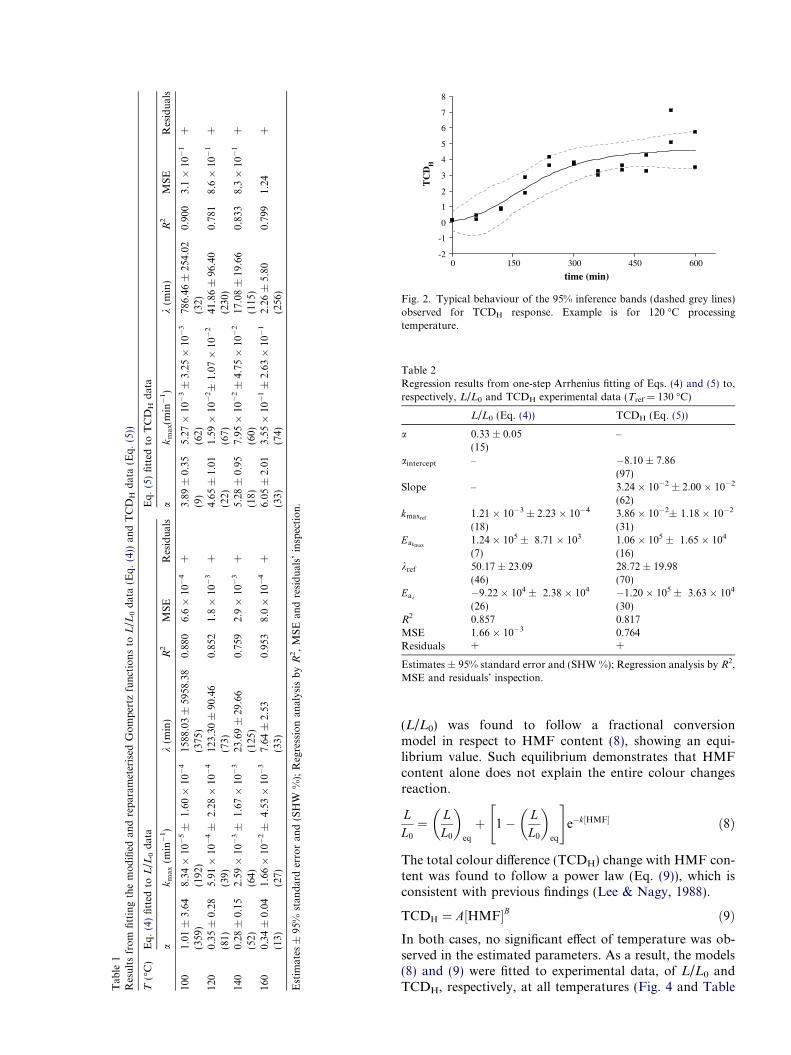
To evaluate the significance of the description of theabove models, the 95% inference band for the TCDH
response with time at each temperature was calculated(Fig. 2). As it can be observed, estimated TCDH may liein a considerably large interval. This problem can be cir-cumvented by a more convenient and proper choice ofsampling times through suitable experimental design(Brandao, 2004).
Concerning the effect of temperature on colour develop-ment, an Arrhenius type dependency was found for kmax
and k of both cases. However, equilibrium (here evaluatedby a estimate) was independent of temperature for L/L0,and varied linearly for TCDH. This is an indication thatprocessing temperature does not affect the lightness of thefinal product, but influences the final colour difference frominitial solution.
To study the influence of temperature in colour develop-ment reaction, the observed temperature dependence of thekinetic parameters a, kmax and k was embedded in the twoEqs. (4) and (5) that were fitted to experimental data (L/L0
and TCDH, respectively) at all temperatures: one-stepmodel fitting (Arabshahi & Lund, 1985; Cohen & Saguy,1985; Haralampu et al., 1985; Lund, 1983). The results
from the regressions are presented in Table 2 and the ade-quacy of models description can be also observed in Fig. 1.
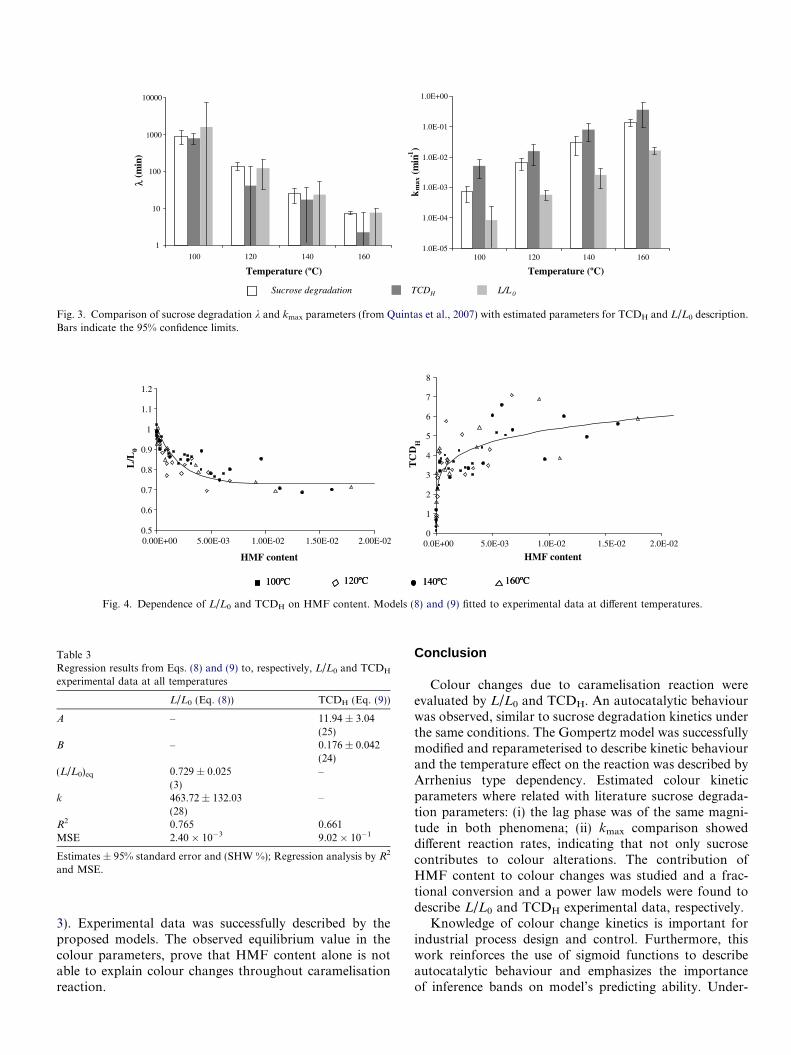
Previous studies showed an autocatalytic behaviour ofsucrose thermal degradation, under the same reaction con-ditions of this work, due to both (i) pH drop during thereaction and (ii) increase of solution’s molecular mobility(Quintas et al., 2007). To investigate the relationshipbetween sucrose degradation and colour development, theestimated lag times and maximum reaction rates forsucrose degradation (in literature) and colour development(obtained in this work) were compared (Fig. 3). It can beobserved that estimated lag times for both L/L0 and TCDH
coincide with estimated lag times for sucrose degradation.This is not at all unexpected, since colour develops withthe reaction, which is not occurring before sucrosehydrolysis.
Regarding maximum reaction rates (kmax), sucrose deg-radation’s is significantly higher than the darkening reac-tion (evaluated with L/L0 parameter) rate, indicating thatdarkening may be related with the production of com-pounds formed later in the caramelisation reaction, asdescribed in literature (Kroh, 1994). However, the totalcolour difference rate, although with higher estimates, isnot significantly different from sucrose degradation rate.This may be indicative that other colour characteristicsmay be related with sucrose hydrolysis.
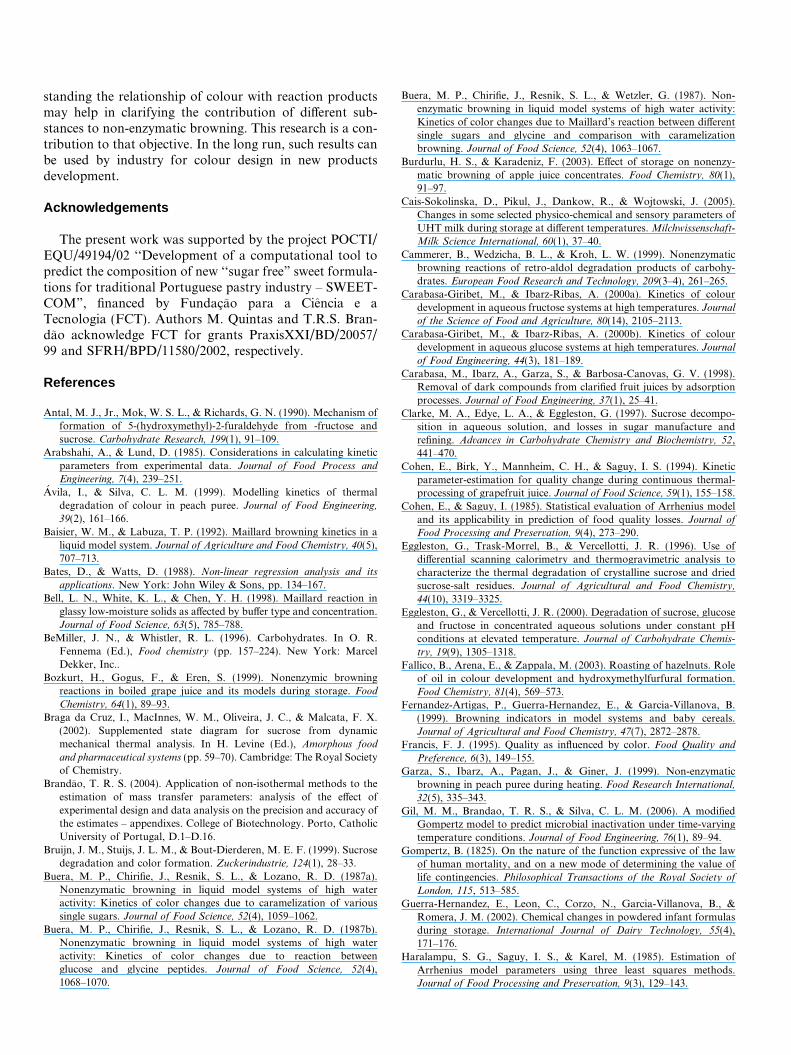
It is well known that HMF is a precursor of colouredcompounds in the caramelisation reaction (Kroh, 1994).The contribution of HMF content to the observed colourchanges was investigated on the basis of experimentaldata and fitting procedures. Based on visual inspectionof experimental data, models were proposed and fittedto data; regression quality was then assessed by evalua-tion of residuals randomness and normality. Lightness
Predicting colour changes with HMF content
Colour development vs sucrose degradation
Tab
le1
Res
ult
sfr
om
fitt
ing
the
mo
difi
edan
dre
par
amet
eris
edG
om
per
tzfu
nct
ion
sto
L/L
0d
ata
(Eq
.(4
))an
dT
CD
Hd
ata
(Eq
.(5
))
T(�
C)
Eq
.(4
)fi
tted
toL
/L0
dat
aE
q.
(5)
fitt
edto
TC
DH
dat
a
ak
max
(min�
1)
k(m
in)
R2
MS
ER
esid
ual
sa
km
ax(m
in�
1)
k(m
in)
R2
MS
ER
esid
ual
s
100
1.01
±3.
648.
34�
10�
5±
1.60�
10�
415
88.0
3±
5958
.38
0.88
06.
6�
10�
4+
3.89
±0.
355.
27�
10�
3±
3.25�
10�
378
6.46
±25
4.02
0.90
03.
1�
10�
1+
(359
)(1
92)
(375
)(9
)(6
2)(3
2)12
00.
35±
0.28
5.91�
10�
4±
2.28�
10�
412
3.30
±90
.46
0.85
21.
8�
10�
3+
4.65
±1.
011.
59�
10�
2±
1.07�
10�
241
.86
±96
.40
0.78
18.
6�
10�
1+
(81)
(39)
(73)
(22)
(67)
(230
)14
00.
28±
0.15
2.59�
10�
3±
1.67�
10�
323
.69
±29
.66
0.75
92.
9�
10�
3+
5.28
±0.
957.
95�
10�
2±
4.75�
10�
217
.08
±19
.66
0.83
38.
3�
10�
1+
(52)
(64)
(125
)(1
8)(6
0)(1
15)
160
0.34
±0.
041.
66�
10�
2±
4.53�
10�
37.
64±
2.53
0.95
38.
0�
10�
4+
6.05
±2.
013.
55�
10�
1±
2.63�
10�
12.
26±
5.80
0.79
91.
24+
(13)
(27)
(33)
(33)
(74)
(256
)
Est
imat
es±
95%
stan
dar
der
ror
and
(SH
W%
);R
egre
ssio
nan
alys
isb
yR
2,
MS
Ean
dre
sid
ual
s’in
spec
tio
n.
-2
-1
0
1
2
3
4
5
6
7
8
0 150 300 450 600
time (min)
TC
DH
Fig. 2. Typical behaviour of the 95% inference bands (dashed grey lines)observed for TCDH response. Example is for 120 �C processingtemperature.
Table 2Regression results from one-step Arrhenius fitting of Eqs. (4) and (5) to,respectively, L/L0 and TCDH experimental data (Tref = 130 �C)
L/L0 (Eq. (4)) TCDH (Eq. (5))
a 0.33 ± 0.05 –(15)
aintercept – �8.10 ± 7.86(97)
Slope – 3.24 � 10�2 ± 2.00 � 10�2
(62)kmaxref
1.21 � 10�3 ± 2.23 � 10�4 3.86 � 10�2± 1.18 � 10�2
(18) (31)Eakmax
1.24 � 105 ± 8.71 � 103 1.06 � 105 ± 1.65 � 104
(7) (16)kref 50.17 ± 23.09 28.72 ± 19.98
(46) (70)Eak �9.22 � 104 ± 2.38 � 104 �1.20 � 105 ± 3.63 � 104
(26) (30)R2 0.857 0.817MSE 1.66 � 10�3 0.764Residuals + +
Estimates ± 95% standard error and (SHW %); Regression analysis by R2,MSE and residuals’ inspection.
(L/L0) was found to follow a fractional conversionmodel in respect to HMF content (8), showing an equi-librium value. Such equilibrium demonstrates that HMFcontent alone does not explain the entire colour changesreaction.
LL0
¼ LL0
� �eq
þ 1� LL0
� �eq
" #e�k½HMF� ð8Þ
The total colour difference (TCDH) change with HMF con-tent was found to follow a power law (Eq. (9)), which isconsistent with previous findings (Lee & Nagy, 1988).
TCDH ¼ A½HMF�B ð9ÞIn both cases, no significant effect of temperature was ob-served in the estimated parameters. As a result, the models(8) and (9) were fitted to experimental data, of L/L0 andTCDH, respectively, at all temperatures (Fig. 4 and Table
1
10
100
1000
10000
100 120 140 160
Temperature (ºC)
λ(m
in)
1.0E-05
1.0E-04
1.0E-03
1.0E-02
1.0E-01
1.0E+00
100 120 140 160
Temperature (ºC)
km
ax(m
in-1)
Sucrose degradation TCDH L/L 0
Fig. 3. Comparison of sucrose degradation k and kmax parameters (from Quintas et al., 2007) with estimated parameters for TCDH and L/L0 description.Bars indicate the 95% confidence limits.
0.5
0.6
0.7
0.8
0.9
1
1.1
1.2
0.00E+00 5.00E-03 1.00E-02 1.50E-02 2.00E-02
HMF content
L/L
0
0
1
2
3
4
5
6
7
8
0.0E+00 5.0E-03 1.0E-02 1.5E-02 2.0E-02
HMF content
TC
DH
100ºC 120ºC 140ºC 160ºC100ºC 120ºC 140ºC 160ºC
Fig. 4. Dependence of L/L0 and TCDH on HMF content. Models (8) and (9) fitted to experimental data at different temperatures.
Table 3Regression results from Eqs. (8) and (9) to, respectively, L/L0 and TCDH
experimental data at all temperatures
L/L0 (Eq. (8)) TCDH (Eq. (9))
A – 11.94 ± 3.04(25)
B – 0.176 ± 0.042(24)
(L/L0)eq 0.729 ± 0.025 –(3)
k 463.72 ± 132.03 –(28)
R2 0.765 0.661MSE 2.40 � 10�3 9.02 � 10�1
Estimates ± 95% standard error and (SHW %); Regression analysis by R2
and MSE.
3). Experimental data was successfully described by theproposed models. The observed equilibrium value in thecolour parameters, prove that HMF content alone is notable to explain colour changes throughout caramelisationreaction.
Conclusion
Colour changes due to caramelisation reaction wereevaluated by L/L0 and TCDH. An autocatalytic behaviourwas observed, similar to sucrose degradation kinetics underthe same conditions. The Gompertz model was successfullymodified and reparameterised to describe kinetic behaviourand the temperature effect on the reaction was described byArrhenius type dependency. Estimated colour kineticparameters where related with literature sucrose degrada-tion parameters: (i) the lag phase was of the same magni-tude in both phenomena; (ii) kmax comparison showeddifferent reaction rates, indicating that not only sucrosecontributes to colour alterations. The contribution ofHMF content to colour changes was studied and a frac-tional conversion and a power law models were found todescribe L/L0 and TCDH experimental data, respectively.
Knowledge of colour change kinetics is important forindustrial process design and control. Furthermore, thiswork reinforces the use of sigmoid functions to describeautocatalytic behaviour and emphasizes the importanceof inference bands on model’s predicting ability. Under-
standing the relationship of colour with reaction productsmay help in clarifying the contribution of different sub-stances to non-enzymatic browning. This research is a con-tribution to that objective. In the long run, such results canbe used by industry for colour design in new productsdevelopment.
Acknowledgements
The present work was supported by the project POCTI/EQU/49194/02 ‘‘Development of a computational tool topredict the composition of new ‘‘sugar free” sweet formula-tions for traditional Portuguese pastry industry – SWEET-COM”, financed by Fundac�ao para a Ciencia e aTecnologia (FCT). Authors M. Quintas and T.R.S. Bran-dao acknowledge FCT for grants PraxisXXI/BD/20057/99 and SFRH/BPD/11580/2002, respectively.
References
Antal, M. J., Jr., Mok, W. S. L., & Richards, G. N. (1990). Mechanism offormation of 5-(hydroxymethyl)-2-furaldehyde from -fructose andsucrose. Carbohydrate Research, 199(1), 91–109.
Arabshahi, A., & Lund, D. (1985). Considerations in calculating kineticparameters from experimental data. Journal of Food Process and
Engineering, 7(4), 239–251.Avila, I., & Silva, C. L. M. (1999). Modelling kinetics of thermal
degradation of colour in peach puree. Journal of Food Engineering,
39(2), 161–166.Baisier, W. M., & Labuza, T. P. (1992). Maillard browning kinetics in a
liquid model system. Journal of Agriculture and Food Chemistry, 40(5),707–713.
Bates, D., & Watts, D. (1988). Non-linear regression analysis and its
applications. New York: John Wiley & Sons, pp. 134–167.Bell, L. N., White, K. L., & Chen, Y. H. (1998). Maillard reaction in
glassy low-moisture solids as affected by buffer type and concentration.Journal of Food Science, 63(5), 785–788.
BeMiller, J. N., & Whistler, R. L. (1996). Carbohydrates. In O. R.Fennema (Ed.), Food chemistry (pp. 157–224). New York: MarcelDekker, Inc..
Bozkurt, H., Gogus, F., & Eren, S. (1999). Nonenzymic browningreactions in boiled grape juice and its models during storage. Food
Chemistry, 64(1), 89–93.Braga da Cruz, I., MacInnes, W. M., Oliveira, J. C., & Malcata, F. X.
(2002). Supplemented state diagram for sucrose from dynamicmechanical thermal analysis. In H. Levine (Ed.), Amorphous food
and pharmaceutical systems (pp. 59–70). Cambridge: The Royal Societyof Chemistry.
Brandao, T. R. S. (2004). Application of non-isothermal methods to theestimation of mass transfer parameters: analysis of the effect ofexperimental design and data analysis on the precision and accuracy ofthe estimates – appendixes. College of Biotechnology. Porto, CatholicUniversity of Portugal, D.1–D.16.
Bruijn, J. M., Stuijs, J. L. M., & Bout-Dierderen, M. E. F. (1999). Sucrosedegradation and color formation. Zuckerindustrie, 124(1), 28–33.
Buera, M. P., Chirifie, J., Resnik, S. L., & Lozano, R. D. (1987a).Nonenzymatic browning in liquid model systems of high wateractivity: Kinetics of color changes due to caramelization of varioussingle sugars. Journal of Food Science, 52(4), 1059–1062.
Buera, M. P., Chirifie, J., Resnik, S. L., & Lozano, R. D. (1987b).Nonenzymatic browning in liquid model systems of high wateractivity: Kinetics of color changes due to reaction betweenglucose and glycine peptides. Journal of Food Science, 52(4),1068–1070.
Buera, M. P., Chirifie, J., Resnik, S. L., & Wetzler, G. (1987). Non-enzymatic browning in liquid model systems of high water activity:Kinetics of color changes due to Maillard’s reaction between differentsingle sugars and glycine and comparison with caramelizationbrowning. Journal of Food Science, 52(4), 1063–1067.
Burdurlu, H. S., & Karadeniz, F. (2003). Effect of storage on nonenzy-matic browning of apple juice concentrates. Food Chemistry, 80(1),91–97.
Cais-Sokolinska, D., Pikul, J., Dankow, R., & Wojtowski, J. (2005).Changes in some selected physico-chemical and sensory parameters ofUHT milk during storage at different temperatures. Milchwissenschaft-
Milk Science International, 60(1), 37–40.Cammerer, B., Wedzicha, B. L., & Kroh, L. W. (1999). Nonenzymatic
browning reactions of retro-aldol degradation products of carbohy-drates. European Food Research and Technology, 209(3–4), 261–265.
Carabasa-Giribet, M., & Ibarz-Ribas, A. (2000a). Kinetics of colourdevelopment in aqueous fructose systems at high temperatures. Journal
of the Science of Food and Agriculture, 80(14), 2105–2113.Carabasa-Giribet, M., & Ibarz-Ribas, A. (2000b). Kinetics of colour
development in aqueous glucose systems at high temperatures. Journal
of Food Engineering, 44(3), 181–189.Carabasa, M., Ibarz, A., Garza, S., & Barbosa-Canovas, G. V. (1998).
Removal of dark compounds from clarified fruit juices by adsorptionprocesses. Journal of Food Engineering, 37(1), 25–41.
Clarke, M. A., Edye, L. A., & Eggleston, G. (1997). Sucrose decompo-sition in aqueous solution, and losses in sugar manufacture andrefining. Advances in Carbohydrate Chemistry and Biochemistry, 52,441–470.
Cohen, E., Birk, Y., Mannheim, C. H., & Saguy, I. S. (1994). Kineticparameter-estimation for quality change during continuous thermal-processing of grapefruit juice. Journal of Food Science, 59(1), 155–158.
Cohen, E., & Saguy, I. (1985). Statistical evaluation of Arrhenius modeland its applicability in prediction of food quality losses. Journal of
Food Processing and Preservation, 9(4), 273–290.Eggleston, G., Trask-Morrel, B., & Vercellotti, J. R. (1996). Use of
differential scanning calorimetry and thermogravimetric analysis tocharacterize the thermal degradation of crystalline sucrose and driedsucrose-salt residues. Journal of Agricultural and Food Chemistry,
44(10), 3319–3325.Eggleston, G., & Vercellotti, J. R. (2000). Degradation of sucrose, glucose
and fructose in concentrated aqueous solutions under constant pHconditions at elevated temperature. Journal of Carbohydrate Chemis-
try, 19(9), 1305–1318.Fallico, B., Arena, E., & Zappala, M. (2003). Roasting of hazelnuts. Role
of oil in colour development and hydroxymethylfurfural formation.Food Chemistry, 81(4), 569–573.
Fernandez-Artigas, P., Guerra-Hernandez, E., & Garcia-Villanova, B.(1999). Browning indicators in model systems and baby cereals.Journal of Agricultural and Food Chemistry, 47(7), 2872–2878.
Francis, F. J. (1995). Quality as influenced by color. Food Quality and
Preference, 6(3), 149–155.Garza, S., Ibarz, A., Pagan, J., & Giner, J. (1999). Non-enzymatic
browning in peach puree during heating. Food Research International,
32(5), 335–343.Gil, M. M., Brandao, T. R. S., & Silva, C. L. M. (2006). A modified
Gompertz model to predict microbial inactivation under time-varyingtemperature conditions. Journal of Food Engineering, 76(1), 89–94.
Gompertz, B. (1825). On the nature of the function expressive of the lawof human mortality, and on a new mode of determining the value oflife contingencies. Philosophical Transactions of the Royal Society of
London, 115, 513–585.Guerra-Hernandez, E., Leon, C., Corzo, N., Garcia-Villanova, B., &
Romera, J. M. (2002). Chemical changes in powdered infant formulasduring storage. International Journal of Dairy Technology, 55(4),171–176.
Haralampu, S. G., Saguy, I. S., & Karel, M. (1985). Estimation ofArrhenius model parameters using three least squares methods.Journal of Food Processing and Preservation, 9(3), 129–143.
Hutchings, J. B. (1994). Food colour and appearance. Glasgow: BlackieAcademic & Professional, p. 513.
Ibarz, A., Pagan, J., & Garza, S. (2000). Kinetic models of non-enzymaticbrowning in apple puree. Journal of the Science of Food and
Agriculture, 80(8), 1162–1168.Imming, R., Buczys, R., Lehnberger, A., & Bliesener, K. M. (1996). A new
approach to the kinetics of colour formation in concentrated carbo-hydrate solutions. Starch/Starke, 48(5), 163–166.
Kadakal, C., & Nas, S. (2003). Effect of heat treatment and evaporationon patulin and some other properties of apple juice. Journal of the
Science of Food and Agriculture, 83(9), 987–990.Karel, M., & Labuza, T. P. (1968). Nonenzymatic browning in model
systems containing sucrose. Journal of Agriculture and Food Chemistry,
16(5), 717–719.Kroh, L. W. (1994). Caramelisation in food and beverages. Food
Chemistry, 51(4), 373–379.Kumar, P., & Mishra, H. N. (2004). Storage stability of mango soy
fortified yoghurt powder in two different packaging materials: HDPPand ALP. Journal of Food Engineering, 65(4), 569–576.
Labuza, T. P., Tannenbaum, S. R., & Karel, M. (1970). Water content andstability of low moisture and intermediate-moisture foods. Food
Technology, 24(5), 543–548.Lee, H. S., & Nagy, S. (1988). Relationship of sugar degradation to
detrimental changes in citrus juice quality. Food Technology, 42(10),91–97.
Lievonen, S. M., Laaksonen, T. J., & Roos, Y. H. (1998). Glass transitionand reaction rates: Nonenzymatic browning in glassy and liquidsystems. Journal of Agricultural and Food Chemistry, 46(7), 2778–2784.
Lowary, T. L., & Richards, G. N. (1988). Effects of impurities onhydrolysis of sucrose in concentrated aqueous solutions. International
Sugar Journal, 90(1077), 164–167.Lund, D. B. (1983). Considerations in modeling food processes. Food
Technology, 37(1), 92–94.Mauch, W. (1971). Chemical properties of sucrose. Sugar Technology
Reviews, 1, 239–290.Miao, S., & Roos, Y. H. (2004). Nonenzymatic browning kinetics of a
carbohydrate-based low-moisture food system at temperatures appli-cable to spray drying. Journal of Agricultural and Food Chemistry,
52(16), 5250–5257.Patel, A. A., Gandhi, H., Singh, S., & Patil, G. R. (1996). Shelf-life
modeling of sweetened condensed milk based on kinetics ofMaillard browning. Journal of Food Processing and Preservation,
20(6), 431–451.Peleg, M. (1992). On the use of the WLF model in polymers and foods.
Critical Reviews in Food Science and Nutrition, 32(1), 59–66.Quintas, M., Brandao, T. R. S., & Silva, C. L. M. (2007). Modelling
autocatalytic behaviour of a food model system – sucrose thermal
degradation at high concentrations. Journal of Food Engineering, 78(2),537–545.
Ramirez-Jimenez, A., Garcia-Villanova, B., & Guerra-Hernandez, E.(2000). Hydroxymethylfurfural and methylfurfural content of selectedbakery products. Food Research International, 33(10), 833–838.
Ramirez-Jimenez, A., Garcia-Villanova, B., & Guerra-Hernandez, E.(2001). Effect of toasting time on the browning of sliced bread. Journal
of the Science of Food and Agriculture, 81(5), 513–518.Ramirez-Jimenez, A., Guerra-Hernandez, E., & Garcia-Villanova, B.
(2000). Browning indicators in bread. Journal of Agricultural and Food
Chemistry, 48(9), 4176–4181.Ramirez-Jimenez, A., Guerra-Hernandez, E., & Garcia-Villanova, B.
(2003). Evolution of non-enzymatic browning during storage of infantrice cereal. Food Chemistry, 83(2), 219–225.
Rattanathanalerk, M., Chiewchan, N., & Srichumpoung, W. (2005). Effectof thermal processing on the quality loss of pineapple juice. Journal of
Food Engineering, 66(2), 259–265.Reyes, F. G. R., Poocharoen, B., & Wrolstad, R. E. (1982). Maillard
browning reaction of sugar–glycine model systems – changes in sugarconcentration, color and appearance. Journal of Food Science, 47(4),1376–1377.
Richards, G. N. (1986). Initial steps in thermal degradation of sucrose.International Sugar Journal, 88(1052), 145–148.
Schebor, C., Buera, M. D., Karel, M., & Chirife, J. (1999). Colorformation due to non-enzymatic browning in amorphous, glassy,anhydrous, model systems. Food Chemistry, 65(4), 427–432.
Shen, S. C., & Wu, J. S. B. (2004). Maillard browning in ethanolicsolution. Journal of Food Science, 69(4), C273–C279.
Silva, F. M., & Silva, C. L. M. (1999). Colour changes in thermallyprocessed cupuacu (theobroma grandiflorum) puree: Critical times andkinetics modelling. International Journal of Food Science and Technol-
ogy, 34(1), 87–94.Terrab, A., Gonzalez, A. G., Diez, M. J., & Heredia, F. J. (2003).
Characterisation of moroccan unifloral honeys using multivariateanalysis. European Food Research and Technology, 218(1), 88–95.
Tosun, I. (2004). Color changes and 5-hydroxymethyl furfural formationin zile pekmezi during storage. Grasas Y Aceites, 55(3), 259–263.
van Boekel, M. A. J. S. (1996). Statistical aspects of kinetic modeling forfood science problems. Journal of Food Science, 61(3), 447–485, 489.
Villota, R., & Hawkes, J. G. (1992). Reaction kinetics in food systems. InD. R. Heldman & D. B. Lund (Eds.), Handbook of food engineering
(pp. 39–144). New York: Marcel Dekker, Inc..Vukov, K. (1965). Kinetic aspects of sucrose hydrolysis. The International
Sugar Journal, 67, 172–175.Zwietering, M. H., Jongenburger, I., Rombouts, F. M., & Riet, K. V. t.
(1990). Modeling of the bacterial growth curve. Applied and Environ-
mental Microbiology, 56(6), 1875–1881.
Related Documents