International Journal of Engineering and Technology Volume 3 No. 7, July, 2013 ISSN: 2049-3444 © 2013 – IJET Publications UK. All rights reserved. 736 Modelling and Simulation of Glycol Dehydration Unit of a Natural Gas Plant Akpa, Jackson Gunorubon 1 , Igbagara, Princewill W 2 . 1 Department of Chemical/Petrochemical Engineering Rivers State University of Science and Technology, Port-Harcourt, Rivers State, Nigeria 2 Department of Chemical Engineering University of Uyo, Uyo, Akwa-Ibom State, Nigeria ABSTRACT Mathematical models for the prediction of water content, gas and solvent temperatures of the absorber of a natural gas glycol dehydration facility were developed. The models developed contain contributions from bulk and diffusion flows, however only the effect of diffusion on the process occurring in the absorber was studied. The developed models were second order partial differential equations. The Laplace transform technique was applied to obtain analytical solutions of the model equations. The models were validated using the plant data from an SPDC TEG unit in Gbaran Ubie, Bayelsa State. The results showed a reasonable agreement between the model predictions and industrial plant data. The model predicted the amount of water in the gas stream at the end of the absorption process very accurately with a deviation of 0%., the gas and solvent temperatures with deviations of 1.584% and 2.844% respectively. These results show that diffusion alone can be use to accurately model the absorption process. The effects of certain process variables such as residence time, gas inlet water content, mass and thermal Diffusivities of the gas on the performance of the absorber was studied Keywords: modeling, simulation, absorption unit, dehydration, natural gas, water content, Triethylene glycol. NOMENCLATURE C Ag Concentration of water vapour in the gas stream, mol/m 3 D A Mass diffusivity of water vapour, m 2 /s K G Thermal diffusivity of TEG, m 2 /s L K Thermal conductivity of TEG, KW/m 2 K K T Thermal diffusivity of water vapour, m 2 /s M i Molar mass of component i, kg/kmol s Laplace transforms variable t Residence time, s. T g Gas temperature, °C T L Liquid (TEG) temperature, °C V 1 Molar volume of water vapour, m 3 /kmol g V Gas velocity, m/s 2 Solvent association parameter for TEG x A Water content, weight % y A Water content, mole %, mole fraction or lb H 2 O/MMscf A y Water content in the Laplace domain z Packing height, m μ 2 Viscosity of TEG, Pa.sec π Pi ρ i Density of component i, kg/m 3

Welcome message from author
This document is posted to help you gain knowledge. Please leave a comment to let me know what you think about it! Share it to your friends and learn new things together.
Transcript
International Journal of Engineering and Technology Volume 3 No. 7, July, 2013
ISSN: 2049-3444 © 2013 – IJET Publications UK. All rights reserved. 736
Modelling and Simulation of Glycol Dehydration Unit of a
Natural Gas Plant
Akpa, Jackson Gunorubon1, Igbagara, Princewill W
2.
1Department of Chemical/Petrochemical Engineering
Rivers State University of Science and Technology,
Port-Harcourt, Rivers State, Nigeria 2Department of Chemical Engineering
University of Uyo, Uyo, Akwa-Ibom State, Nigeria
ABSTRACT
Mathematical models for the prediction of water content, gas and solvent temperatures of the absorber of a natural gas glycol
dehydration facility were developed. The models developed contain contributions from bulk and diffusion flows, however
only the effect of diffusion on the process occurring in the absorber was studied. The developed models were second order
partial differential equations. The Laplace transform technique was applied to obtain analytical solutions of the model
equations. The models were validated using the plant data from an SPDC TEG unit in Gbaran Ubie, Bayelsa State. The
results showed a reasonable agreement between the model predictions and industrial plant data. The model predicted the
amount of water in the gas stream at the end of the absorption process very accurately with a deviation of 0%., the gas and
solvent temperatures with deviations of 1.584% and 2.844% respectively. These results show that diffusion alone can be use
to accurately model the absorption process. The effects of certain process variables such as residence time, gas inlet water
content, mass and thermal Diffusivities of the gas on the performance of the absorber was studied
Keywords: modeling, simulation, absorption unit, dehydration, natural gas, water content, Triethylene glycol.
NOMENCLATURE
CAg Concentration of water vapour in the gas stream, mol/m3
DA Mass diffusivity of water vapour, m2/s
KG Thermal diffusivity of TEG, m2/s
LK Thermal conductivity of TEG, KW/m2K
KT Thermal diffusivity of water vapour, m2/s
Mi Molar mass of component i, kg/kmol
s Laplace transforms variable
t Residence time, s.
Tg Gas temperature, °C
TL Liquid (TEG) temperature, °C
V1 Molar volume of water vapour, m3/kmol
gV Gas velocity, m/s
2 Solvent association parameter for TEG
xA Water content, weight %
yA Water content, mole %, mole fraction or lb H2O/MMscf
Ay Water content in the Laplace domain
z Packing height, m
μ2 Viscosity of TEG, Pa.sec
π Pi
ρi Density of component i, kg/m3
International Journal of Engineering and Technology (IJET) – Volume 3 No. 7, July, 2013
ISSN: 2049-3444 © 2013 – IJET Publications UK. All rights reserved. 737
1. INTRODUCTION
Raw natural gas can be obtained from oil wells, gas wells
and condensate wells (Ikoku, 1992). It is “associated gas”
when it is obtained from oil wells and can exist separate
from the crude oil (as free gas) or dissolved in the oil (as
dissolved gas); it is “non-associated gas” when obtained
from gas or condensate wells; in this form it is found with
little or no crude oil (Guo and Ghalambork, 2005).
Natural gas is composed almost entirely of methane.
However, whatever its source, natural gas commonly
exists in a mixture with other hydrocarbons, principally
ethane, propane, butane, and pentanes. In addition, raw
natural gas also contains water vapor, hydrogen sulphide,
carbon dioxide, helium, nitrogen and other trace
compounds ( Spieight, 2007).
Natural gas from the well has to be transported via
pipelines to where it is processed and to end users or
buyers. Natural gas to be transported by pipelines or
processed, must meet certain specifications. Such
specifications include delivery pressure, rate, temperature,
allowable concentrations of contaminants such as carbon
dioxide (CO2) and hydrogen sulfide (H2S), cleanliness
(allowable solid content), minimum heating value and
maximum water content (water dew point) (Kazemi and
Hamidi, 2011) .
Water vapour is the most common undesirable impurity
found in natural gas and is usually present in
concentrations in the range of 400-600 lbH20/MMSCF of
gas (Ikoku, 1992). In the course of transmission and
processing, change in temperature and pressure of the
natural gas occur. These changes in temperature and
pressure condense the natural gas vapor altering its
physical state from gas to liquid and or liquid to solid.
These changes in state result in diverse problems for the
transmission lines and processing facilities such as
plugging of transmission lines (pipelines) and equipment
such as valves by hydrates formed by the physical
combination of water and natural gas/molecules of
hydrocarbon, corrosion by acidic solutions formed by the
dissolution of water in hydrogen sulphide and or carbon
dioxide contained in natural gas, low flow efficiency and
corrosion due to slugging flow conditions by liquid water
in natural gas and decrease in the heating value due to the
water content in the natural gas. To avoid these problems
water vapor in the natural gas must be reduced to
acceptable industrial levels typically in the range of 4 to 7
lb per MMSCF (Ikoku, 1992 and GPSA, 2004). Hence
natural gas treatment is essential.
Methods for water treating of natural gas includes:
adsorption (Kohl and Riesenfeld, 1974), absorption
(Campbell et al., 1982), membrane process (Shell, 1982.),
methanol process (Minkkinen, 1992.) and refrigeration
(Kindnay and Parish, 2006). Amongst these methods
absorption using liquid solvent (triethylene glycol TEG)
as absorbent remains the most popular (Kindnay and
Parish, (2006), Manning and Thomson, (1991), Gas
Processors Suppliers Association, (2004)). The treatment
method used is expected to reduce the amount of water in
the natural gas to levels required for safe gas transmission
by pipelines and that do not cause any damage to
equipment.
To achieve this, the dehydration unit or plant has to be
properly designed. Modeling and simulation of the
absorber gives insight into the performance of the
absorber at varying operating conditions and provides
sufficient data required for proper design. Modeling of the
absorber could be performed via a thermodynamic or
fundamental model.
Thermodynamic models involve the selection of a suitable
thermodynamic model and software simulator while
fundamental models involve the use of conservation
principles to develop mathematical equations of the
process. Works on thermodynamic models abound
(Kazemi and Hamidi, (2011), Peyghambarzadeh and
Jafarpour (2006)); where the thermodynamic behavior of
the system (TEG-Water) were represented by means of
the Peng and Robinson equation of state or the cubic
equation of state while software simulators commonly
used includes Aspen-Hysys, Chemcad and Pro II.
Thermodynamic modelling of the TEG-water system is
still being reported (Kazemi and Hamidi, 2011) to be
rather inaccurate.
Fundamental models are derived from mass, energy and
momentum balances of the process, these abound for
similar systems with vary complexities; Gomez et al.,
(2003) modeled only bulk flow contribution while Ahmed
et al., (2007) and John, (2009) modeled bulk and diffusion
contributions. The contribution of the diffusion term to
the absorption process and the efficiency of the absorber
have not been investigated. The effects of diffusion on the
mathematical models for gas absorption are therefore
investigated in this work.
2. PROCESS DESCRIPTION
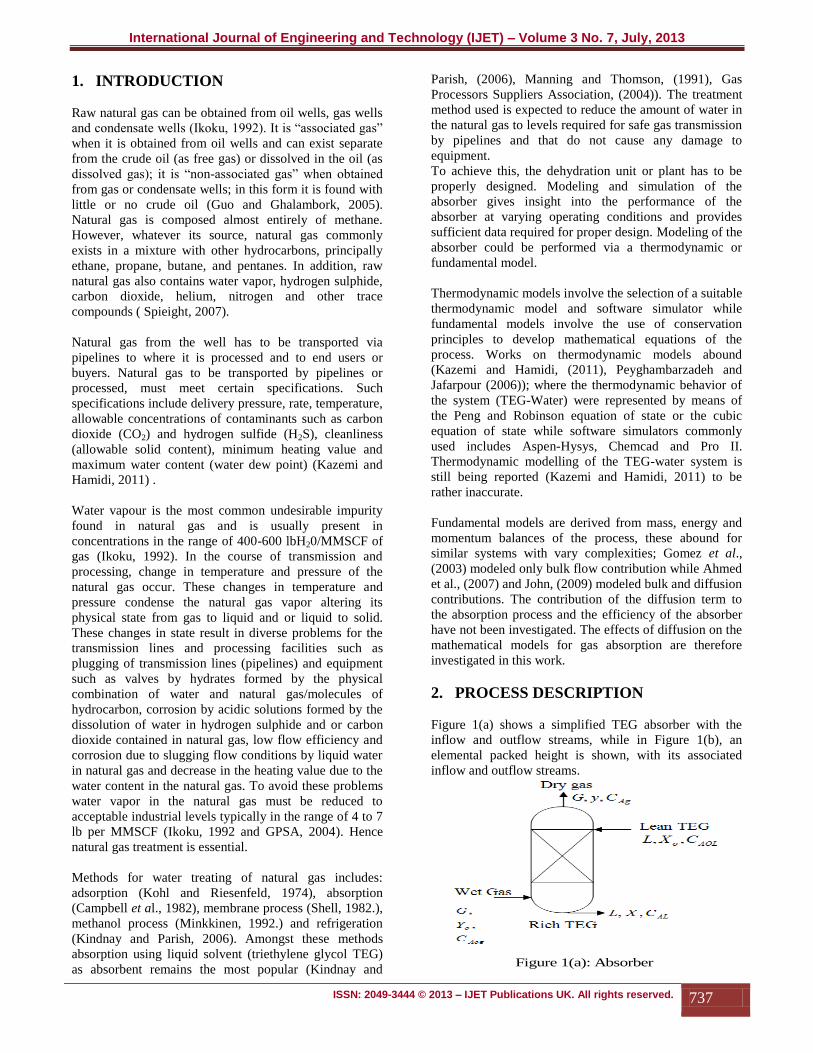
Figure 1(a) shows a simplified TEG absorber with the
inflow and outflow streams, while in Figure 1(b), an
elemental packed height is shown, with its associated
inflow and outflow streams.
Figure 1(a): Absorber
International Journal of Engineering and Technology (IJET) – Volume 3 No. 7, July, 2013
ISSN: 2049-3444 © 2013 – IJET Publications UK. All rights reserved. 738
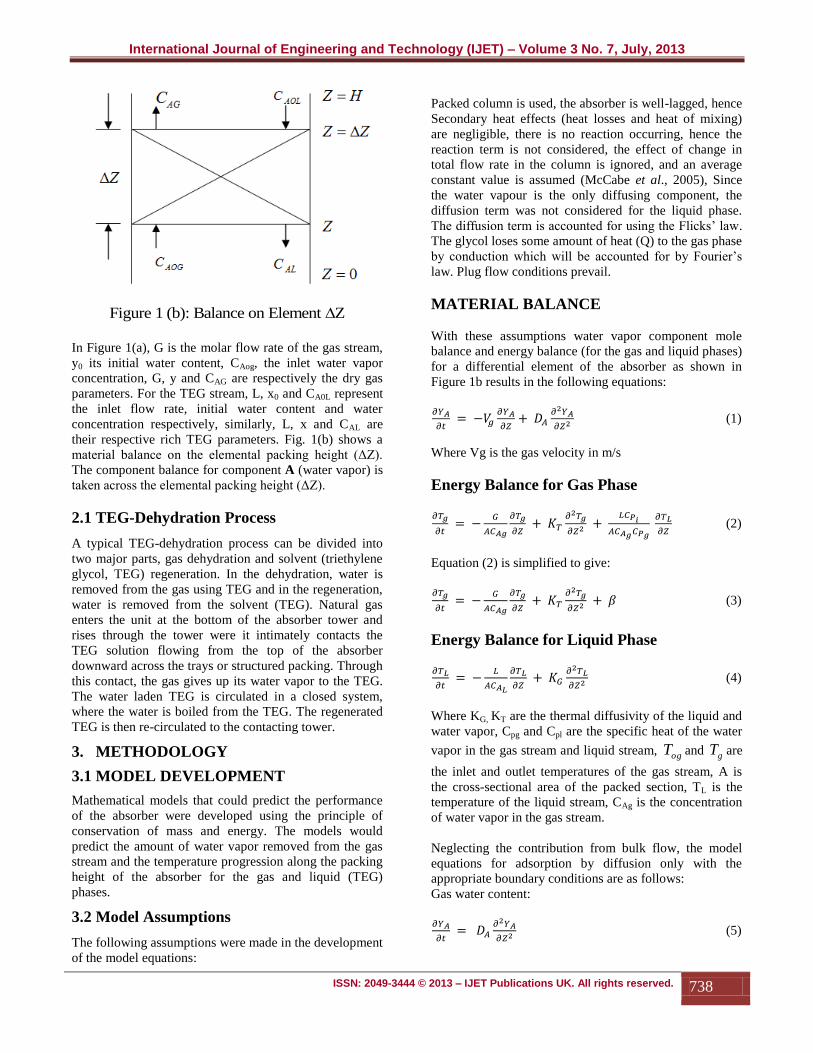
Figure 1 (b): Balance on Element Z
In Figure 1(a), G is the molar flow rate of the gas stream,
y0 its initial water content, CAog, the inlet water vapor
concentration, G, y and CAG are respectively the dry gas
parameters. For the TEG stream, L, x0 and CA0L represent
the inlet flow rate, initial water content and water
concentration respectively, similarly, L, x and CAL are
their respective rich TEG parameters. Fig. 1(b) shows a
material balance on the elemental packing height (ΔZ).
The component balance for component A (water vapor) is
taken across the elemental packing height (ΔZ).
2.1 TEG-Dehydration Process
A typical TEG-dehydration process can be divided into
two major parts, gas dehydration and solvent (triethylene
glycol, TEG) regeneration. In the dehydration, water is
removed from the gas using TEG and in the regeneration,
water is removed from the solvent (TEG). Natural gas
enters the unit at the bottom of the absorber tower and
rises through the tower were it intimately contacts the
TEG solution flowing from the top of the absorber
downward across the trays or structured packing. Through
this contact, the gas gives up its water vapor to the TEG.
The water laden TEG is circulated in a closed system,
where the water is boiled from the TEG. The regenerated
TEG is then re-circulated to the contacting tower.
3. METHODOLOGY
3.1 MODEL DEVELOPMENT
Mathematical models that could predict the performance
of the absorber were developed using the principle of
conservation of mass and energy. The models would
predict the amount of water vapor removed from the gas
stream and the temperature progression along the packing
height of the absorber for the gas and liquid (TEG)
phases.
3.2 Model Assumptions
The following assumptions were made in the development
of the model equations:
Packed column is used, the absorber is well-lagged, hence
Secondary heat effects (heat losses and heat of mixing)
are negligible, there is no reaction occurring, hence the
reaction term is not considered, the effect of change in
total flow rate in the column is ignored, and an average
constant value is assumed (McCabe et al., 2005), Since
the water vapour is the only diffusing component, the
diffusion term was not considered for the liquid phase.
The diffusion term is accounted for using the Flicks’ law.
The glycol loses some amount of heat (Q) to the gas phase
by conduction which will be accounted for by Fourier’s
law. Plug flow conditions prevail.
MATERIAL BALANCE
With these assumptions water vapor component mole
balance and energy balance (for the gas and liquid phases)
for a differential element of the absorber as shown in
Figure 1b results in the following equations:
(1)
Where Vg is the gas velocity in m/s
Energy Balance for Gas Phase
(2)
Equation (2) is simplified to give:
(3)
Energy Balance for Liquid Phase
(4)
Where KG, KT are the thermal diffusivity of the liquid and
water vapor, Cpg and Cpl are the specific heat of the water
vapor in the gas stream and liquid stream, ogT and gT are
the inlet and outlet temperatures of the gas stream, A is
the cross-sectional area of the packed section, TL is the
temperature of the liquid stream, CAg is the concentration
of water vapor in the gas stream.
Neglecting the contribution from bulk flow, the model
equations for adsorption by diffusion only with the
appropriate boundary conditions are as follows:
Gas water content:
(5)
International Journal of Engineering and Technology (IJET) – Volume 3 No. 7, July, 2013
ISSN: 2049-3444 © 2013 – IJET Publications UK. All rights reserved. 739
(6)
(7)
Gas Temperature progression:
(8)
(9)
(10)
TEG Temperature progression:
(11)
(12)
(13)
4. SOLUTION TECHNIQUE OF MODEL
EQUATION
The model equations developed were 2nd
order partial
differential equations. The transform method which
reduces a given partial differential equation and its
boundary conditions to an ordinary differential equation
by applying the integral transform with respect to one of
the independent variables (Stephenson, 1986), in this case
time (t) was adapted for the solution of the model
equations. The Laplace transform was used to transform
the differential term with respect to the independent
variable (t) in the model equations, thus converting the
equations to 2nd
order ordinary differential equations in
the independent variable, z. The resultant 2nd
order
differential equations were then solved analytically; the
results being in the s domain were inverted back to the t
domain using inverse Laplace transform and finally given
in a suitable form using appropriate mathematical
manipulations.
Applying this procedure to equation (5); the Laplace
transform of eqn. (5) with respect to time gives:
(14)
Substituting the boundary condition, equation (6) into
equation (14) gives:
(15)
The solution of equation (15) is:
(16)
The solution of the characteristic equation of equation
(15) gives:
(17)
Substituting equation (17) into equation (16) gives:
(18)
Where A and B are the constants of integration.
According to Stephenson (1986), to obtain a bounded
solution for ),( tzyA, ),( szy
A should be bounded.
Accordingly, the constant A in equation (18) is taken to
be zero and substituting the initial condition, equation (7);
the solution of equation (18) is:
(19)
Equation (19) is inverted to the time domain to yield:
(20)
Using appropriate series expansion, equation (20) is
written finally as:
(21)
The same procedure was followed to solve the other
model equations to yield:
(22)
(23)
5. OPERATING PARAMETERS
To use the final model equations of the absorber (eqns.
(21), (22) and (23)) require the determination of certain
constants, physical properties and compositions of natural
gas, water vapor and triethylene glycol. These properties
were determined as follows:
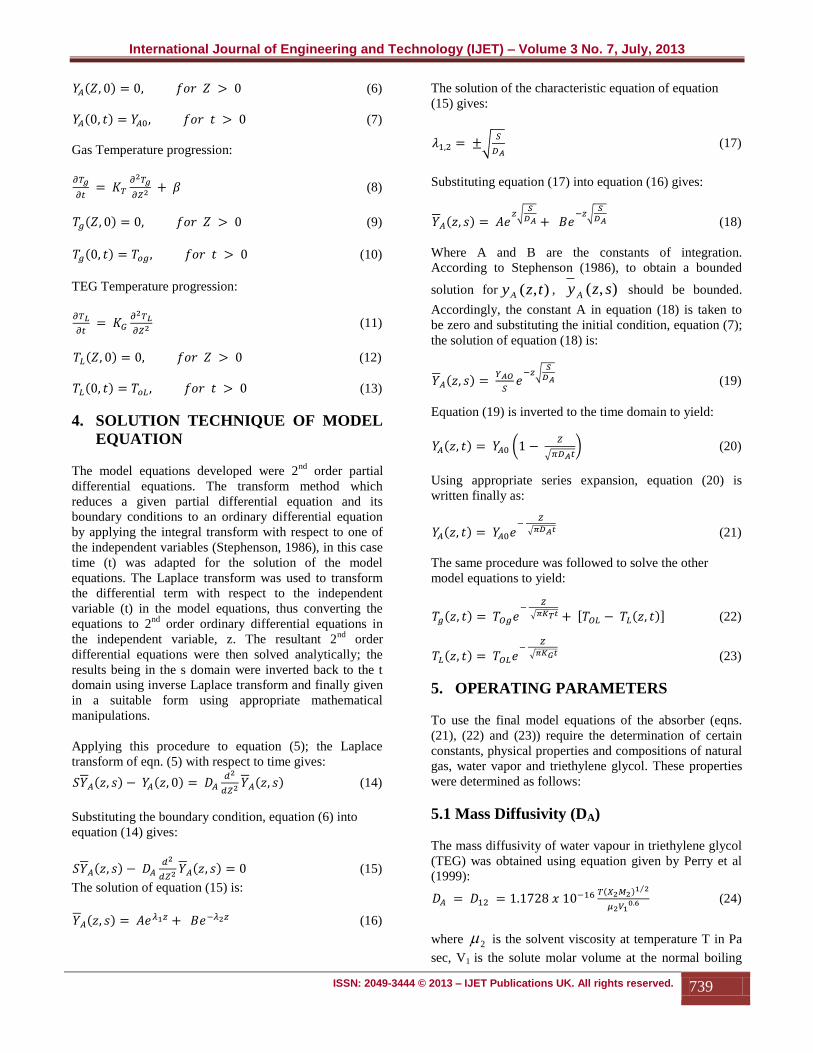
5.1 Mass Diffusivity (DA)
The mass diffusivity of water vapour in triethylene glycol
(TEG) was obtained using equation given by Perry et al
(1999):
(24)
where 2 is the solvent viscosity at temperature T in Pa
sec, V1 is the solute molar volume at the normal boiling
International Journal of Engineering and Technology (IJET) – Volume 3 No. 7, July, 2013
ISSN: 2049-3444 © 2013 – IJET Publications UK. All rights reserved. 740
point in m3/kmole, x2 is the solvent association parameter
and M2 he solvent molecular weight.
5.2 Thermal Diffusivity (KT)
The thermal diffusivity of water vapor was obtained online
from http://en.wikipedia.org/wiki/thermal_diffusivity.
Physical Properties of Gas and Glycol (TEG)
The physical properties of the wet gas and glycol were
obtained from Perry et al (1999) and tabulated as shown
in Table 1.
Table 1: Physical properties of components (Perry et al, 1999)
Property TEG H2O Gas
Molar mass 150.17 18.02 19.83
Molar volume, m3/kmol 0.01813
Mass diffusivity, m2/s 3.80x10
-10
Thermal diffusivity, m2/s 2.338x10
-5
Density, kg/m3 1125 1000
Solvent Viscosity (Pa sec.) 0.01355515
Data from a Shell Petroleum Development Company gas dehydrating unit at Gbaran Ubie in Bayelsa State are given in Table
2 (SPDC Plant data, 2007). Table 2: Plant Data showing inlet conditions (SPDC, 2007)
COMPONENT GAS STREAM (Weight %) GLYCOL STREAM (Weight %)
INPUT OUTPUT INPUT OUTPUT
TEG - - 99.51 95.36
H2O 0.17 0.01 0.49 4.64
GAS 99.83 99.99 - -
TOTAL 100.00 100.00 100.00 100.00
TEMP 50.00 51.30 55.00 51
Absorber height 0.004m
6. DISCUSSION OF RESULTS
6.1 Model Validation
The input data in Table 2 were used in equations (21),
(22) and (23) to obtain the amount of water in the gas
stream and temperature of the gas and solvent streams as
predicted by the models developed. The results obtained
were tabulated in Table 3 with the outlet values of these
parameters from the SPDC gas absorption unit in Gbaran
Ubie for comparison.
Table 3: Comparison of model result and plant data
Parameter Plant data Model result % Deviation
Gas water content, mole
fraction
0.00011 1.0717x10⁻¹⁴
0
Gas temperature, °C 51.3 50.4874 1.584
TEG temperature, °C 51 49.5497 2.844
The results showed a reasonable agreement between the
model predictions and industrial plant data. The model
predicted the amount of water in the gas stream at the end
of the absorption process very accurately with a deviation
of 0%. The results also showed that the models accurately
predicted the gas and solvent temperatures with deviations
of 1.584% and 2.844% respectively. These trends are
shown in Figures 2 and 3 respectively.
International Journal of Engineering and Technology (IJET) – Volume 3 No. 7, July, 2013
ISSN: 2049-3444 © 2013 – IJET Publications UK. All rights reserved. 741
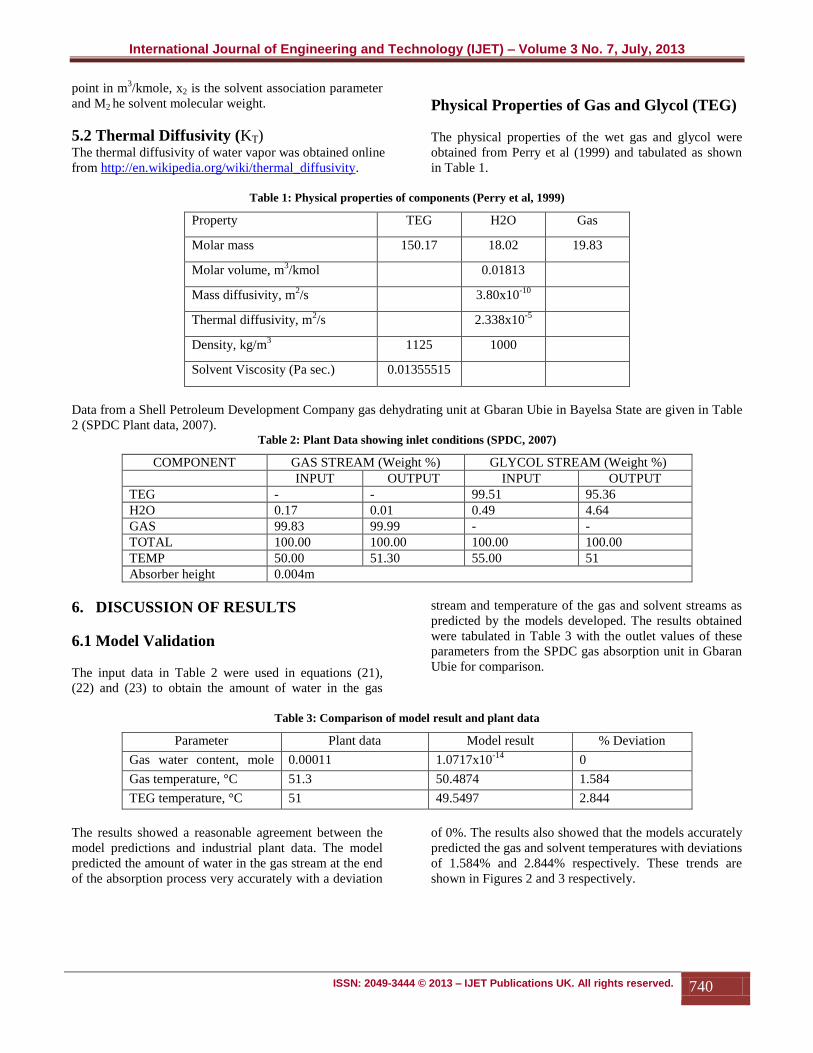
Figure 2: Variation of water content of gas with column height
The temperature of the gas stream increased gradually and
very slightly as the gas flows up the column while that of
the solvent decreased as it flows down the column. From
the ideal gas law, as temperature increases, the volume of
a gas also increases; therefore, at higher temperatures, less
gas is absorbed due its larger volume. This trend is seen in
Figure 2 from the very slow rate of absorption after the
initial high rate as the gas temperature increased slightly.
6.2 Model Simulation
The effects of residence time, gas inlet water content,
mass and thermal Diffusivities of the gas on the models
developed were investigated. The effects of varying each
of these parameters on performance of the absorber are
presented.
Effects of Natural Gas Residence Time on the
Absorber Performance (Outlet Water
Content of Natural Gas)
The effects of residence time on the water content of the
gas along the column height are shown in Figure 4 below.
0
0.0002
0.0004
0.0006
0.0008
0.001
0.0012
0.0014
0.0016
0.0018
0.002
0 0.0005 0.001 0.0015 0.002 0.0025 0.003 0.0035 0.004 0.0045
wa
ter
co
nte
nt o
f g
as fro
m b
ott
om
of co
lum
n,
yA
(z,t
)
column height, z ( m)
49
50
51
52
53
54
55
56
0 0.0005 0.001 0.0015 0.002 0.0025 0.003 0.0035 0.004 0.0045
Tem
pe
ratu
re o
f st
ream
(O
C)
Column Height (m)
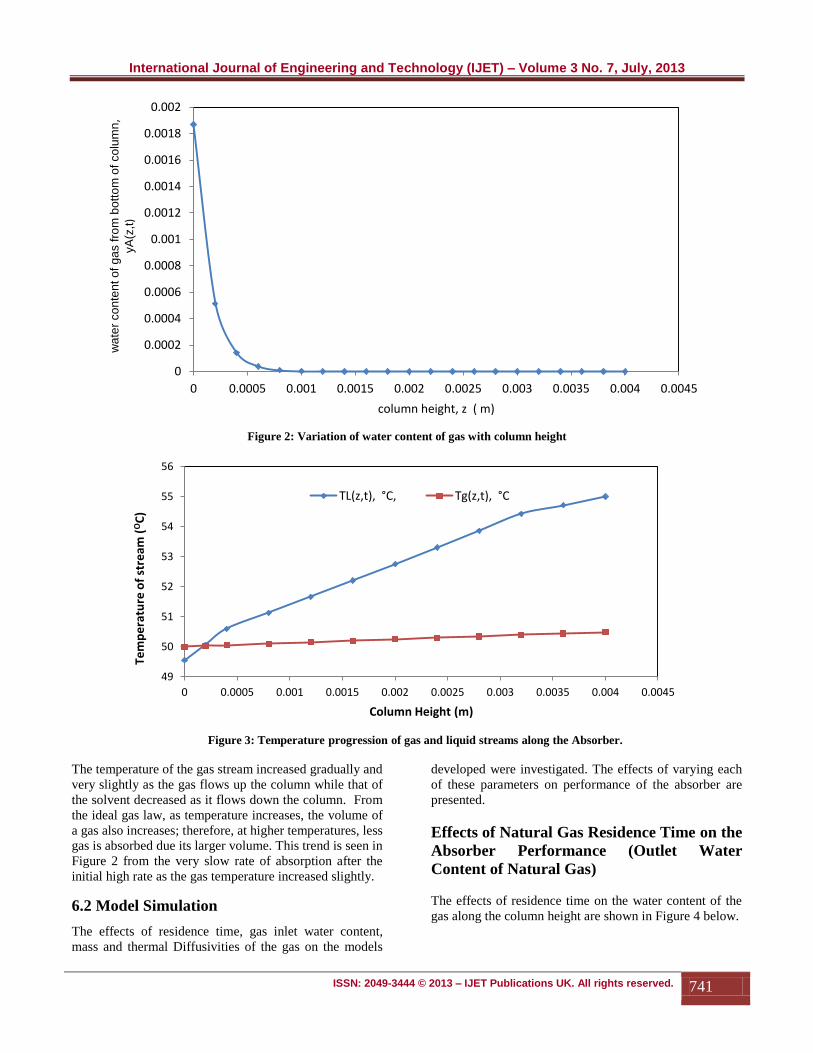
Figure 3: Temperature progression of gas and liquid streams along the Absorber.
TL(z,t), °C, Tg(z,t), °C
International Journal of Engineering and Technology (IJET) – Volume 3 No. 7, July, 2013
ISSN: 2049-3444 © 2013 – IJET Publications UK. All rights reserved. 742
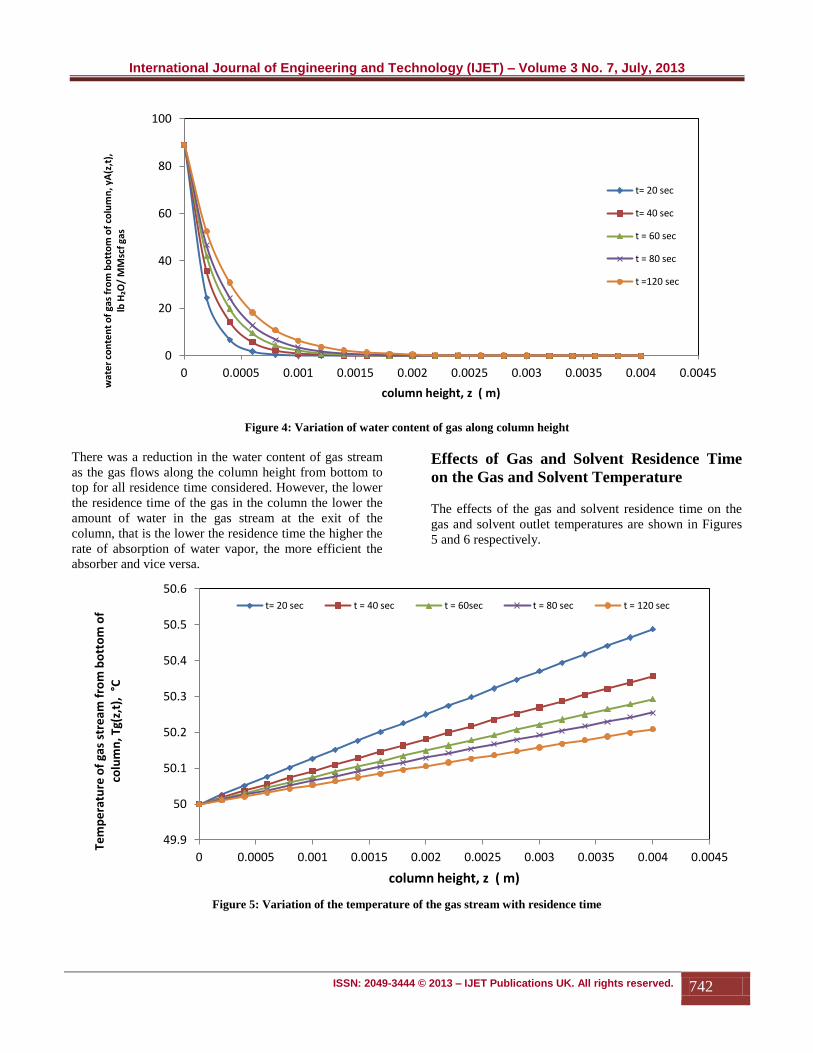
Figure 4: Variation of water content of gas along column height
There was a reduction in the water content of gas stream
as the gas flows along the column height from bottom to
top for all residence time considered. However, the lower
the residence time of the gas in the column the lower the
amount of water in the gas stream at the exit of the
column, that is the lower the residence time the higher the
rate of absorption of water vapor, the more efficient the
absorber and vice versa.
Effects of Gas and Solvent Residence Time
on the Gas and Solvent Temperature
The effects of the gas and solvent residence time on the
gas and solvent outlet temperatures are shown in Figures
5 and 6 respectively.
Figure 5: Variation of the temperature of the gas stream with residence time
0
20
40
60
80
100
0 0.0005 0.001 0.0015 0.002 0.0025 0.003 0.0035 0.004 0.0045
wat
er
con
ten
t o
f ga
s fr
om
bo
tto
m o
f co
lum
n, y
A(z
,t),
lb
H₂O
/ M
Msc
f ga
s
column height, z ( m)
t= 20 sec
t= 40 sec
t = 60 sec
t = 80 sec
t =120 sec
49.9
50
50.1
50.2
50.3
50.4
50.5
50.6
0 0.0005 0.001 0.0015 0.002 0.0025 0.003 0.0035 0.004 0.0045
Tem
pe
ratu
re o
f ga
s st
ream
fro
m b
ott
om
of
colu
mn
, Tg(
z,t)
, °C
column height, z ( m)
t= 20 sec t = 40 sec t = 60sec t = 80 sec t = 120 sec
International Journal of Engineering and Technology (IJET) – Volume 3 No. 7, July, 2013
ISSN: 2049-3444 © 2013 – IJET Publications UK. All rights reserved. 743
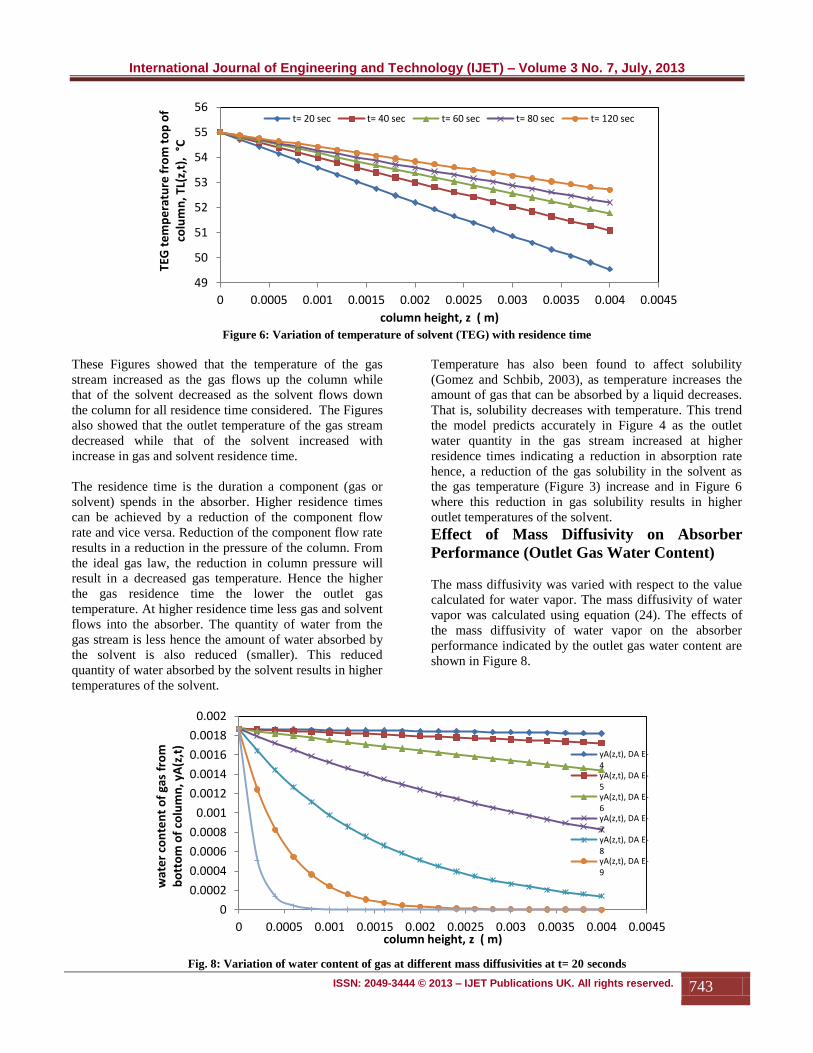
Figure 6: Variation of temperature of solvent (TEG) with residence time
These Figures showed that the temperature of the gas
stream increased as the gas flows up the column while
that of the solvent decreased as the solvent flows down
the column for all residence time considered. The Figures
also showed that the outlet temperature of the gas stream
decreased while that of the solvent increased with
increase in gas and solvent residence time.
The residence time is the duration a component (gas or
solvent) spends in the absorber. Higher residence times
can be achieved by a reduction of the component flow
rate and vice versa. Reduction of the component flow rate
results in a reduction in the pressure of the column. From
the ideal gas law, the reduction in column pressure will
result in a decreased gas temperature. Hence the higher
the gas residence time the lower the outlet gas
temperature. At higher residence time less gas and solvent
flows into the absorber. The quantity of water from the
gas stream is less hence the amount of water absorbed by
the solvent is also reduced (smaller). This reduced
quantity of water absorbed by the solvent results in higher
temperatures of the solvent.
Temperature has also been found to affect solubility
(Gomez and Schbib, 2003), as temperature increases the
amount of gas that can be absorbed by a liquid decreases.
That is, solubility decreases with temperature. This trend
the model predicts accurately in Figure 4 as the outlet
water quantity in the gas stream increased at higher
residence times indicating a reduction in absorption rate
hence, a reduction of the gas solubility in the solvent as
the gas temperature (Figure 3) increase and in Figure 6
where this reduction in gas solubility results in higher
outlet temperatures of the solvent.
Effect of Mass Diffusivity on Absorber
Performance (Outlet Gas Water Content)
The mass diffusivity was varied with respect to the value
calculated for water vapor. The mass diffusivity of water
vapor was calculated using equation (24). The effects of
the mass diffusivity of water vapor on the absorber
performance indicated by the outlet gas water content are
shown in Figure 8.
Fig. 8: Variation of water content of gas at different mass diffusivities at t= 20 seconds
49
50
51
52
53
54
55
56
0 0.0005 0.001 0.0015 0.002 0.0025 0.003 0.0035 0.004 0.0045
TEG
te
mp
era
ture
fro
m t
op
of
colu
mn
, TL(
z,t)
, °C
column height, z ( m)
t= 20 sec t= 40 sec t= 60 sec t= 80 sec t= 120 sec
0
0.0002
0.0004
0.0006
0.0008
0.001
0.0012
0.0014
0.0016
0.0018
0.002
0 0.0005 0.001 0.0015 0.002 0.0025 0.003 0.0035 0.004 0.0045
wat
er
con
ten
t o
f ga
s fr
om
b
ott
om
of
colu
mn
, yA
(z,t
)
column height, z ( m)
yA(z,t), DA E- 4 yA(z,t), DA E- 5 yA(z,t), DA E- 6 yA(z,t), DA E- 7 yA(z,t), DA E- 8 yA(z,t), DA E- 9
International Journal of Engineering and Technology (IJET) – Volume 3 No. 7, July, 2013
ISSN: 2049-3444 © 2013 – IJET Publications UK. All rights reserved. 744
The mass diffusivity of a material determines the rate at
which a given component is transferred across a
concentration gradient. Water vapor is transferred from
the gas stream to the liquid solvent stream. The observed
effect of mass diffusivity on the rate of water vapor
transfer from the gas stream to the solvent liquid stream is
shown in Figure 8.
Figure 8 showed that the rate of absorption of water vapor
(the rate of transfer of water vapor to the triethylene
glycol stream) decreases as the gas flows up the column
for all values of mass diffusivity investigated. Figure 8
also showed that the water content in the gas stream at the
outlet of the absorber reduced as the mass diffusivity was
reduced (lower values of mass diffusivity). That is, the
rate of absorption of water vapor increases as the mass
diffusivity decreases. At lower values of mass diffusivity
the rate of absorption was higher.
The higher the diffusivity (of one substance with respect
to another), the faster they diffuse into each other
(http://en.wikipedia.org/wiki/thermal_diffusivity). That is,
if the mass diffusivity of the water vapor is decreased
keeping that of TEG constant, the higher the diffusivity of
TEG with respect to that of water vapor, then the faster
the water vapor diffuses into the TEG solvent. This trend
the developed model predicted accurately as shown in
Figure 8 where the rate of absorption of water vapor
increases as the mass diffusivity decreases (higher
diffusivity of TEG relative to that of water vapor). Mass
diffusivity increases with increasing temperature and
decreases as pressure increases. The pressure of the
column can be increased by increasing the component
flow rate and vice versa, hence increasing flow rate
decreases the mass diffusivity and vice versa.
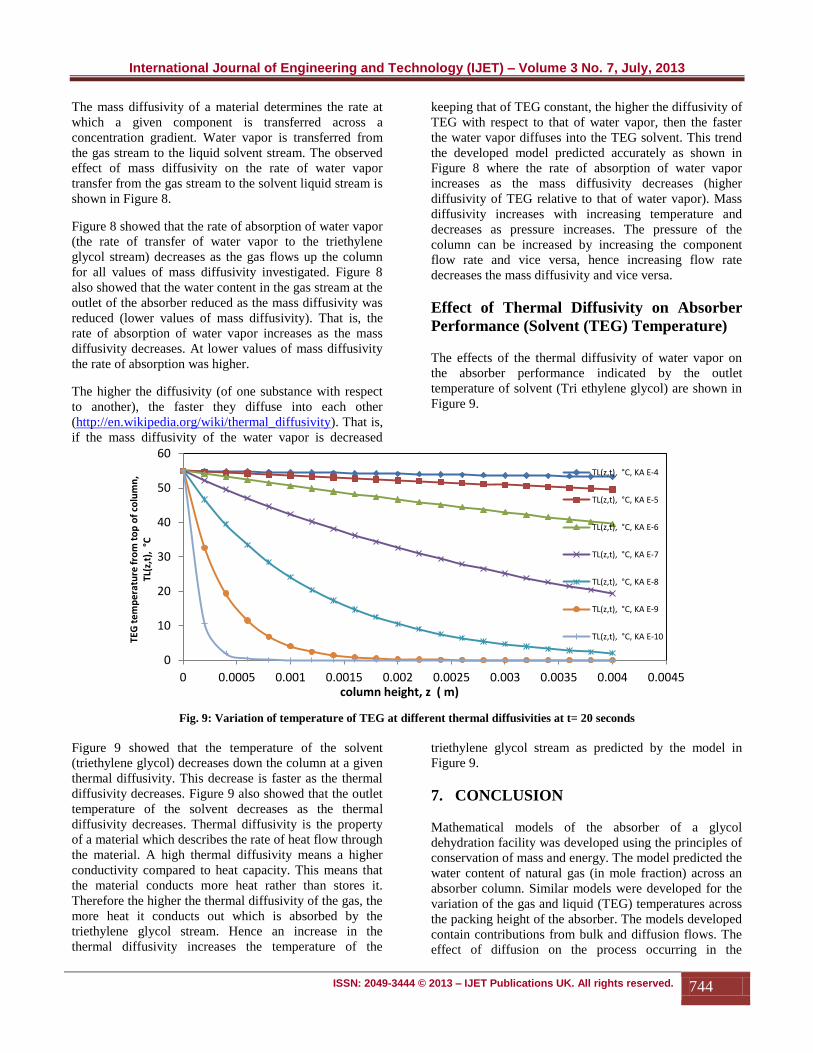
Effect of Thermal Diffusivity on Absorber
Performance (Solvent (TEG) Temperature)
The effects of the thermal diffusivity of water vapor on
the absorber performance indicated by the outlet
temperature of solvent (Tri ethylene glycol) are shown in
Figure 9.
Fig. 9: Variation of temperature of TEG at different thermal diffusivities at t= 20 seconds
Figure 9 showed that the temperature of the solvent
(triethylene glycol) decreases down the column at a given
thermal diffusivity. This decrease is faster as the thermal
diffusivity decreases. Figure 9 also showed that the outlet
temperature of the solvent decreases as the thermal
diffusivity decreases. Thermal diffusivity is the property
of a material which describes the rate of heat flow through
the material. A high thermal diffusivity means a higher
conductivity compared to heat capacity. This means that
the material conducts more heat rather than stores it.
Therefore the higher the thermal diffusivity of the gas, the
more heat it conducts out which is absorbed by the
triethylene glycol stream. Hence an increase in the
thermal diffusivity increases the temperature of the
triethylene glycol stream as predicted by the model in
Figure 9.
7. CONCLUSION
Mathematical models of the absorber of a glycol
dehydration facility was developed using the principles of
conservation of mass and energy. The model predicted the
water content of natural gas (in mole fraction) across an
absorber column. Similar models were developed for the
variation of the gas and liquid (TEG) temperatures across
the packing height of the absorber. The models developed
contain contributions from bulk and diffusion flows. The
effect of diffusion on the process occurring in the
0
10
20
30
40
50
60
0 0.0005 0.001 0.0015 0.002 0.0025 0.003 0.0035 0.004 0.0045
TEG
te
mp
era
ture
fro
m t
op
of
colu
mn
, TL
(z,t
), °
C
column height, z ( m)
TL(z,t), °C, KA E-4
TL(z,t), °C, KA E-5
TL(z,t), °C, KA E-6
TL(z,t), °C, KA E-7
TL(z,t), °C, KA E-8
TL(z,t), °C, KA E-9
TL(z,t), °C, KA E-10
International Journal of Engineering and Technology (IJET) – Volume 3 No. 7, July, 2013
ISSN: 2049-3444 © 2013 – IJET Publications UK. All rights reserved. 745
absorber was studied in this work. The models were
validated using the plant data from an SPDC TEG unit in
Gbaran Ubie, Bayelsa State. The results showed a
reasonable agreement between the model predictions and
industrial plant data. The model predicted the amount of
water in the gas stream at the end of the absorption
process very accurately with a deviation of 0%. The
results also showed that the models accurately predicted
the gas and solvent temperatures with deviations of
1.584% and 2.844% respectively. Results showed that
diffusion alone can be used to model the absorption
process. The effects of certain process variables such as
residence time, gas inlet water content, mass and thermal
Diffusivities of the gas on the performance of the absorber
was studied, thus provides new range of operating
conditions to meet stringent industry and environmental
concerns.
REFERENCES
[1] Ahmed, A., Paitoon T. and Raphael I. (2007),
applications of new absorption kinetics and
vapor/liquid equilibrium models to simulation of a
pilot plant for carbon dioxide absorption into high
co2-loaded, concentrated monoethanolamine
solutions, chemindix, ccu/09, International Test
Centre for Carbon Dioxide Capture (ITC), Faculty of
Engineering, University of Regina, Regina, SK, S4S
0A2, Canada.
[2] Campbell, J. M., Maddox, R. N., Sheerar, L. F. and
Erbar, J., H. (1982), Gas Conditioning and
Processing, Volume 3, Campbell Petroleum Series
Norman Oklahoma. Pp. 10-1, 10-33.
[3] Gas Processors Suppliers Association (GPSA),
(2004): Engineering Data Book, 12th
Edition, p. 20-
23 20-29.
[4] Gómez, C., Borio, D. O. and Schbib, N. S. (2003),
Simulation of an Industrial Packed Column for
Reactive Absorption of co2, Latin American Applied
Research, Vol. 33, Argentina, pp 201-205.
[5] Guo, B. and Ghalambork, A. (2005), Natural Gas
Engineering Handbook, Gulf Publishing Company, p.
123 - 147.
[6] http://en.wikipedia.org/wiki/thermal_diffusivity,
retrieved on 16/01/2013 by 12:35 pm.
[7] Ikoku, C. U. (1992), Natural Gas Production
Engineering, Reprint ed., Kreiger Publishing
Company, Malabar, Florida, USA, pp 20, 133-171.
[8] John, N. (2009), Development of a Model for Wet
Scrubbing of Carbon Dioxide by Chilled Ammonia,
Department of Chemical Engineering, Lund
University, Lund, Sweden.
[9] Kazemi, P. and Hamidi, R. (2011), Sensitivity
Analysis of a Natural Gas Triethylene Glycol
Dehydration Plant In Persian Gulf Region, Petroleum
& Coal 53(1) 71-77.
[10] Kindnay, A. J. and Parish, W. R. (2006),
Fundamentals of natural gas processing, Taylor and
Francis Group.
[11] Kohl, A. L. and Riesenfeld, F. C. (1974), Gas
purification, Gulf Publishing Co.
[12] Manning, F. S. and Thomson, R. E. (1991), Oilfield
processing of petroleum-vol. 1, Natural gas, 1st ed.,
Pennwell Publishing Co.
[13] Minkkinen, A. (1992), Methanol gas-treating scheme
offers economics, versatility, Oil and Gas J., 65, June
issue.
[14] McCabe, W. L., Smith, J. and Harriott, P. (2005),
Unit Operations of Chemical Engineering, 7th ed.,
McGraw Hill International Edition, New York, pp
576-578.
[15] Perry, R. H. and Green, D. W. (1999), Perry’s
Chemical Engineers’ Handbook, 7th
ed., McGraw
Hill companies Inc, New York, sections 1, 2 and 14.
[16] Peyghambarzadeh, S. M. and Jafarpour, M. (2006),
Impact of Thermodynamic Model on the Simulation
of Natural Gas Dehydration Unit, 6th
National-
Student Chemical Engineering Congress, University
of Isfaham, pp 1-10.
[17] Shell Petroleum Development Company (SPDC) of
Nigeria, (2007), Gbaran Ubie Integrated Oil & Gas
Development Project, Gas Dehydration & Glycol
Regeneration Packages Operating Manual.
[18] Shell, W. J. (1982), Spirall-wound permeators for
purification and recovery, CEP, 33, Oct. issue.
[19] Speight, J. G. (2007), Natural Gas: A Basic
Handbook, Gulf Publishing Company, Engineering
(2nd Edition), Elsevier.
[20] Stephenson, G. (1986), Partial Differential Equations
for Scientists and Engineers, 3rd ed., Longman Inc.,
New York, pp 89-134.
Related Documents