.............................................................................................................................................................. ............................................................................................................................................. ................................................................................................................................................................................ Modelling and performance evaluation of a low-temperature ammonia–water absorption refrigeration system Y.T. Ge 1, * , S.A. Tassou 1 and I. Chaer 2 1 Mechanical Engineering, School of Engineering and Design, Brunel University, Uxbridge, Middlesex UB8 3PH, UK 2 Faculty of Engineering, Science and the Built Environment, London South Bank University (T617), Borough Road, London SE1 0AA, UK *Corresponding author: [email protected] Abstract This paper presents the simulation of a low-temperature gas-fired ammonia–water absorption chiller for refrigeration applications. The model was developed as part of a research effort to investigate microturbine-based tri-generation systems for application in the food retail industry. The absorption chiller model was developed in the TRNSYS environment by integrating the main component models in the system and will form part of an overall TRNSYS-based supermarket model. The chiller model was validated against experimental results obtained on a 12 kWabsorption chiller in the laboratory. The model was subsequently used to investigate the influence of important design and operating parameters on the performance of the chiller. Keywords: ammonia–water absorption chiller; modelling and validation; low-temperature refrigeration Received 6 May 2009; revised 11 May 2009; accepted 12 May 2009 1 INTRODUCTION Gas-fired absorption chillers can offer advantages over electri- cally driven machines in applications where the local electrical supply grid has insufficient capacity and where noise is a con- sideration. Other advantages of absorption chillers include the use of environmental-friendly refrigerants and the possibility to use waste heat or the exhaust gases of local combined heat and power systems to drive the generator. Most applications of absorption chillers have been in the air-conditioning field where the flow temperature required is above 68C. These chil- lers invariably use lithium bromide–water as fluid pair with water being the refrigerant and lithium bromide the absorbent. There have also been applications of absorption chillers at temperatures down to 2558C or even lower in the chemical and food manufacturing industries, but these have been of the specially made type using ammonia–water as fluid pair with ammonia being the refrigerant and water the absorbent [1,2]. More recently, small packaged ammonia–water chillers have become available in the market and this has prompted their evaluation for a wide range of applications at temperatures below 08C. An example of this is the Robur unit which provides a refrigeration capacity of 12 kW at 2128C flow temperature. A schematic diagram of this chiller is shown in Figure 1. A similar type of chiller was modelled by Lazzarin et al. [3,4] with the integration of the main component models in the system. Of the component models, the generator was divided into two control volumes while other components had one control volume each. The system model was validated by comparing the cooling capacities from manufacture at con- ditions of different temperatures of air inlet and brine outlet. The model was then utilized to predict the variations of solution concentrations, high and low solution pressures, com- ponent heat fluxes and cooling capacities with the tempera- tures of air inlet and brine outlet. Some constant parameters were assumed for the component models such as the effective- ness for generator, condenser and evaporator, the temperature differences between solution and air for the air-cooled heat exchanger, and the temperature differences between vapour and solution for the rectifier. These constant parameters which are critical to the model accuracy can be determined by further experiments of the chiller at different conditions. Experimental investigations on the similar type of chiller with different chilled solution and various structure of International Journal of Low-Carbon Technologies 2009, 4, 68–77 # The Author 2009. Published by Oxford University Press. All rights reserved. For Permissions, please email: [email protected] doi:10.1093/ijlct/ctp015 Advance Access Publication 4 June 2009 68 by guest on March 8, 2014 http://ijlct.oxfordjournals.org/ Downloaded from

Welcome message from author
This document is posted to help you gain knowledge. Please leave a comment to let me know what you think about it! Share it to your friends and learn new things together.
Transcript

. . . . . . . . . . . . . . . . . . . . . . . . . . . . . . . . . . . . . . . . . . . . . . . . . . . . . . . . . . . . . . . . . . . . . . . . . . . . . . . . . . . . . . . . . . . . . . . . . . . . . . . . . . . . . . . . . . . . . . . . . . . . . . . . . . . . . . . . . . . . . . . . . . . . . . . . . . . . . .
. . . . . . . . . . . . . . . . . . . . . . . . . . . . . . . . . . . . . . . . . . . . . . . . . . . . . . . . . . . . . . . . . . . . . . . . . . . . . . . . . . . . . . . . . . . . . . . . . . . . . . . . . . . . . . . . . . . . . . . . . . . . . . . . . . . . . . . . . . . . .
. . . . . . . . . . . . . . . . . . . . . . . . . . . . . . . . . . . . . . . . . . . . . . . . . . . . . . . . . . . . . . . . . . . . . . . . . . . . . . . . . . . . . . . . . . . . . . . . . . . . . . . . . . . . . . . . . . . . . . . . . . . . . . . . . . . . . . . . . . . . . . . . . . . . . . . . . . . . . . . . . . . . . . . . . . . . . . . .
Modelling and performance evaluationof a low-temperature ammonia–waterabsorption refrigeration system
Y.T. Ge1,*, S.A. Tassou1 and I. Chaer2
1Mechanical Engineering, School of Engineering and Design, Brunel University, Uxbridge,Middlesex UB8 3PH, UK2Faculty of Engineering, Science and the Built Environment, London South BankUniversity (T617), Borough Road, London SE1 0AA, UK
*Corresponding author:
AbstractThis paper presents the simulation of a low-temperature gas-fired ammonia–water absorption chillerfor refrigeration applications. The model was developed as part of a research effort to investigatemicroturbine-based tri-generation systems for application in the food retail industry. The absorptionchiller model was developed in the TRNSYS environment by integrating the main component modelsin the system and will form part of an overall TRNSYS-based supermarket model. The chiller modelwas validated against experimental results obtained on a 12 kW absorption chiller in the laboratory. Themodel was subsequently used to investigate the influence of important design and operating parameterson the performance of the chiller.
Keywords: ammonia–water absorption chiller; modelling and validation; low-temperaturerefrigeration
Received 6 May 2009; revised 11 May 2009; accepted 12 May 2009
1 INTRODUCTION
Gas-fired absorption chillers can offer advantages over electri-cally driven machines in applications where the local electricalsupply grid has insufficient capacity and where noise is a con-sideration. Other advantages of absorption chillers include theuse of environmental-friendly refrigerants and the possibilityto use waste heat or the exhaust gases of local combined heatand power systems to drive the generator. Most applications ofabsorption chillers have been in the air-conditioning fieldwhere the flow temperature required is above 68C. These chil-lers invariably use lithium bromide–water as fluid pair withwater being the refrigerant and lithium bromide the absorbent.There have also been applications of absorption chillers attemperatures down to 2558C or even lower in the chemicaland food manufacturing industries, but these have been of thespecially made type using ammonia–water as fluid pair withammonia being the refrigerant and water the absorbent [1,2].More recently, small packaged ammonia–water chillers havebecome available in the market and this has prompted theirevaluation for a wide range of applications at temperaturesbelow 08C. An example of this is the Robur unit which
provides a refrigeration capacity of 12 kW at 2128C flowtemperature. A schematic diagram of this chiller is shown inFigure 1. A similar type of chiller was modelled by Lazzarinet al. [3,4] with the integration of the main component modelsin the system. Of the component models, the generator wasdivided into two control volumes while other components hadone control volume each. The system model was validated bycomparing the cooling capacities from manufacture at con-ditions of different temperatures of air inlet and brine outlet.The model was then utilized to predict the variations ofsolution concentrations, high and low solution pressures, com-ponent heat fluxes and cooling capacities with the tempera-tures of air inlet and brine outlet. Some constant parameterswere assumed for the component models such as the effective-ness for generator, condenser and evaporator, the temperaturedifferences between solution and air for the air-cooled heatexchanger, and the temperature differences between vapourand solution for the rectifier. These constant parameters whichare critical to the model accuracy can be determined by furtherexperiments of the chiller at different conditions.
Experimental investigations on the similar type of chillerwith different chilled solution and various structure of
International Journal of Low-Carbon Technologies 2009, 4, 68–77# The Author 2009. Published by Oxford University Press. All rights reserved. For Permissions, please email: [email protected]:10.1093/ijlct/ctp015 Advance Access Publication 4 June 2009 68
by guest on March 8, 2014
http://ijlct.oxfordjournals.org/D
ownloaded from

evaporator were carried out by Horuz et al. [5]. Water-cooledabsorber and condenser were introduced in addition to theoriginal air-cooled ones so as to examine the system perform-ance under the conditions of a wider range of high-side press-ures. The experimental investigations were carried out undersix different operating conditions including variable chilledwater inlet temperature and flow rate, changeable chilled waterlevel in the evaporator drum, varied generator heat input, anddifferent cooling water flow rate and inlet temperature to thewater-cooled condenser. It was found that the cooling capacity,component heat transfer rates, and cooling coefficient of per-formance (COP) were all increased with higher chilled waterinlet temperature. In the mean time, the above three perform-ance parameters were all increased with elevated energy inputto generator. In addition, the cooling capacity and COP wereboth augmented with increased condenser cooling water flowrate but the COP was decreased with higher condenser coolingwater temperature. The solution high and low pressures whichwere quite important to the system performance were howevernot presented.
The models of different types of absorption refrigerationsystems were reported in series by Grossman et al. [6-10] andwere finalized into a modular simulation tool—ABSIM foradvanced absorption systems. The codes underneath thesystem models are based on unit subroutines containing thegoverning equations for the system’s components. Each com-ponent is assumed as one control volume and the applied gov-erning equations for the control volume are similar to thoseused by Lazzarin et al. [3,4]. Based on user-supplied cyclediagrams, working fluid and given operating conditions,the model calculates the properties at each state point in the
system cycle and the thermal duty of each component. For thesolution to converge, it requires careful selection of input par-ameters, such as the UA or effectiveness values of the heattransfer components. This makes the model difficult to use byinexperienced users. To obtain a reasonable prediction ofsystem performance by the model, the correlated value of UAor effectiveness for each component from test results is stillneeded.
Apart from the above system models formed by the inte-gration of simplified component models, the detailed com-ponent models are still significant to describe operationallyand assist the optimal designs for the components. Chua et al.[11] developed a detailed absorption generator model in whichthe multi-stream non-isothermal heat and mass transfers wererecognized and considered. Goel et al. [12] developed ananalytical model to simulate the combined heat and masstransfer process in a counter-current ammonia–water-basedabsorber. The model requires detailed description of the geo-metric characteristics of the absorber. It uses empirical corre-lations to predict the heat and mass transfer coefficients andaccounts for both liquid and vapour phase mass transfer resist-ances. Similar investigations on absorbers were carried out byKaynakli et al. [13] and Kwon et al. [14]. All these modelsrequire detailed description of the components’ geometricdata, which inversely limits their applications to different typesof system.
Any simulation model requires a method for calculatingthe thermophysical properties of the fluid pair in thesystem. A simple, practical and fairly accurate method to dothis for the ammonia–water fluid pair was proposed byConde [15].
Figure 1. Schematic diagram of the absorption refrigeration system.
Low-temperature ammonia–water absorption refrigeration system
International Journal of Low-Carbon Technologies 2009, 4, 68–77 69
by guest on March 8, 2014
http://ijlct.oxfordjournals.org/D
ownloaded from

This paper presents a model of a low-temperature air-cooled ammonia–water absorption chiller system. The systemmodel is an integration of the main component sub-models.To avoid the need to have detailed data on the geometriccharacteristics of the components and ensure speed of solution,each component model was based on the lumped parametermethodology. To facilitate the modelling processes, the genera-tor and rectifier are combined into one control volume whilethe absorber is divided into two control volumes. In the meantime, extensive experiments were carried out including thevariation of high and low solution pressures with the tempera-tures of air inlet and brine outlet. The test results are used tovalidate the model and correct the heat transfer parametersneeded in the component models. The following sectionsdescribe the modelling methodology adopted, validationagainst experimental measurements and model applications.This is a first stage in the development of an integrated modelof a microturbine-based tri-generation system for low-temperature food refrigeration applications.
2 MODELLING SCHEME WITH THELUMPED METHOD
A schematic diagram of the refrigeration system considered inthis investigation is shown in Figure 1. Referring to thediagram, the system consists of eight main components: gen-erator, rectifier, air-cooled condenser, sub-cooling heat exchan-ger, liquid-cooling evaporator, absorber (solution-cooled),air-cooled heat exchanger and solution pump. After flowingthrough the generator and rectifier, the nearly pure refrigerantat ‘8’ enters the air-cooled condenser where it is condensed toliquid at ‘9’. The refrigerant then passes through the connec-tion pipes and arrives at ‘10’. From there the refrigerant flowsthrough a tube-in-tube heat exchanger where it exchanges heatwith the refrigerant vapour leaving the evaporator and isfurther subcooled at ‘11’. The refrigerant then flows through athermodynamic expansion valve at ‘12’ before entering theevaporator coil where it evaporates while absorbing heat froma brine solution.
The refrigerant vapour exiting the evaporator at ‘13’ thenflows through the tube-in-tube heat exchanger where it issuperheated to ‘14’ before entering the absorber. The ‘strong’solution from the generator enters the absorber at ‘3’ where itis first cooled by a solution heat exchanger (SHX) beforeabsorbing the refrigerant flowing from the evaporator. Itshould be noted that in this paper ‘strong’ solution refers to asolution that is rich in absorbent, whereas ‘weak’ solutionrefers to a solution that is weak in absorbent and rich inrefrigerant. The ‘weak’ solution formed in the absorber thenflows through the air-cooled heat exchanger where the heatgenerated by the absorption process is rejected to the ambient.The solution then exits the heat exchanger at ‘5’ and ispumped through the rectifier and absorber to the generator at
‘1’. The weak solution is heated and distilled in the generatorand as a result, a strong solution is formed at the bottom ofthe generator and high concentration ammonia refrigerant atthe top. The strong solution then exits the generator at ‘2’ andflows through an expansion device before entering the absorberwhere it is sprayed over the SHX. The refrigerant flows fromthe top of the generator to the rectifier where more water inthe ammonia refrigerant condenses and returns back to thegenerator. The nearly pure refrigerant then exits the rectifier at‘8’ and flows to the condenser for the repetition of the cycle.
The model of each component was developed based on theenergy, mass and species conservation equations. For simpli-city, each component was assumed as a single or two controlvolumes. The models of the more complicated components inthe system are described as below.
2.1 RectifierThe rectifier was assumed to be a single control volume. Theassumptions made in developing the model are:
(1) Pure saturated refrigerant vapour at rectifier exit (point 8in Figure 1).
(2) Saturated vapour solution at top of generator (point 100).(3) Saturated liquid solution from rectifier to generator (point
10).(4) No heat loss in rectifier.
Conservation of mass for ammonia:
ð1þ RÞj100 ¼ j8 þ Rj10 ð1ÞConservation of energy:
ð1þ RÞh100 ¼ h8 þ Rh10 þ qr ð2Þwhere
R ¼ _m10= _m8
2.2 Generator and rectifierThe generator and rectifier are combined into one controlvolume to facilitate the modelling. Assumptions for the gen-erator are:
(1) Saturated liquid for weak solution outlet of generator at‘2’.
(2) No heat loss in generator.
Conservation of mass for ammonia:
f j1 ¼ ð f � 1Þj2 þ j8 ð3ÞConservation of energy:
qg ¼ h8 � h2 þ qr þ f ðh2 � h1Þ ð4Þ
Y.T. Ge et al.
70 International Journal of Low-Carbon Technologies 2009, 4, 68–77
by guest on March 8, 2014
http://ijlct.oxfordjournals.org/D
ownloaded from
where, in Equations (3) and (4)
f ¼ _m1
_m8
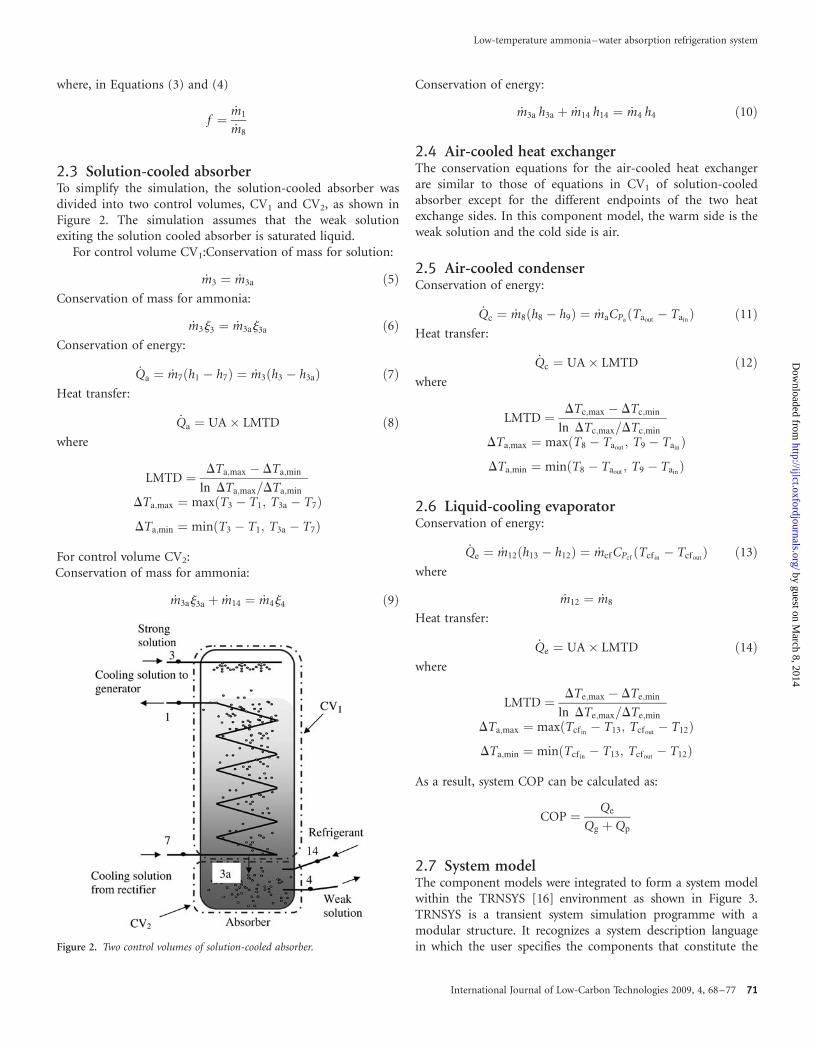
2.3 Solution-cooled absorberTo simplify the simulation, the solution-cooled absorber wasdivided into two control volumes, CV1 and CV2, as shown inFigure 2. The simulation assumes that the weak solutionexiting the solution cooled absorber is saturated liquid.
For control volume CV1:Conservation of mass for solution:
_m3 ¼ _m3a ð5ÞConservation of mass for ammonia:
_m3j3 ¼ _m3aj3a ð6ÞConservation of energy:
_Qa ¼ _m7ðh1 � h7Þ ¼ _m3ðh3 � h3aÞ ð7ÞHeat transfer:
_Qa ¼ UA� LMTD ð8Þwhere
LMTD ¼ DTa;max � DTa;min
ln DTa;max=DTa;min
� �
DTa;max ¼ maxðT3 � T1; T3a � T7Þ
DTa;min ¼ minðT3 � T1; T3a � T7Þ
For control volume CV2:Conservation of mass for ammonia:
_m3aj3a þ _m14 ¼ _m4j4 ð9Þ
Conservation of energy:
_m3a h3a þ _m14 h14 ¼ _m4 h4 ð10Þ
2.4 Air-cooled heat exchangerThe conservation equations for the air-cooled heat exchangerare similar to those of equations in CV1 of solution-cooledabsorber except for the different endpoints of the two heatexchange sides. In this component model, the warm side is theweak solution and the cold side is air.
2.5 Air-cooled condenserConservation of energy:
_Qc ¼ _m8ðh8 � h9Þ ¼ _maCPaðTaout
� TainÞ ð11Þ
Heat transfer:
_Qc ¼ UA� LMTD ð12Þwhere
LMTD ¼ DTc;max � DTc;min
ln DTc;max=DTc;min
� �
DTa;max ¼ maxðT8 � Taout; T9 � Tain
Þ
DTa;min ¼ minðT8 � Taout; T9 � Tain
Þ
2.6 Liquid-cooling evaporatorConservation of energy:
_Qe ¼ _m12ðh13 � h12Þ ¼ _mcfCPcfðTcfin
� TcfoutÞ ð13Þ
where
_m12 ¼ _m8
Heat transfer:
_Qe ¼ UA� LMTD ð14Þwhere
LMTD ¼ DTe;max � DTe;min
ln DTe;max=DTe;min
� �
DTa;max ¼ maxðTcfin� T13; Tcfout
� T12Þ
DTa;min ¼ minðTcfin� T13; Tcfout
� T12Þ
As a result, system COP can be calculated as:
COP ¼ Qe
Qg þ Qp
2.7 System modelThe component models were integrated to form a system modelwithin the TRNSYS [16] environment as shown in Figure 3.TRNSYS is a transient system simulation programme with amodular structure. It recognizes a system description languagein which the user specifies the components that constitute theFigure 2. Two control volumes of solution-cooled absorber.
Low-temperature ammonia–water absorption refrigeration system
International Journal of Low-Carbon Technologies 2009, 4, 68–77 71
by guest on March 8, 2014
http://ijlct.oxfordjournals.org/D
ownloaded from

system and the manner in which they are connected. Theoutputs of each component model can be inputs to anothercomponent according to the actual component layout in thesystem. The accuracy of the system simulation is dependent onthe correctness of the component models and their integration.
Inputs to the system model include mass flow rate andtemperature of chilled fluid at inlet to the evaporator and air atinlet to the condenser, heat input to generator, UA values forthe heat exchange components and degrees of superheatingand subcooling of the refrigerant at evaporator and condenseroutlet, respectively. As a first step, assumptions are made forthe pressures on both the high and low pressure sides of thesystem, and the mass flow rate and mass concentration ofammonia in the weak solution. Based on these initial assump-tions, the equations for each component model on the highpressure side are solved through an iterative process around thedegree of subcooling in the condenser as shown in Figure 4.Through each iteration the pressure in the high pressure sideof the system is adjusted until the actual and desired values ofsubcooling agree to the required degree of accuracy. A similarprocedure is then followed for the evaporator model where thepressure of the low pressure side of the system is adjusted untilthe actual and set value of superheat agree to the desireddegree of accuracy. Once this is achieved, the model simulatesthe processes in the absorber and determines the concentrationand enthalpy of the weak solution at the absorber outlet. If theenthalpy does not correspond to the saturation enthalpy at theabsorber pressure, the concentration of the weak solution isadjusted until the weak solution at the absorber outlet is satu-rated liquid. Once this is achieved, the solution is further sub-cooled by the air-cooled heat exchanger. The pump modeldetermines the input power, enthalpy and temperature of theweak solution entering the generator. If the concentration,temperature and mass flow rate of the weak solution enteringthe generator at point 1 are not close to the assumed or calcu-lated values from the last iteration, then the model iterates onthese values until convergence is achieved.
3 MODEL VALIDATION
The gas-fired ammonia–water absorption chiller, shown sche-matically in Figure 1, was used to obtain test results to validate
the model. The chiller has a nominal refrigeration capacity of12 kW at conditions of ambient air temperature of 358C andchilled water flow temperature of 258C.
The unit was installed and commissioned in the laboratoryto facilitate the experimental investigations. The test facility isshown schematically in Figure 5. It consists of the air-cooledabsorption chiller and an air-cooling loading circuit which is acooling coil to heat up the low-temperature secondary refriger-ant from the chiller and provide the refrigeration load to thechiller. The refrigeration load can be adjusted by modulatingthe fans’ frequency to facilitate testing at a fluid temperature atthe evaporator outlet down to 2128C. The fluid in the closedcircuit was a mixture of 40% mass propylene glycol/water. Thetest facility was instrumented with pressure transducers ofmodel OMGA PX771A-100DI with +3 Pa accuracy tomeasure the pressures in the low and high pressure sides of thesystem; thermocouples with +0.28C accuracy to measuretemperatures at various points in the refrigeration cycle, beforeand after each major component; thermocouples also with+0.2 C accuracy to measure the temperature of the secondaryfluid at inlet and outlet of the evaporator coil; a flow meter ofmodel KROHNE IFC 010D with an accuracy 0.2% to measurethe flow rate of the secondary fluid through the evaporatorcoil.
The experiments were carried out over a range of ambienttemperatures between 16+ 0.58C and 17+ 0.58C and chilledwater flow temperatures between 228C and 2128C at a con-stant secondary fluid flow rate of 0.67 kg/s. Figure 6 shows thetemperature test results for the ammonia–water solution at theinlets and outlets of generator and absorber. In the figure, T1,T2, T4 and T7 are referred to the solution temperatures at thegenerator inlet, generator outlet, absorber outlet and absorbercooler inlet, respectively.
Parameters used for model validation and component UAvalue adjustment are pressures in the low and high pressuresides of the system, cooling capacity and cooling COP. Figure 7shows a comparison between the experimental and simulationresults for the pressure in the high pressure (generator) side ofthe system for a range of ambient and chilled secondary fluidoutlet temperatures. It can be seen that the pressure in the gen-erator side of the system increases with increasing chilled fluidoutlet temperature. Higher ambient temperatures also lead toslightly higher pressures on the high pressure side of the system.Simulation accuracy for the high pressure side is quite good.
Similar characteristics were obtained for the pressure in thelow pressure side of the system. As can be seen from Figure 8,higher chilled fluid outlet temperatures lead to higher press-ures. It can also be seen that ambient temperature has lesseffect on the low pressure side of the system. At low secondaryfluid flow temperatures, below 258C, the simulation accuracyis very good. At higher fluid flow temperatures, experimentaland simulation results begin to diverge. This may be owing tothe fixed UA values used in the simulation.
Figures 9 and 10 show the comparisons between the coolingcapacity and cooling COP, respectively, determined from tests
Figure 3. Model of absorption chiller within the TRNSYS environment.
Y.T. Ge et al.
72 International Journal of Low-Carbon Technologies 2009, 4, 68–77
by guest on March 8, 2014
http://ijlct.oxfordjournals.org/D
ownloaded from

and simulation over a range of chilled fluid outlet temperaturesand ambient temperatures. The scatters that can be observed inthe experimental results are mainly because of the variation inambient temperature during the tests and the slow response ofthe system to variations in both the ambient temperature andchilled fluid temperature. Despite the scatters, however, thereare clear trends that show both cooling capacity and colingCOP of the system to increase with increasing chilled fluidoutlet tempertaure at specific ambient temperature. This ismainly because of the higher evaporating temperature, whichleads to a higher refrigerant density and hence higher refriger-ant flow rate in the system.
4 MODEL APPLICATION
The validated model can be used to explore the performanceof the absorption unit at various operating conditions. In the
experiments, the ambient temperature which is quite impor-tant to the system performance varied between 15.58C and17.58C. To investigate the performance of the system over awider range of ambient temperatures likely to be encounteredin practice, simulations were carried out with ambient temp-eratures between 108C and 308C and chilled fluid flow temp-eratures between 2308C and 58C.
Figure 11 shows the variation of ammonia concentration inthe weak and strong solution with chilled fluid flow tempera-ture and ambient temperature. It can be seen that both thestrong and weak solution concentrations increase with chilledfluid temperature.
As the chilled fluid tmperature increases, the presures inboth the low and high pressure sides of the system increase asshown in Figure 12. In addition, it shows that an increase inthe ambient temperature leads to an increase in the pressure inthe condenser and the generator but has little effect on thepressure in the evaporator and absorber.
Figure 4. Flowchart of system simulation.
Low-temperature ammonia–water absorption refrigeration system
International Journal of Low-Carbon Technologies 2009, 4, 68–77 73
by guest on March 8, 2014
http://ijlct.oxfordjournals.org/D
ownloaded from
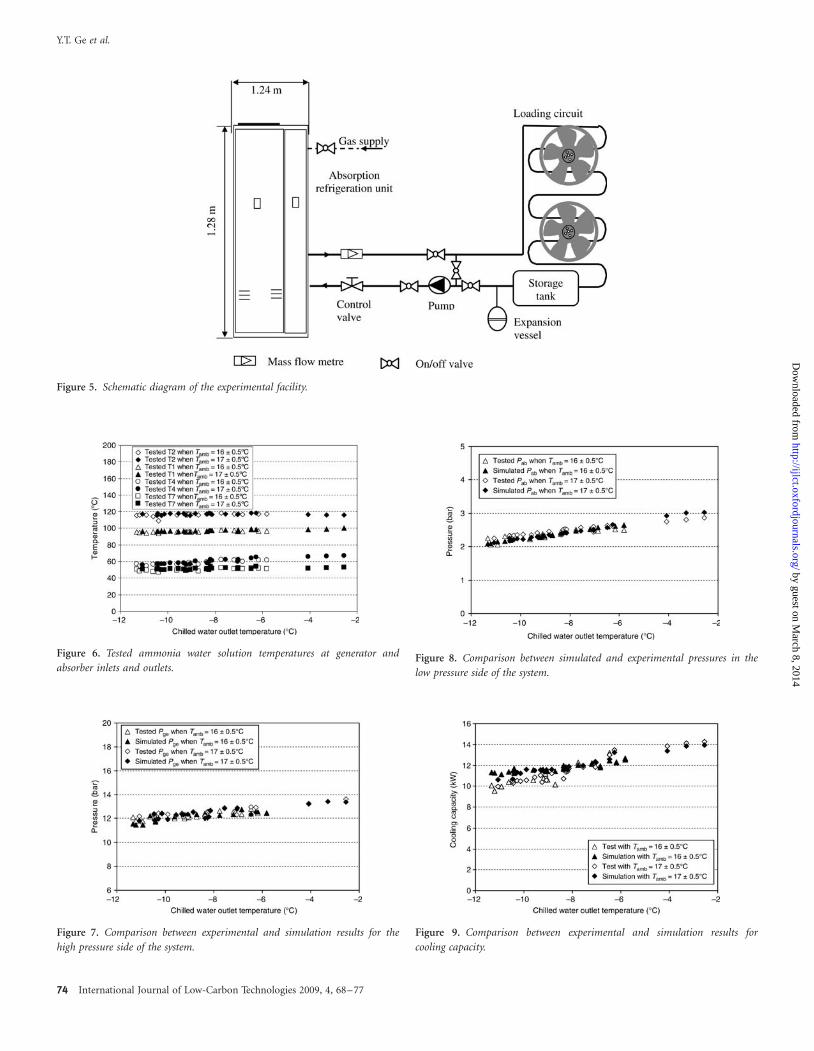
Figure 5. Schematic diagram of the experimental facility.
Figure 6. Tested ammonia water solution temperatures at generator and
absorber inlets and outlets.
Figure 7. Comparison between experimental and simulation results for the
high pressure side of the system.
Figure 9. Comparison between experimental and simulation results for
cooling capacity.
Figure 8. Comparison between simulated and experimental pressures in the
low pressure side of the system.
Y.T. Ge et al.
74 International Journal of Low-Carbon Technologies 2009, 4, 68–77
by guest on March 8, 2014
http://ijlct.oxfordjournals.org/D
ownloaded from
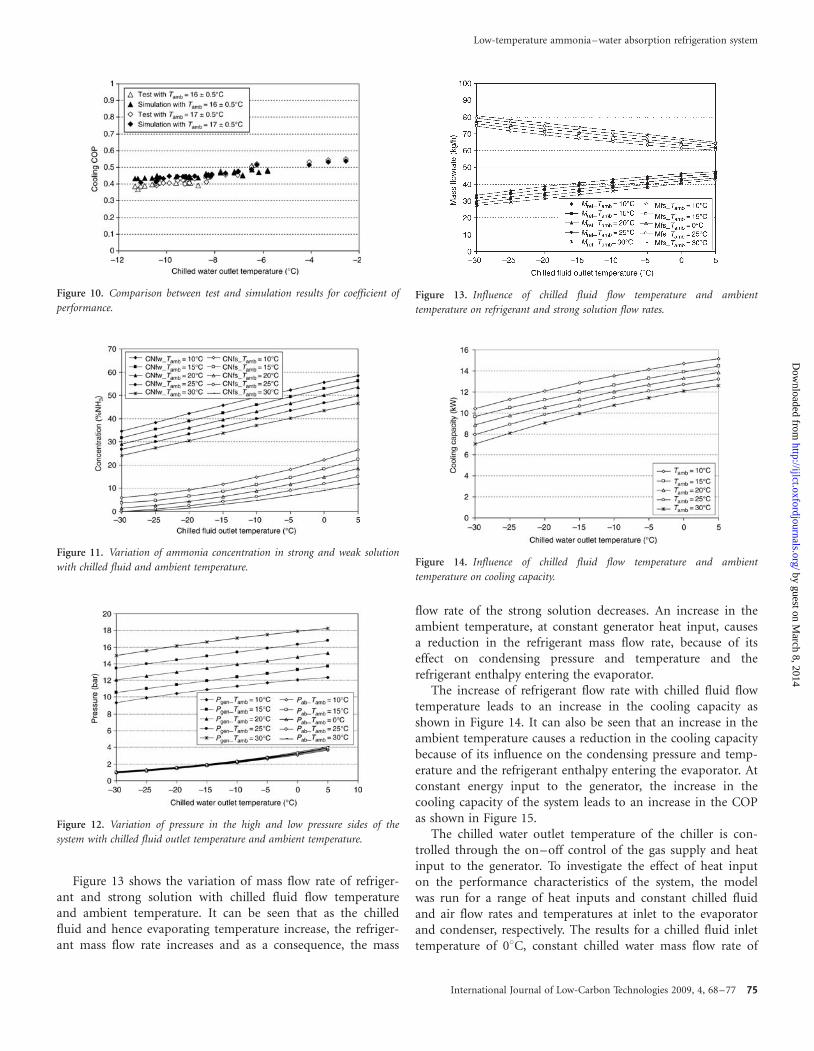
Figure 13 shows the variation of mass flow rate of refriger-ant and strong solution with chilled fluid flow temperatureand ambient temperature. It can be seen that as the chilledfluid and hence evaporating temperature increase, the refriger-ant mass flow rate increases and as a consequence, the mass
flow rate of the strong solution decreases. An increase in theambient temperature, at constant generator heat input, causesa reduction in the refrigerant mass flow rate, because of itseffect on condensing pressure and temperature and therefrigerant enthalpy entering the evaporator.
The increase of refrigerant flow rate with chilled fluid flowtemperature leads to an increase in the cooling capacity asshown in Figure 14. It can also be seen that an increase in theambient temperature causes a reduction in the cooling capacitybecause of its influence on the condensing pressure and temp-erature and the refrigerant enthalpy entering the evaporator. Atconstant energy input to the generator, the increase in thecooling capacity of the system leads to an increase in the COPas shown in Figure 15.
The chilled water outlet temperature of the chiller is con-trolled through the on–off control of the gas supply and heatinput to the generator. To investigate the effect of heat inputon the performance characteristics of the system, the modelwas run for a range of heat inputs and constant chilled fluidand air flow rates and temperatures at inlet to the evaporatorand condenser, respectively. The results for a chilled fluid inlettemperature of 08C, constant chilled water mass flow rate of
Figure 11. Variation of ammonia concentration in strong and weak solution
with chilled fluid and ambient temperature.
Figure 10. Comparison between test and simulation results for coefficient of
performance.
Figure 12. Variation of pressure in the high and low pressure sides of the
system with chilled fluid outlet temperature and ambient temperature.
Figure 13. Influence of chilled fluid flow temperature and ambient
temperature on refrigerant and strong solution flow rates.
Figure 14. Influence of chilled fluid flow temperature and ambient
temperature on cooling capacity.
Low-temperature ammonia–water absorption refrigeration system
International Journal of Low-Carbon Technologies 2009, 4, 68–77 75
by guest on March 8, 2014
http://ijlct.oxfordjournals.org/D
ownloaded from
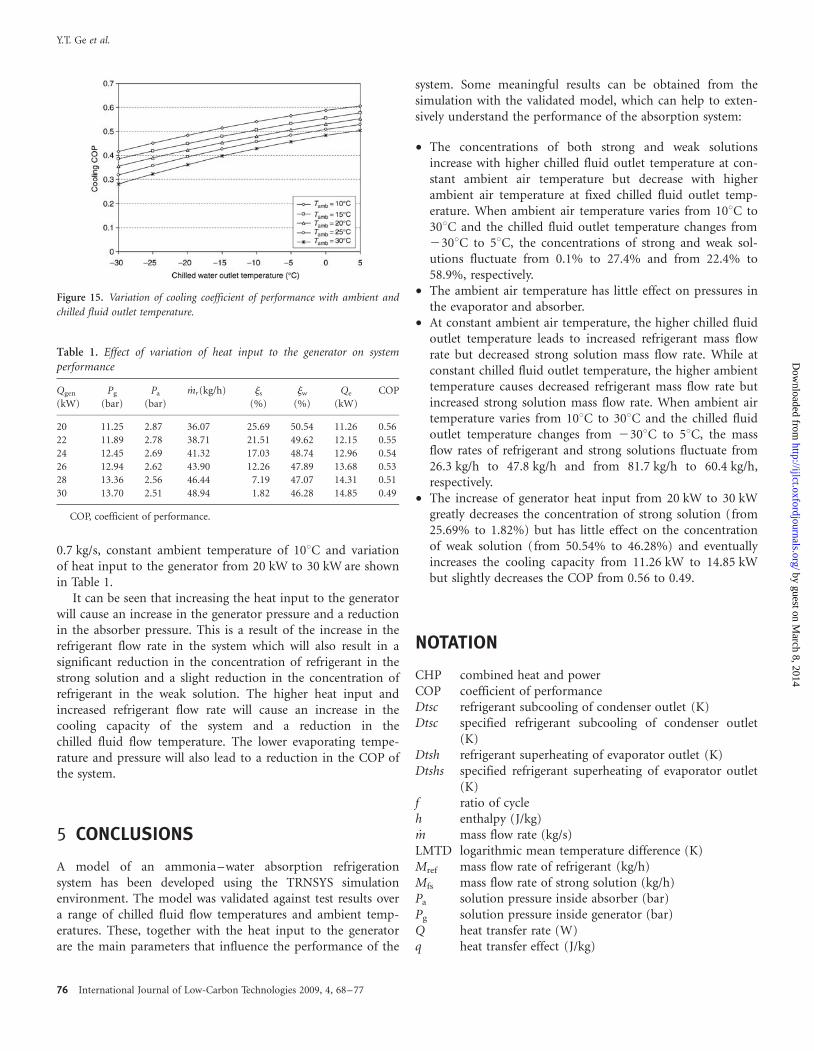
0.7 kg/s, constant ambient temperature of 108C and variationof heat input to the generator from 20 kW to 30 kW are shownin Table 1.
It can be seen that increasing the heat input to the generatorwill cause an increase in the generator pressure and a reductionin the absorber pressure. This is a result of the increase in therefrigerant flow rate in the system which will also result in asignificant reduction in the concentration of refrigerant in thestrong solution and a slight reduction in the concentration ofrefrigerant in the weak solution. The higher heat input andincreased refrigerant flow rate will cause an increase in thecooling capacity of the system and a reduction in thechilled fluid flow temperature. The lower evaporating tempe-rature and pressure will also lead to a reduction in the COP ofthe system.
5 CONCLUSIONS
A model of an ammonia–water absorption refrigerationsystem has been developed using the TRNSYS simulationenvironment. The model was validated against test results overa range of chilled fluid flow temperatures and ambient temp-eratures. These, together with the heat input to the generatorare the main parameters that influence the performance of the
system. Some meaningful results can be obtained from thesimulation with the validated model, which can help to exten-sively understand the performance of the absorption system:
† The concentrations of both strong and weak solutionsincrease with higher chilled fluid outlet temperature at con-stant ambient air temperature but decrease with higherambient air temperature at fixed chilled fluid outlet temp-erature. When ambient air temperature varies from 108C to308C and the chilled fluid outlet temperature changes from2308C to 58C, the concentrations of strong and weak sol-utions fluctuate from 0.1% to 27.4% and from 22.4% to58.9%, respectively.
† The ambient air temperature has little effect on pressures inthe evaporator and absorber.
† At constant ambient air temperature, the higher chilled fluidoutlet temperature leads to increased refrigerant mass flowrate but decreased strong solution mass flow rate. While atconstant chilled fluid outlet temperature, the higher ambienttemperature causes decreased refrigerant mass flow rate butincreased strong solution mass flow rate. When ambient airtemperature varies from 108C to 308C and the chilled fluidoutlet temperature changes from 2308C to 58C, the massflow rates of refrigerant and strong solutions fluctuate from26.3 kg/h to 47.8 kg/h and from 81.7 kg/h to 60.4 kg/h,respectively.
† The increase of generator heat input from 20 kW to 30 kWgreatly decreases the concentration of strong solution (from25.69% to 1.82%) but has little effect on the concentrationof weak solution (from 50.54% to 46.28%) and eventuallyincreases the cooling capacity from 11.26 kW to 14.85 kWbut slightly decreases the COP from 0.56 to 0.49.
NOTATION
CHP combined heat and powerCOP coefficient of performanceDtsc refrigerant subcooling of condenser outlet (K)Dtsc specified refrigerant subcooling of condenser outlet
(K)Dtsh refrigerant superheating of evaporator outlet (K)Dtshs specified refrigerant superheating of evaporator outlet
(K)f ratio of cycleh enthalpy (J/kg)_m mass flow rate (kg/s)
LMTD logarithmic mean temperature difference (K)Mref mass flow rate of refrigerant (kg/h)Mfs mass flow rate of strong solution (kg/h)Pa solution pressure inside absorber (bar)Pg solution pressure inside generator (bar)Q heat transfer rate (W)q heat transfer effect (J/kg)
Figure 15. Variation of cooling coefficient of performance with ambient and
chilled fluid outlet temperature.
Table 1. Effect of variation of heat input to the generator on systemperformance
Qgen
(kW)
Pg
(bar)
Pa
(bar)
_mr(kg/h) js
(%)
jw
(%)
Qe
(kW)
COP
20 11.25 2.87 36.07 25.69 50.54 11.26 0.56
22 11.89 2.78 38.71 21.51 49.62 12.15 0.55
24 12.45 2.69 41.32 17.03 48.74 12.96 0.54
26 12.94 2.62 43.90 12.26 47.89 13.68 0.53
28 13.36 2.56 46.44 7.19 47.07 14.31 0.51
30 13.70 2.51 48.94 1.82 46.28 14.85 0.49
COP, coefficient of performance.
Y.T. Ge et al.
76 International Journal of Low-Carbon Technologies 2009, 4, 68–77
by guest on March 8, 2014
http://ijlct.oxfordjournals.org/D
ownloaded from
R ratio of return flowT, t temperature (8C, K)Tamb ambient air temperature (8C)DT temperature difference (K)UA overall conductance (W/K)j concentration (% by mass)
SUBSCRIPTS
4l saturated liquid at point ‘4’ in Figure 1a absorber, aircf chilled fluide evaporatorg generatorin inletout outletr rectifiers strong solution (rich in absorbent)p pumpw weak solution (weak in absorbent)
ACKNOWLEDGEMENTS
The authors wish to acknowledge the Food Technology Unit ofDEFRA for their financial support for this project and the con-tribution of the industrial collaborators, Bond Retail ServicesLtd, Apex Air Conditioning, Doug Marriott Associates andBowman Power.
REFERENCES
[1] Faramarzi PT, Walker DH. Investigation of secondary loop supermarket
refrigeration systems. Consultant Report 500-04-013, March 2004.
[2] Herold KE, Radermacher R, Klein S. Absorption Chillers and Heat Pumps.
CRC Press, 1996.
[3] Lazzarin RM, Gasparella A, Longo GA. Ammonia-water absorption
machines for refrigeration: theoretical and real performances.
Int. J. Refrigeration 1996;19:239–46.
[4] Lazzarin RM, Gasparella A, Romagnoni P. Experimental report on the
reliability of ammonia-water absorption chillers. Int. J. Refrigeration
1996;19:247–56.
[5] Horuz I, Callander TMS. Experimental investigation of a vapor absorption
refrigeration system. Int. J. Refrigeration 2004;27:10–16.
[6] Grossman G, Perez-Blanco H. Conceptual design and performance analy-
sis of absorption heat pumps for waste heat utilization. Int. J. Refrigeration
1982;5:361–70.
[7] Grossman G, Gommed K, Gadoth D. A computer model for simulation of
absorption systems in flexible and modular form of absorption systems in
flexible and modular form (ORNL/Sub/90 ¼ -89673). Oak Ridge National
Laboratory, Oak Ridge, TN, 1991.
[8] Grossman G. Modular and flexible simulation of advanced absorption
systems. In: Proceedings of the International Absorption Heat Pump
Conference, Vol. 31, AES, New Orleans, LA, 1994, 345–52.
[9] Grossman G, Wilk M. Advanced modular simulation of absorption
systems. Int. J. Refrigeration 1994;17:231–44.
[10] Grossman G, Zaltash A. ABSIM-modular simulation of advanced absorp-
tion systems. Int. J. Refrigeration 2001;24:531–43.
[11] Chua HT, Toh HK, Malek A, Ng KC, Srinivasan K. A general thermodyn-
amic framework for understanding the behaviour of absorption chillers.
Int. J. Refrigeration 2000;23:491–507.
[12] Goel N, Goswami DY. Analysis of a counter-current vapour flow absorber.
Int. J. Heat Mass Transfer 2005;48:1283–92.
[13] Kaynakli O, Horuz I. Comparison of parallel and counter flow coil absor-
ber performance. Int. J. Heat Mass Transfer 2006;33:211–23.
[14] Kwon K, Jeong S. Effect of vapor flow on the falling-film heat and mass
transfer of the ammonia/water absorber. Int. J. Refrigeration 2004;27:
955–64.
[15] Conde M. Thermophysical properties of fNH3 þ H2Og solution for the
industrial design of absorption refrigeration equipment. M.Conde
Engineering, 2006.
[16] TRNSYS. A Transient System Simulation program. TRNSYS 16, 2005.
Low-temperature ammonia–water absorption refrigeration system
International Journal of Low-Carbon Technologies 2009, 4, 68–77 77
by guest on March 8, 2014
http://ijlct.oxfordjournals.org/D
ownloaded from
Related Documents