Modelling and analysis of international recycling between developed and developing countries Pieter J.H. van Beukering a,∗ , Jeroen C.J.M. van den Bergh a,b a Institute for Environmental Studies, Free University, De Boelelaan 1087, 1081 HV Amsterdam, The Netherlands b Department of Spatial Economics, Faculty of Economics and Business Administration, Free University, Amsterdam, The Netherlands Received 20 January 2005; accepted 8 June 2005 Available online 2 August 2005 Abstract To deal with the complexity of recycling, a wide variety of models have been developed, each serving a specific purpose. Despite the current trend increasing international trade in recycling-related material flows, the international dimension of physical and economic relationships in recycling is often ignored in current models and analyses. This paper develops a formal model of an international material- product chain (MPC) that represents the mechanism behind international recycling. The attention is focused on the case of a developed and a developing country that exchange material commodities, final products and recyclable waste. Among others, the model demonstrates that taking into account environmental externalities results in higher levels of recycling. Moreover, we show that international recycling is mainly driven by regional differences in the quantity and quality of factor endowments and economic efficiency of recycling. Given that industrialised countries are relatively well endowed with recyclable waste, the recovery rate usually exceeds the utilisation rate. In developing countries, an opposite pattern is observed. © 2005 Elsevier B.V. All rights reserved. JEL classification: F1; O1; Q3; Q53; Q56 Keywords: Foreign trade; Secondary materials; Waste policy ∗ Corresponding author. Tel.: +31 2 4449555; fax: +31 2 4449553. E-mail addresses: [email protected] (P.J.H. van Beukering), [email protected] (J.C.J.M. van den Bergh). 0921-3449/$ – see front matter © 2005 Elsevier B.V. All rights reserved. doi:10.1016/j.resconrec.2005.06.002

Welcome message from author
This document is posted to help you gain knowledge. Please leave a comment to let me know what you think about it! Share it to your friends and learn new things together.
Transcript
Modelling and analysis of international recyclingbetween developed and developing countries
Pieter J.H. van Beukeringa,∗, Jeroen C.J.M. van den Bergha,b
a Institute for Environmental Studies, Free University, De Boelelaan 1087,1081 HV Amsterdam, The Netherlands
b Department of Spatial Economics, Faculty of Economics and Business Administration,Free University, Amsterdam, The Netherlands
Received 20 January 2005; accepted 8 June 2005Available online 2 August 2005
Abstract
To deal with the complexity of recycling, a wide variety of models have been developed, each servinga specific purpose. Despite the current trend increasing international trade in recycling-related materialflows, the international dimension of physical and economic relationships in recycling is often ignoredin current models and analyses. This paper develops a formal model of an international material-product chain (MPC) that represents the mechanism behind international recycling. The attention isfocused on the case of a developed and a developing country that exchange material commodities,final products and recyclable waste. Among others, the model demonstrates that taking into accountenvironmental externalities results in higher levels of recycling. Moreover, we show that internationalrecycling is mainly driven by regional differences in the quantity and quality of factor endowmentsand economic efficiency of recycling. Given that industrialised countries are relatively well endowedwith recyclable waste, the recovery rate usually exceeds the utilisation rate. In developing countries,an opposite pattern is observed.© 2005 Elsevier B.V. All rights reserved.
JEL classification: F1; O1; Q3; Q53; Q56
Keywords: Foreign trade; Secondary materials; Waste policy
∗ Corresponding author. Tel.: +31 2 4449555; fax: +31 2 4449553.E-mail addresses: [email protected] (P.J.H. van Beukering), [email protected]
(J.C.J.M. van den Bergh).
0921-3449/$ – see front matter © 2005 Elsevier B.V. All rights reserved.doi:10.1016/j.resconrec.2005.06.002
1. Introduction
To deal with the complexity of recycling, a wide variety of empirical models have beendeveloped, each serving a specific purpose. All these models define analytical boundaries,i.e. no one model captures the complete system of economic and recycling processes. Usu-ally, the international dimension of physical and economic relationships behind recyclingis ignored. This is not in line with the current trend of increasing international trade insecondary materials that end up being recycled. For example, while in 1970 only 15% ofthe recovered copper scrap was traded internationally, this share grew to 48% in 1997. Sim-ilar increases in the trade intensity can be observed for waste paper and aluminium (VanBeukering, 2001).
The globalisation of the recycling market increases the need for analysis of the inter-national material-product chain (MPC) that captures the various stages in the internationallife cycle of a material or physical product. The aim of this article is to develop a formal,two-country model that represents the basic economic mechanisms behind internationalrecycling. Subsequently, the model will be analysed, where a comparison will be drawnbetween a world with recycling in autarkic economies and one with recycling in the contextof an international system of trade relationships. Although the model is fairly general, thecase of interaction between a developed and a developing country will be emphasised, asthis currently seems to be the dominant pattern in international recycling (van Beukering,2001).
The organisation of the article is as follows. In Section2, the variety in approachesadopted by existing applied models that deal with (elements of) recycling is examined.Section3 presents a conceptual model of international recycling, and provides a detaileddiscussion of the various elements it contains. In Section4, this is translated into a setof formal models of recycling in autarkic and trading economies, which are subsequentlyanalysed and compared. A final section concludes.
2. Characteristics of current recycling models
A review of 31 empirical quantitative studies has been conducted to gain insight intothe variety of elements that are potentially relevant in analysing international recycling(seeTable A.1in Appendix A). The overview illustrates the diversity of studies but shouldnot be considered as an exhaustive survey of empirical-quantitative, economic models ofrecycling.1 Given the number of studies surveyed, however, it does provide a good indicationof the variety of approaches found in the literature. This is reflected in four characteristics,relating to model objective, system boundary, spatial-geographical dimension and temporalfeatures.
1 Theoretical economic analyses of recycling include the following.Kandelaars and van den Bergh (1997a)adopt a partial static equilibrium framework.Dinan (1993)andFullerton and Kinnaman (1995)study recyclingwith theoretical general equilibrium models. Dynamic models of recycling are studied inLusky (1975), van denBergh and Nijkamp (1994)andKandelaars and van den Bergh (1997b). For the place of recycling models inthe broader literature on economic models with material flows, seevan den Bergh and Janssen (2004, notablychapter 2).
2.1. Objectives and model types
Three types of recycling models can be identified. (1)Physical models such as SubstanceFlow Analysis (SFA) and Life Cycle Analysis (LCA) describe the material flows or measurethe impact of materials and products on the environment. They ignore economic, substitutionand dynamic aspects of material flows (Kandelaars and van Dam, 1998). Because recyclinghas been traditionally treated as a technical problem, physical models seem to dominate: 14out of 31 studies can be classified as such. (2)Economic models, such as partial and generalequilibrium models, analyse the relationship between the use of materials and economicvariables but mostly ignore the environmental impact and substitution between materials.Ten out of 31 studies are classified as economic models. (3)Integrated models, such as thematerial-product chain (MPC), are defined as a set of linked flows of materials and productsand cover the complete life cycle of a material, often addressing mass balance explicitly.Only 7 out of 31 studies can be classified as integrated models.
Recycling models can also be classified as descriptive and scenario versus optimisa-tion models. Descriptive and scenario models often include dynamic, causal relationships.Optimisation models apply an optimisation objective and usually focus on static relationsbetween variables. These models often allow substitution between production factors, suchas capital, labour, energy and materials (Anderson, 1987). Seventeen out of the 31 studiesare driven by optimisation.
2.2. System boundaries
Recycling is embedded in a chain of economic and physical–technical processes and thushas potentially up- and down-stream effects. To address these, the vertical and horizontalsystem boundaries have to be determined with care. Thevertical boundary follows fromthe choice of where in the life cycle to cut off the analysis. Thehorizontal boundary is theresult of choosing between a focus on a single material or product and taking into accountsubstitution effects between different materials (Kandelaars and van Dam, 1998).
Usually, a distinction is made between open- and closed-loop recycling (Boguski etal., 1994). Closed-loop recycling is a process in which the material of a physical productis recycled into the same produce, a process that may-in theory-be repeated endlessly.Open-loop recycling is a process in which the (virgin) material of a product is recycled in aproduct that after use is discarded. Open-loop recycling provides a more realistic represen-tation of most types of current recycling (Finnveden, 1999). For certain materials, however,closed-loop recycling is a suitable form. For example, in the case of lead, lead-acid batteriesare both the main source and destination of the recycling process (Socolow and Thomas,1998).
2.3. Spatial-geographical setting
With the exception of logistic studies, most analyses of recycling tend to underestimateimportance of the spatial dimension. Geographical factors, however, often play a crucial roleboth within and outside the focal area. Within the region, for example, the population densityof the focal area determines to a large extent the success of recycling programmes. Moreover,
a region may strongly depend on imports or exports of materials or material resources. Ofthe 31 surveyed studies, 11 assume closed regions, 13 include elements outside the regionin an exogenous manner and 7 studies allow elements outside the region to influence theprocesses in the focal area.
International trade of secondary materials is growing rapidly. For example, while in1970 only 15% of the recovered copper scrap was traded internationally, this share grewto 48% in 1997. Similar increases in the trade intensity can be observed for waste paperand aluminium (van Beukering, 2001). To analyse international recycling, it is important toseparate recycling into waste recovery and utilisation phases. After all, secondary materialsthat are recovered and exported by a country can no longer be utilised by that country. In thesurvey, only 16 out of 31 studies clearly distinguish between the recovery and the utilisationof recyclable waste.
The spatial dimension is not only important from the perspective of economic trade ofsecondary materials. Environmental problems may also cross borders, i.e. environmentalexternalities may be of an international nature.Eder and Narodoslawsky (1999)proposea typology of a region’s responsibility for environmental pressures, distinguishing respon-sibility for impacts inside and outside the boundaries of the region.Hoekstra and Janssen(2002)propose a similar approach in the context of trading countries.
2.4. Temporal features
Recycling studies can be static or dynamic in nature. Dynamic models allow to addresschanges in technology and demand, accumulation of capital and pollution and time lagsin investment and R&D or in pollution impacts on welfare. Only 9 of 31 surveyed studieshave explicitly addressed the temporal dimensions of recycling.
The specific economic relevance of incorporating dynamic processes in models of recy-cling systems varies with the application. For example, time lags in recycling processes takedistinct forms for different materials (Grace et al., 1978). Most packaging materials havea lifetime of less than a year, while construction materials last more than 15 years. Timelags may also be due to recovery and utilisation. Recovery costs and commodity prices playan important role here. In addition, the physical features of materials count. For example,organic waste cannot be stored for a long period of time, and therefore has to be compostedwithout much delay. Car tyres, on the other hand, are often stored in monofills for longperiods of time before being recycled. Finally, environmental effects of (lack of) recyclingactivities may also occur with a delay.
In analysing recycling, the waste generation rate per capita income is likely to alter overtime, with evident consequences for waste planning. Consumer preferences may changeover time, thus affecting solid waste generation per capita or recycling itself. For example,Pei and Tilton (1999)study the factors affecting the income elasticity of metal demand.Especially in developing countries demand is sensitive to changes in income.
Product life extension is another factor that causes changes in the MPC. Positive eco-nomic and environmental effects may result from it, due to lower levels of production anddisposed waste. Negative impacts are also possible, due to use of more materials per unitof product or due to a phenomenon known as the ‘vintage effect’, i.e. a lack of replacementof old, inefficient equipment (Conn, 1977; Navaretti et al., 1998).
3. A conceptual model of the international material-product chain
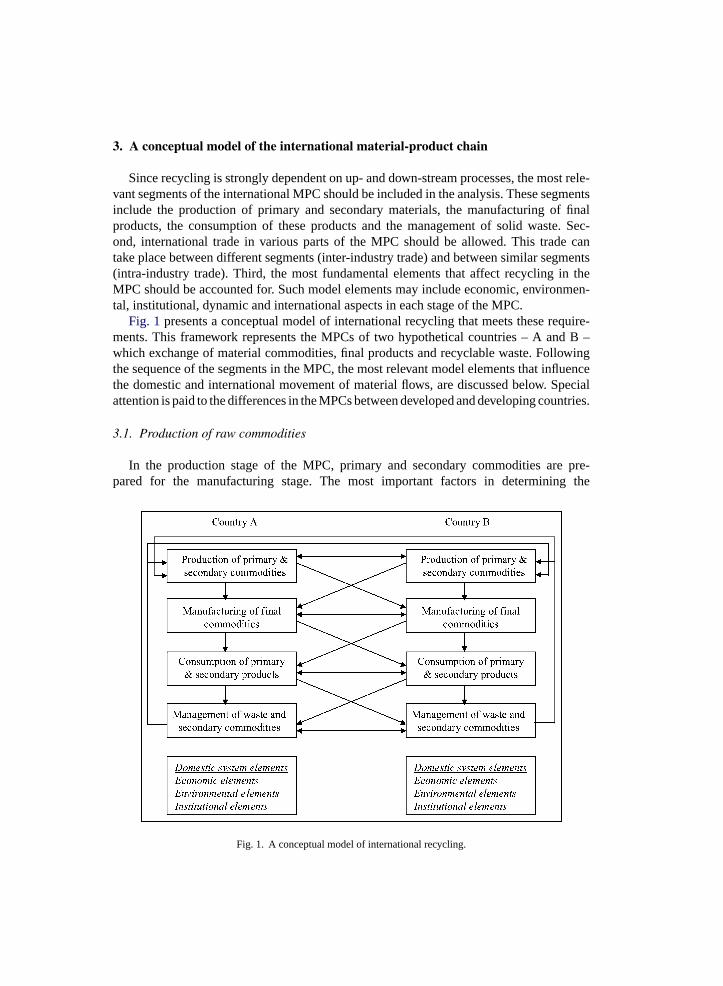
Since recycling is strongly dependent on up- and down-stream processes, the most rele-vant segments of the international MPC should be included in the analysis. These segmentsinclude the production of primary and secondary materials, the manufacturing of finalproducts, the consumption of these products and the management of solid waste. Sec-ond, international trade in various parts of the MPC should be allowed. This trade cantake place between different segments (inter-industry trade) and between similar segments(intra-industry trade). Third, the most fundamental elements that affect recycling in theMPC should be accounted for. Such model elements may include economic, environmen-tal, institutional, dynamic and international aspects in each stage of the MPC.
Fig. 1 presents a conceptual model of international recycling that meets these require-ments. This framework represents the MPCs of two hypothetical countries – A and B –which exchange of material commodities, final products and recyclable waste. Followingthe sequence of the segments in the MPC, the most relevant model elements that influencethe domestic and international movement of material flows, are discussed below. Specialattention is paid to the differences in the MPCs between developed and developing countries.
3.1. Production of raw commodities
In the production stage of the MPC, primary and secondary commodities are pre-pared for the manufacturing stage. The most important factors in determining the
Fig. 1. A conceptual model of international recycling.
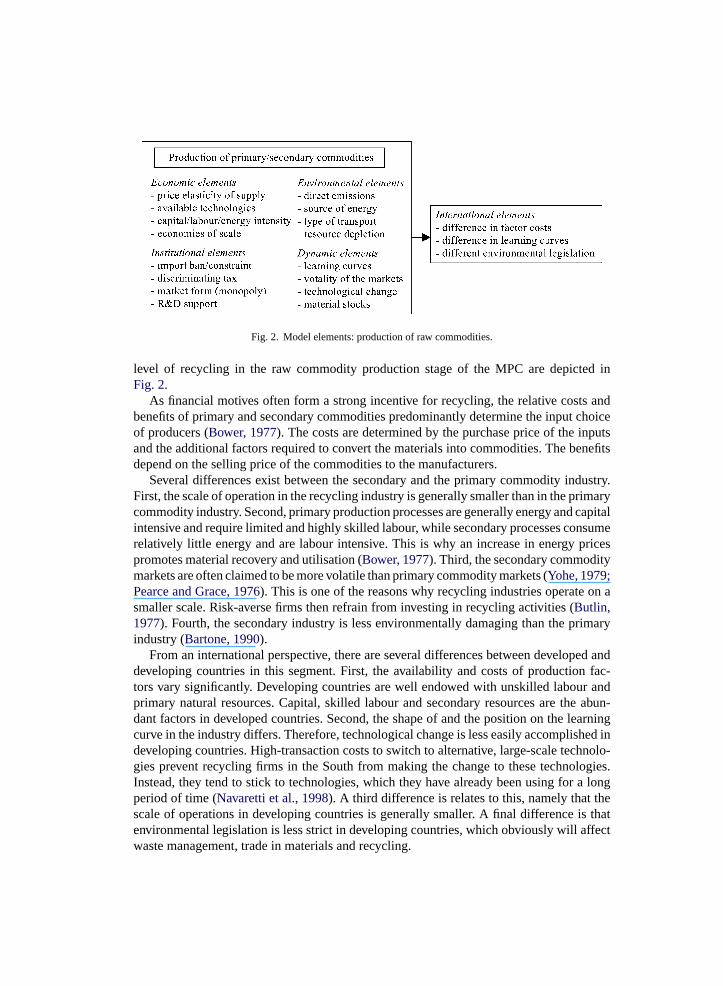
Fig. 2. Model elements: production of raw commodities.
level of recycling in the raw commodity production stage of the MPC are depicted inFig. 2.
As financial motives often form a strong incentive for recycling, the relative costs andbenefits of primary and secondary commodities predominantly determine the input choiceof producers (Bower, 1977). The costs are determined by the purchase price of the inputsand the additional factors required to convert the materials into commodities. The benefitsdepend on the selling price of the commodities to the manufacturers.
Several differences exist between the secondary and the primary commodity industry.First, the scale of operation in the recycling industry is generally smaller than in the primarycommodity industry. Second, primary production processes are generally energy and capitalintensive and require limited and highly skilled labour, while secondary processes consumerelatively little energy and are labour intensive. This is why an increase in energy pricespromotes material recovery and utilisation (Bower, 1977). Third, the secondary commoditymarkets are often claimed to be more volatile than primary commodity markets (Yohe, 1979;Pearce and Grace, 1976). This is one of the reasons why recycling industries operate on asmaller scale. Risk-averse firms then refrain from investing in recycling activities (Butlin,1977). Fourth, the secondary industry is less environmentally damaging than the primaryindustry (Bartone, 1990).
From an international perspective, there are several differences between developed anddeveloping countries in this segment. First, the availability and costs of production fac-tors vary significantly. Developing countries are well endowed with unskilled labour andprimary natural resources. Capital, skilled labour and secondary resources are the abun-dant factors in developed countries. Second, the shape of and the position on the learningcurve in the industry differs. Therefore, technological change is less easily accomplished indeveloping countries. High-transaction costs to switch to alternative, large-scale technolo-gies prevent recycling firms in the South from making the change to these technologies.Instead, they tend to stick to technologies, which they have already been using for a longperiod of time (Navaretti et al., 1998). A third difference is relates to this, namely that thescale of operations in developing countries is generally smaller. A final difference is thatenvironmental legislation is less strict in developing countries, which obviously will affectwaste management, trade in materials and recycling.
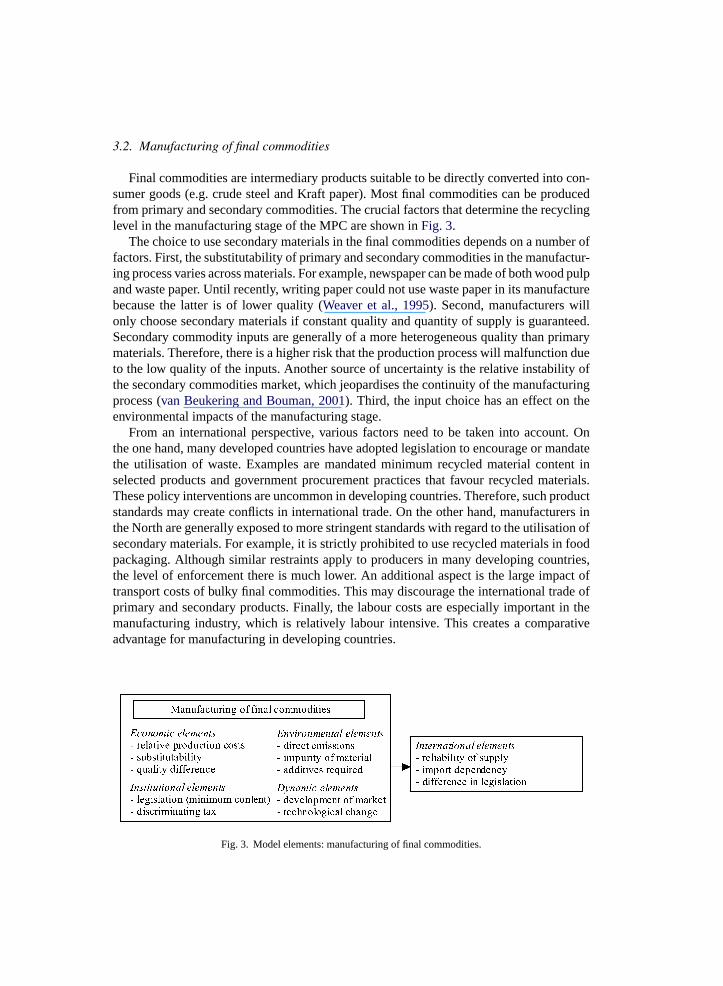
3.2. Manufacturing of final commodities
Final commodities are intermediary products suitable to be directly converted into con-sumer goods (e.g. crude steel and Kraft paper). Most final commodities can be producedfrom primary and secondary commodities. The crucial factors that determine the recyclinglevel in the manufacturing stage of the MPC are shown inFig. 3.
The choice to use secondary materials in the final commodities depends on a number offactors. First, the substitutability of primary and secondary commodities in the manufactur-ing process varies across materials. For example, newspaper can be made of both wood pulpand waste paper. Until recently, writing paper could not use waste paper in its manufacturebecause the latter is of lower quality (Weaver et al., 1995). Second, manufacturers willonly choose secondary materials if constant quality and quantity of supply is guaranteed.Secondary commodity inputs are generally of a more heterogeneous quality than primarymaterials. Therefore, there is a higher risk that the production process will malfunction dueto the low quality of the inputs. Another source of uncertainty is the relative instability ofthe secondary commodities market, which jeopardises the continuity of the manufacturingprocess (van Beukering and Bouman, 2001). Third, the input choice has an effect on theenvironmental impacts of the manufacturing stage.
From an international perspective, various factors need to be taken into account. Onthe one hand, many developed countries have adopted legislation to encourage or mandatethe utilisation of waste. Examples are mandated minimum recycled material content inselected products and government procurement practices that favour recycled materials.These policy interventions are uncommon in developing countries. Therefore, such productstandards may create conflicts in international trade. On the other hand, manufacturers inthe North are generally exposed to more stringent standards with regard to the utilisation ofsecondary materials. For example, it is strictly prohibited to use recycled materials in foodpackaging. Although similar restraints apply to producers in many developing countries,the level of enforcement there is much lower. An additional aspect is the large impact oftransport costs of bulky final commodities. This may discourage the international trade ofprimary and secondary products. Finally, the labour costs are especially important in themanufacturing industry, which is relatively labour intensive. This creates a comparativeadvantage for manufacturing in developing countries.
Fig. 3. Model elements: manufacturing of final commodities.
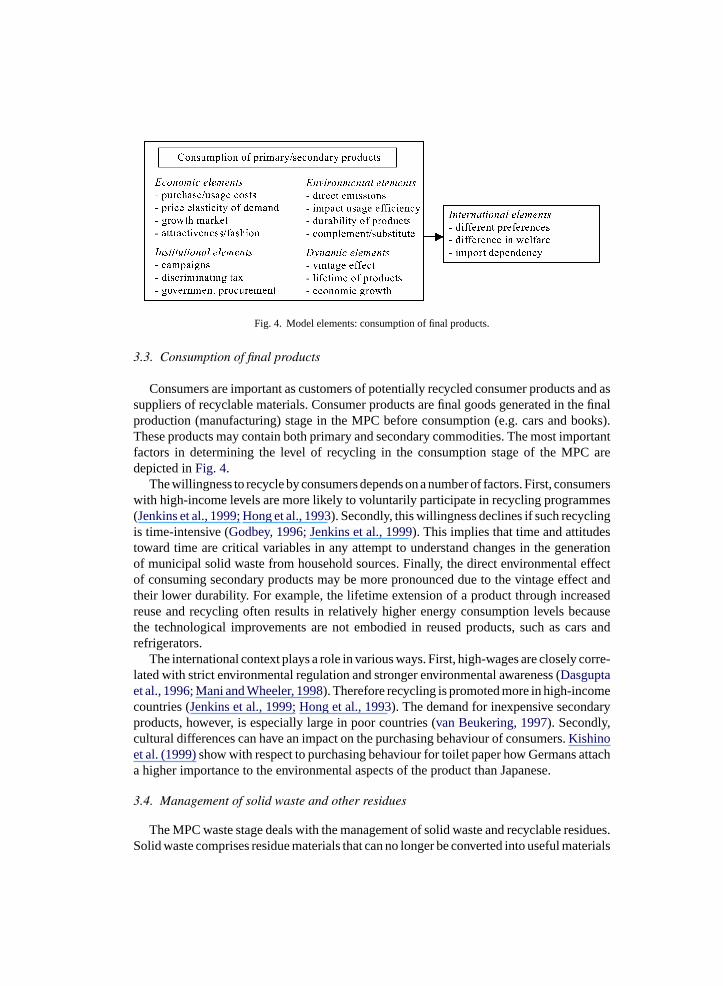
Fig. 4. Model elements: consumption of final products.
3.3. Consumption of final products
Consumers are important as customers of potentially recycled consumer products and assuppliers of recyclable materials. Consumer products are final goods generated in the finalproduction (manufacturing) stage in the MPC before consumption (e.g. cars and books).These products may contain both primary and secondary commodities. The most importantfactors in determining the level of recycling in the consumption stage of the MPC aredepicted inFig. 4.
The willingness to recycle by consumers depends on a number of factors. First, consumerswith high-income levels are more likely to voluntarily participate in recycling programmes(Jenkins et al., 1999; Hong et al., 1993). Secondly, this willingness declines if such recyclingis time-intensive (Godbey, 1996; Jenkins et al., 1999). This implies that time and attitudestoward time are critical variables in any attempt to understand changes in the generationof municipal solid waste from household sources. Finally, the direct environmental effectof consuming secondary products may be more pronounced due to the vintage effect andtheir lower durability. For example, the lifetime extension of a product through increasedreuse and recycling often results in relatively higher energy consumption levels becausethe technological improvements are not embodied in reused products, such as cars andrefrigerators.
The international context plays a role in various ways. First, high-wages are closely corre-lated with strict environmental regulation and stronger environmental awareness (Dasguptaet al., 1996; Mani and Wheeler, 1998). Therefore recycling is promoted more in high-incomecountries (Jenkins et al., 1999; Hong et al., 1993). The demand for inexpensive secondaryproducts, however, is especially large in poor countries (van Beukering, 1997). Secondly,cultural differences can have an impact on the purchasing behaviour of consumers.Kishinoet al. (1999)show with respect to purchasing behaviour for toilet paper how Germans attacha higher importance to the environmental aspects of the product than Japanese.
3.4. Management of solid waste and other residues
The MPC waste stage deals with the management of solid waste and recyclable residues.Solid waste comprises residue materials that can no longer be converted into useful materials
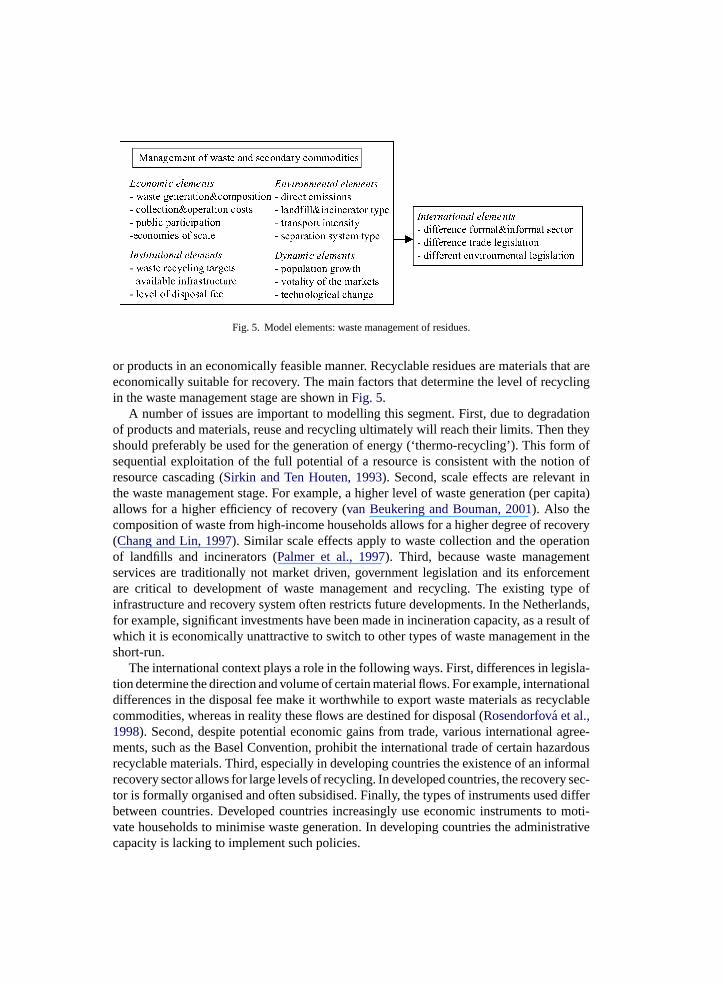
Fig. 5. Model elements: waste management of residues.
or products in an economically feasible manner. Recyclable residues are materials that areeconomically suitable for recovery. The main factors that determine the level of recyclingin the waste management stage are shown inFig. 5.
A number of issues are important to modelling this segment. First, due to degradationof products and materials, reuse and recycling ultimately will reach their limits. Then theyshould preferably be used for the generation of energy (‘thermo-recycling’). This form ofsequential exploitation of the full potential of a resource is consistent with the notion ofresource cascading (Sirkin and Ten Houten, 1993). Second, scale effects are relevant inthe waste management stage. For example, a higher level of waste generation (per capita)allows for a higher efficiency of recovery (van Beukering and Bouman, 2001). Also thecomposition of waste from high-income households allows for a higher degree of recovery(Chang and Lin, 1997). Similar scale effects apply to waste collection and the operationof landfills and incinerators (Palmer et al., 1997). Third, because waste managementservices are traditionally not market driven, government legislation and its enforcementare critical to development of waste management and recycling. The existing type ofinfrastructure and recovery system often restricts future developments. In the Netherlands,for example, significant investments have been made in incineration capacity, as a result ofwhich it is economically unattractive to switch to other types of waste management in theshort-run.
The international context plays a role in the following ways. First, differences in legisla-tion determine the direction and volume of certain material flows. For example, internationaldifferences in the disposal fee make it worthwhile to export waste materials as recyclablecommodities, whereas in reality these flows are destined for disposal (Rosendorfova et al.,1998). Second, despite potential economic gains from trade, various international agree-ments, such as the Basel Convention, prohibit the international trade of certain hazardousrecyclable materials. Third, especially in developing countries the existence of an informalrecovery sector allows for large levels of recycling. In developed countries, the recovery sec-tor is formally organised and often subsidised. Finally, the types of instruments used differbetween countries. Developed countries increasingly use economic instruments to moti-vate households to minimise waste generation. In developing countries the administrativecapacity is lacking to implement such policies.
4. A formal model of international recycling
To demonstrate the essential features and implications of the international dimensionin recycling, a simple analytical model is developed. The model is of a static nature as iscommon in the literature on international trade theory. This implies that stocks are constant.As a result, the model is less suitable to address issues surrounding precious materials likesilver and gold. The assumption is, however, not overly restrictive when describing recyclingmarkets for certain bulky secondary materials, such as waste paper. Here, accumulation ofstocks, if relevant at all, always is a short-run phenomenon and thus never has a structuralcharacter.
The model is developed in two steps. First, in Section4.1, a two-region–one-material–one-product model with recycling is presented, where no trade between the regionsis allowed. The resulting model represents a sort of ‘autarkic’ MPC. Next, Section4.2extends this to a model that allows for trade in primary commodities, recyclable waste andfinal products. This model represents an ‘international’ MPC with recycling.
The two regions represent high-income developed (industrialised) countries (ic) and low-income (developing) countries (dc). This distinction is applied as both regions reveal verydifferent trade and recycling features. The distinction between the two regions in the modelis based on differences in factor endowment of labour and primary and secondary resources.Developed countries are well endowed with secondary (recyclable waste) resources, capitaland highly skilled labour. Developing countries are well endowed with primary resourcesand unskilled labour, while lacking capital. The developed countries therefore have a com-parative advantage in the production of secondary commodities and the manufacturing ofproducts from primary commodities. The developing countries have a comparative advan-tage in producing primary commodities and manufacturing final products from secondarycommodities.
The optimal configuration of trade in secondary materials results from the minimisationof social costs at the system’s level. The private costs are determined by the use of a numberof production factors consisting of labour (Li), capital (Ki) and extracted material (Ei). Thecosts for these production factors arepi
L, piK andpi
E. Besides the private costs of theseproduction factors, external costs are caused by the non-recycled waste flows (W). The costsof these external effects are denoted aspi
W . The defined prices differ between the regions.The optimisation process is conducted under two conditions. The first is that the privatecosts are minimised. Private costs consist of the accumulated costs for labour, capital andmaterials. The second condition is that the social costs are minimised. The social costs arethe sum of the private and the external costs. External costs are the costs related to usingthe production factor ‘environment’.
Fig. 6illustrates a situation in which the internalisation of external costs shifts the recy-cling equilibrium in a country. Thex-axis (0D) presents the fixed demand, which can besatisfied by primary and secondary materials. Reading from left to right, the lefty-axisdepicts net benefits of the consumption of secondary materials. Reading from right to theleft, the righty-axis represents the net benefits of the consumption of primary materials.Two negatively sloped net benefit functions have been drawn. Increased consumption ofprimary materials results, for example, from increased scarcity, which requires more extrac-tion effort and thus higher costs. Increased consumption of secondary materials leads to
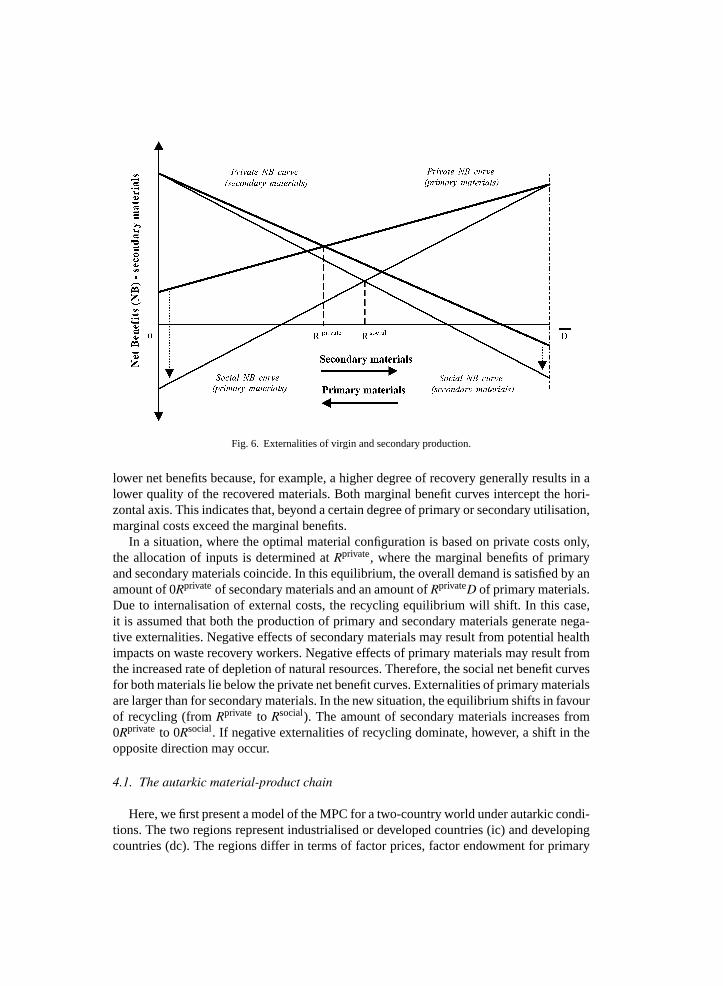
Fig. 6. Externalities of virgin and secondary production.
lower net benefits because, for example, a higher degree of recovery generally results in alower quality of the recovered materials. Both marginal benefit curves intercept the hori-zontal axis. This indicates that, beyond a certain degree of primary or secondary utilisation,marginal costs exceed the marginal benefits.
In a situation, where the optimal material configuration is based on private costs only,the allocation of inputs is determined atRprivate, where the marginal benefits of primaryand secondary materials coincide. In this equilibrium, the overall demand is satisfied by anamount of 0Rprivateof secondary materials and an amount ofRprivateD of primary materials.Due to internalisation of external costs, the recycling equilibrium will shift. In this case,it is assumed that both the production of primary and secondary materials generate nega-tive externalities. Negative effects of secondary materials may result from potential healthimpacts on waste recovery workers. Negative effects of primary materials may result fromthe increased rate of depletion of natural resources. Therefore, the social net benefit curvesfor both materials lie below the private net benefit curves. Externalities of primary materialsare larger than for secondary materials. In the new situation, the equilibrium shifts in favourof recycling (fromRprivate to Rsocial). The amount of secondary materials increases from0Rprivate to 0Rsocial. If negative externalities of recycling dominate, however, a shift in theopposite direction may occur.
4.1. The autarkic material-product chain
Here, we first present a model of the MPC for a two-country world under autarkic condi-tions. The two regions represent industrialised or developed countries (ic) and developingcountries (dc). The regions differ in terms of factor prices, factor endowment for primary
resources, per capita demand and economic efficiency in various stages of the MPC. Nointeraction occurs between the regions. The model describes interaction of physical andmonetary dimensions, both covering the full life cycle of the material. The production fac-tor dimension is exogenous, i.e. not made dependent on the economy: it only serves as asource of factor and resource inputs in the MPC. Changes in the production factors dimen-sion influence the physical dimension through the monetary dimension. (Note that regionsare denoted as superscripts and segments (stages in the MPC) are denoted by subscripts).
The static nature of the model implies exogenous process techniques. At the beginningof the MPC, a primary resource is extracted and processed into a primary commodity inthe primary production segment (P). The secondary resource that is retrieved from thedischarged waste flow is processed into a secondary commodity in the secondary segment(S). Both commodities are transformed into final products in the manufacturing segment(Q). This manufacturing process satisfies the exogenous demand (D). After consumption,the final products are either discarded to the waste management segment (W), or separatedand supplied to the waste recovery segment (R). In the latter stage, the recyclable wasteis cleaned and supplied to the secondary commodity segment. The production ofP, S andthe manufacturing ofQ generate non-recycled waste as a by-product. These are denoted byWP, WS andWQ, respectively.
The production factor dimension is exogenous. The stocks and prices of the factors:extracted resources (E), capital (K) and labour (L), are given. In other words, the MPC is apartial equilibrium model: the clearing of factor markets is not part of the optimisation pro-cess. Labour costs (pi
L), capital costs (piK) and resource costs (pi
E) are applied to transfer thephysical requirement for labour, capital and resources into monetary units. Labour, capitaland waste are applicable for all segments in the MPC. Resources are only accounted for inthe primary materials sector, which converts extracted resources (E) into primary materials(P). The external costs are driven by the amount of the non-recycled waste (W). This flowis accounted for by a price per physical unit of waste (pi
W ), which represents the environ-mental damage that is caused by the non-recycled waste. Examples of such environmentaldamage include, for example, groundwater pollution resulting from effluent leakage fromlandfills or health damage caused by air pollutants emitted by waste incinerators. Extractedresources, materials and waste flows are expressed in tonnes, capital in pieces of equipmentand labour in number of workers.
Themonetary dimension of the model covers accounting for the costs of the productionfactors and the non-recycled waste. A global planner determines the optimal configurationof the autarkic MPC with the aim of minimising the total costs (TC) of satisfying demandin both regions (i). The control variables of the global planner are the price of waste (pi
W ),and the primary resources (pi
E). The objective function is formulated as:
min TC =∑
i ∈ {ic,dc}
∑j ∈ {Q,P,S,R,D}
piLLi
j + piKKi
j + piEEi
j + piWWi
j (1)
Here,ui denotes the utilisation rate andri the the recovery rate (these will be formallydefined later on). The definition of the total costs (TC) varies, depending on the decisionperspective of global planning. First, the planner can base the decision on private costs (PC),only. In this private objective function, the cost of using the production factor ‘waste’ (pW)
is assumed to be zero:
PC=∑
i ∈ {ic,dc}
∑j ∈ {Q,P,S,R,D}
piLLi
j + piKKi
j + piEEi
j (2)
Secondly, the global planner can internalise the external costs in the decision framework.In this case, the cost of non-recycled waste (pW) as denoted in Eq.(1) is not equal to zero.In this policy perspective the decision is based on the social costs rather than on the privatecosts.
EC =∑
i ∈ {ic,dc}
∑j ∈ {Q,P,S,R,D}
piWWi
j (3)
In the following, the basic relationships in the model are explained. The model is drivenby exogenous demand for a physical commodity in both regions, expressed in tonnes:
Di = Di for i = ic, dc (4)
In line with reality, the demand in developed countries exceeds the demand in developingcountries:
Dic > Ddc (5)
Because the number of households in both regions is equal, the per capita consumptionin industrialised countries exceeds the per capita demand in developing countries. As hasbeen shown in Eq.(12), this difference is relevant for the efficiency of the recovery sector(R), because this sector generates economies of scale.
The output of manufacturing (Q) satisfies the demand:
Di ≤ Qi for i = ic, dc (6)
4.1.1. Manufacturing segmentThis single product type can be manufactured from two types of materials (M): primary
and secondary materials (P and S). In addition, labour and capital are required for themanufacturing of the product. The quality ofS is inferior to the qualityP, i.e. manufacturinga certain amount of product with only one type of material requires more secondary material(S) than primary material (P). For example, in addition to filling materials the production of1 tonne of writing paper requires only 0.9 tonne of wood pulp. The same product based onrecycled materials requires 1.2 tonne of waste paper. Obviously, in reality also a combinationof waste paper and wood pulp can be used to produce paper. The quality indicator of materials(ε) denotes the efficiency difference of usingS versusP. The manufacturing process alsogenerates a certain amount of non-recyclable waste (Wq). The production function of themanufacturing process is defined as:
Qi = f iQ(Mi
Q, KiQ, Li
Q) for i ∈ {ic, dc}= f i
Q(Pi + Si/(1 + εi), KiQ, Li
Q)(7)
Secondary materials (ε) in industrialised countries have an equal or better quality thansecondary materials in developing countries.
εic ≤ εdc (8)
4.1.2. Production segmentIn the production segment of the MPC, primary and secondary materials are produced.
The production factors determine the production of primary materials. The stock of extractedresources available in the region (Ei) constrains the production of primary materials. Wasteof resources in the primary production process is indicated byτ. For example, for theproduction of one tonne of primary aluminium roughly 2.5 tonnes of bauxite are required.Therefore, 1.5 tonnes are lost as non-recyclable waste. The primary production processgenerates a certain amount of non-recyclable waste (Wp).
The production function of the primary materials is defined as:
Pi = f iP (Ei/(1 + τi), Ki
P , LiP ) for i ∈ {ic, dc} (9)
In general, developing countries are better endowed in natural resources than industri-alised countries. Therefore, the quality of primary resource materials in developing countriesis assumed to be higher than primary materials in industrialised countries:
τ ic > τdc (10)
The production of secondary materials (S) from recovered materials (R) is dependenton the quality of the recyclable waste. The lower the quality of the recyclable waste, thehigher is the efficiency loss during the secondary production process. This efficiency loss isindicated byϕ. The interpretation ofϕ is similar toτ. For example, industrial plastics wasteis generally more recyclable than household plastics waste because it is less contaminatedand more homogeneous. The secondary production process generates a certain amount ofnon-recyclable waste (Ws).
The production function of secondary material is defined as:
Si = f iS
(Ri
(1 + ϕi), KiS, Li
S
)for i ∈ {ic, dc} (11)
The secondary material efficiency losses in developing countries are larger than theefficiency losses in industrialised countries:
ϕdc > ϕic (12)
Producing 1 tonne of primary materials generates more non-recyclable waste than pro-ducing 1 tonne of secondary production:
WiP
Pi>
WiS
Sifor i ∈ {ic, dc} (13)
4.1.3. Waste management and recovery segmentIn the waste management and recovery segment, post-consumed products are converted
into recyclable waste (R) and into non-recyclable waste (W), which is landfilled or
incinerated. The processing of post-consumed products (D) into non-recyclable waste (W)requires ‘capital’ and ‘labour’.D andW are expressed in tonnes.
In the recovery process, recyclable waste (R) is retrieved from post-consumed products(D). In the recovery process the factors labour and capital are required. Economies of scaleapply to the recovery sector. The larger the demand per capita, the less production factor isrequired to recover one tonne of recyclable waste:
Ri = f iR(Di, Ki
R, LiR) for i ∈ {ic, dc} (14)
4.1.4. Material balance conditionsVarious material balance conditions can be derived. These conditions are expressed in
tonne. The material balance for the manufacturing process is defined as:
Qi = Pi + Si − WiQ for i ∈ {ic, dc} (15)
A fixed portion of material loss (WP) occurs during the primary production process:
WiP = Ei − Pi for i ∈ {ic, dc} (16)
A fixed portion of material loss (Ws) occurs during the secondary production process:
WiS = Ri − Si for i ∈ {ic, dc} (17)
The total amount of disposed waste (W) is the portion of consumption that is not recovered(D − R) and the non-recyclable waste generated by the primary and secondary materialssector (WP andWS) and the manufacturing sector (WQ). Although in reality a certain shareof the production and manufacturing waste is recyclable, these recyclable materials areassumed to be processed internally and therefore are not treated separately.
Wi = Di − Ri + WiP + Wi
S + WiQ for i ∈ {ic, dc} (18)
4.1.5. IndicatorsSeveral indicators present the results of the optimisation processes. The most important
indicators are the utilisation rate (ui) and the recovery rate (ri). The utilisation rate (ui) isthe share of secondary materials (S) used in the manufacturing of final products (Q):
ui = Si
Qifor i ∈ {ic, dc, world} (19)
The recovery rate (ri) is the amount of secondary materials recovered after consumption,(R) as a share of the final demand (D):
ri = Ri
Difor i ∈ {ic, dc, world} (20)
The optimal value of these indicators will be determined by solving the optimisationmodel. These values are between 0 and 1, as the maximum percentage that can be utilisedor recovered is 100%:
0 ≤ ui, ri ≤ 1 for i ∈ {ic, dc, world} (21)
In the following several model-based results are presented.
4.1.6. Result 1: sinks and sourcesSubstituting(6), and the material balance conditions(15)–(17)in (18)gives:
Wi = Di − Ri + Ei − Pi + Ri − Si + Pi + Si − Qi = Ei for i ∈ {ic, dc} (22)
This implies that in a closed economy the total amount of non-recycled waste is exactlyequal to the total amount of primary resources extracted in that region. In other words, whatgoes in must eventually come out. Note that this result crucially depends on the static natureof the model, not allowing for embodied materials in capital goods.
4.1.7. Result 2: the relation between the utilisation and the recovery rateSubstituting(6) and(17) in (19), it follows that:
ui = (Ri − WiS)
Difor i ∈ {ic, dc, world} (23)
and substituting(20) in (23)gives
ui = ri − WiS
Difor i ∈ {ic, dc} (24)
This implies that if the recycling sector is perfectly efficient (WS = 0) and the economyis closed, the utilisation rate (ui) equals the recovery rate (ri). In other words, in a closedeconomy discrepancy betweenui andri is fully determined by wastes in the recycling sector.The higherWS the less secondary materials are produced implying a lower utilisation rate.
4.1.8. Result 3: factor productivityEqs.(1)–(12), (14) and (22)imply optimisation of the following Lagrangian:
L =∑
i
∑j
(piLLi
j + piKKi
j) +∑
i
(piE + pi
W )Wi + λi
[f i
Q
⟨f i
p
{Wi
1 + τi, Ki
P , LiP
}
+ 1
1 + εif i
{1
1 + ϕif i(Di, Ki
R, LiR), Ki
S, LiS
}, Ki
Q, LiQ
⟩− Di
](25)
wherei ∈ ic, dc andj ∈ P, S, W, R, Q, with λi shadow prices of constraints.Based on(25), marginal conditions can be derived about optimal factor and production
levels within the autarkic MPC. From the condition:
∂L
∂FiQi
= 0 (26)
follows
piL
piK
= ∂f iQ/∂Li
Q
∂f iQ/∂Ki
Q
(27)
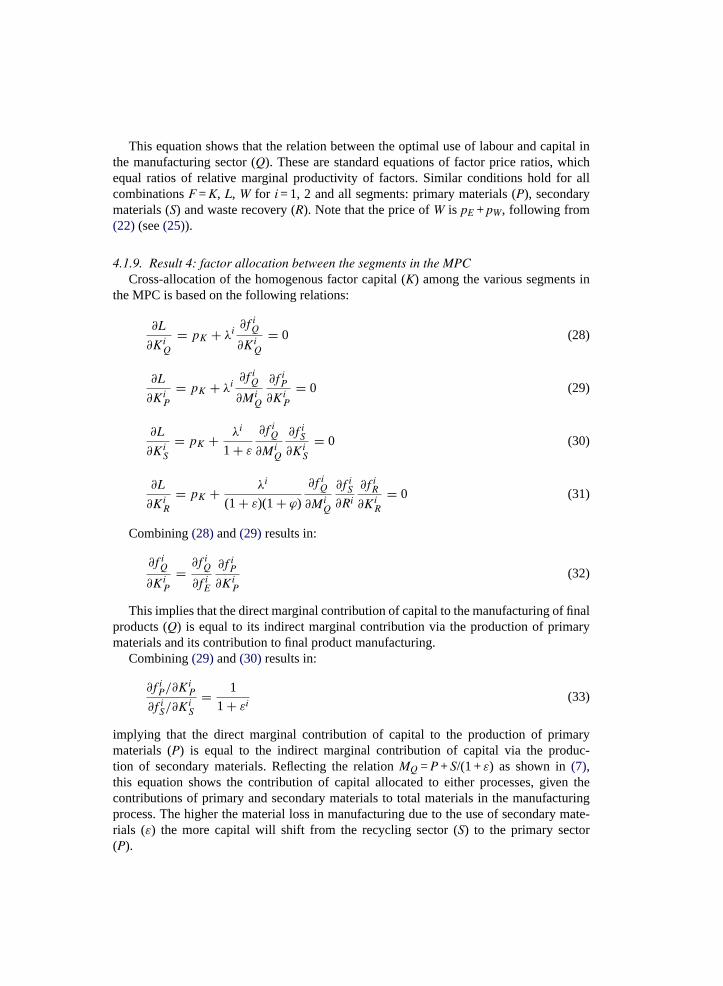
This equation shows that the relation between the optimal use of labour and capital inthe manufacturing sector (Q). These are standard equations of factor price ratios, whichequal ratios of relative marginal productivity of factors. Similar conditions hold for allcombinationsF = K, L, W for i = 1, 2 and all segments: primary materials (P), secondarymaterials (S) and waste recovery (R). Note that the price ofW is pE + pW, following from(22) (see(25)).
4.1.9. Result 4: factor allocation between the segments in the MPCCross-allocation of the homogenous factor capital (K) among the various segments in
the MPC is based on the following relations:
∂L
∂KiQ
= pK + λi∂f i
Q
∂KiQ
= 0 (28)
∂L
∂KiP
= pK + λi∂f i
Q
∂MiQ
∂f iP
∂KiP
= 0 (29)
∂L
∂KiS
= pK + λi
1 + ε
∂f iQ
∂MiQ
∂f iS
∂KiS
= 0 (30)
∂L
∂KiR
= pK + λi
(1 + ε)(1 + ϕ)
∂f iQ
∂MiQ
∂f iS
∂Ri
∂f iR
∂KiR
= 0 (31)
Combining(28)and(29) results in:
∂f iQ
∂KiP
= ∂f iQ
∂f iE
∂f iP
∂KiP
(32)
This implies that the direct marginal contribution of capital to the manufacturing of finalproducts (Q) is equal to its indirect marginal contribution via the production of primarymaterials and its contribution to final product manufacturing.
Combining(29)and(30) results in:
∂f iP/∂Ki
P
∂f iS/∂Ki
S
= 1
1 + εi(33)
implying that the direct marginal contribution of capital to the production of primarymaterials (P) is equal to the indirect marginal contribution of capital via the produc-tion of secondary materials. Reflecting the relationMQ = P + S/(1 +ε) as shown in(7),this equation shows the contribution of capital allocated to either processes, given thecontributions of primary and secondary materials to total materials in the manufacturingprocess. The higher the material loss in manufacturing due to the use of secondary mate-rials (ε) the more capital will shift from the recycling sector (S) to the primary sector(P).
Combining(28)and(30) results in:
∂f iS
∂KiS
= 1
1 + ϕi
∂f iS
∂Ri
∂f iR
∂KiR
(34)
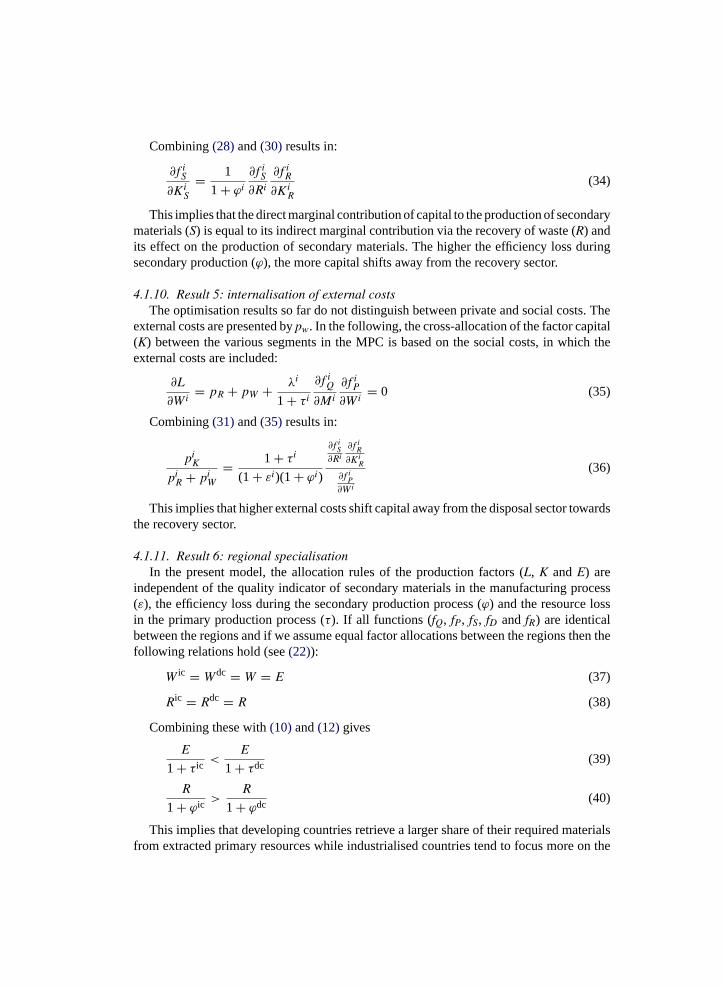
This implies that the direct marginal contribution of capital to the production of secondarymaterials (S) is equal to its indirect marginal contribution via the recovery of waste (R) andits effect on the production of secondary materials. The higher the efficiency loss duringsecondary production (ϕ), the more capital shifts away from the recovery sector.
4.1.10. Result 5: internalisation of external costsThe optimisation results so far do not distinguish between private and social costs. The
external costs are presented bypw. In the following, the cross-allocation of the factor capital(K) between the various segments in the MPC is based on the social costs, in which theexternal costs are included:
∂L
∂Wi= pR + pW + λi
1 + τi
∂f iQ
∂Mi
∂f iP
∂Wi= 0 (35)
Combining(31)and(35) results in:
piK
piR + pi
W
= 1 + τi
(1 + εi)(1 + ϕi)
∂f iS
∂Ri
∂f iR
∂KiR
∂f iP
∂Wi
(36)
This implies that higher external costs shift capital away from the disposal sector towardsthe recovery sector.
4.1.11. Result 6: regional specialisationIn the present model, the allocation rules of the production factors (L, K and E) are
independent of the quality indicator of secondary materials in the manufacturing process(ε), the efficiency loss during the secondary production process (ϕ) and the resource lossin the primary production process (τ). If all functions (fQ, fP, fS, fD and fR) are identicalbetween the regions and if we assume equal factor allocations between the regions then thefollowing relations hold (see(22)):
W ic = Wdc = W = E (37)
Ric = Rdc = R (38)
Combining these with(10)and(12)gives
E
1 + τ ic <E
1 + τdc (39)
R
1 + ϕic >R
1 + ϕdc (40)
This implies that developing countries retrieve a larger share of their required materialsfrom extracted primary resources while industrialised countries tend to focus more on the
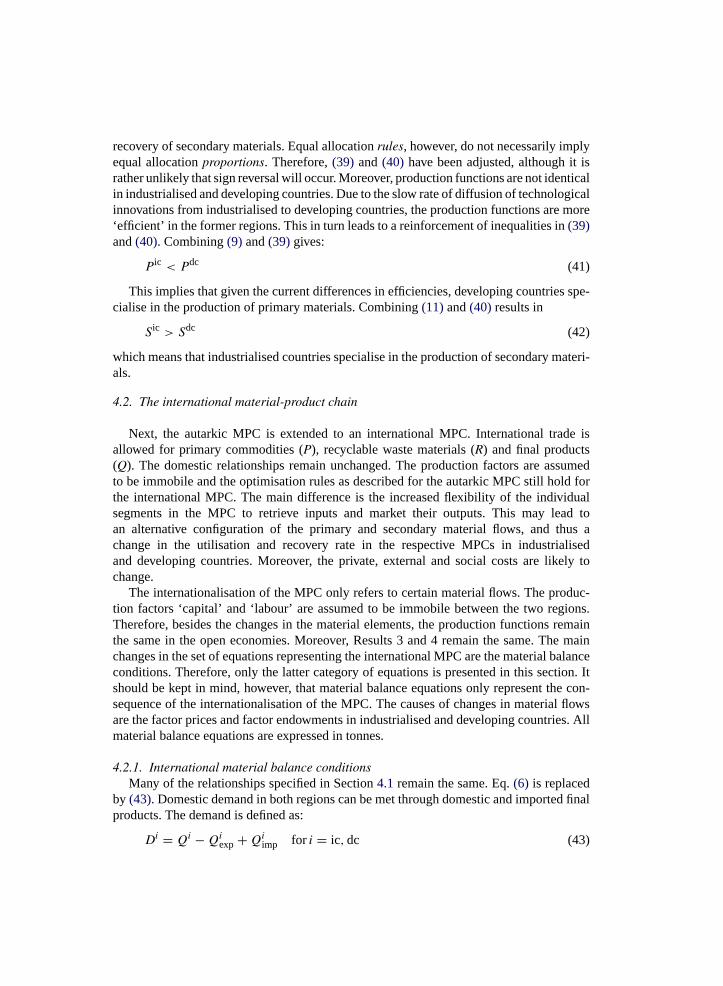
recovery of secondary materials. Equal allocationrules, however, do not necessarily implyequal allocationproportions. Therefore,(39) and(40) have been adjusted, although it israther unlikely that sign reversal will occur. Moreover, production functions are not identicalin industrialised and developing countries. Due to the slow rate of diffusion of technologicalinnovations from industrialised to developing countries, the production functions are more‘efficient’ in the former regions. This in turn leads to a reinforcement of inequalities in(39)and(40). Combining(9) and(39)gives:
P ic < Pdc (41)
This implies that given the current differences in efficiencies, developing countries spe-cialise in the production of primary materials. Combining(11)and(40) results in
S ic > Sdc (42)
which means that industrialised countries specialise in the production of secondary materi-als.
4.2. The international material-product chain
Next, the autarkic MPC is extended to an international MPC. International trade isallowed for primary commodities (P), recyclable waste materials (R) and final products(Q). The domestic relationships remain unchanged. The production factors are assumedto be immobile and the optimisation rules as described for the autarkic MPC still hold forthe international MPC. The main difference is the increased flexibility of the individualsegments in the MPC to retrieve inputs and market their outputs. This may lead toan alternative configuration of the primary and secondary material flows, and thus achange in the utilisation and recovery rate in the respective MPCs in industrialisedand developing countries. Moreover, the private, external and social costs are likely tochange.
The internationalisation of the MPC only refers to certain material flows. The produc-tion factors ‘capital’ and ‘labour’ are assumed to be immobile between the two regions.Therefore, besides the changes in the material elements, the production functions remainthe same in the open economies. Moreover, Results 3 and 4 remain the same. The mainchanges in the set of equations representing the international MPC are the material balanceconditions. Therefore, only the latter category of equations is presented in this section. Itshould be kept in mind, however, that material balance equations only represent the con-sequence of the internationalisation of the MPC. The causes of changes in material flowsare the factor prices and factor endowments in industrialised and developing countries. Allmaterial balance equations are expressed in tonnes.
4.2.1. International material balance conditionsMany of the relationships specified in Section4.1 remain the same. Eq.(6) is replaced
by (43). Domestic demand in both regions can be met through domestic and imported finalproducts. The demand is defined as:
Di = Qi − Qiexp + Qi
imp for i = ic, dc (43)
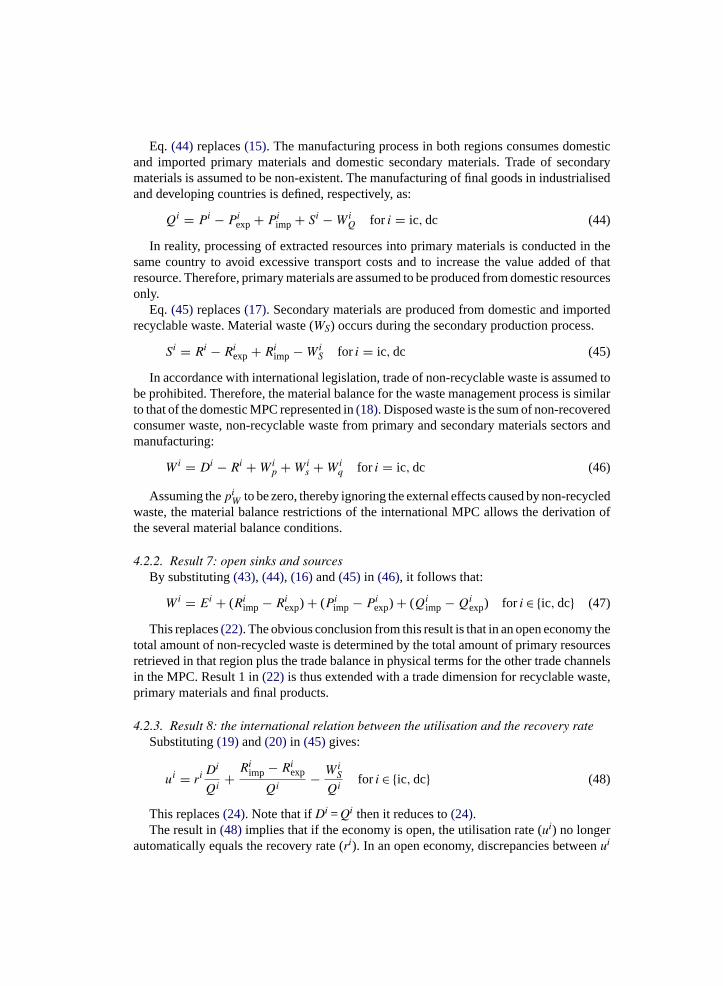
Eq. (44) replaces(15). The manufacturing process in both regions consumes domesticand imported primary materials and domestic secondary materials. Trade of secondarymaterials is assumed to be non-existent. The manufacturing of final goods in industrialisedand developing countries is defined, respectively, as:
Qi = Pi − Piexp + Pi
imp + Si − WiQ for i = ic, dc (44)
In reality, processing of extracted resources into primary materials is conducted in thesame country to avoid excessive transport costs and to increase the value added of thatresource. Therefore, primary materials are assumed to be produced from domestic resourcesonly.
Eq. (45) replaces(17). Secondary materials are produced from domestic and importedrecyclable waste. Material waste (WS) occurs during the secondary production process.
Si = Ri − Riexp + Ri
imp − WiS for i = ic, dc (45)
In accordance with international legislation, trade of non-recyclable waste is assumed tobe prohibited. Therefore, the material balance for the waste management process is similarto that of the domestic MPC represented in(18). Disposed waste is the sum of non-recoveredconsumer waste, non-recyclable waste from primary and secondary materials sectors andmanufacturing:
Wi = Di − Ri + Wip + Wi
s + Wiq for i = ic, dc (46)
Assuming thepiW to be zero, thereby ignoring the external effects caused by non-recycled
waste, the material balance restrictions of the international MPC allows the derivation ofthe several material balance conditions.
4.2.2. Result 7: open sinks and sourcesBy substituting(43), (44), (16)and(45) in (46), it follows that:
Wi = Ei + (Riimp − Ri
exp) + (Piimp − Pi
exp) + (Qiimp − Qi
exp) for i ∈ {ic, dc} (47)
This replaces(22). The obvious conclusion from this result is that in an open economy thetotal amount of non-recycled waste is determined by the total amount of primary resourcesretrieved in that region plus the trade balance in physical terms for the other trade channelsin the MPC. Result 1 in(22) is thus extended with a trade dimension for recyclable waste,primary materials and final products.
4.2.3. Result 8: the international relation between the utilisation and the recovery rateSubstituting(19)and(20) in (45)gives:
ui = ri Di
Qi+ Ri
imp − Riexp
Qi− Wi
S
Qifor i ∈ {ic, dc} (48)
This replaces(24). Note that ifDi = Qi then it reduces to(24).The result in(48) implies that if the economy is open, the utilisation rate (ui) no longer
automatically equals the recovery rate (ri). In an open economy, discrepancies betweenui
andri are determined by (1) the trade balance of the final products (D/Q); (2) the tradebalance of recyclable waste (Rimp − Rexp); (3) the inefficiencies in the domestic recyclingindustry (Ws). The more a country is characterised as a net-importer of final products(D > Q), the more likely it is that the utilisation rate exceeds the recovery rate (u > r).Likewise, the more a country is characterised as a net-importer of recyclable waste, themore likely it is that the utilisation rate exceeds the recovery rate (u > r). Finally, the moreinefficient the recycling sector is in processing secondary materials from recyclable waste,the fewer secondary materials become available for utilisation in final production. Therefore,in countries with large inefficiencies in the recycling industry (Ws), the recovery rate tendsto exceed the utilisation rate (r > u).
4.2.4. Result 9: factor productivity and allocation in an open economyIf we substitute(47)in (25)then solving gives the conditions for an optimum in the open
economy with trade. Results(26)–(36)remain the same. In addition, we have:
∂f iQ
∂Piexp
= ∂f iQ
∂Piimp
(49)
∂f iS
∂Riexp
= ∂f iS
∂Riimp
(50)
Eq. (49) means that in the optimum the marginal effect of primary imports and exportson manufacturing output need to be equal. Similarly,(50) states that in the optimum themarginal effect of imports and exports of recovered materials on the output of secondarymaterials production needs to be equal. These conditions restrict the flows of imports andexports of primary and secondary materials across countries.
4.2.5. Result 10: internalisation of external costs in an open economyAdditional results are based on∂L/∂X = 0 for X = Ri
imp, Riexp, P
iimp, P
iexp, Q
iimp, Q
iexp
cf. (36), one set of additional conditions is of the form:
piK
piE + pi
W
= 1 + τi
(1 + εi)(1 + ϕi)
∂f iS
∂Ri
∂f iR
∂KiR
∂f iP
∂E∂E∂X
(51)
with X taking values as indicated above. Here,∂E/∂X = 1 for X = Wi, Riimp, P
iimp, Q
iimp
and ∂E/∂X =−1 for X = Riexp, P
iexp, Q
iexp. This implies that higher external costs asso-
ciated with waste shift capital away from disposal to recovery. In addition, it showsthat such higher external costs stimulate exports of waste, manufactured output and pri-mary resources, while they have a negative impact on imports of these. This relationshipcan is clearly visible in the waste market in industrialised countries. Higher externalcosts of solid waste have led to increased waste recovery and expansion of the wasteexports.
5. Discussions and conclusions
International recycling has rather specific economic and environmental features andtherefore is a complex activity to analyse. A review of characteristics of available modelshas been conducted to gain insight into the variety of elements that are potentially relevantin analysing international recycling. The main boundaries and model elements used in recy-cling models, such as objectives, systems, space and time, have been analysed. The reviewof recycling studies indicated that particularly the international linkages between recyclingsystems are often ignored. Given the current globalisation of the recycling market, analysingrecycling in a closed context (a city, a region or a country) becomes increasingly invalid.Therefore, there is a need for modelling the international MPC, allowing for internationalinteraction between various stages in the life cycle.
We developed a formal model of the international material-product chain (MPC) that rep-resents the basic principles of international recycling. These principles include that the mostrelevant forward and backward linkages are incorporated in the analysis, that internationaltrade is incorporated in various parts of the MPC, and that the most fundamental economic,environmental, institutional, dynamic and international elements that affect recycling areaccounted for.
The model includes and links the MPCs of developed and developing countries thatexchange material commodities, final products and recyclable waste. Various conclusionscan be drawn from the model. First, as indicated in Result 1, the amount of non-recyclablewaste, which represents environmental externalities of the MPC, equals the resource extrac-tion in a closed economy. Increasing the internal efficiency of the processes in the autarkicMPC can minimise this flow.
Secondly, Result 5 demonstrates that taking into account environmental externalities inthe process of minimising social costs results in higher levels of recycling. This result isconfirmed by empirical studies that show that countries that apply high charges on wastedisposal achieve especially high recycling levels (Johnstone, 1998; Van Beukering andBouman, 2001).
Thirdly, as shown in Results 6 and 8, international recycling is mainly driven byregional differences in the quantity and quality of the factor endowment and economicefficiency. Results 9 and 10 add conditions to restrict the flows of imports and exportsof primary and secondary materials across countries so as to arrive at an internationalsocial welfare optimum. These conditions are derived from the regular factor equalisationrequirements and can be interpreted as international factor allocation rules. They lead toa deviation between waste recovery and utilisation in both regions, which due to Result10 increases with the magnitude of the externalities associated with waste dumping.Assuming that industrialised countries are relatively well endowed with recyclable wasteand negative external costs are effectively internalised, the recovery rate is likely to exceedthe utilisation rate. In developing countries, the opposite pattern is likely to occur. Thisshift in trade pattern of recyclable materials suggested by our model analysis, namelyas moving from developed to developing countries, is consistent with the findings of anumber of empirical studies (Grace et al., 1978; Sharma et al., 1997; Johnstone, 1998;Van Beukering and Bouman, 2001; Duraiappah et al., 2002). Moreover, the fact thatthese studies cover a range of materials (paper, plastics, lead, non-ferrous metal) and
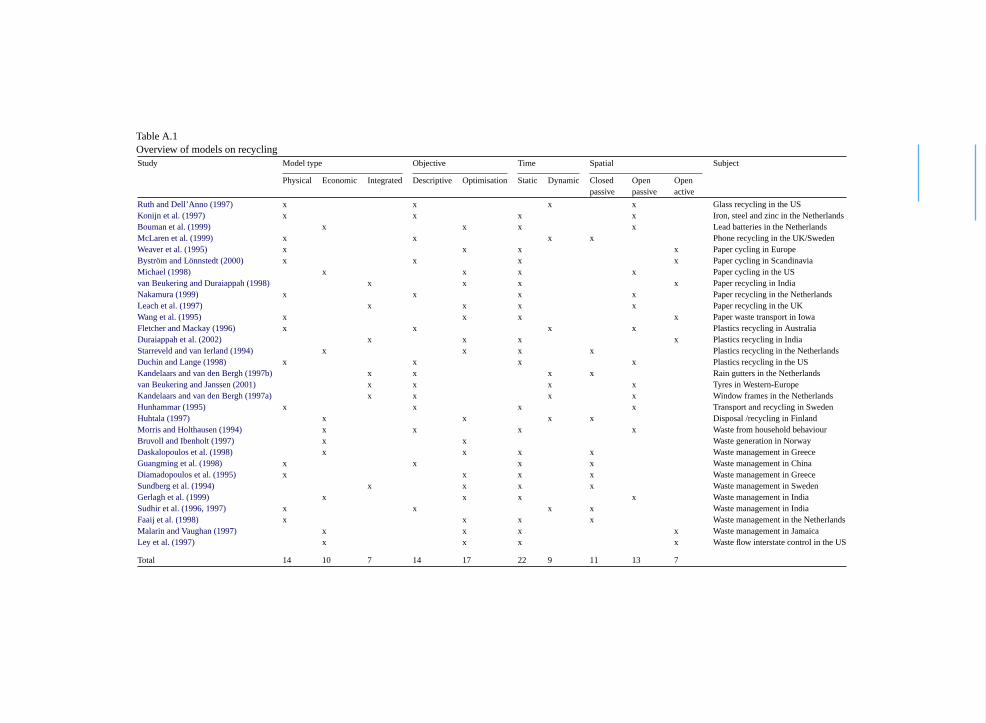
Table A.1Overview of models on recyclingStudy Model type Objective Time Spatial Subject
Physical Economic Integrated Descriptive Optimisation Static Dynamic Closedpassive
Openpassive
Openactive
Ruth and Dell’Anno (1997) x x x x Glass recycling in the USKonijn et al. (1997) x x x x Iron, steel and zinc in the NetherlandsBouman et al. (1999) x x x x Lead batteries in the NetherlandsMcLaren et al. (1999) x x x x Phone recycling in the UK/SwedenWeaver et al. (1995) x x x x Paper cycling in EuropeBystrom and Lonnstedt (2000) x x x x Paper cycling in ScandinaviaMichael (1998) x x x x Paper cycling in the USvan Beukering and Duraiappah (1998) x x x x Paper recycling in IndiaNakamura (1999) x x x x Paper recycling in the NetherlandsLeach et al. (1997) x x x x Paper recycling in the UKWang et al. (1995) x x x x Paper waste transport in IowaFletcher and Mackay (1996) x x x x Plastics recycling in AustraliaDuraiappah et al. (2002) x x x x Plastics recycling in IndiaStarreveld and van Ierland (1994) x x x x Plastics recycling in the NetherlandsDuchin and Lange (1998) x x x x Plastics recycling in the USKandelaars and van den Bergh (1997b) x x x x Rain gutters in the Netherlandsvan Beukering and Janssen (2001) x x x x Tyres in Western-EuropeKandelaars and van den Bergh (1997a) x x x x Window frames in the NetherlandsHunhammar (1995) x x x x Transport and recycling in SwedenHuhtala (1997) x x x x Disposal /recycling in FinlandMorris and Holthausen (1994) x x x x Waste from household behaviourBruvoll and Ibenholt (1997) x x Waste generation in NorwayDaskalopoulos et al. (1998) x x x x Waste management in GreeceGuangming et al. (1998) x x x x Waste management in ChinaDiamadopoulos et al. (1995) x x x x Waste management in GreeceSundberg et al. (1994) x x x x Waste management in SwedenGerlagh et al. (1999) x x x x Waste management in IndiaSudhir et al. (1996, 1997) x x x x Waste management in IndiaFaaij et al. (1998) x x x x Waste management in the NetherlandsMalarin and Vaughan (1997) x x x x Waste management in JamaicaLey et al. (1997) x x x x Waste flow interstate control in the US
Total 14 10 7 14 17 22 9 11 13 7
countries (India, China, Europe) can be considered as supportive of the robustness of ourresults.
Appendix A. Empirical studies of recycling
Table A.1.
References
Anderson CL. The production process: inputs and wastes. J Environ Econ Manage 1987;14:1–12.Bartone C. Economic and policy issues in resource recovery from municipal wastes. Resour Conserv Recycl
1990;4:7–23.Boguski TK, Hunt RG, Franklin WE. General mathematical models for LCI recycling. Resour Conserv Recycl
1994;12:147–63.Bouman M, Heijungs R, van der Voet E, van den Bergh JCJM, Huppes G. Materials flows and economic models:
an analytical comparison of SFA, LCA and partial equilibrium models. Ecol Econ 1999;32:195–216.Bower B. Economic dimensions of waste recycling and re-use: some definitions, facts and issues. In: Pearce DW,
Walter I, editors. Resource conservation: social and economic dimensions of recycling. London: LongmanGroup Limited; 1977. p. 1–22.
Bruvoll A, Ibenholt K. Future waste generation Forecasts on the basis of a macroeconomic model. Resour ConservRecycl 1997;19:137–49.
Butlin JA. The prices of secondary materials and recycling by effort. In: Pearce DW, Walter I, editors. Resourceconservation: social and economic dimensions of recycling. New York: New York University Press; 1977. p.207–30.
Bystrom S, Lonnstedt L. Paper recycling: a discussion of methodological approaches. Resour Conserv Recycl2000;28:55–65.
Chang NB, Lin YT. An analysis of recycling impacts on solid waste generation by time series interventionmodeling. Resour Conserv Recycl 1997;19(3):165–86.
Conn WD. Pearce DW, Walter I, editors. Consumer product life extension in the context of materials and energyflows; 1977, 127–144.
Dasgupta S, Mody A, Roy S, Wheeler DR. Citizen complaints as environmental indicators: evidence from China.Policy Research Department Working Paper 1704. Washington DC: World Bank; 1996.
Daskalopoulos E, Badr O, Probert SD. An integrated approach to municipal solid waste management. ResourConserv Recycl 1998;24:33–50.
Diamadopoulos E, Koutsantonakis Y, Zaglara V. Optimal design of municipal solid waste recycling systems.Resour Conserv Recycl 1995;14:21–34.
Dinan TM. Economic efficiency effects of alternative policies for reducing waste disposal. J Environ Econ Manage1993;25:242–56.
Duchin F, Lange G-M. Prospects for the recycling of plastics in the United States. Struct Change Econ Dyn1998;9:307–31.
Duraiappah A, Xin Z, Beukering, van PJH. The plastics sector in China: issues in production, recycling andinternational trade. Environ Dev Econ 2002;7(1):47–74.
Eder P, Narodoslawsky M. What environmental pressures are a region’s industries responsible for? A method ofanalysis with descriptive indices and input–output models. Ecol Econ 1999;29:359–74.
Faaij A, Hekkert M, Worrell E, Wijk AV. Optimisation of the final waste treatment system in the Netherlands.Resour Conserv Recycl 1998;22:47–82.
Finnveden G. Methodological aspects of life cycle assessment of integrated solid waste management systems.Resour Conserv Recycl 1999;26:173–87.
Fletcher BL, Mackay ME. A model of plastics recycling: does recycling reduce the amount of waste? ResourConserv Recycl 1996;17:141–51.
Fullerton D, Kinnaman TC. Garbage, recycling, and illicit burning or dumping. J Environ Econ Manage1995;29:78–91.
Gerlagh R, van Beukering PJH, Verma M, Yadav PP, Pandey P. Integrated Modelling of Solid Waste in Bangalore.CREED Working Paper 26. London; 1999.
Godbey G. No time to waste: time use and the generation of residential solid waste. PSWP Working Paper 4.Connecticut: School of Forestry and Environmental Studies, Yale University; 1996.
Grace R, Turner RK, Walter I. Secondary materials and international trade. J Environ Econ Manage 1978;5:172–86.Guangming Z, Xingzhong Y, Panyue Z, Yuexiong T, Zhenglin Z, Shunsheng Q, Chunping, Y.
Environmental–economic input–output analysis in China: the environmental input–output model and its anal-ysis, with a focus on the solid waste management sectors in Changsha 1998.
Hoekstra R, Janssen MA. Environmental responsibility and policy in a two country dynamic input–output model.Discussion Paper TI 2002-103/3. Amsterdam/Rotterdam: Tinbergen Institute; 2002.
Hong SMR, Adams RM, Love HA. An economic analysis of household recycling of solid wastes: the case ofPortlans, Oregon. J Environ Plann Manage 1993;25:139–46.
Huhtala AA. Post-consumer waste management model for determining optimal levels of recycling and landfilling.Environ Resour Econ 1997;10:301–14.
Hunhammar S. Cycling residues: potential for increased transportation demands due to recycling of materials inSweden. Resour Conserv Recycl 1995;15:21–31.
Johnstone N. The implications of the Basel convention for developing countries: the case of trade in non-ferrousmetal bearing waste. Resour Conserv Recycl 1998;23:1–28.
Jenkins RR, Martinez SA, Palmer K, Podolsky MJ. The determinants of household recycling: a material specificanalysis on unit pricing and recycling program attributes. RFF Discussion Paper. Washington, DC: Resourcesfor the future; 1999.
Kandelaars PPAAH, van den Bergh JCJM. Materials-product chains: theory and application to zinc and PVCgutters. Environ Resour Econ 1997a;24(4):345–71.
Kandelaars PPAAH, van den Bergh JCJM. Dynamic Analysis of materials-product chains: an application towindow frames. Ecol Econ 1997b;22:41–61.
Kandelaars PPAAH, van Dam JD. An analysis of variables influencing the material composition of automobiles.Resour Conserv Recycl 1998;24:323–33.
Kishino H, Hanyu K, Yamashita M, Hayashi C. Recycling and consumption in Germany and Japan: a case of toiletpaper. Resour Conserv Recycl 1999;26:189–215.
Konijn P, de Boer S, van Dalen J. Input–output analysis of material flows with application to iron and steel. StructChange Econ Dyn 1997;8:129–53.
Leach MA, Bauen A, Lucas NJD. A systems approach to materials flow in sustainable cities: a case study of paper.J Environ Plann Manage 1997;40:705–23.
Ley E, Macauley MK, Salant SW. Spatially and intertemporally efficient waste management: the costs of interstateflow control. FEDEA Madrid; 1997.
Lusky R. Optimal taxation policies for conservation and recycling. J Econ Theory 1975;11:315–28.Malarin H, Vaughan WJ. An approach to the economic analysis of solid waste disposal alternatives. Washington
DC: IADB; 1997.Mani M, Wheeler DR. In search of pollution havens? Dirty industry in the world economy, 1960–1995. J Environ
Dev 1998;7(3):215–47.McLaren J, Wright L, Parkinson S, Jackson T. A dynamic life-cycle energy model of mobile phone take-back and
recycling. J Ind Ecol 1999;3(1):77–91.Michael JA. Recycling, international trade, and the distribution of pollution: the effect of increased U.S. paper
recycling on U.S. import demand for Canadian paper. J Agric Appl Econ 1998;30(1):217–23.Morris DM, Holthausen Jr DM. The economics of household solid waste generation and disposal. J Environ Econ
Manage 1994;26:215–34.Nakamura S. An interindustry approach to analysing economic and environmental effects of recycling of waste.
Ecol Econ 1999;28:133–45.
Navaretti GB, Soloaga I, Takacs W. When vintage technology makes sense: matching imports to skills. PolicyResearch Paper. Washington DC: World Bank; 1923.
Palmer K, Sigman H, Walls M. The cost of reducing municipal solid waste. J Environ Econ Manage1997;33:128–50.
Pearce DW, Grace R. Stabilising secondary materials markets. Resour Policy 1976;3:118–27.Pei F, Tilton JE. Consumer preferences, technological change, and the short-run income elasticity of metal demand.
Resour Policy 1999;25:87–109.Ruth M, Dell’Anno P. An industrial ecology of the US glass industry. Resour Policy 1997;23:109–24.Rosendorfova Monika, Vybochova Ivana, van Beukering PJH. Waste management and recycling of tyres in Europe,
R98/13. Amsterdam: Institute for Environmental Studies; 1998.Sirkin T, Ten Houten M. Resource cascading and the cascade chain; tool for appropriate and sustainable product
design. IVAM Research Report 71. Amsterdam; 1993.Starreveld PF, van Ierland EC. Recycling of plastics: a material balance optimisation model. Environ Resour Econ
1994;4:251–64.Sharma VK, van Beukering PJH, Nag B. Environmental and economic policy analysis of waste paper trade and
recycling in India. Resour Conserv Recycl 1997;21:55–70.Sudhir V, Srinivasan G, Muraleedharan R. Planning for sustainable solid waste management in urban India. Syst
Dyn Rev 1997;13:223–46.Sudhir V, Muraleedharan R, Srinivasan G. Integrated solid waste management in urban India: a critical operational
research framework. Socio-Econ Plann Sci 1996;30:163–81.Sundberg J, Gipperth P, Wene CO. A systems approach to municipal solid waste management: A pilot study of
Goteborg. Waste Manage Res 1994;12:73–91.Socolow RH, Thomas VM. The industrial ecology of lead and electric vehicles. In: Vellinga P, Gupta J, Berkhout
F, editors. Managing a material world. Dordrecht: Kluwer Academic Press; 1998. p. 191–215.van Beukering PJH. Waste recovery in Bombay: a socio-economic and environmental assessment of different
waste management options. Third World Plann Rev 1997;19(2):163–87.van Beukering PJH, Duraiappah A. The economic and environmental impact of wastepaper trade and recycling
in India: a material balance approach. J Ind Ecol 1998;2(2):23–42.van Beukering PJH, Janssen MA. A dynamic integrated analysis of truck tires in Western Europe. J Ind Eco
2001;4(2):93–115.van Beukering PJH. Recycling, international trade and recycling: an empirical analysis. Dordrecht: Kluwer Aca-
demic Publishers; 2001, 225 pp.van Beukering PJH, Bouman MA. Empirical evidence on recycling and trade of paper and lead in developed and
developing countries. World Dev 2001;29(10):1717–39.van den Bergh JCJM, Janssen MA, editors. Economics of industrial ecology: materials, structural change and
spatial scales. Cambridge, MA: The MIT Press; 2004.van den Bergh JCJM, Nijkamp P. Dynamic macro modelling and materials balance. Econ Model 1994;11:283–307.Wang C, Even JC, Adams SK. A mixed-integer linear model for optimal processing and transport of secondary
materials. Resour Conserv Recycl 1995;15:65–78.Weaver PM, Gabel HL, Bloemhof-Ruwaard JM, van Wassenhove LN. Optimising environmental product life
cycles: a case study of the European pulp and paper sector. Fontainebleau: 95/29/EPS/TM, INSEAD; 1995.Yohe GW. Secondary materials and international trade: a comment on the domestic market. J Environ Econ Manage
1979;6:199–203.
Related Documents